 Yuanchen Ma1†Jieying Chen1†Tao Wang1Liting Zhang1Xinhao Xu2Yuxuan Qiu2
 Andy Peng Xiang1
 Weijun Huang1*
- 1Center for Stem Cell Biology and Tissue Engineering, Key Laboratory for Stem Cells and Tissue Engineering, Ministry of Education, Sun Yat-sen University, Guangzhou, China
- 2Zhongshan School of Medicine, Sun Yat-sen University, Guangzhou, China
Heterogeneity and limited comprehension of chronic autoimmune disease pathophysiology cause accurate diagnosis a challenging process. With the increasing resources of single-cell sequencing data, a reasonable way could be found to address this issue. In our study, with the use of large-scale public single-cell RNA sequencing (scRNA-seq) data, analysis of dataset integration (3.1 × 10⁵ PBMCs from fifteen SLE patients and eight healthy donors) and cellular cross talking (3.8 × 10⁵ PBMCs from twenty-eight SLE patients and eight healthy donors) were performed to identify the most crucial information characterizing SLE. Our findings revealed that the interactions among the PBMC subpopulations of SLE patients may be weakened under the inflammatory microenvironment, which could result in abnormal emergences or variations in signaling patterns within PBMCs. In particular, the alterations of B cells and monocytes may be the most significant findings. Utilizing this powerful information, an efficient mathematical model of unbiased random forest machine learning was established to distinguish SLE patients from healthy donors via not only scRNA-seq data but also bulk RNA-seq data. Surprisingly, our mathematical model could also accurately identify patients with rheumatoid arthritis and multiple sclerosis, not just SLE, via bulk RNA-seq data (derived from 688 samples). Since the variations in PBMCs should predate the clinical manifestations of these diseases, our machine learning model may be feasible to develop into an efficient tool for accurate diagnosis of chronic autoimmune diseases.
Introduction
Systemic lupus erythematosus (SLE), multiple sclerosis (MS), and rheumatoid arthritis (RA) are all chronic autoimmune diseases associated with progressive widespread organ damage (1–3). The course of these three diseases is typically progressive with intermittent remission (4, 5). It is generally accepted that early treatment could increase the remission probability of these diseases and improve their prognosis (6, 7). If appropriate treatment is not given in a timely manner, these diseases may progress, causing work disability and life quality reduction for patients. Furthermore, such progression would lead to enormous financial burdens to the patients, their families, and society (8–10). Hence, it is crucial to develop an efficient method of accurate diagnosis to enable early intervention for these diseases.
Unfortunately, it seems that diagnosing SLE, MS, and RA may still be a challenging process that relies on a set of criteria (11–13), including clinical manifestations, functional outcomes, and serological and radiological evidence, that have to be met to make an accurate diagnosis (14, 15). Under non-specific and insensitive criteria, the misdiagnosis and underdiagnosis of these diseases are relatively common (16). The average time from symptom onset to diagnosis confirmation was approximately two years (17). This may cause patients to miss the optimal time for treatment. To break the bottleneck of early diagnosis, many studies have focused on biomarker detection to develop an accurate diagnostic criterion (18–21). However, the results were unsatisfying, owing to the tremendous heterogeneity of these diseases and limited comprehension of the disease pathophysiology (22).
In detail, although it is well known that the loss of immune tolerance and persistent release of autoantibodies are the two important bases for the pathophysiology of chronic autoimmune disease (23, 24), most studies have focused on investigating the contribution of certain cellular or molecular mechanisms rather than comprehensively and systematically illustrating the pathogenesis. This might be due to the limitation of methods or means. With the development of single-cell sequencing technology, the increased resources of data, and the improvement of bioinformatic tools (e.g., Seurat, SHARP, CellChat, etc.) (25–27), these would together help us to comprehend the pathophysiology of these diseases, thus their crucial features would be efficient for being mined. For example, Nehar-Belaid et al. thoroughly analyzed the major cell types among peripheral blood mononuclear cells and revealed an expanded subpopulation that has a specific interferon-stimulated gene (ISG) expression pattern in SLE patients (28). Meena Subramaniam et al. also found that monocytes from SLE patients highly expressed ISGs (29). Both of these studies comprehensively illuminated the cytological changes of SLEs.
According to these public single-cell RNA sequencing (scRNA-seq) data of SLE, we seek for a feasible way for SLE accurate diagnosis. Firstly, integration and cellular cross-talking analysis were performed to obtain the powerful information labeling the disease. This information was then combined with an unbiased random forestry machine learning algorithm which rendered an efficient mathematical model for SLE diagnosis. The accuracy of the mathematical model to identify patients with RA and MS was also validated. Furthermore, the diagnostic precision of our model was evaluated using an independent SLE cohort (Figure 1).
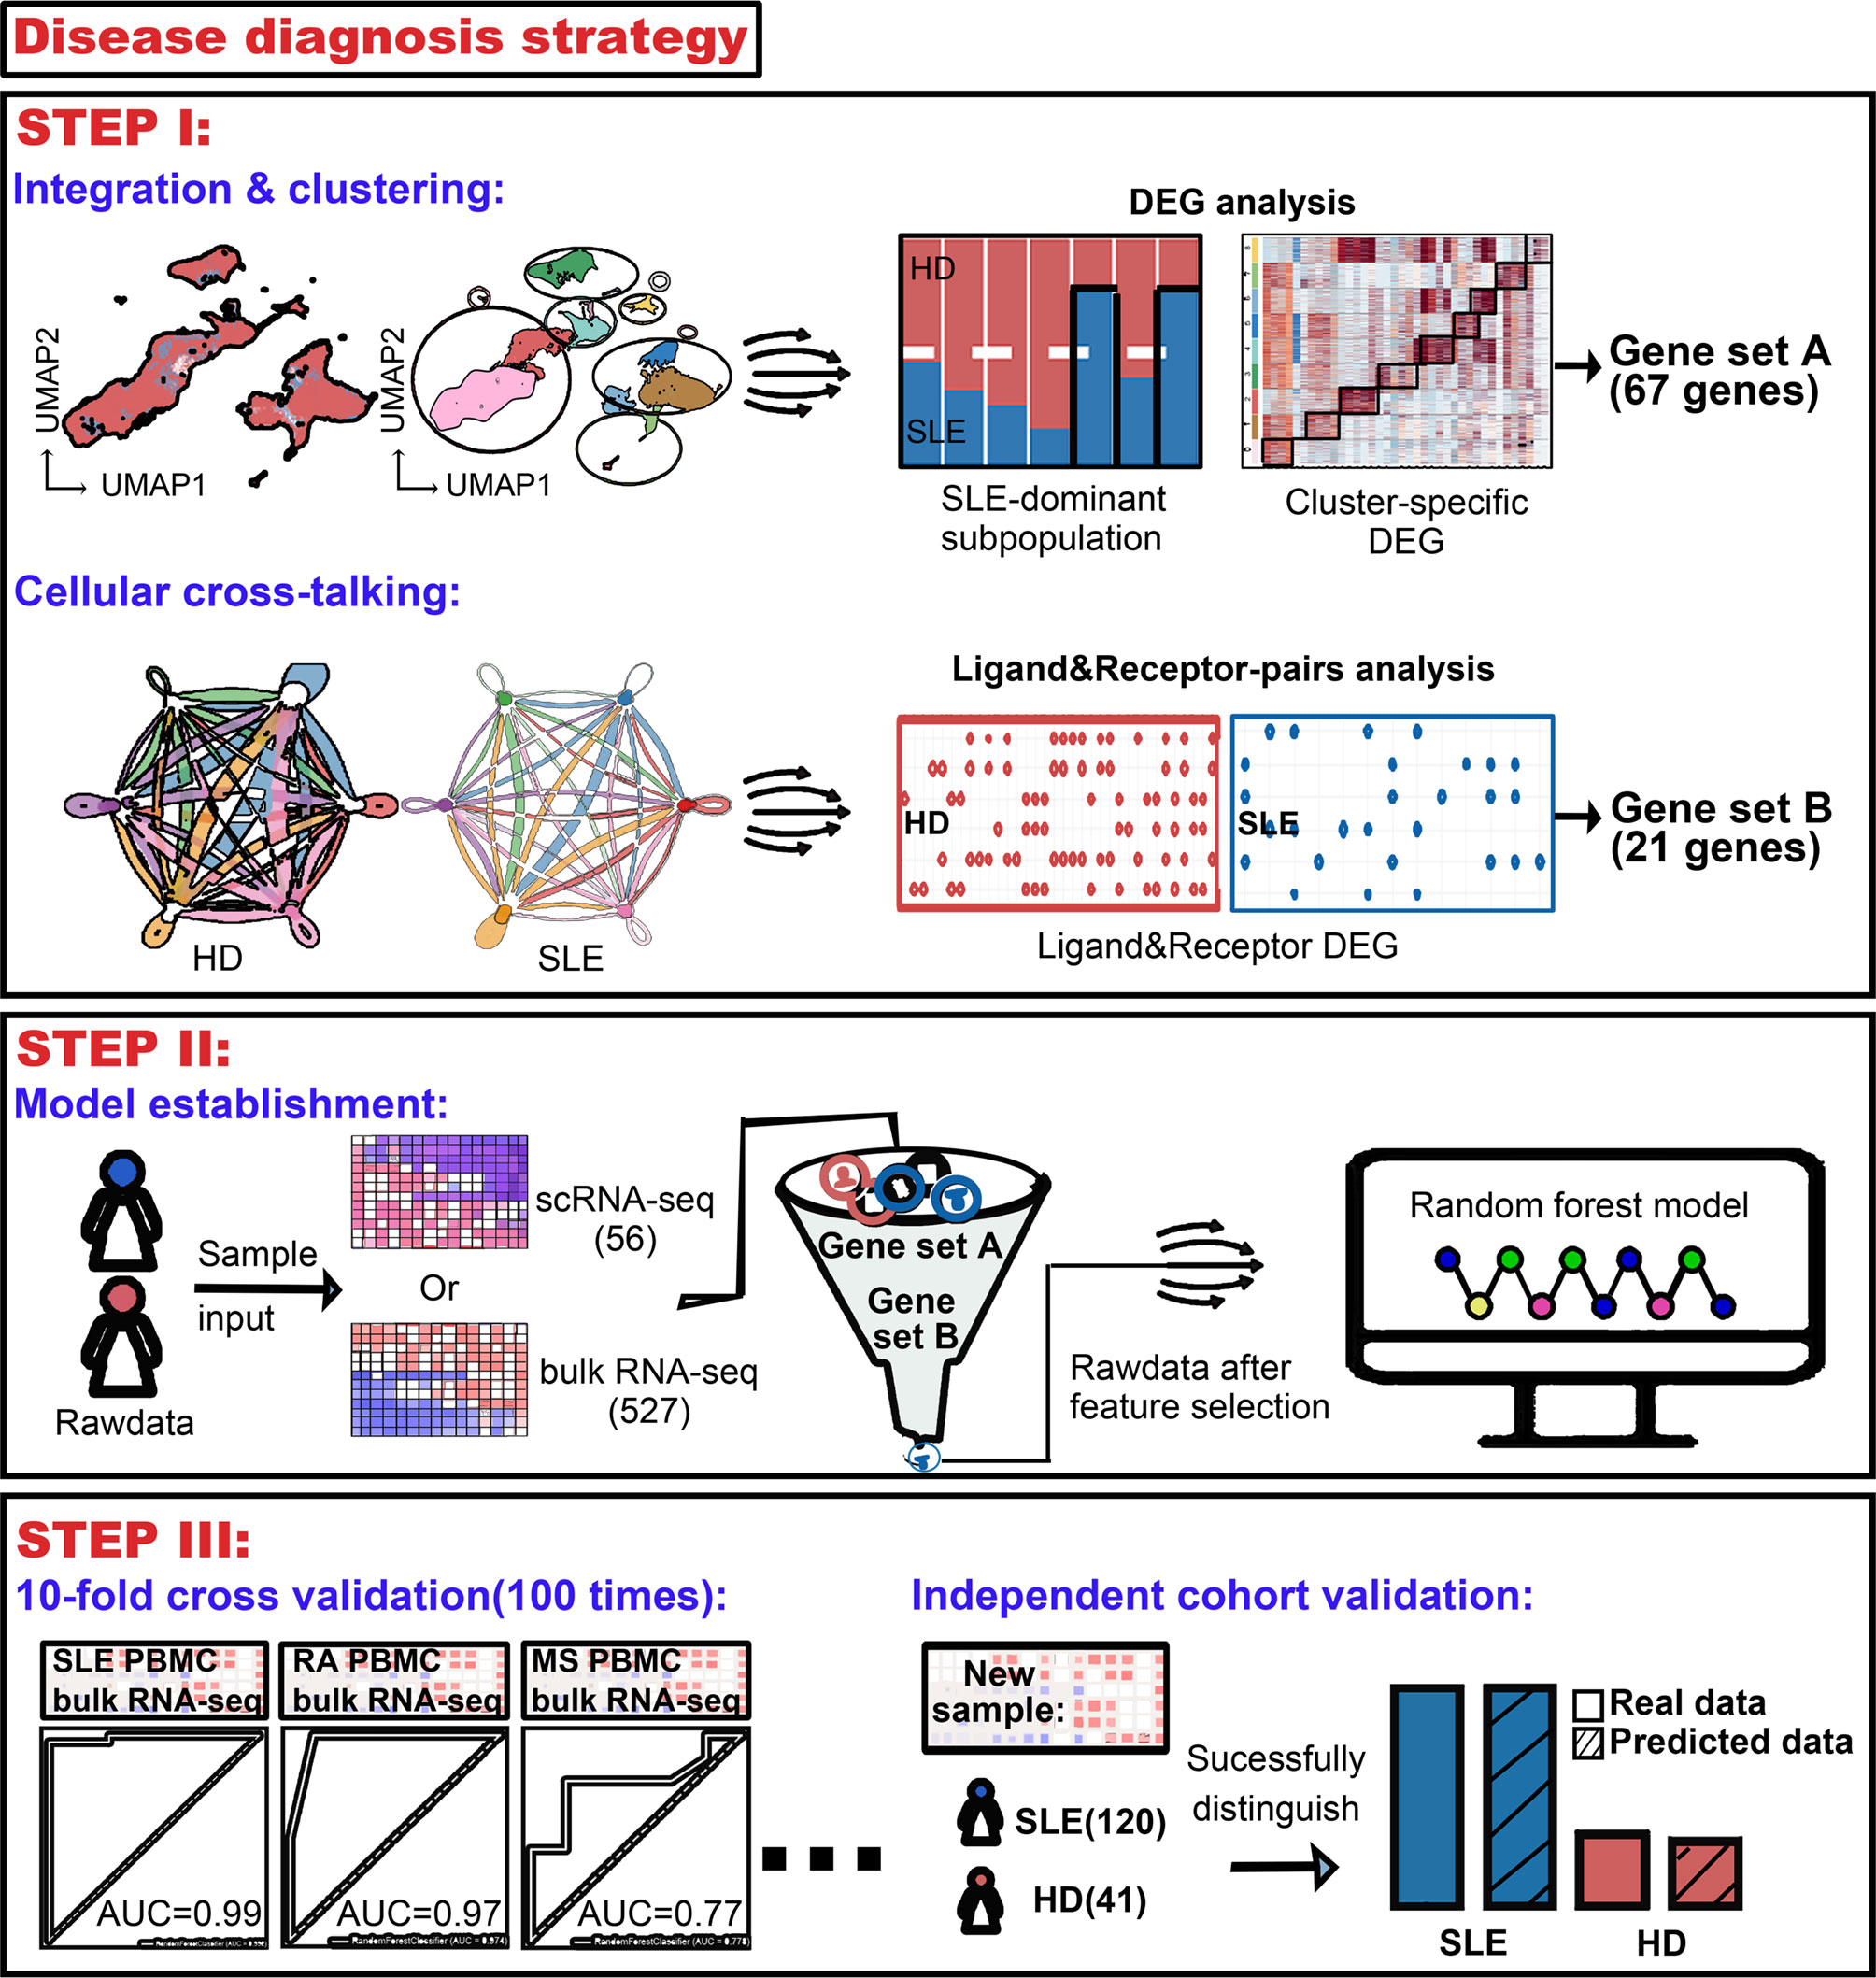
Figure 1 Workflow for establishment of an accurate machine learning model to diagnose chronic autoimmune diseases. STEP I, to figure out the most crucial information that characterizes diseases using public scRNA-seq datasets. From analysis of integration and clustering, 67 top five cluster-specific genes basing on the differential expression gene identification within SLE dominant PBMC subpopulations were derived. From cellular cross-talking analysis, 21 genes constituting ligand–receptor pairs disappeared in SLE patients and showed that more than two kinds of PBMC subpopulation were derived. A union of these two gene sets would be used in the next step. STEP II, to establish the machine learning model diagnosing diseases. A random forest machine learning model was implemented, and genes derived from step I were combined as feature input. 56 and 527 samples were used as sample input for scRNA-seq and bulk RNA-seq data, respectively. STEP III, to validate the accuracy of our machine learning model. Receiver operating characteristic (ROC) analysis was used to test the accuracy, and multiple times of ten-fold cross-validation tests were adopted to avoid bias. The diagnostic accuracy of our model was also validated using an independent bulk RNA-seq cohort containing 120 SLE patients and 41 health donors.
Material and Methods
Data Availability
The single-cell RNA sequencing data were deposited in the Gene Expression Omnibus (GEO), and the accession numbers were GSE137029 and GSE135779 for SLE patients and GSE164378 for healthy donors. Bulk RNA-sequencing data were deposited to GSE72509 and GSE164457 for peripheral blood mononuclear cells (PBMCs) of SLE patients, GSE90081 for PBMCs of RA patients, GSE89408 for synovial tissues of RA patients, GSE159225 for PBMCs of MS patients, and GSE89408 for CD14-positive cells of MS patients, and GSE183204 and GSE169687 for PBMCs of healthy donors.
Integration of Single-Cell RNA Sequencing Data
Reciprocal principal component analysis (RPCA)-based integration could effectively detect a state-specific cell cluster and run significantly faster on large datasets. Compared with other integration tools (e.g., BBKNN and LIGER), RPCA could conserve more distinct cell identities when removing batch effect, particularly for the data of immune cells (30). Considering its balancing capability on batch effect removal and biological variance preserving, RPCA would be used for our dataset integration. Before the integration, two lists were created: one containing merged SLE data and the other containing merged healthy data. These two lists were then combined and integrated through Seurat (version 4.0.5) following the guidelines at https://satijalab.org/seurat/articles/integration_rpca.html.
PBMCs and Their Subpopulation Clustering
To discover SLE-dominant cell clusters, PBMCs and their subpopulations were clustered through Seurat (version 4.0.5), respectively. Cell proportions of each cluster were calculated subsequently. For PBMC cell clustering, each cell subcluster was annotated based on a canonical marker. Any cluster that has SLE cells containing more than 75% would be considered as SLE dominant.
Differential Expression Gene Analysis on SLE-Dominant Cell Clusters
Within those PBMC subpopulations (e.g., B cells and monocytes) which contain the SLE-dominated cluster, differential expression gene (DEG) analysis would be applied on all of their cell clusters with Function FindAllMarkers embedded in Seurat (version 4.0.5) to find out useful information that mark the SLE state. Top five genes based on their log2 fold change value were selected as the first part of feature input for machine learning. Meanwhile, these DEG functions were annotated through literature search.
Cellular Cross-Talking Analysis
The machine learning model can be optimized with powerful sources of information. Thus, CellChat (version 1.1.3) analysis was performed following the guidelines at https://github.com/sqjin/CellChat. In details, overall interaction, overall signaling pattern, outgoing/incoming signaling pattern, and ligand–receptor pair were checked step by step. Samples were analyzed independently. Datasets of patients and health donors were analyzed separately and merged to make a comparison analysis. Ligand–receptor pairs which disappeared at SLE were selected as a second part of feature input for machine learning.
Machine Learning With the Random Forest Model
The random forest machine learning model was implemented with sklearn (version 0.23.2). The gene set which derived from integration and CellChat analysis were combined as feature input, aiming at selecting information within the sequencing datasets, thus improving the performance of the machine learning model. 56 and 527 samples were used as sample input for scRNA-seq and bulk RNA-seq data, respectively. Samples from patients and healthy donors were labeled with 1 and 0, respectively. With the function train_test_split within sklearn.model_selection, the data were split into two parts, 70% for training and 30% for testing, according to previous study (31). Data balancing was performed when the cell/sample ratio between patients and healthy donors was above 1:2, at random forest model initialization. Receiver operating characteristic (ROC) analysis was used to test models’ accuracy. The models for each disease were independent.
To avoid bias of data composition, the sklearn module StratifiedKFold was used to split data into ten parts preserving the ratio of samples and perform a ten-fold cross-validation with a loop of one hundred. The average and standard deviation of area under curve (AUC) were documented.
Diagnostic Accuracy Validation of the Machine Learning Model
An independent bulk RNA-seq cohort containing 120 SLE patients and 41 health donors was enrolled into the diagnostic accuracy validation of our machine learning model. Basic information of this cohort including SLE severity, age, and gender was documented. Genes which were used as feature input for the machine learning model were confirmed to be expressed in each sample. The diagnostic accuracy of our machine learning model for SLE and healthy donors was tested separately.
Statistical Analysis
The statistical significance of differential gene expression was analyzed with the Wilcoxon test, a default parameter in function FindAllMarkers of Seurat packages.
Software Version
All the software mentioned above were based on R (version 4.1.1) and Python (3.7). Integration analysis and cell clustering were based on Seurat (version 4.0.5), and cellular cross-talking analysis was based on CellChat (1.1.3). Machine learning was based on sklearn (version 0.23.2).
Results
The Limited Alterations of Cell Composition in SLE Patients From the Overall PBMC Perspective
To discover the SLE-dominated alterations of PBMC composition in SLE patients, two single-cell transcriptomic datasets with more than 3.15 × 10⁵ cells from 15 SLE patient (GSE137029) and 8 healthy donor (GSE164378) samples were enrolled in our study. The uniform manifold approximation and projection (UMAP) and Louvain algorithm were applied for unsupervised dimension reduction and clustering, respectively (32, 33). As shown in Figures 2A, B, the PBMCs of these two datasets could be grouped into sixteen molecularly distinct clusters. The clusters were annotated based on the gene expression values compared to all other cells. The results illustrated two clusters of T cells, B cells, natural killer cells, and erythroid cells, three clusters of monocytes and dendritic cells, and one platelet cluster (Figures 2A, D). Unfortunately, SLE-dominated (clusters 13 and 15) clusters were tiny and might come from erythrocytes (HBB specifically expressed). The rest of the cell cluster proportions of SLE patients and healthy donors were evenly balanced or healthy donor dominant (Figure 2C). This is partly because the difference between SLE patients and healthy donors might be attenuated under the overall PBMC perspective. Hence, to strengthen the power of detecting SLE-dominant information, further analyses were performed in the subpopulations of PBMCs according to the cluster annotation above.
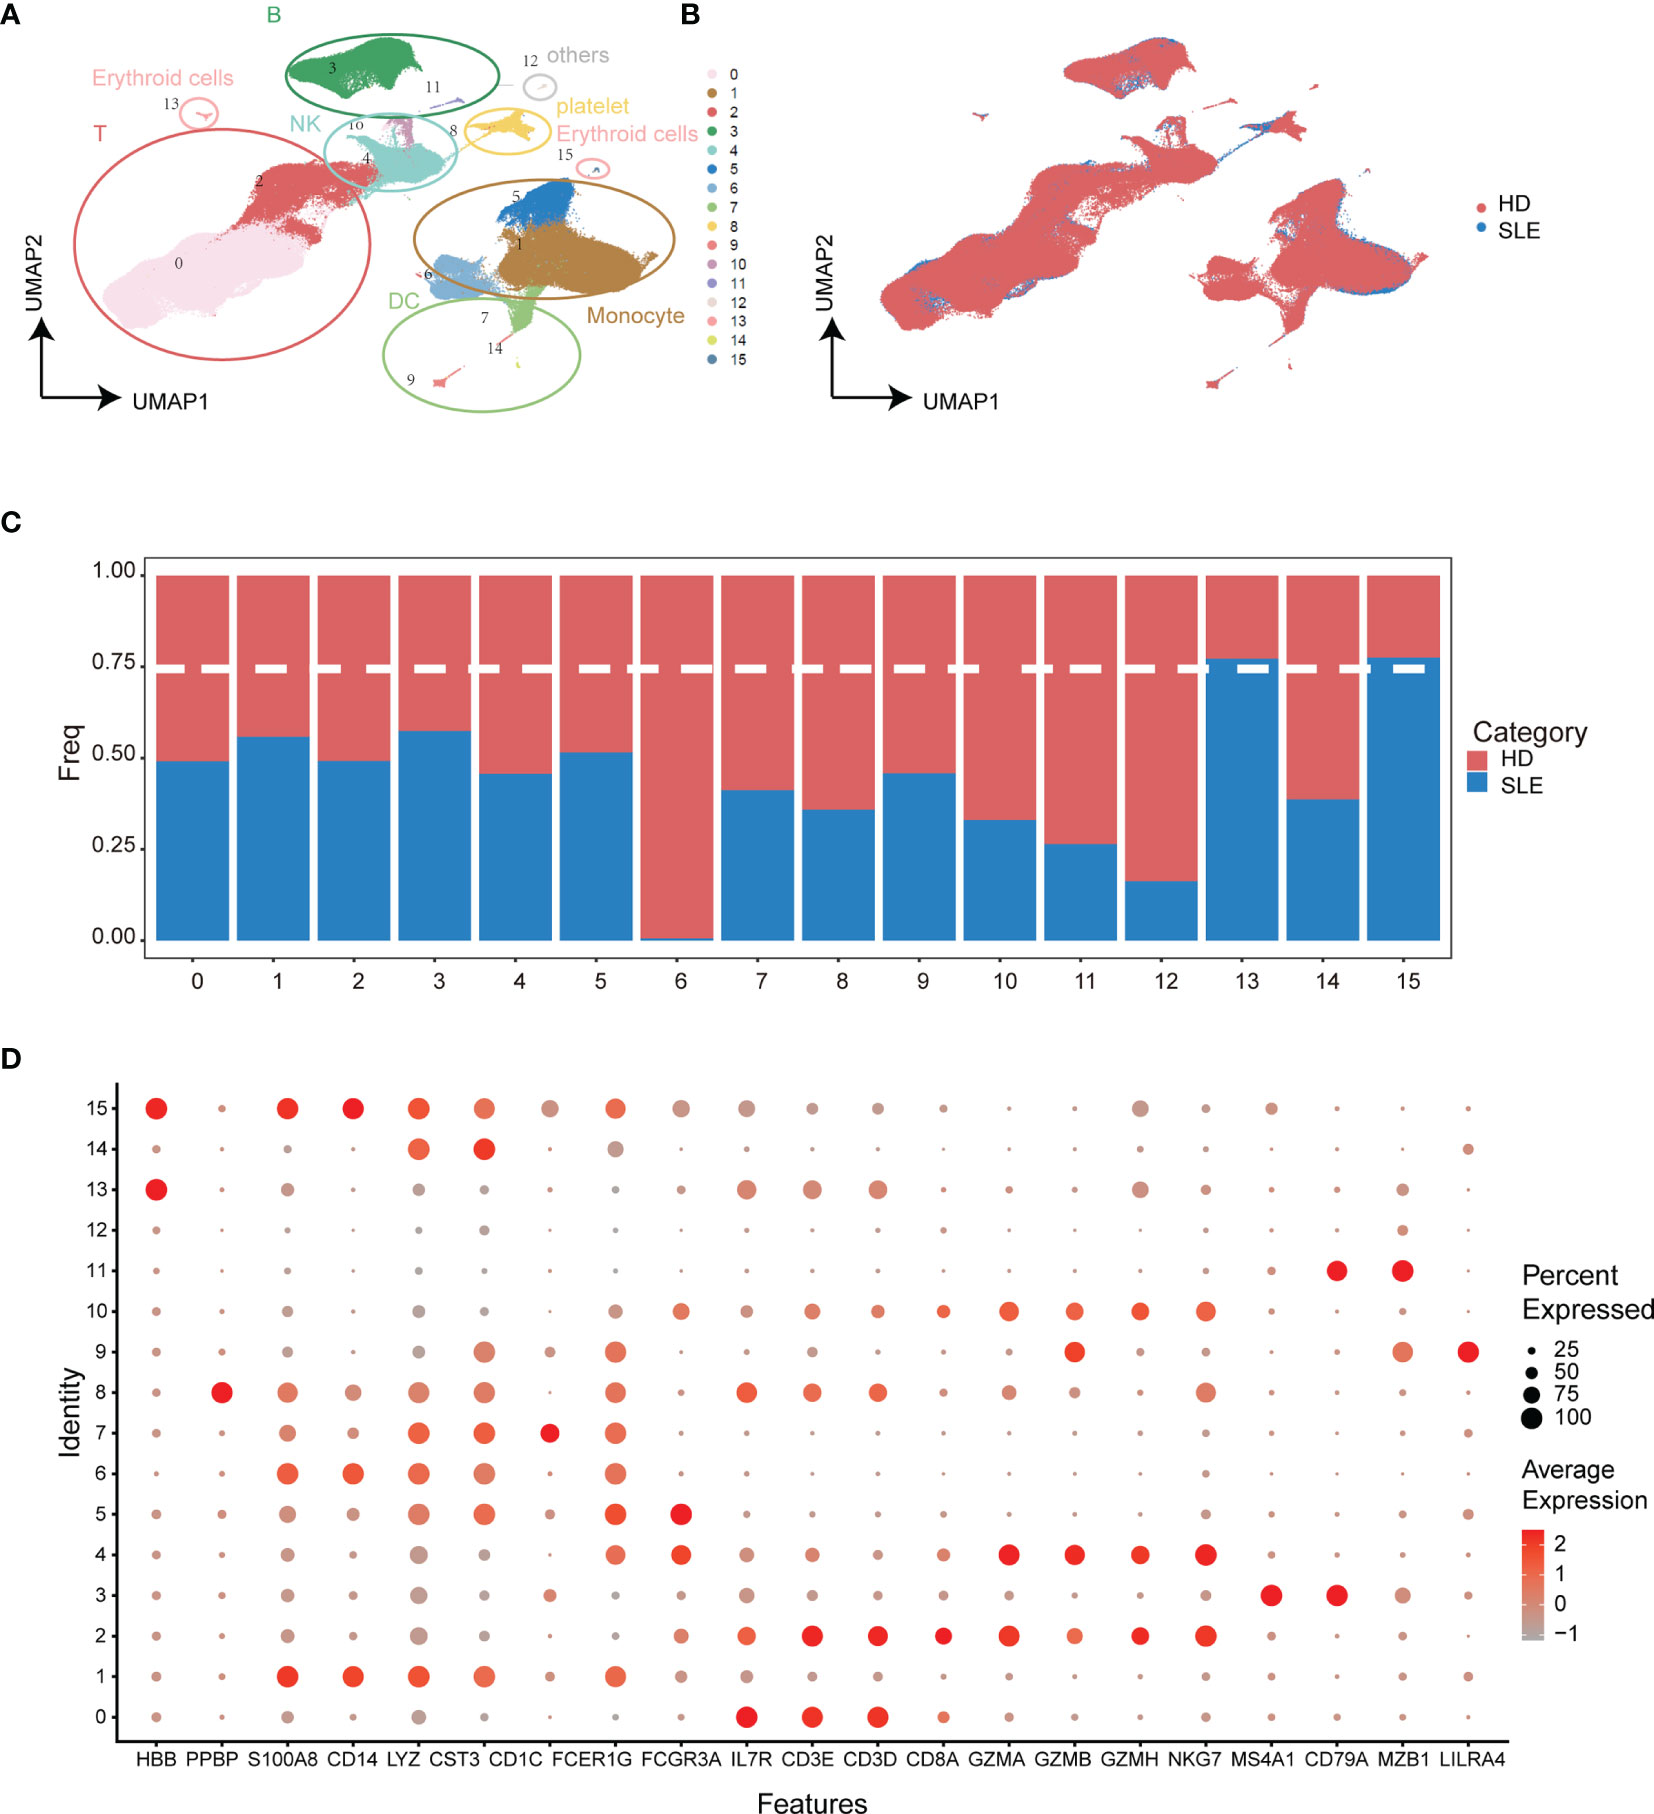
Figure 2 Integration analysis of single-cell RNA sequencing datasets from SLE patients and healthy donors. (A) UMAP plot of categorized cell clusters. (B) UMAP plot of single-cell PBMCs from fifteen SLE flare patients and eight healthy donors. (C) Bar plot of cell proportion in each cell cluster. The dashed line represents the 75% threshold. (D) Dot plot of canonical markers for B cells, monocytes, T cells, natural killer cells, dendritic cells, and platelets. The dot size represents the gene (x-axis) percent expression on its corresponding cluster (y-axis). The color represents the average expression of the genes (gray: low, red: high).
Identification of SLE-Dominated Clusters in B Cells and Monocytes
Increasing evidence indicates that specialized immune cell subsets are involved in the pathophysiological process of autoimmune diseases through multiplex pathways and signals (34–36). Thus, we re-clustered the subpopulations of PBMCs to identify the SLE-dominated clusters in which the cell proportion of SLE exceeds 75%. Interestingly, the SLE-dominated clusters were identified only in B cells (clusters 2, 6, and 7, Figures 3A, B) and monocytes (clusters 1 and 7, Figures 3E, F); the rest of the PBMC subpopulation is shown in Figure S2. With differential expression gene (DEG) analysis on B cells and monocytes, the top five cluster-specific genes based on their log2 fold change values are shown in Figures 3C, G, respectively. All DEG analysis results are shown in Table S1. Interferon inflammatory signatures are closely related to the SLE (37). Consistently, we found that cluster 7 of B cells has interferon-stimulated gene (ISG) expression patterns (IFI27, MX1, ISG15, and IFI44L). Moreover, we identified that this cluster simultaneously possess the typical expression patterns of naïve and autoactive B lymphocytes (naïve: IgD+, CD27-, CD38 low, CD24 low; autoactive: TBX21, ITGAX, CXCR5, TRAF5, CR2, Figure 3D) (38, 39). In addition, we also found that cluster 1 of monocyte highly expressed ISGs (IFI27, MX1, ISG15, IFI44L), and cluster 7 of monocyte had a proinflammatory character (FKBP5, Figure 3H) (40).
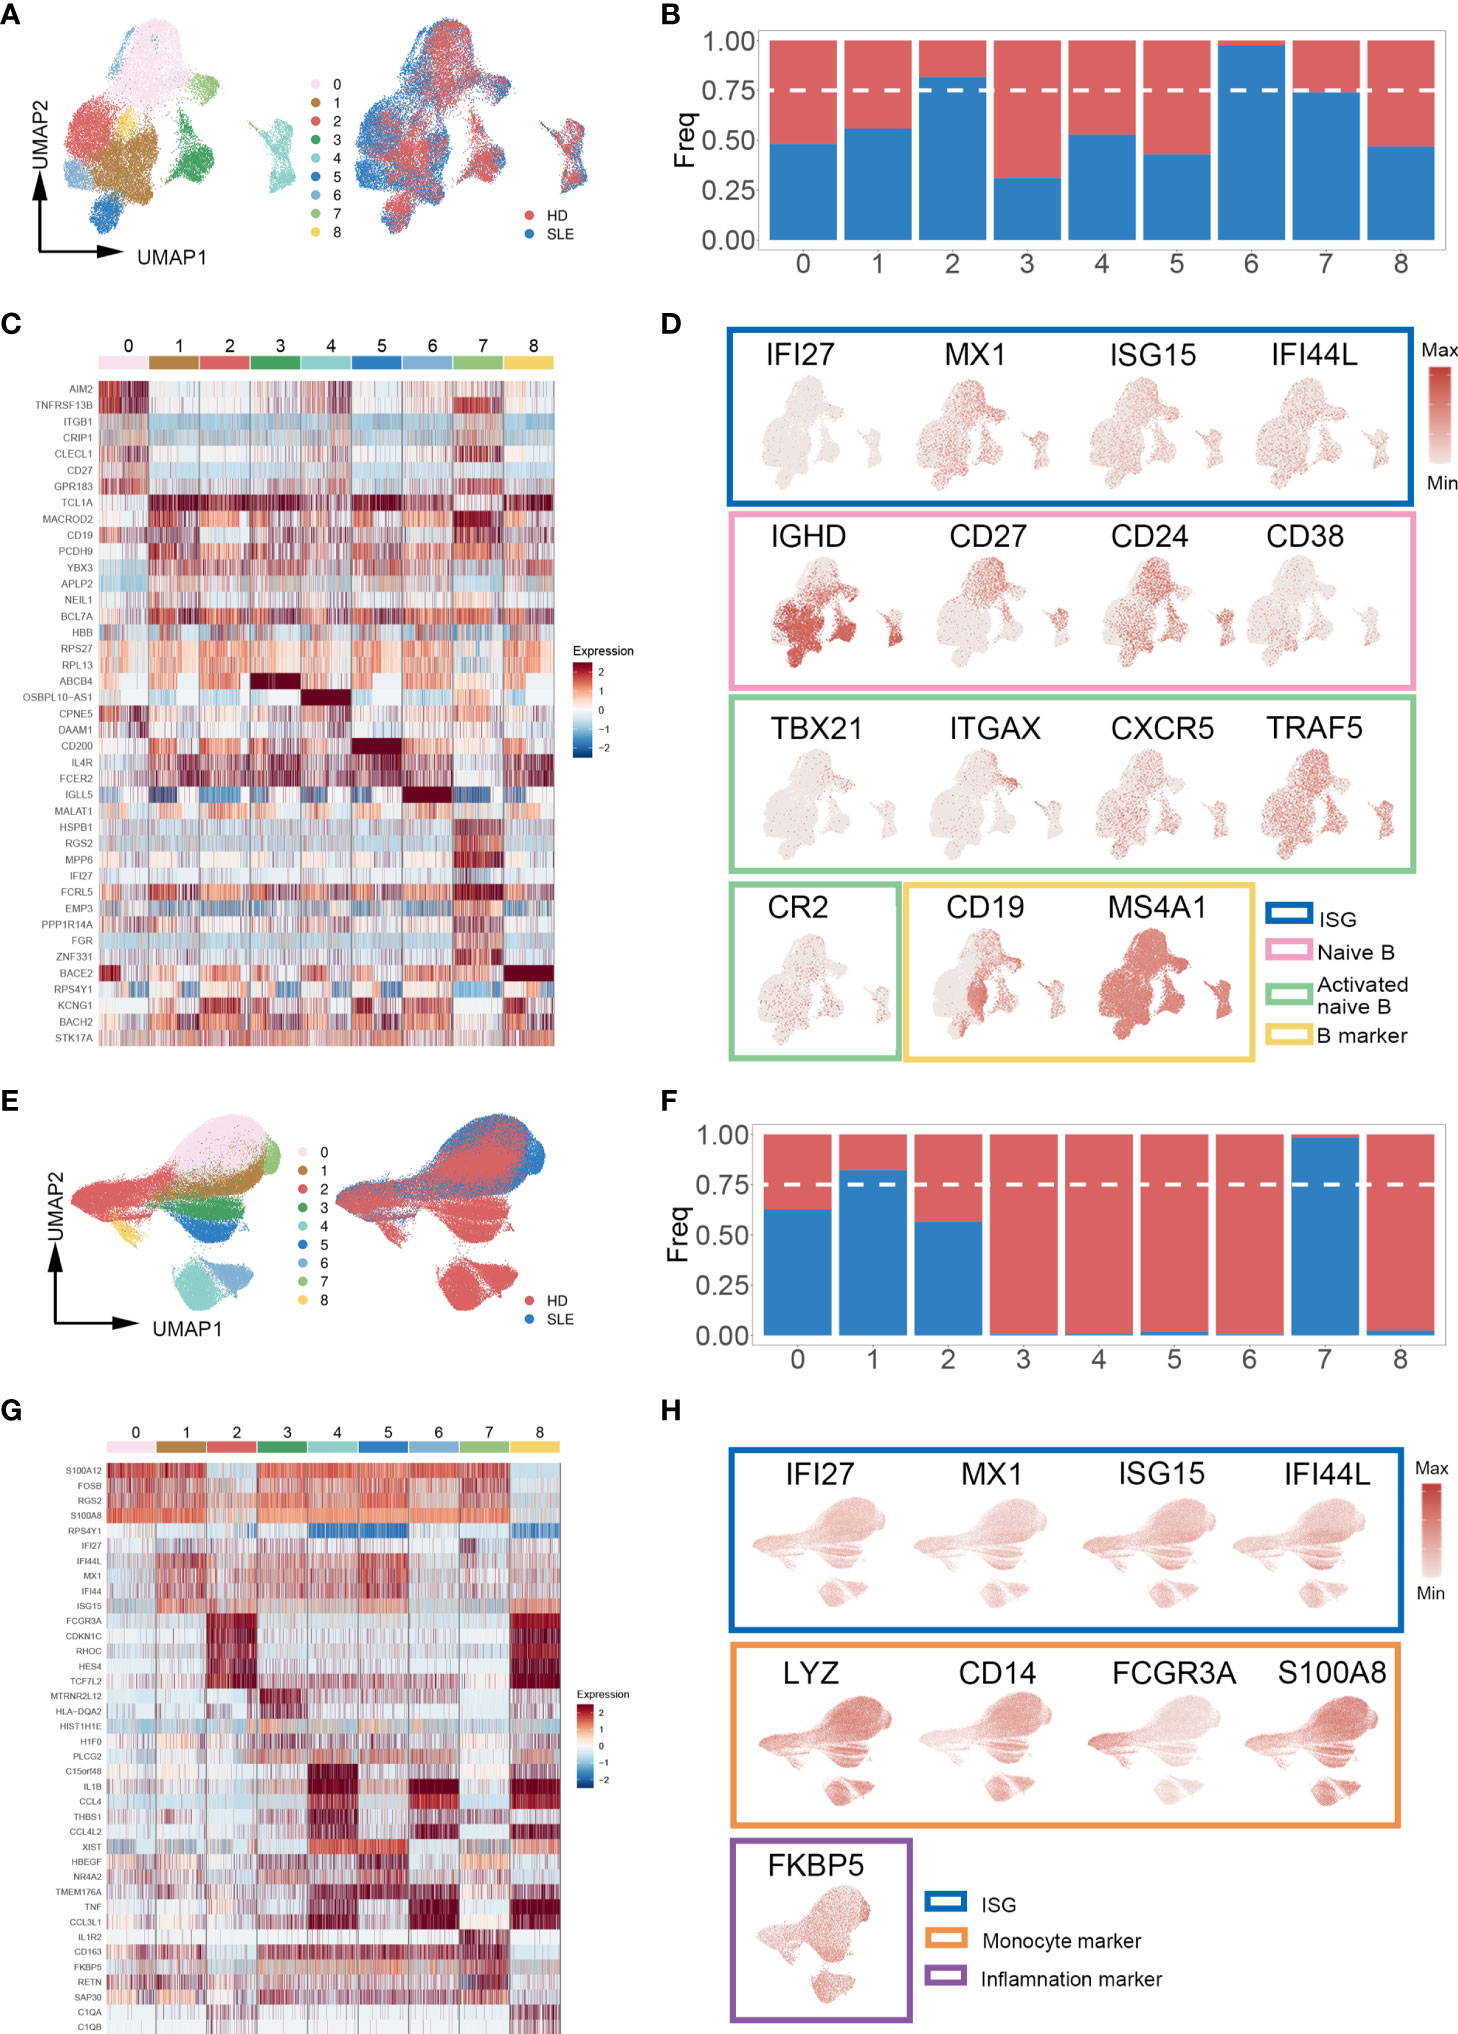
Figure 3 Cell proportion analysis of re-clustered B cells and monocytes. (A, E) UMAP plot of re-clustered B cells and monocytes from SLE patients and healthy donors, respectively. Left panel cells were categorized with Louvain clusters; the right panel cells were categorized by their source (SLE patient/healthy donors). (B, F) Bar plot of cell proportion in each B cell and monocyte subcluster, respectively. The dashed line represents the 75% cell proportion threshold. Both B cells (clusters 2, 6, 7) and monocytes (clusters 1, 7) have a unique cell subpopulation where SLE is predominant. (C, G) Heatmap of top five cluster-specific genes of each subclusters within B cells and monocytes, respectively. The color represents the expression level (blue: low, red: high). (D, H) UMAP plot of selected gene expression in re-clustered B cells and monocytes, respectively.
Taken together, these findings revealed that there were enhanced signals of an autoreactive/inflammatory state in B cells and monocytes of SLE patients, which suggested the essential roles in the pathophysiological process of SLE.
Weakened Interactions Among the PBMC Subpopulations of SLE Patients
To systematically explore the alterations of PBMCs in SLE patients and obtain a powerful source of information for the training of the machine learning model, we employed CellChat to analyze cellular cross talking from scRNA-seq data. Three scRNA-seq datasets (GSE137029, 15 adult patients with SLE; GSE135779, 13 child patients with SLE; GSE164378, 8 healthy donors) with more than 3.80 × 10⁵ cells were included in this analysis.
The total number and strength of ligand–receptor pairs were significantly reduced in both adult and child SLE patients compared with healthy donors (Figure 4A). Remarkably, the interactions of PBMC subpopulations in SLE patients were weakened (Figure 4B). Comparing overall and detailed outgoing/incoming signaling pattern variations among SLE and healthy donors, we identified that abundant signal patterns could be observed for the healthy donors, but in the SLE groups, the number of involved pathways was reduced (Figures 4C, D). In detail, there were several signal patterns that specifically disappeared under the disease state. Among them, FLT3, CD48, and TGF-beta signal patterns have been reported to have a negative correlation with SLE development (41–44). Taken together, the disappearance of multiple signal patterns might be a potential feature during SLE development.
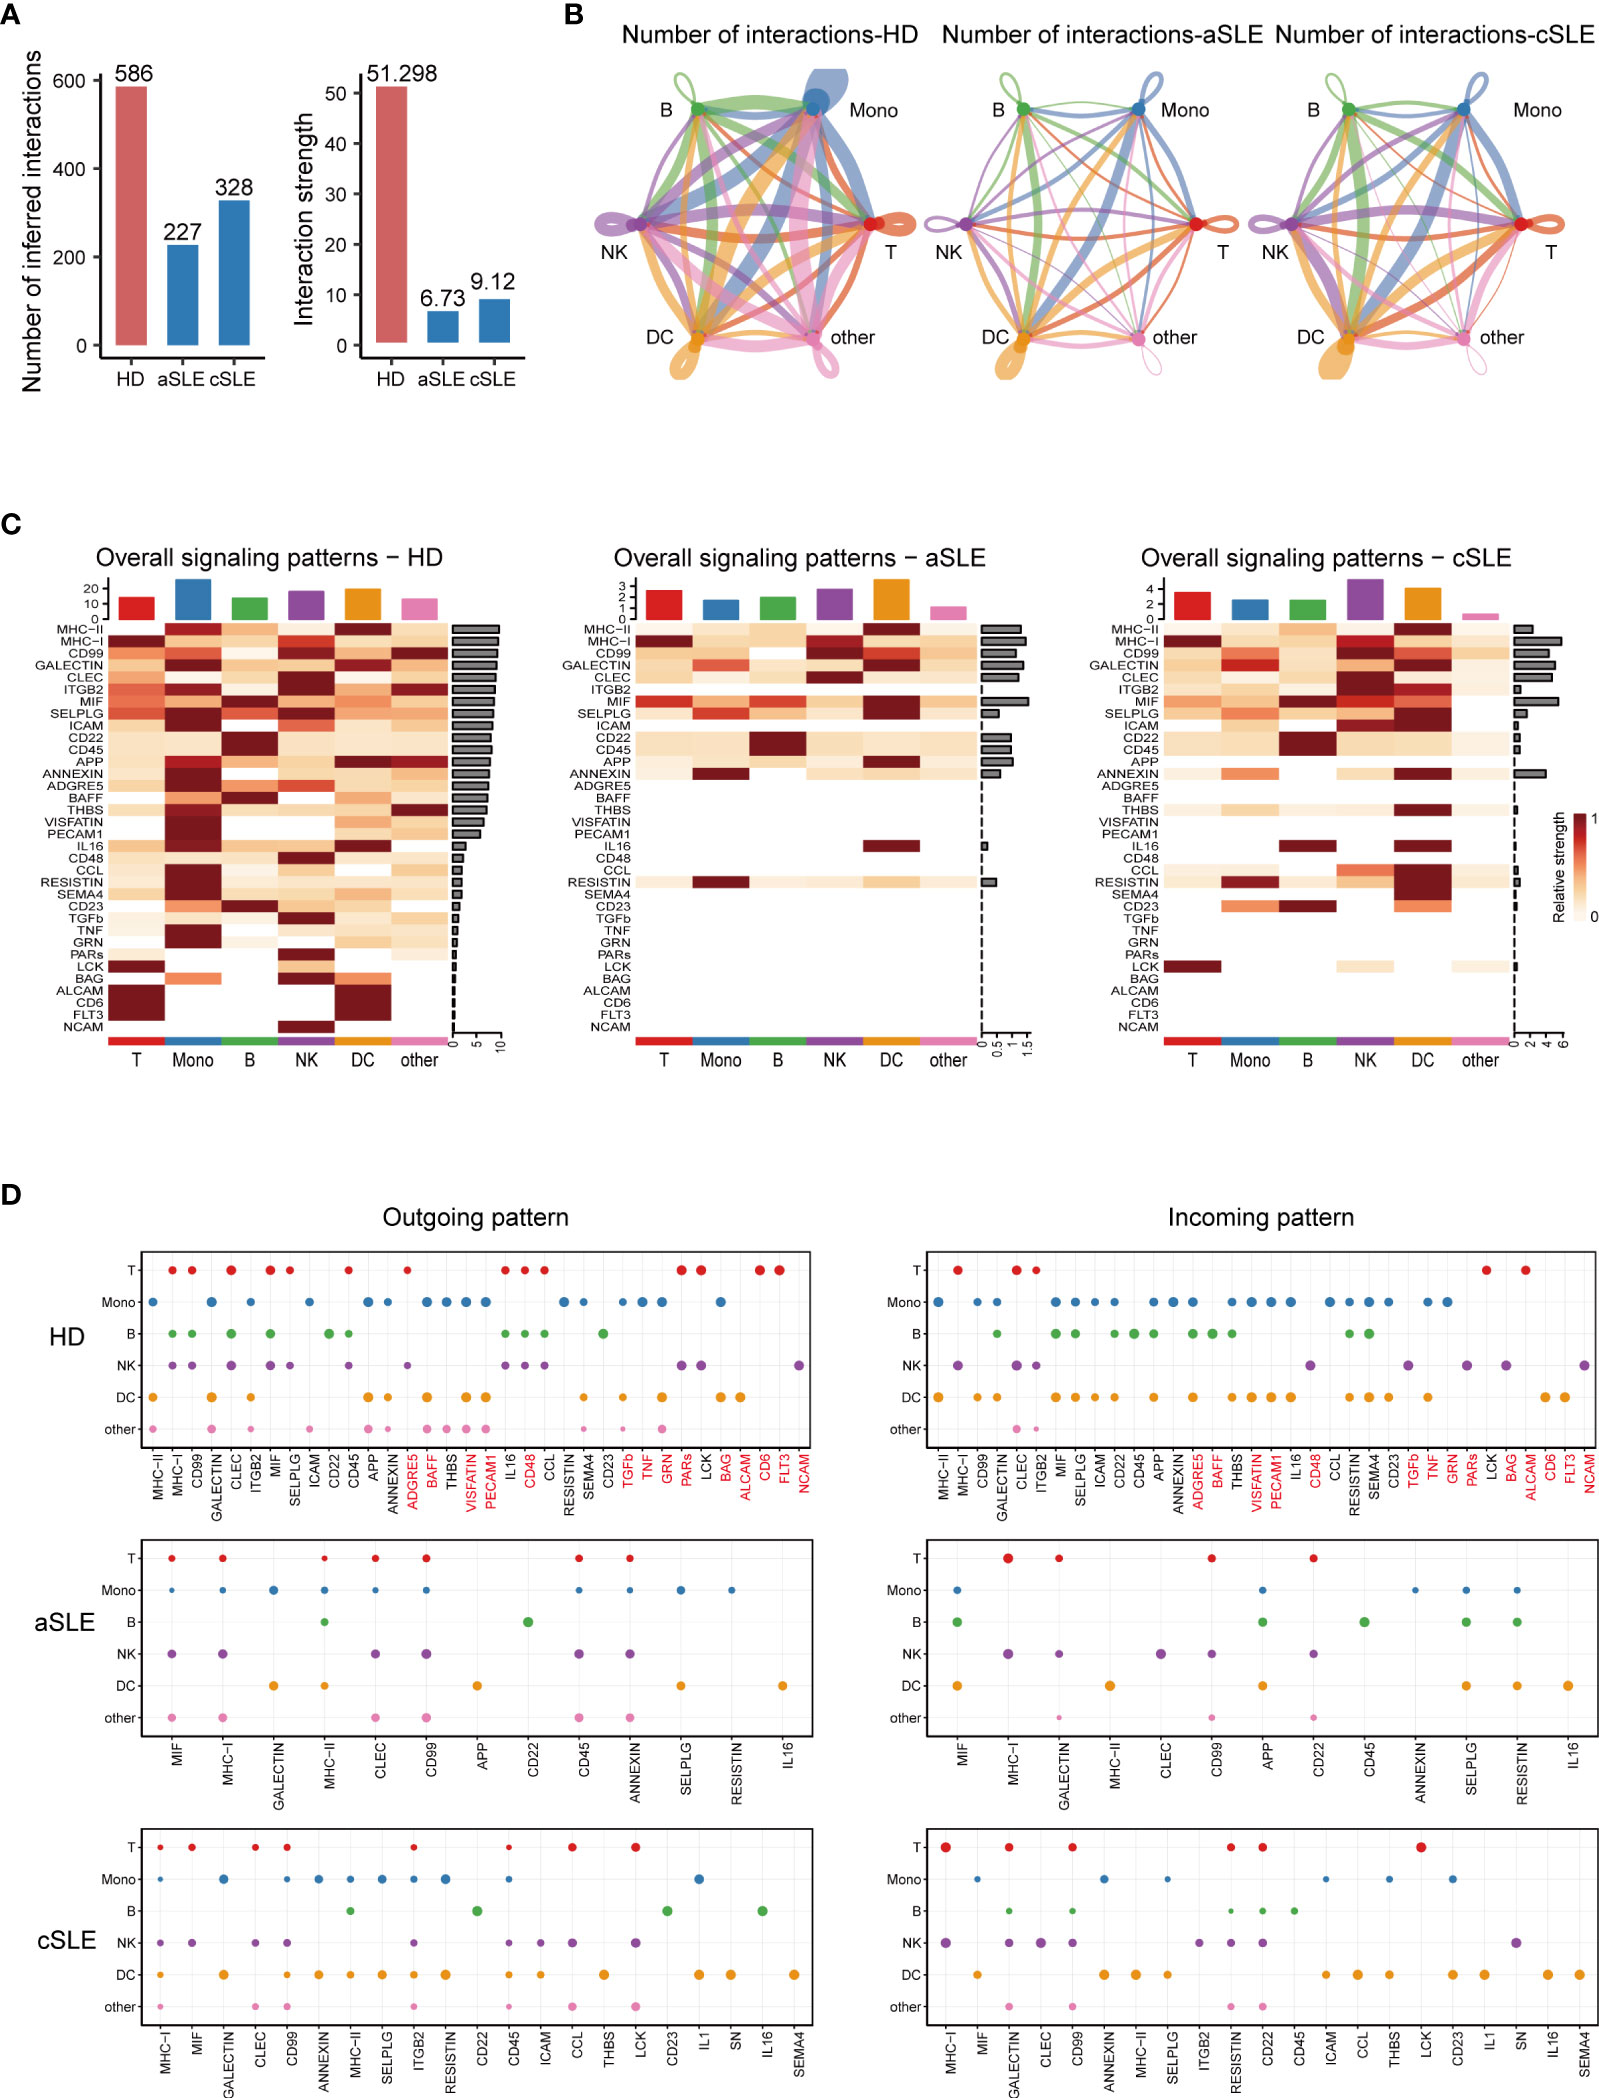
Figure 4 CellChat analysis of whole PBMCs from SLE patients and healthy donors. (A) Bar plot of the overall difference among healthy donors (HD), adult SLE patients (aSLE), and child SLE patients (cSLE). The left panel shows the total number of interactions, and the right panel shows the interaction strength. (B) Circle plot of PBMC subpopulation among HD, aSLE, and cSLE. The line width: the connection strength; dark blue: monocytes, green: B cells, red: T cells, purple: natural killer cells, orange: dendritic cells and pink: other cells. These together revealed a weakened PBMC subpopulation cross talking and distinct signal pattern under SLE. (C) Heatmap reveals the overall signal pattern changes in the HD, aSLE, and cSLE groups, and the signal strength is scaled from white (no signal detected) to dark red (strong). (D) Dot plot for the emergence probability of signal outgoing (left panel) and incoming (right panel) patterns within each PBMC subpopulations among HD, aSLE, and cSLE. The dot size represents the p value. Patterns which specifically disappeared under disease state were marked with red. The total number of outgoing and incoming signal reduced significantly in SLE.
Detailed Ligand-Receptor Pair Alterations in SLE Patients
As the above results indicated that numerous signal patterns disappeared in SLE compared with healthy states, to find detailed information, we further explore the discrepancy of ligand–receptor pairs from all PBMC subpopulations (B cells, monocytes, T cells, natural killer cells, and dendritic cells) among healthy donor, adult SLE (aSLE), and child SLE (cSLE) groups (Figures 5A–E). We identified that eighty-seven ligand–receptor pairs disappeared in SLE patients, which were composed of sixty-one genes. The frequency of each gene appeared at each PBMC subpopulation, as listed in Table S2. The genes which showed more than two kinds of PBMC subpopulation were recognized as significant ones to be selected as a second part of feature input for machine learning.
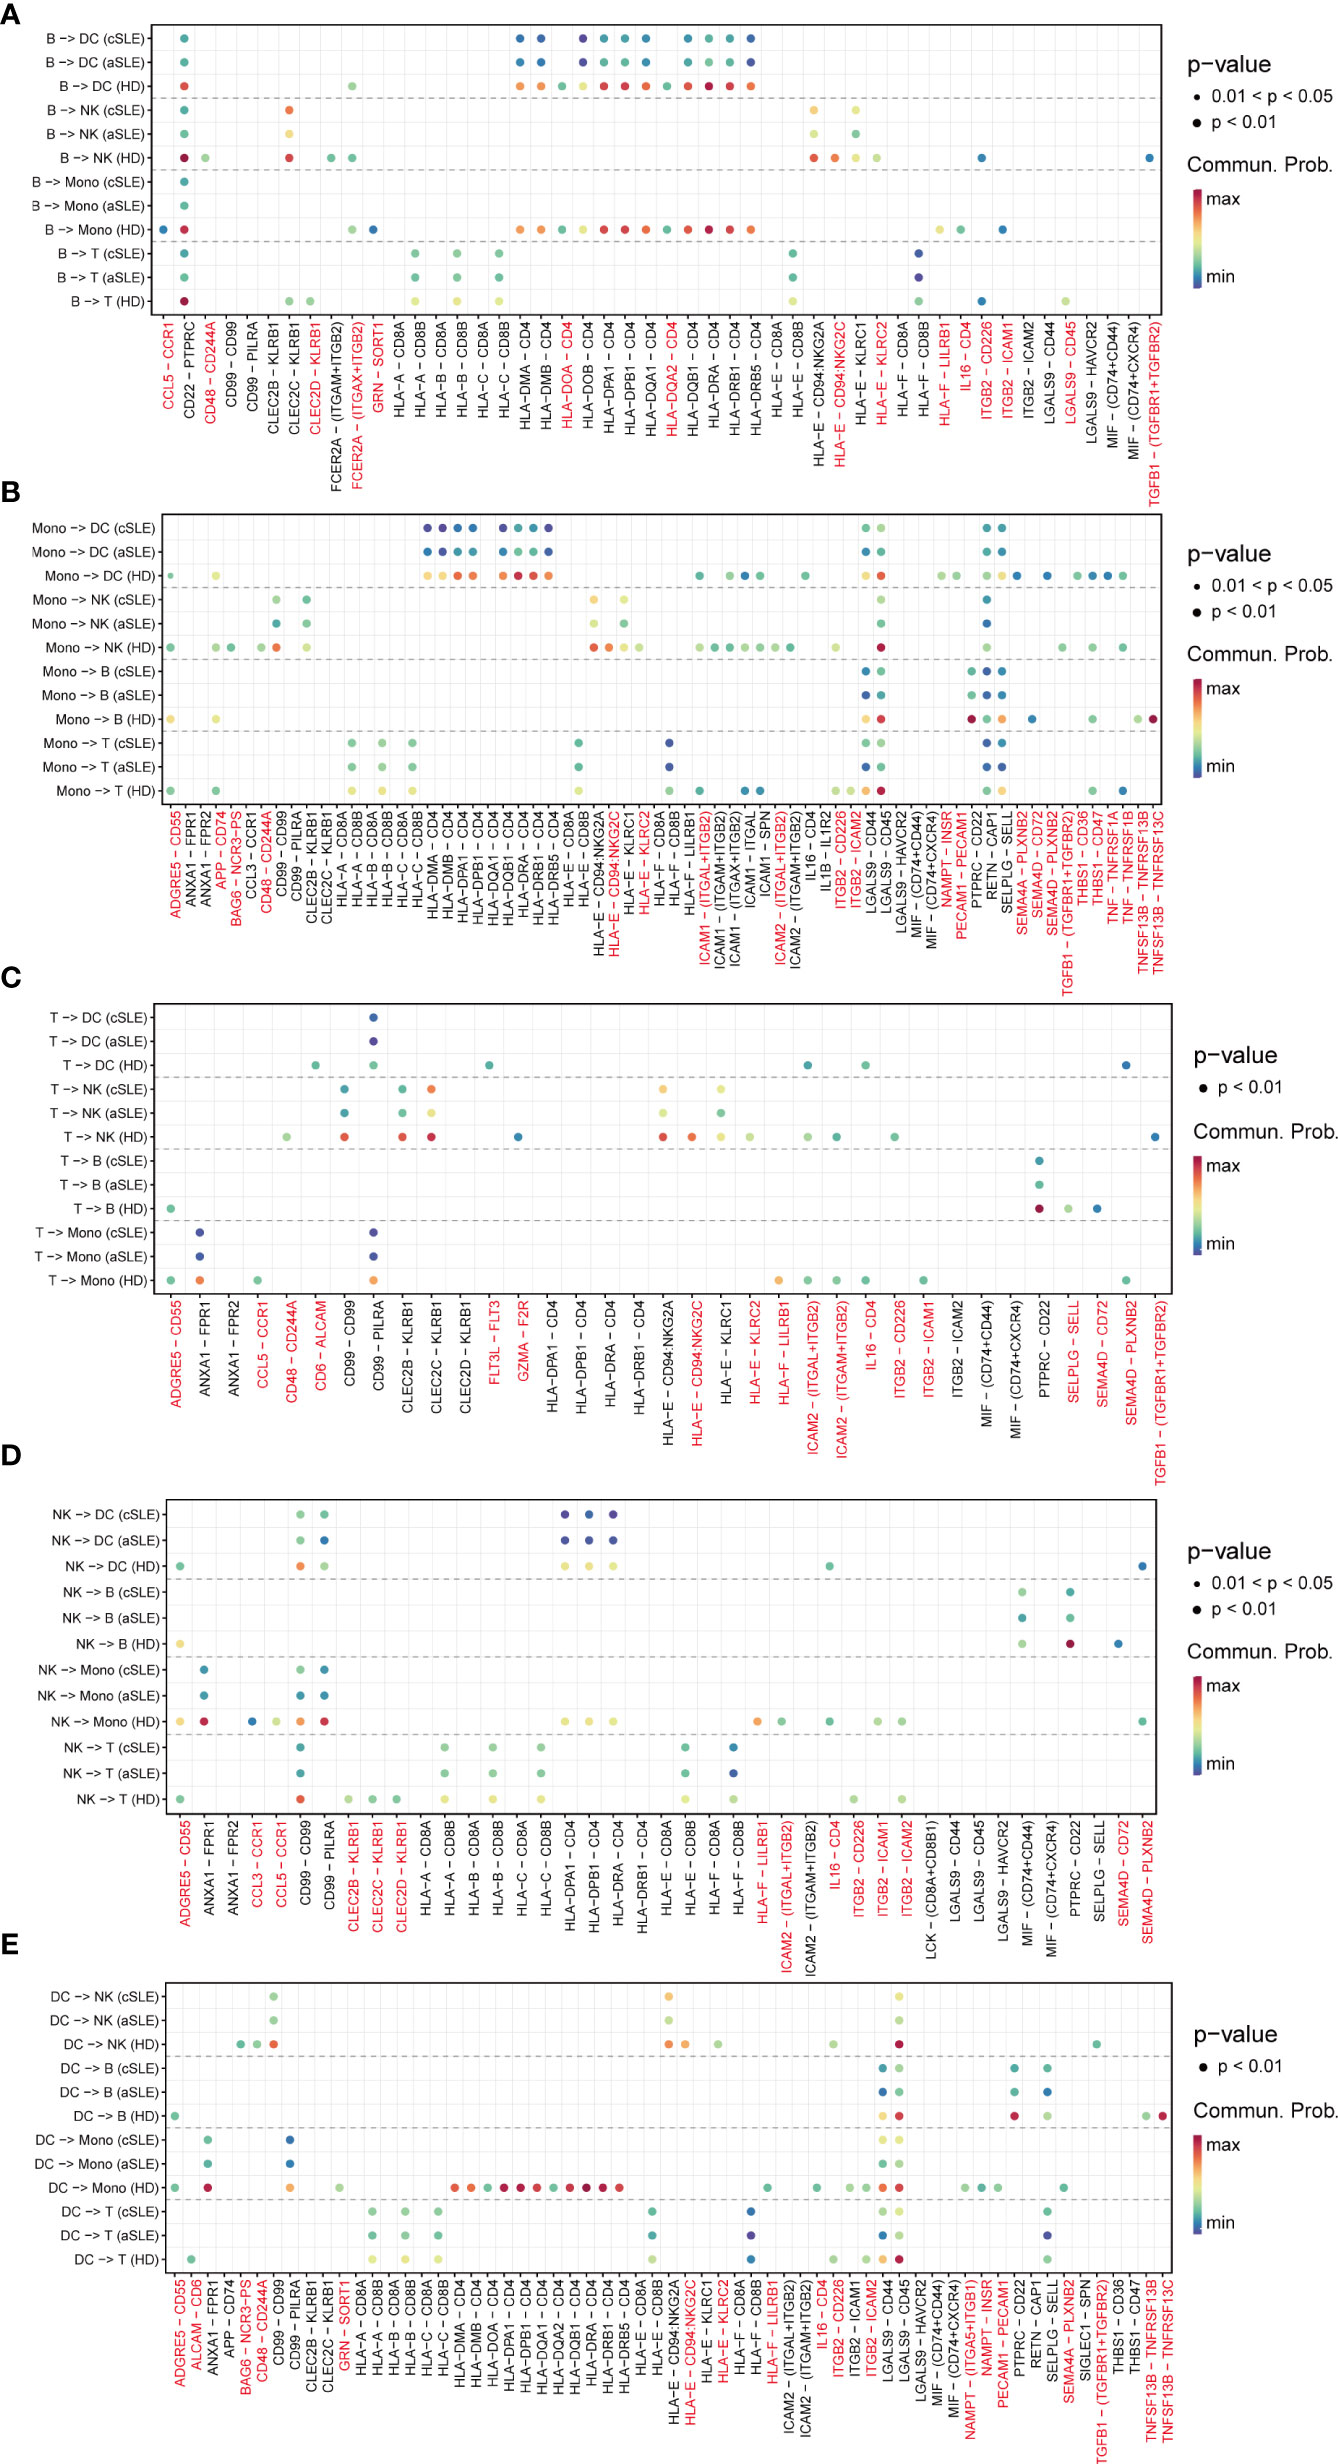
Figure 5 Ligand–receptor pair alternation of SLE patients compared with healthy donors. Dot plot for the emergence probability of ligand–receptor pairs within each PBMC subpopulations (A) B cells, (B)monocytes, (C) T cells, (D) natural killer cells, (E) dendritic cells) among HD, aSLE, and cSLE. The dot color represents the probability. Pairs which specifically disappeared under disease state are marked with red.
Among them, TGFBR1, TGFBR2, CCL5, CD48, CD244A, and CD72 have been reported to be closely related to the pathophysiologic processes of autoimmune diseases (41, 43, 45–47). For example, TGFBR1, TGFBR2, and CCL5 levels are negatively correlated with SLE development (43, 45). CD48, also known as SLAMF2, which could regulate both natural killer cells and cytotoxic CD8+ T cells (48), could protect mice from autoimmune nephritis (41), CD244A and CD72 were specifically decreased in monocytes and B cells during SLE development (47, 49). Interestingly, all these selected pairs are all in B cells or monocytes, suggesting the key roles of monocytes and B cells on the pathophysiologic processes of autoimmune diseases. All these findings were consistent with our results of integration analysis.
Efficient Machine Learning Models for Chronic Autoimmune Disease Diagnosis
To establish a mathematical model of unbiased random forest machine learning for SLE accurate diagnosis, sixty-seven top five cluster-specific genes derived from integration analysis and twenty-one significant genes identified via cellular cross-talking analysis were combined as feature input. The dataset GSE135779, containing 3.60 × 10⁵ PBMCs (derived from 33 cSLE, 7 aSLE, and 11 healthy children, 5 healthy adults), was included to evaluate the diagnosis efficiency of our mathematical model.
The results indicated that our machine learning model could separate SLE and healthy status with acceptable accuracy (AUC = 0.776 ± 0.097, Figure 6A). The feature importance of our gene set for SLE is shown in Figure 6C. Considering the signal intensity of our gene sets and the denoising ability of machine learning, a further investigation was conducted to evaluate the disease distinguishing the efficiency of our mathematical model using bulk RNA-seq data. The bulk RNA-seq datasets (GSE72509, GSE183204), which include 99 SLE patients and 30 healthy donors were used in this investigation. The results indicated that our mathematical model has great adaptability (AUC = 0.998 ± 0.004, Figure 6B). The corresponding feature importance was also calculated (Figure 6D). This revealed that combined with the unbiased random forestry machine learning model, our gene sets rendered a powerful mathematical tool for distinguishing SLE.
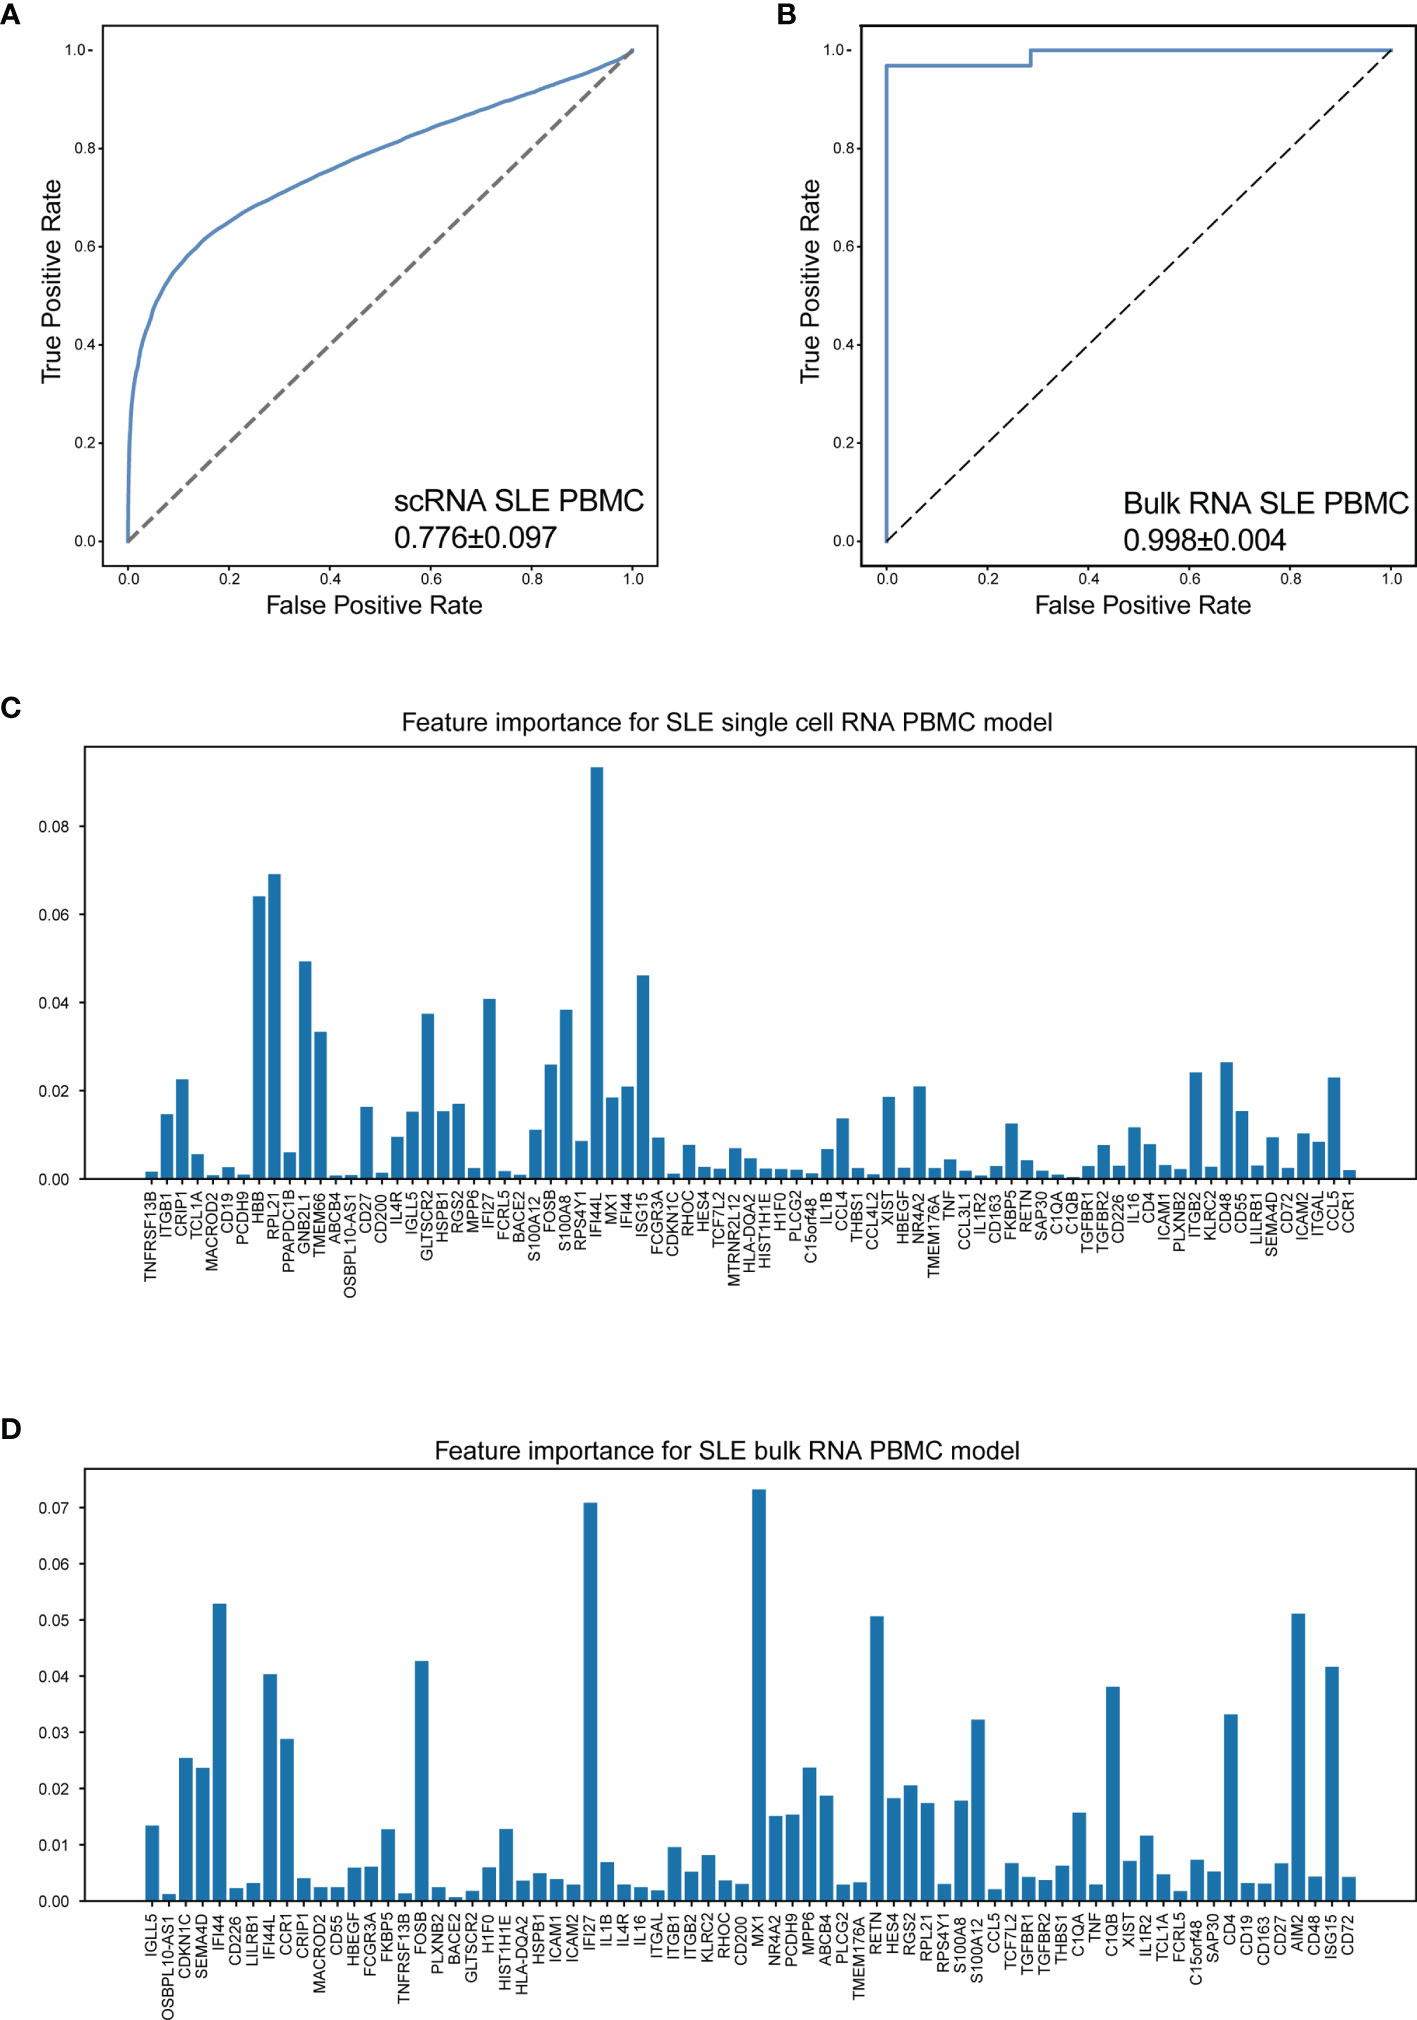
Figure 6 Machine learning model accurately distinguish SLE. (A) The performance of distinguish SLE using scRNA-seq data of PBMCs (AUC = 0.776 ± 0.097). (B) The performance of distinguish SLE using bulk RNA-seq data of PBMCs (AUC = 0.998 ± 0.004). (C, D) Bar plot for the corresponding feature importance within the correlated model using scRNA-seq and bulk RNA-seq data, respectively. The bar length: feature importance.
It is reported that chronic autoimmune diseases including SLE and RA might share some similar cellular pathogeneses with MS (50). Thus, we investigated whether our machine learning model could efficiently distinguish RA and MS based on bulk RNA-seq data. Three datasets were included in this study, including a set of PBMC datasets (GSE90081, GSE183204) with 12 RA patients and 24 healthy donors, a synovial tissue dataset (GSE89408) with 152 RA patients and 28 healthy donors, and a PBMC dataset (GSE159225) with 20 relapse-and-remission MS patients, 10 secondary progressive MS patients, and 20 healthy donors.
Surprisingly, our machine learning model could separate patients with RA/MS and healthy donors with excellent accuracy in RA patients (AUC = 0.967 ± 0.099 in RA PBMC datasets, Figure 7A; AUC = 0.997 ± 0.006 in the RA synovial dataset, Figure 7C). For MS patients, our figure rendered an acceptable accuracy (AUC = 0.775 ± 0.236 in MS PBMC datasets, Figure 7E). The corresponding feature importance shown in Figures 7B, D, F illustrated that although our gene sets have extensive applicability and great accuracy for these diseases, each gene has different importance across each of these diseases. It suggested that our machine learning model requires a fine adjustment when applied to these diseases.
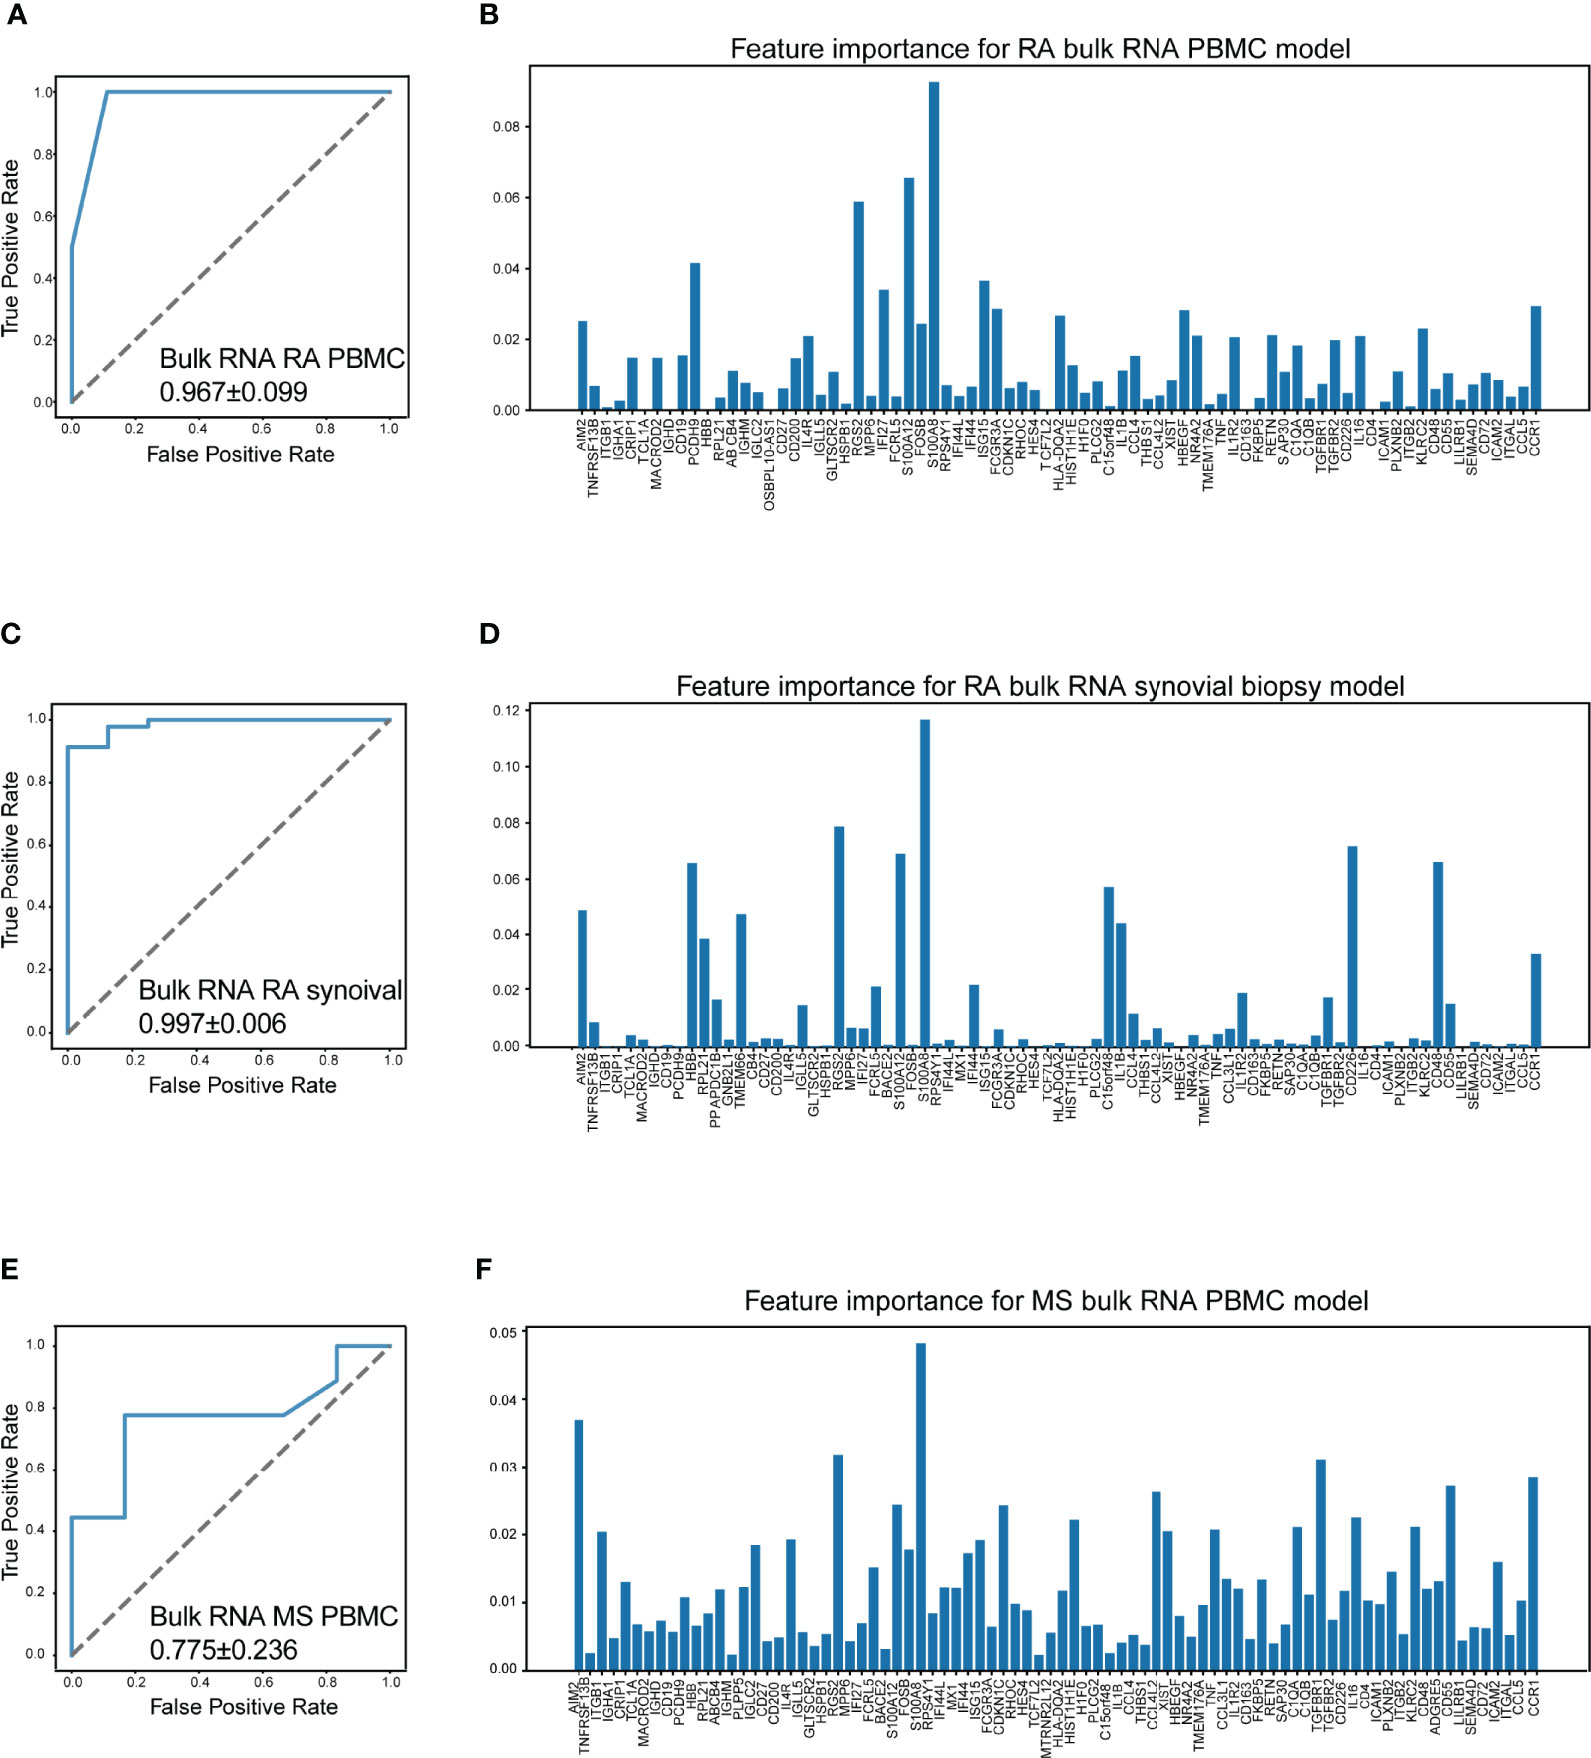
Figure 7 Machine learning model accurately distinguish RA and MS. (A) The performance of distinguish RA (rheumatoid arthritis) using bulk RNA-seq data of PBMCs (AUC = 0.967 ± 0.099). (B) Bar plot for the feature importance with the correlated model. (C) The performance of distinguish RA using bulk RNA-seq data of synovial tissue (AUC = 0.997 ± 0.006). (D) Bar plot for the feature importance with the correlated model. (E) The performance of distinguish MS (multiple sclerosis) using bulk RNA-seq data of PBMCs (AUC = 0.775 ± 0.236). (F) Bar plot for the feature importance with the correlated model. The bar length: feature importance.
To determine the contribution of positive signals to the accuracy of our machine learning model, we obtain a public bulk RNA-seq dataset (GSE137143, 122 MS patients and 22 healthy donors), which consists of only CD14-positive monocytes. Unfortunately, the AUC value dropped to 0.673 ± 0.136, indicating that the accuracy sharply decreased (Figure S4). This result suggested that the distinguishing power of our model was reduced on account of a loss of positive signals, for example, the signals from B cells.
Diagnostic Accuracy Validation of the Machine Learning Model
To evaluate the diagnosis accuracy of our machine learning model, an independent cohort containing 120 SLE patients (GSE164457) and 41 healthy donors (derived from GSE169687) were enrolled into the study. The basic information and the gene expression pattern of objects within this cohort are shown in Figures 8A, C. Notably, the precision rate of our machine learning model diagnosis was 100% (120/120) and 92.7% (38/41) for SLE patients and healthy donors, respectively (Figure 8B). This result confirmed the diagnostic accuracy of our machine learning model, which suggested that it may be feasible to develop into an efficient tool for accurate disease diagnosis in the future.
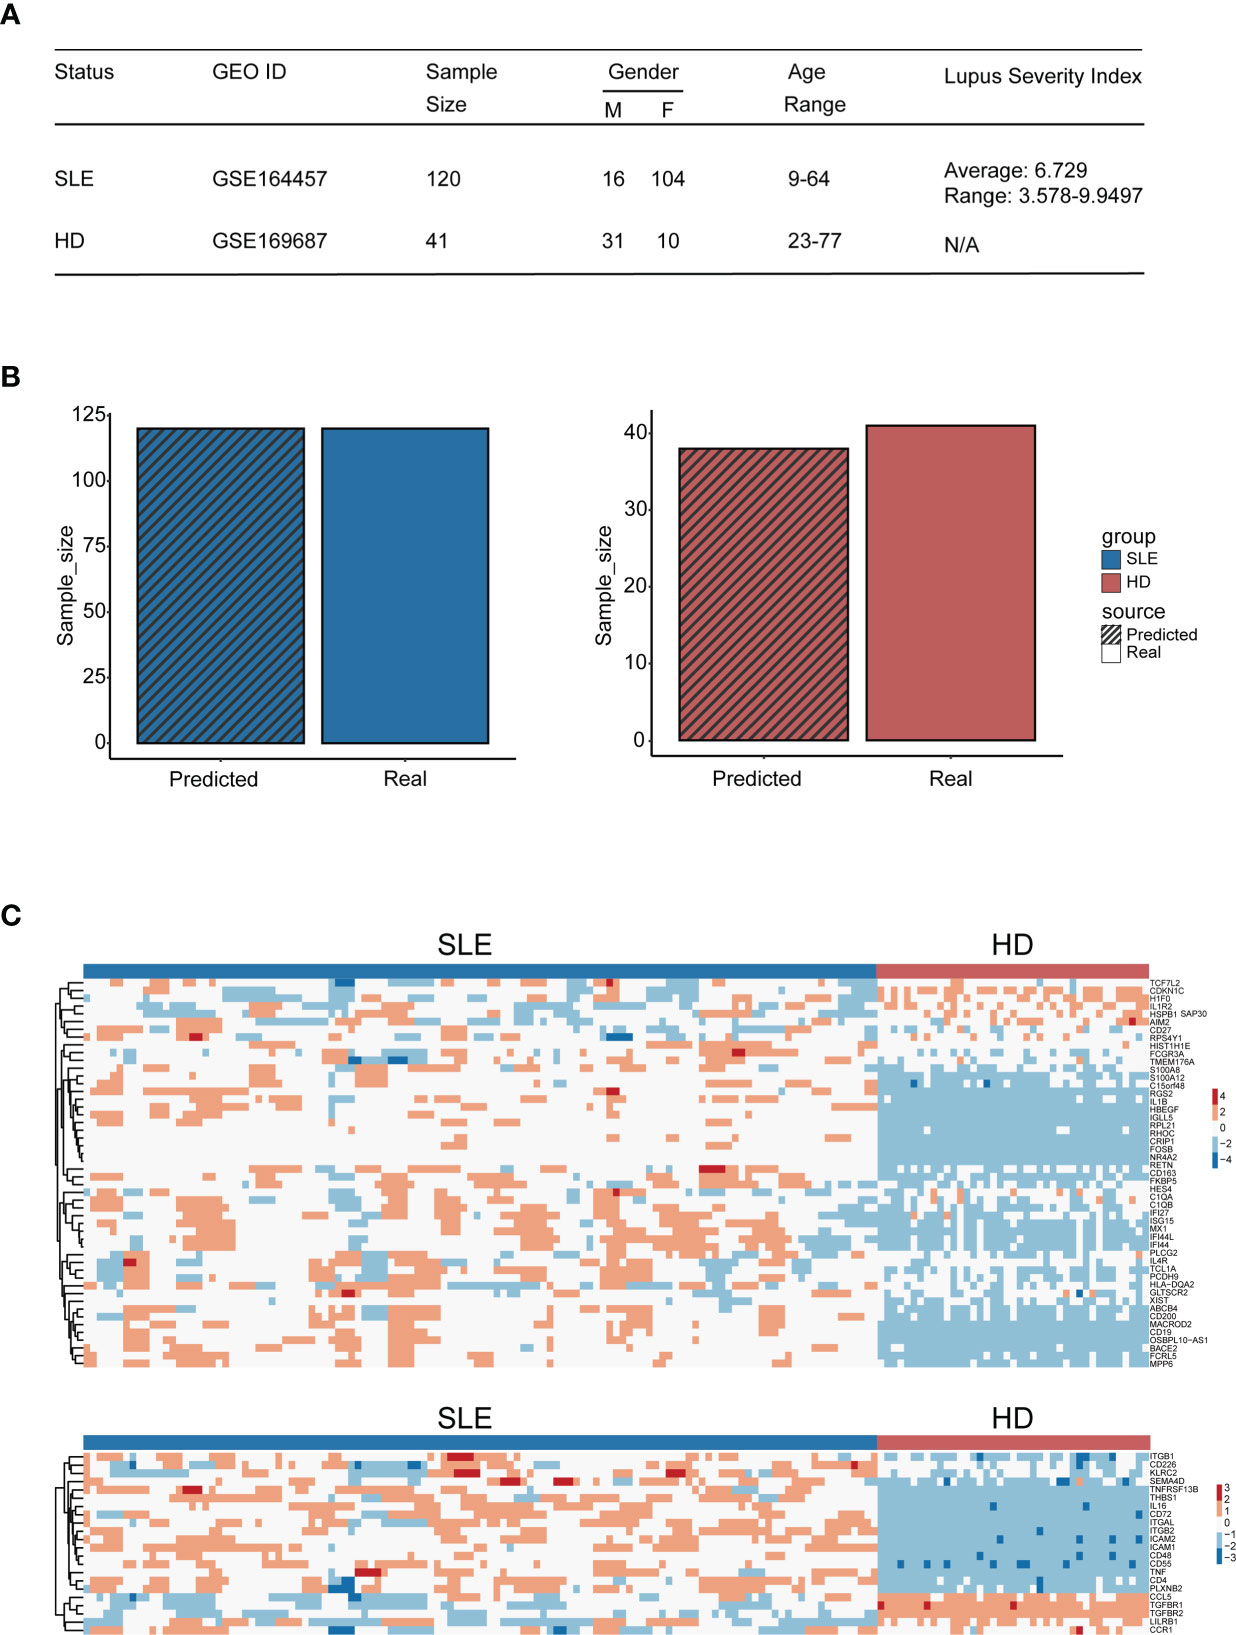
Figure 8 Diagnostic accuracy validation of the machine learning model. (A) Table of cohort basic information. (B) Bar plot of the amount of SLE patients and healthy donors being distinguished accurately by the model (blue: SLE patients, red: HD); the bar with black stripe represents the model-predicted number, while the other represents the real number. (C) Heatmap of genes used for machine learning setup within the validation cohort (the upper panel: genes derived from the differential expression gene identification within integration analysis, the lower panel: genes derived from CellChat analysis).
Discussion
We aimed to develop a feasible strategy for distinguishing patients with SLE and other major chronic autoimmune diseases in the early stage from healthy people. To achieve our purpose, the most crucial information that characterizes diseases should be filtered out first. From public single-cell RNA sequencing datasets, we found that B cells and monocytes were the only two subpopulations containing SLE-dominated clusters in the PBMCs of patients, which suggested that they might carry much stronger signals that indicate SLE than other PBMC subpopulations. To date, conclusions about the contribution of PBMC subpopulations to the development of SLE and other autoimmune diseases are not consistent, even when based on single-cell RNA sequencing data (51–55). Most studies mainly focus on specific disease aspects, which might result in imbalanced data selection, background noise interference, and biased conclusions. Hence, we selected the single-cell RNA sequencing data from over 1.50 × 10⁵ cells for each category with a balanced ratio between patients and controls (approximately 1:1) to avoid rushing into any prejudicial conclusions.
Further investigation of differentially expressed genes revealed the details of the most significant information that marks a disease within B cells and monocytes. A few interferon-stimulated genes were active in the SLE-dominated B cells and monocytes, indicating that these cells might be a consequence of the inflammatory microenvironment. It is well known that the inflammatory microenvironment may be crucial to the progression of SLE and other chronic autoimmune diseases. Tsokos et al. reported that the production of autoantibodies triggered by both the innate and adaptive immune responses against self-antigens in SLE patients resulted in the accumulation of monocytes and activation of lymphocytes (56). Our results confirmed this suggestion. Interestingly, we found an activated naïve cluster of B cells in the SLE-dominated clusters. Recently, Jenks et al. reported a distinctive differentiation fate of autoreactive naïve B cells (39). This was similar to our finding and suggested that B cells should play an important role in the development of SLE.
All of the PBMC subpopulations were influenced mutually in the progression of chronic autoimmune diseases, and analyses based on individual subpopulations may lose important information of reciprocities that accounts for disease progression. Most current scRNA-seq data analysis tools focus on detailed categorizations and trajectories of cells (28, 57–59). Recently, bioinformatic tools (e.g., CellChat, CellPhoneDB, iTALK) were developed to infer cellular cross talking from scRNA-seq data, which make it possible to decipher reciprocities among cells under a single-cell level (57, 60–62). Therefore, we carried out cellular cross-talking analyses to reveal dynamic interactions across PBMC subpopulations and systematically decipher the etiology of diseases. Surprisingly, we found that the interactions among the PBMC subpopulations of SLE patients were weakened. It was reported that monocytes might contribute to the hyperactivity of B cells in SLE patients (63). A study also revealed that monocytes may function as a bridge during RA pathogenesis, and colocalization of CD14+ cells with CD4+ T effectors was found at sites of the inflamed rheumatoid synovium (64). Together, these reports illustrate that immune cells weave a network and that their interaction would provide significant information for autoimmune disease pathogenesis. Further detailed analysis revealed that the major changes occurred in B cells or monocytes, including FLT3, CD48, TNF, and TGF-beta signal patterns that have been reported to have a negative correlation with SLE development (41–44). Our results were consistent with previous studies on the variations in B cells (65–67) and monocytes (68–70) in SLE. Considering the repeatable results gained from our study, it should be convincing that the interactions among the PBMC subpopulations of SLE patients may be weakened, which could result in abnormal emergences or variations in signaling patterns within PBMCs.
Based on our finding of powerful information that characterizes diseases, we tried to establish a machine learning model to distinguish chronic autoimmune diseases. Several reports have proven that the random forest (RF) machine learning method would give a high accuracy in disease classification when abundant features were included (71, 72), and another reason for the random forest model was its interpretability—each gene contribution in the RF machine learning model was visible. Our area under curve (AUC) score for SLE indicates that our machine learning model has the potential to become an efficient tool for accurate diagnosis of SLE at the single-cell RNA level. Considering that the information we identified was not specific to the early stage of the disease, further optimization should be performed to identify the sensitive information in the early stage of the disease to strengthen the diagnostic power of our machine learning model.
Further investigation is also needed to evaluate the efficiency of our machine learning model using bulk RNA-sequencing data. Our AUC score illustrates that although other immune cell background noise might be introduced into RNA-seq data, the gene set still has high accuracy in distinguishing patients with the disease from healthy donors. This might be attributed to the low correlation between each gene since they were derived from the two different analysis frameworks, and this low gene correlation in turn increased the random forest model accuracy (73). Given the cost and convenience of bulk RNA sequencing, our results suggested that this machine learning model should be highly applicable going forward. In addition, our classification results for bulk RNA sequencing data of PBMCs and synovial tissues derived from RA and MS patients indicated that this machine learning model also showed high accuracy in distinguishing these diseases. Numerous studies have reported that chronic autoimmune diseases, such as SLE, RA, and MS, might share some similar cellular pathogeneses (46, 50, 74). Our findings further confirmed this viewpoint and suggested that this machine learning model with the information we filtered out might be powerful enough to discriminate patients with common chronic autoimmune diseases from healthy donors, not just SLE patients.
Data Availability Statement
The datasets presented in this study can be found in online repositories. The names of the repository/repositories and accession number(s) can be found in the article/Supplementary Material.
Author Contributions
Author contributions are shown as follows. Conception and design: AX, YM, and WH. Acquisition of data: XX, YQ. Analysis and interpretation of data: TW, LZ, JC and YM. Writing, review, and/or revision of the manuscript: all authors. All authors contributed to the article and approved the submitted version.
Funding
This work was supported by the National Natural Science Foundation of China (81730005), the National Key Research and Development Program of China, Stem Cell and Translational Research (2018YFA0107203), the National Natural Science Foundation of China (32130046) and the National Natural Science Foundation of China (81970222) and the Key Scientific and Technological Projects of Guangdong Province (2016B0-90918040, 2017B020230004).
Conflict of Interest
The authors declare that the research was conducted in the absence of any commercial or financial relationships that could be construed as a potential conflict of interest.
Publisher’s Note
All claims expressed in this article are solely those of the authors and do not necessarily represent those of their affiliated organizations, or those of the publisher, the editors and the reviewers. Any product that may be evaluated in this article, or claim that may be made by its manufacturer, is not guaranteed or endorsed by the publisher.
Acknowledgments
The authors thanks Prof. Min Zhang of The First Affiliated Hospital, Sun Yat-sen University for manuscript revision.
Supplementary Material
The Supplementary Material for this article can be found online at: https://www.frontiersin.org/articles/10.3389/fimmu.2022.870531/full#supplementary-material
References
1. Giacomelli R, Gorla R, Trotta F, Tirri R, Grassi W, Bazzichi L, et al. Quality of Life and Unmet Needs in Patients With Inflammatory Arthropathies: Results From the Multicentre, Observational Rapsodia Study. Rheumatology (2014) 54(5):792–7. doi: 10.1093/rheumatology/keu
2. Thamer M, Hernán MA, Zhang Y, Cotter D, Petri M. Prednisone, Lupus Activity, and Permanent Organ Damage. J Rheumatol (2009) 36(3):560–4. doi: 10.3899/jrheum.080828
3. Trapp BD, Peterson J, Ransohoff RM, Rudick R, Mörk S, Bö L. Axonal Transection in the Lesions of Multiple Sclerosis. N Engl J Med (1998) 338(5):278–85. doi: 10.1056/nejm199801293380502
4. Batelaan NM, Bosman RC, Muntingh A, Scholten WD, Huijbregts KM, van Balkom A. Risk of Relapse After Antidepressant Discontinuation in Anxiety Disorders, Obsessive-Compulsive Disorder, and Post-Traumatic Stress Disorder: Systematic Review and Meta-Analysis of Relapse Prevention Trials. BMJ (Clinical Res ed) (2017) 358:j3927. doi: 10.1136/bmj.j3927
5. Kalincik T. Multiple Sclerosis Relapses: Epidemiology, Outcomes and Management. A Systematic Review Neuroepidemiol (2015) 44(4):199–214. doi: 10.1159/000382130
6. Arnaud L, Tektonidou MG. Long-Term Outcomes in Systemic Lupus Erythematosus: Trends Over Time and Major Contributors. Rheumatol (Oxford England) (2020) 59(Suppl5):v29–38. doi: 10.1093/rheumatology/keaa382
7. Doria A, Zen M, Canova M, Bettio S, Bassi N, Nalotto L, et al. Sle Diagnosis and Treatment: When Early Is Early. Autoimmun Rev (2010) 10(1):55–60. doi: 10.1016/j.autrev.2010.08.014
8. Sokka T, Kautiainen H, Pincus T, Verstappen SMM, Aggarwal A, Alten R, et al. Work Disability Remains a Major Problem in Rheumatoid Arthritis in the 2000s: Data From 32 Countries in the Quest-Ra Study. Arthritis Res Ther (2010) 12(2):R42. doi: 10.1186/ar2951
9. Cross M, Smith E, Hoy D, Carmona L, Wolfe F, Vos T, et al. The Global Burden of Rheumatoid Arthritis: Estimates From the Global Burden of Disease 2010 Study. Ann rheumatic Dis (2014) 73(7):1316–22. doi: 10.1136/annrheumdis-2013-204627
10. Kitas GD, Gabriel SE. Cardiovascular Disease in Rheumatoid Arthritis: State of the Art and Future Perspectives. Ann rheumatic Dis (2011) 70(1):8–14. doi: 10.1136/ard.2010.142133
11. Tamirou F, Arnaud L, Talarico R, Scirè CA, Alexander T, Amoura Z, et al. Systemic Lupus Erythematosus: State of the Art on Clinical Practice Guidelines. RMD Open (2019) 4(Suppl 1):e000793. doi: 10.1136/rmdopen-2018-000793
12. Solomon AJ, Corboy JR. The Tension Between Early Diagnosis and Misdiagnosis of Multiple Sclerosis. Nat Rev Neurol (2017) 13(9):567–72. doi: 10.1038/nrneurol.2017.106
13. De Cock D, Vanderschueren G, Meyfroidt S, Joly J, Westhovens R, Verschueren P. Two-Year Clinical and Radiologic Follow-Up of Early Ra Patients Treated With Initial Step Up Monotherapy or Initial Step Down Therapy With Glucocorticoids, Followed by a Tight Control Approach: Lessons From a Cohort Study in Daily Practice. Clin Rheumatol (2014) 33(1):125–30. doi: 10.1007/s10067-013-2398-9
14. Mosca M, Costenbader KH, Johnson SR, Lorenzoni V, Sebastiani GD, Hoyer BF, et al. How Do Patients With Newly Diagnosed Systemic Lupus Erythematosus Present? A Multicenter Cohort of Early Systemic Lupus Erythematosus to Inform the Development of New Classification Criteria. Arthritis Rheumatol (Hoboken NJ) (2019) 71(1):91–8. doi: 10.1002/art.40674
15. Brownlee WJ, Miller DH. Clinically Isolated Syndromes and the Relationship to Multiple Sclerosis. J Clin Neurosci Off J Neurosurgical Soc Australasia (2014) 21(12):2065–71. doi: 10.1016/j.jocn.2014.02.026
16. Solomon AJ, Naismith RT, Cross AH. Misdiagnosis of Multiple Sclerosis: Impact of the 2017 Mcdonald Criteria on Clinical Practice. Neurology (2019) 92(1):26–33. doi: 10.1212/wnl.0000000000006583
17. Piga M, Arnaud L. The Main Challenges in Systemic Lupus Erythematosus: Where Do We Stand? J Clin Med (2021) 10(2):243. doi: 10.3390/jcm10020243
18. Capecchi R, Puxeddu I, Pratesi F, Migliorini P. New Biomarkers in Sle: From Bench to Bedside. Rheumatology (2020) 59(Supplement_5):v12–v8. doi: 10.1093/rheumatology/keaa484
19. Rönnblom L, Leonard D. Interferon Pathway in Sle: One Key to Unlocking the Mystery of the Disease. Lupus Sci Med (2019) 6(1):e000270. doi: 10.1136/lupus-2018-000270
20. Mun S, Lee J, Park M, Shin J, Lim M-K, Kang H-G. Serum Biomarker Panel for the Diagnosis of Rheumatoid Arthritis. Arthritis Res Ther (2021) 23(1):31. doi: 10.1186/s13075-020-02405-7
21. Ziemssen T, Akgün K, Brück W. Molecular Biomarkers in Multiple Sclerosis. J Neuroinflamm (2019) 16(1):272. doi: 10.1186/s12974-019-1674-2
22. Touma Z, Gladman DD. Current and Future Therapies for Sle: Obstacles and Recommendations for the Development of Novel Treatments. Lupus Sci Med (2017) 4(1):e000239. doi: 10.1136/lupus-2017-000239
23. Pieterse E, van der Vlag J. Breaking Immunological Tolerance in Systemic Lupus Erythematosus. Front Immunol (2014) 5:164. doi: 10.3389/fimmu.2014.00164
24. Suurmond J, Diamond B. Autoantibodies in Systemic Autoimmune Diseases: Specificity and Pathogenicity. J Clin Invest (2015) 125(6):2194–202. doi: 10.1172/JCI78084
25. Stuart T, Butler A, Hoffman P, Hafemeister C, Papalexi E, Mauck WM, et al. Comprehensive Integration of Single-Cell Data. Cell (2019) 177(7):1888–902.e21. doi: 10.1016/j.cell.2019.05.031
26. Wan S, Kim J, Won KJ. Sharp: Hyperfast and Accurate Processing of Single-Cell Rna-Seq Data Via Ensemble Random Projection. Genome Res (2020) 30(2):205–13. doi: 10.1101/gr.254557.119
27. Jin S, Guerrero-Juarez CF, Zhang L, Chang I, Ramos R, Kuan C-H, et al. Inference and Analysis of Cell-Cell Communication Using Cellchat. Nat Commun (2021) 12(1):1088. doi: 10.1038/s41467-021-21246-9
28. Nehar-Belaid D, Hong S, Marches R, Chen G, Bolisetty M, Baisch J, et al. Mapping Systemic Lupus Erythematosus Heterogeneity at the Single-Cell Level. Nat Immunol (2020) 21(9):1094–106. doi: 10.1038/s41590-020-0743-0
29. He B, Thomson M, Subramaniam M, Perez R, Ye CJ, Zou J. Cloudpred: Predicting Patient Phenotypes From Single-Cell Rna-Seq. Pacific Symposium Biocomputing Pacific Symposium Biocomputing (2022) 27:337–48. doi: 10.1142/9789811250477_0031
30. Luecken MD, Büttner M, Chaichoompu K, Danese A, Interlandi M, Mueller MF, et al. Benchmarking Atlas-Level Data Integration in Single-Cell Genomics. Nat Methods (2022) 19(1):41–50. doi: 10.1038/s41592-021-01336-8
31. Gholamy A, Kreinovich V, Kosheleva O. Why 70/30 or 80/20 Relation Between Training and Testing Sets: A Pedagogical Explanation. J Intell Technol Appl (2018) 2:105–11.
32. Becht E, McInnes L, Healy J, Dutertre C-A, Kwok IW, Ng LG, et al. Dimensionality Reduction for Visualizing Single-Cell Data Using Umap. Nat Biotechnol (2019) 37(1):38–44. doi: 10.1038/nbt.4314
33. Blondel VD, Guillaume J-L, Lambiotte R, Lefebvre E. Fast Unfolding of Communities in Large Networks. J Stat mechanics: Theory experiment (2008) 2008(10):P10008. doi: 10.1088/1742-5468/2008/10/P10008
34. Hetherington-Rauth M, Bea JW, Blew RM, Funk JL, Hingle MD, Lee VR, et al. Relative Contributions of Lean and Fat Mass to Bone Strength in Young Hispanic and Non-Hispanic Girls. Bone (2018) 113:144–50. doi: 10.1016/j.bone.2018.05.023
35. Liu J, Berthier CC, Kahlenberg JM. Enhanced Inflammasome Activity in Systemic Lupus Erythematosus Is Mediated Via Type I Interferon-Induced Up-Regulation of Interferon Regulatory Factor 1. Arthritis Rheumatol (Hoboken NJ) (2017) 69(9):1840–9. doi: 10.1002/art.40166
36. Barbhaiya M, Liao KP. B-Cell Targeted Therapeutics in Systemic Lupus Erythematosus: From Paradox to Synergy? Ann Internal Med (2021) 174(12):1747–8. doi: 10.7326/m21-4124
37. Chiche L, Jourde-Chiche N, Whalen E, Presnell S, Gersuk V, Dang K, et al. Modular Transcriptional Repertoire Analyses of Adults With Systemic Lupus Erythematosus Reveal Distinct Type I and Type Ii Interferon Signatures. Arthritis Rheumatol (Hoboken NJ) (2014) 66(6):1583–95. doi: 10.1002/art.38628
38. Sanz I, Wei C, Jenks SA, Cashman KS, Tipton C, Woodruff MC, et al. Challenges and Opportunities for Consistent Classification of Human B Cell and Plasma Cell Populations. Front Immunol (2019) 10:2458. doi: 10.3389/fimmu.2019.02458
39. Jenks SA, Cashman KS, Zumaquero E, Marigorta UM, Patel AV, Wang X, et al. Distinct Effector B Cells Induced by Unregulated Toll-Like Receptor 7 Contribute to Pathogenic Responses in Systemic Lupus Erythematosus. Immunity (2018) 49(4):725–39.e6. doi: 10.1016/j.immuni.2018.08.015
40. Zannas AS, Jia M, Hafner K, Baumert J, Wiechmann T, Pape JC, et al. Epigenetic Upregulation of Fkbp5 by Aging and Stress Contributes to Nf-κb–Driven Inflammation and Cardiovascular Risk. Proc Natl Acad Sci (2019) 116(23):11370. doi: 10.1073/pnas.1816847116
41. Koh AE, Njoroge SW, Feliu M, Cook A, Selig MK, Latchman YE, et al. The Slam Family Member Cd48 (Slamf2) Protects Lupus-Prone Mice From Autoimmune Nephritis. J Autoimmun (2011) 37(1):48–57. doi: 10.1016/j.jaut.2011.03.004
42. Aringer M, Smolen JS. The Role of Tumor Necrosis Factor-Alpha in Systemic Lupus Erythematosus. Arthritis Res Ther (2008) 10(1):202. doi: 10.1186/ar2341
43. Rekik R, Smiti Khanfir M, Larbi T, Zamali I, Beldi-Ferchiou A, Kammoun O, et al. Impaired Tgf-β Signaling in Patients With Active Systemic Lupus Erythematosus Is Associated With an Overexpression of Il-22. Cytokine (2018) 108:182–9. doi: 10.1016/j.cyto.2018.04.011
44. Yuan X, Qin X, Wang D, Zhang Z, Tang X, Gao X, et al. Mesenchymal Stem Cell Therapy Induces Flt3l and Cd1c+ Dendritic Cells in Systemic Lupus Erythematosus Patients. Nat Commun (2019) 10(1):2498. doi: 10.1038/s41467-019-10491-8
45. Zhu H, Mi W, Luo H, Chen T, Liu S, Raman I, et al. Whole-Genome Transcription and DNA Methylation Analysis of Peripheral Blood Mononuclear Cells Identified Aberrant Gene Regulation Pathways in Systemic Lupus Erythematosus. Arthritis Res Ther (2016) 18(1):162. doi: 10.1186/s13075-016-1050-x
46. Ma W-T, Gao F, Gu K, Chen D-K. The Role of Monocytes and Macrophages in Autoimmune Diseases: A Comprehensive Review. Front Immunol (2019) 10:1140. doi: 10.3389/fimmu.2019.01140
47. Tsubata T. Cd72 Is a Negative Regulator of B Cell Responses to Nuclear Lupus Self-Antigens and Development of Systemic Lupus Erythematosus. Immune Netw (2019) 19(1):e1–e. doi: 10.4110/in.2019.19.e1
48. Kis-Toth K, Comte D, Karampetsou MP, Kyttaris VC, Kannan L, Terhorst C, et al. Selective Loss of Signaling Lymphocytic Activation Molecule Family Member 4-Positive Cd8+ T Cells Contributes to the Decreased Cytotoxic Cell Activity in Systemic Lupus Erythematosus. Arthritis Rheumatol (Hoboken NJ) (2016) 68(1):164–73. doi: 10.1002/art.39410
49. Mak A, Thornhill SI, Lee HY, Lee B, Poidinger M, Connolly JE, et al. Brief Report: Decreased Expression of Cd244 (Slamf4) on Monocytes and Platelets in Patients With Systemic Lupus Erythematosus. Clin Rheumatol (2018) 37(3):811–6. doi: 10.1007/s10067-017-3698-2
50. Lee DSW, Rojas OL, Gommerman JL. B Cell Depletion Therapies in Autoimmune Disease: Advances and Mechanistic Insights. Nat Rev Drug Discovery (2021) 20(3):179–99. doi: 10.1038/s41573-020-00092-2
51. Trzupek D, Lee M, Hamey F, Wicker LS, Todd JA, Ferreira RC. Single-Cell Multi-Omics Analysis Reveals Ifn-Driven Alterations in T Lymphocytes and Natural Killer Cells in Systemic Lupus Erythematosus. Wellcome Open Research (2021) 6(149):149. doi: 10.12688/wellcomeopenres.16883.1
52. Dutertre CA, Becht E, Irac SE, Khalilnezhad A, Narang V, Khalilnezhad S, et al. Single-Cell Analysis of Human Mononuclear Phagocytes Reveals Subset-Defining Markers and Identifies Circulating Inflammatory Dendritic Cells. Immunity (2019) 51(3):573–89.e8. doi: 10.1016/j.immuni.2019.08.008
53. McHugh J. Newly Defined Pro-Inflammatory Dc Subset Expanded in Sle. Nat Rev Rheumatol (2019) 15(11):637–. doi: 10.1038/s41584-019-0311-x
54. Nakano M, Iwasaki Y, Fujio K. Transcriptomic Studies of Systemic Lupus Erythematosus. Inflammation Regeneration (2021) 41(1):11. doi: 10.1186/s41232-021-00161-y
55. Kondo Y, Yokosawa M, Kaneko S, Furuyama K, Segawa S, Tsuboi H, et al. Review: Transcriptional Regulation of Cd4+ T Cell Differentiation in Experimentally Induced Arthritis and Rheumatoid Arthritis. Arthritis Rheumatol (Hoboken NJ) (2018) 70(5):653–61. doi: 10.1002/art.40398
56. Tsokos GC, Lo MS, Costa Reis P, Sullivan KE. New Insights Into the Immunopathogenesis of Systemic Lupus Erythematosus. Nat Rev Rheumatol (2016) 12(12):716–30. doi: 10.1038/nrrheum.2016.186
57. Jin W, Yang Q, Peng Y, Yan C, Li Y, Luo Z, et al. Single-Cell Rna-Seq Reveals Transcriptional Heterogeneity and Immune Subtypes Associated With Disease Activity in Human Myasthenia Gravis. Cell Discov (2021) 7(1):85. doi: 10.1038/s41421-021-00314-w
58. Heng JS, Hackett SF, Stein-O’Brien GL, Winer BL, Williams J, Goff LA, et al. Comprehensive Analysis of a Mouse Model of Spontaneous Uveoretinitis Using Single-Cell Rna Sequencing. Proc Natl Acad Sci (2019) 116(52):26734. doi: 10.1073/pnas.1915571116
59. Zakharov PN, Hu H, Wan X, Unanue ER. Single-Cell Rna Sequencing of Murine Islets Shows High Cellular Complexity at All Stages of Autoimmune Diabetes. J Exp Med (2020) 217(6):e20192362. doi: 10.1084/jem.20192362
60. Li H, Gao Y, Xie L, Wang R, Duan R, Li Z, et al. Prednisone Reprograms the Transcriptional Immune Cell Landscape in Cns Autoimmune Disease. Front Immunol (2021) 12:739605. doi: 10.3389/fimmu.2021.739605
61. Li T, Shen K, Li J, Leung SWS, Zhu T, Shi Y. Glomerular Endothelial Cells Are the Coordinator in the Development of Diabetic Nephropathy. Front Med (2021) 8:655639. doi: 10.3389/fmed.2021.655639
62. Stephenson E, Reynolds G, Botting RA, Calero-Nieto FJ, Morgan MD, Tuong ZK, et al. Single-Cell Multi-Omics Analysis of the Immune Response in Covid-19. Nat Med (2021) 27(5):904–16. doi: 10.1038/s41591-021-01329-2
63. Blanco P, Palucka AK, Gill M, Pascual V, Banchereau J. Induction of Dendritic Cell Differentiation by Ifn-Alpha in Systemic Lupus Erythematosus. Sci (New York NY) (2001) 294(5546):1540–3. doi: 10.1126/science.1064890
64. Fonseca JE, Edwards JC, Blades S, Goulding NJ. Macrophage Subpopulations in Rheumatoid Synovium: Reduced Cd163 Expression in Cd4+ T Lymphocyte-Rich Microenvironments. Arthritis Rheumatism (2002) 46(5):1210–6. doi: 10.1002/art.10207
65. Faridi MH, Khan SQ, Zhao W, Lee HW, Altintas MM, Zhang K, et al. Cd11b Activation Suppresses Tlr-Dependent Inflammation and Autoimmunity in Systemic Lupus Erythematosus. J Clin Invest (2017) 127(4):1271–83. doi: 10.1172/jci88442
66. Haynes WA, Haddon DJ, Diep VK, Khatri A, Bongen E, Yiu G, et al. Integrated, Multicohort Analysis Reveals Unified Signature of Systemic Lupus Erythematosus. JCI Insight (2020) 5(4):e122312. doi: 10.1172/jci.insight.122312
67. Maeda N, Sekigawa I, Iida N, Matsumoto M, Hashimoto H, Hirose S. Relationship Between Cd4+/Cd8+ T Cell Ratio and T Cell Activation in Systemic Lupus Erythematosus. Scandinavian J Rheumatol (1999) 28(3):166–70. doi: 10.1080/03009749950154248
68. Park JK, Lee YJ, Park JS, Lee EB, Song YW. Cd47 Potentiates Inflammatory Response in Systemic Lupus Erythematosus. Cells (2021) 10(5):1151. doi: 10.3390/cells10051151
69. Sabry A, Sheashaa H, El-Husseini A, El-Dahshan K, Abdel-Rahim M, Elbasyouni SR. Intercellular Adhesion Molecules in Systemic Lupus Erythematosus Patients With Lupus Nephritis. Clin Rheumatol (2007) 26(11):1819–23. doi: 10.1007/s10067-007-0580-7
70. Rullo OJ, Tsao BP. Recent Insights Into the Genetic Basis of Systemic Lupus Erythematosus. Ann rheumatic Dis (2013) 72 Suppl 2(0 2):ii56–61. doi: 10.1136/annrheumdis-2012-202351
71. Cao Y, Wang L, Ke S, Villafuerte Gálvez JA, Pollock NR, Barrett C, et al. Fecal Mycobiota Combined With Host Immune Factors Distinguish Clostridioides Difficile Infection From Asymptomatic Carriage. Gastroenterology (2021) 160(7):2328–39.e6. doi: 10.1053/j.gastro.2021.02.069
72. Xiang J, Shi M, Fiala MA, Gao F, Rettig MP, Uy GL, et al. Machine Learning-Based Scoring Models to Predict Hematopoietic Stem Cell Mobilization in Allogeneic Donors. Blood Adv (2021) 6(7):1991–2000. doi: 10.1182/bloodadvances.2021005149
73. Fawagreh K, Gaber MM, Elyan E. Random Forests: From Early Developments to Recent Advancements. Syst Sci Control Eng (2014) 2(1):602–9. doi: 10.1080/21642583.2014.956265
Keywords: chronic autoimmune disease, accurate diagnosis, machine learning (ML), scRNA-seq, cellular cross talking
Citation: Ma Y, Chen J, Wang T, Zhang L, Xu X, Qiu Y, Xiang AP and Huang W (2022) Accurate Machine Learning Model to Diagnose Chronic Autoimmune Diseases Utilizing Information From B Cells and Monocytes. Front. Immunol. 13:870531. doi: 10.3389/fimmu.2022.870531
Received: 07 February 2022; Accepted: 22 March 2022;
Published: 20 April 2022.
Edited by:
Xu-jie Zhou, Peking University First Hospital, ChinaReviewed by:
Altuna Akalin, Helmholtz Association of German Research Centers (HZ), GermanyShibiao Wan, St. Jude Children’s Research Hospital, United States
Copyright © 2022 Ma, Chen, Wang, Zhang, Xu, Qiu, Xiang and Huang. This is an open-access article distributed under the terms of the Creative Commons Attribution License (CC BY). The use, distribution or reproduction in other forums is permitted, provided the original author(s) and the copyright owner(s) are credited and that the original publication in this journal is cited, in accordance with accepted academic practice. No use, distribution or reproduction is permitted which does not comply with these terms.
*Correspondence: Weijun Huang, hweijun@mail.sysu.edu.cn
†These authors have contributed equally to this work