 Lu Wang1
 Fankun Meng
- 1Ultrasound and Functional Diagnostic Center, Beijing Youan Hospital, Capital Medical University, Beijing, China
- 2Beijing Institute of Hepatology, Beijing Youan Hospital, Capital Medical University, Beijing, China
- 3Department of Science and Technology, Beijing Youan Hospital, Capital Medical University, Beijing, China
Numerous studies have demonstrated the important roles of epigenetic modifications in tumorigenesis, progression and prognosis. However, in hepatocellular carcinoma, the potential link between N7-methylguanosine (m7G) modification and molecular heterogeneity and tumor microenvironment (TME) remains unclear.
Method: We performed a comprehensive evaluation of m7G modification patterns in 816 hepatocellular carcinoma samples based on 24 m7G regulatory factors, identified different m7G modification patterns, and made a systematic correlation of these modification patterns with the infiltration characteristics of immunocytes. Then, we built and validated a scoring tool called m7G score.
Results: In this study, we revealed the presence of three distinct m7G modification patterns in liver cancer, with remarkable differences in the immunocyte infiltration characteristics of these three subtypes. The m7G scoring system of this study could assess m7G modification patterns in individual hepatocellular carcinoma patients, could predict TME infiltration characteristics, genetic variants and patient prognosis. We also found that the m7G scoring system may be useful in guiding patients’ clinical use of medications.
Conclusions: This study revealed that m7G methylation modifications exerted a significant role in formation of TME in hepatocellular carcinoma. Assessing the m7G modification patterns of single patients would help enhance our perception of TME infiltration characteristics and give significant insights into immunotherapy efficacy.
Introduction
Liver cancer is one of the most common malignancies worldwide, and the primary pathological type of the disease is hepatocellular carcinoma (HCC). The incidence of liver cancer is expected to exceed 1 million cases by 2025 (1). Liver cancer is the fourth leading cause of cancer-related deaths worldwide (2). Liver cancer has become one of the most challenging problems in the world due to its high incidence and mortality rate. Currently, the mainstay clinical treatments for liver cancer involve surgical resection, liver transplantation, ablation and interventional embolization therapy, etc. These traditional treatments have been made remarkable progress and been successful in the treatment of early stage liver cancer. However, as liver cancer is characterized by high invasiveness, metastasis and recurrence rate, and most of the liver cancers are in advanced stages when diagnosed, the treatment of middle and late stage liver cancer has long been a clinical challenge, and the clinical outcome of patients is still not satisfactory (3). Over the past few years, there have been numerous studies devoted to treat liver cancer with targeted drugs and immunotherapy, and significant progress has been made with molecularly targeted therapeutic agents represented by the multikinase inhibitor sorafenib. However, the 5-year survival rate of sorafenib for HCC is very poor, and the prognosis for advanced hepatocellular carcinoma remains poor with limited successful cases (4). Immunotherapy has shown impressive clinical efficacy in a small group of patients, while the majority of patients, unfortunately, have received little or no clinical benefits, falling far behind of their clinical needs (5, 6). Thus, it is urgently needed to further develop diagnostic markers and therapeutic targets in hepatocellular carcinoma. In order to develop more effective therapeutic strategies to improve the patients’ clinical prognosis, a deeper comprehension of the molecular mechanisms underlying hepatocarcinogenesis and malignant progression becomes even more essential.
During the development of chronic liver disease and cirrhosis, hepatocytes gradually accumulate a large number of genetic mutations and epigenetic changes (7), becoming a major pathogenetic basis of hepatocellular carcinoma. Numerous studies have demonstrated that epigenetic modifications play significant roles in tumorigenesis, progression, treatment, and prognosis (8, 9). RNA methylation modifications are widely present in life processes as the third level of epigenetics, and over 150 RNA modifications have been identified. The main RNA methylation modifications widely found on mammalian genes include m6A, m1A and m7G, etc (10). RNA methylation is the occurrence of methylation modifications at different locations on the RNA molecule, and these methylation modifications could regulate processes such as RNA variable splicing (11), exonucleation (12), stabilization (13), translation (14), and immunogenicity (15). When methylation modification occurs at the nitrogen atom at position 7 of the guanine of the RNA, it is described as N7-methylguanosine (m7G). In the process of post-transcriptional regulation, m7G modification is one of the commonest base modifications (16). Under normal conditions, m7G methylation modifications within human mRNA are basically concentrated in the 5’ untranslated region and in environments rich in both A and G bases, while m7G modifications improve the stability of mRNA (17, 18). The m7G methylation modification is a dynamic biological process that allows the organism to adapt to a constantly changing environment. For example, m7G can be dynamically regulated by H2O2 and heat shock treatment and then evolves to become abundant in the coding region and 3’UTR region of genes. Besides being found on mRNAs, m7G methylation modifications are present in tRNAs, miRNAs, and rRNAs (19–21).
In recent years, m7G methylation has become a rising hotspot in RNA modification research. With increased research, m7G modifications have been demonstrated to play significant roles in regulation of normal human biological processes (16, 22). And abnormal m7G methylation modifications have also been found to be closely associated with dysregulation of RNA, which may ultimately lead to disease and cancer (23). Several studies have detected the presence of m7G modifications in HCC, and m7G modifications were closely associated with the development of HCC (24–26). Chen et al. found that m7G tRNA modification and its catalase metttl1 were expressed elevated in HCC, and METTL1-mediated m7G tRNA modification could promote mRNA translation, which was shown to accelerate the development and progression of hepatocellular carcinoma and correlated with poor prognosis of hepatocellular carcinoma by in vitro and in vivo experiments (24). Xia et al. found that the RNA methyltransferase WDR4 was highly expressed in hepatocellular carcinoma, and upregulation of WDR4 expression enhanced the methylation level of m7G in hepatocellular carcinoma. WDR4 promotes tumor cells metastasis and resistance to sorafenib via epithelial-mesenchymal transition (EMT), thereby promoting the proliferation of hepatocellular carcinoma cells (27).
Tumorigenesis and progression is a multistep process which involves not only epigenetic variation in tumor cell, but also the tumor microenvironment (TME) plays essential roles in tumor development. The hepatocellular carcinoma tumor microenvironment is a dynamical system composed of cancer cell, cytokine, extracellular matrix, and immunocyte subpopulations (28), and the interactions between hepatocellular carcinoma cells and various immune components in the TME are diverse and complex. Almost all major tumor immune cells are important in TME of hepatocellular carcinoma. TME is tightly associated with the initiation, progression and metastasis stages of HCC (29). Recently, several studies have revealed that RNA methylation impacts the effectiveness of tumor therapy by modulating tumor immunity in addition to directly influencing tumor development (30–32). Nevertheless, it is unclear whether m7G methylation modifications in hepatocellular carcinoma also play a potential role in tumor microenvironment (TME) formation. A comprehensive evaluation of the variability and sophistication of TME landscape may help enhance the guidance and prediction of immunotherapeutic responses and would help to identify new therapeutic targets.
In this study, we comprehensively assessed the association of m7G modification patterns and immunocytes infiltration features by analyzing genomic information from total 816 HCC samples. We identified three m7G modification patterns with unsupervised clustering, and also found that the TME cell infiltration characteristics among these three subtypes were distinctly different. Moreover, with the consideration of the heterogeneity of m7G modification among individual patients, we formulated a score system to quantitate m7G modification patterns in individual patients and to predict the clinical response of patients to immune checkpoint inhibitor (ICI) therapy.
Materials and methods
Patient and clinical samples
A total of 10 pairs of HCC and adjacent non-cancerous tissues were collected, all from Beijing Youan Hospital. The samples were examined by three experienced pathologists.All patients provided informed consent,and the study protocol was approved by the Ethics Committee of Beijing Youan Hospital.
Immunohistochemistry
Immunohistochemical (IHC) staining was performed with NUDT16 antibody (12889-1-AP, proteintech). Immunohistochemical examination was performed by two pathologists, and positive staining cells were found to be visible in tumor and paired adjacent tissues. The IHC score was computed by the percentage of stained cells and the intensity of staining (33).
Collecting and pre-processing data
Our study workflow was illustrated in Figure 1. We downloaded RNA expression data and clinical information of HCC samples from TCGA database, GEO database and ICGC database, and RNA expression data of 50 normal liver tissue cases from TCGA database. Finally, a total of 364 tumor cases from TCGA-LIHC cohort in TCGA database, 231 tumor cases from LIRI-JP cohort in ICGC database and 221 tumor cases from GSE14520 cohort in GEO database were included. These tumor samples all have complete clinical information including survival time and status, and all have more than half of the gene expression values. For the TCGA-LIHC cohort, the downloaded FPKM values were converted into log2 (TPM+1) values. Somatic mutation data were obtained from TCGA database. The clinical characteristics of the TCGA-LIHC and GSE14520 cohorts were listed in Table S1 and Figures S1A, B. We used R (version 4. 1. 2) to analyze the data.
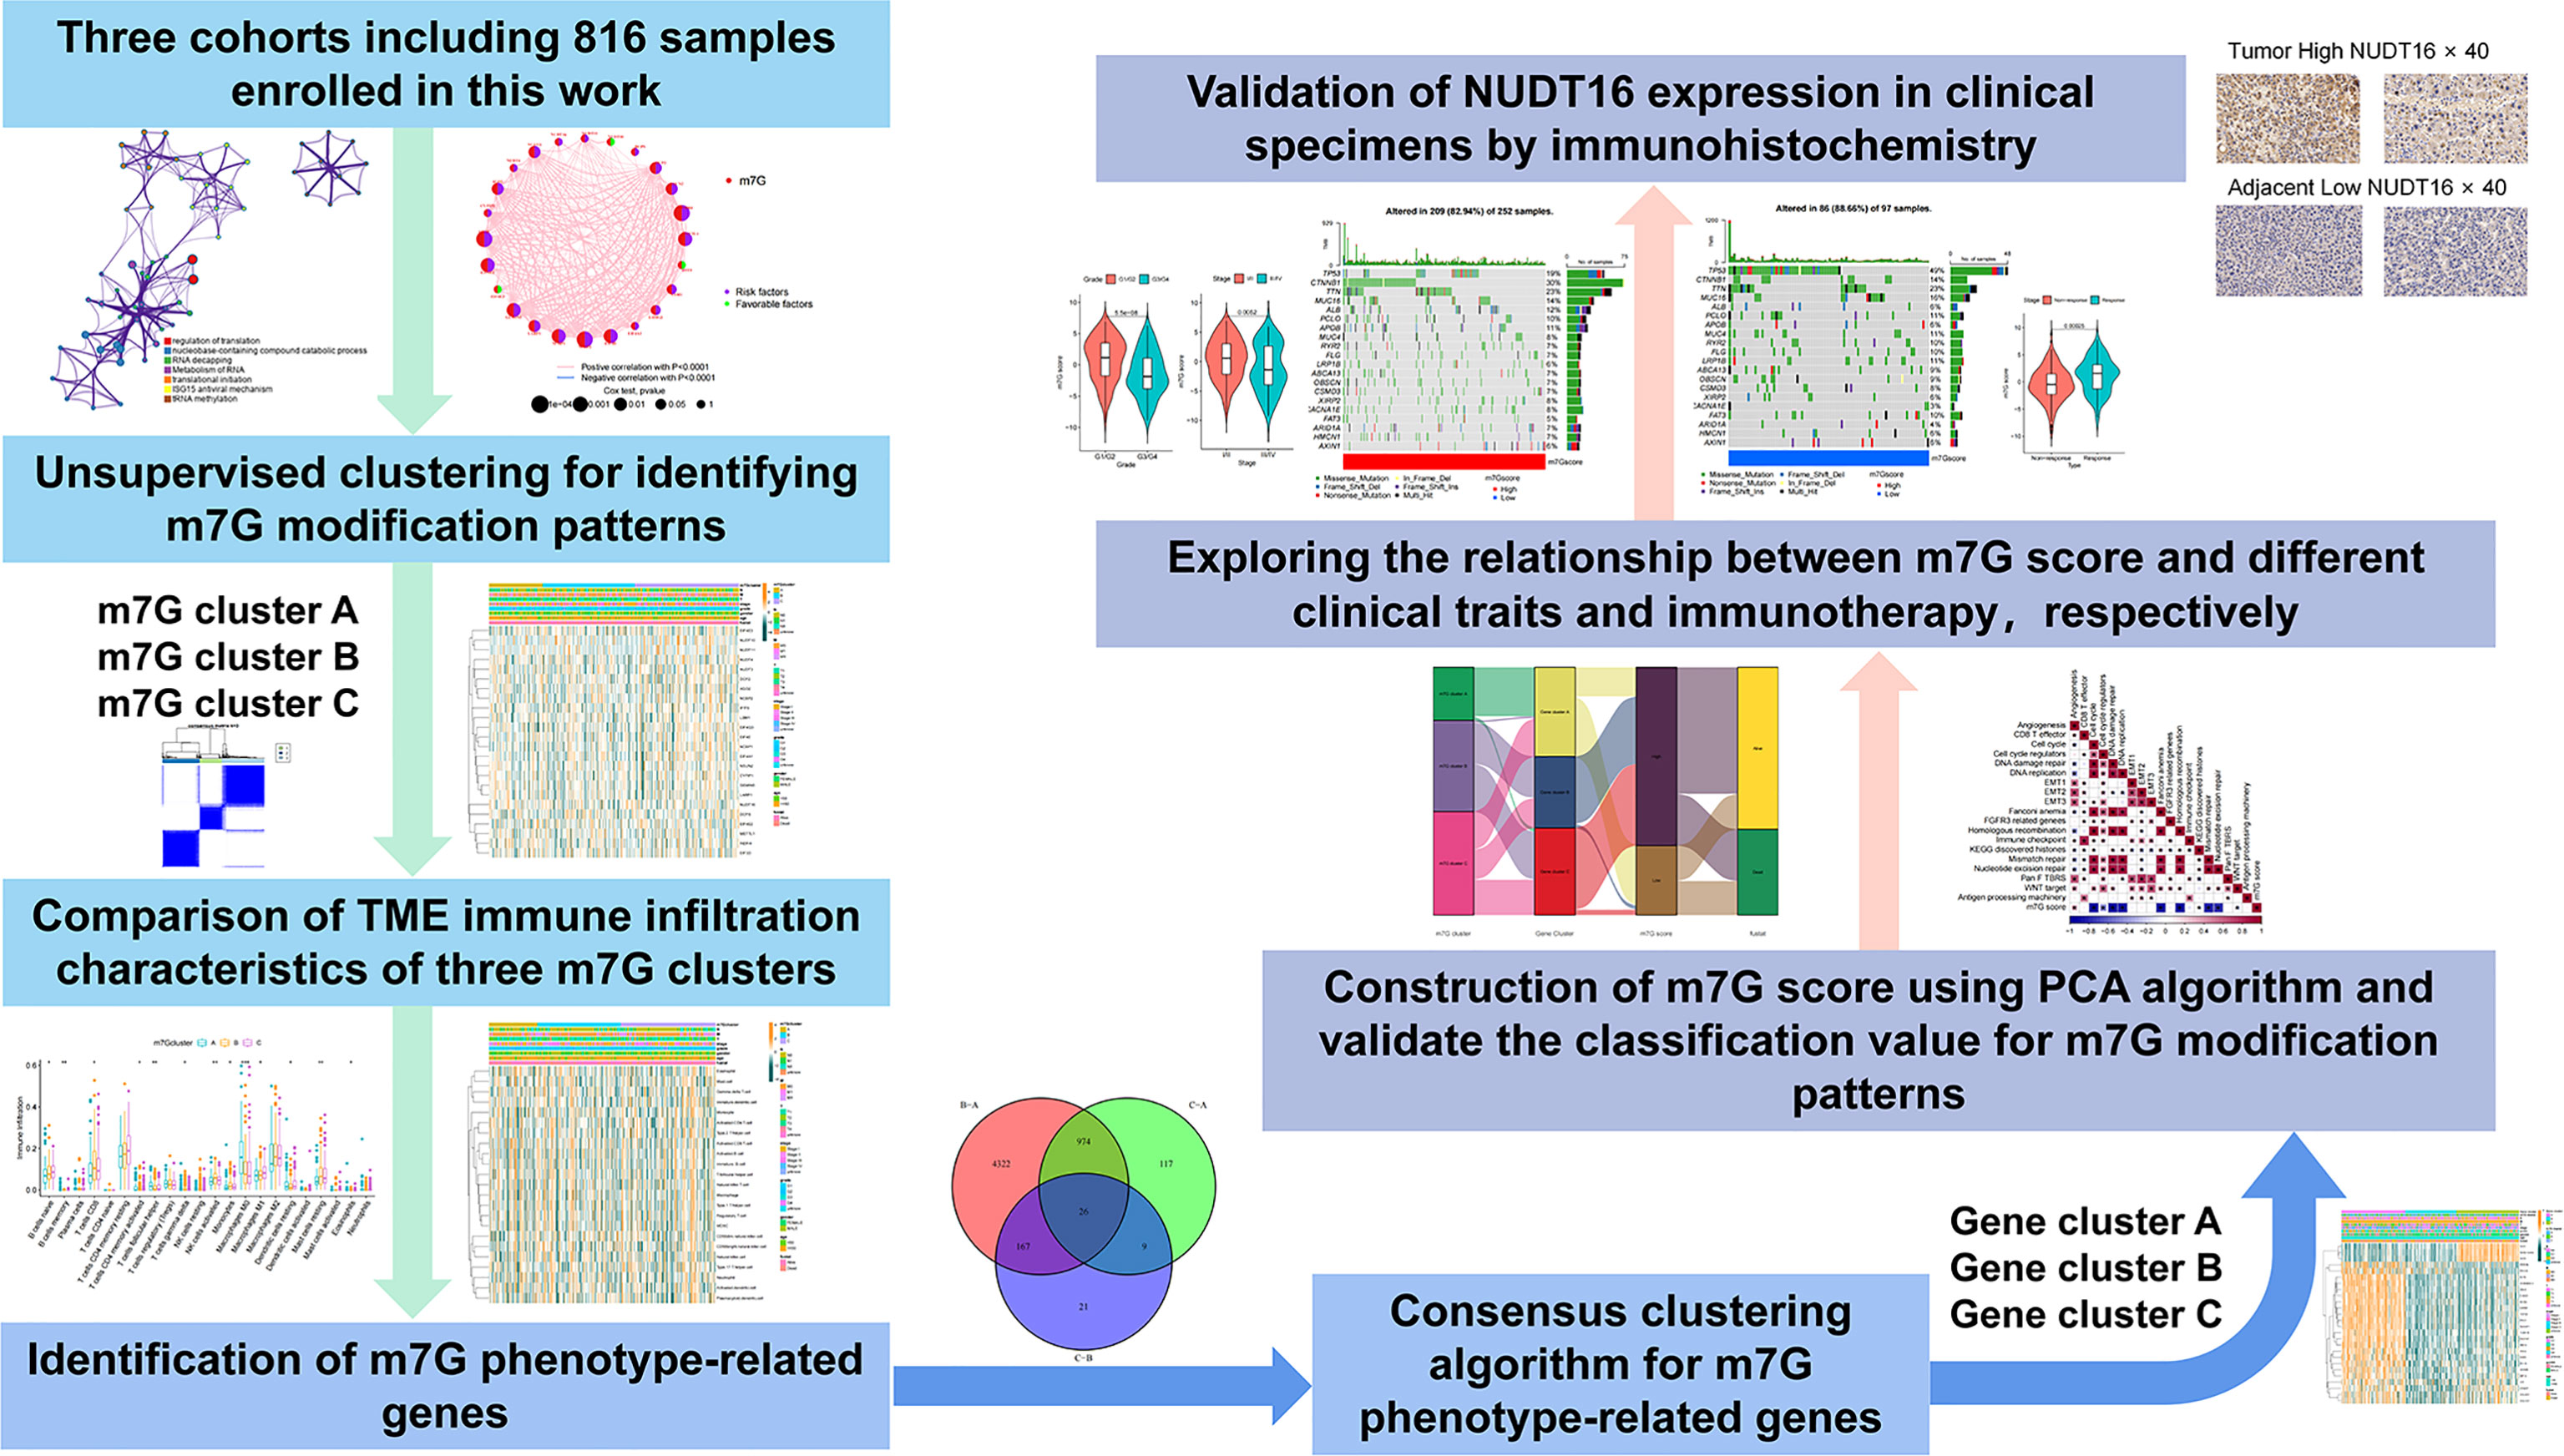
Figure 1 Overview of this work.
Identification of molecular subgroups and calculating DEGs
Through previous studies, we extracted 24 genes related to m7G. Differential expression of these 24 genes between 50 normal and 364 tumour cases from TCGA datebase was analyzed by the”limma” package in R. We extracted the expression matrix of these genes in the tumor samples in TCGA-LIHC cohort, and consensus clustering was performed using “ConsensusClusterPlus” package (34). DEGs between the three clusters were analyzed using ‘limma’ package with the cutoff criteria of |log2 fold change (FC)| > 1 and P-value< 0. 05.
Functional analyses, TIME evaluation and immunophenoscore
To analyze the functions of the shared DEGs among the above three subtypes, Gene Ontology Function was obtained using the the”clusterprofiler”package in R. We obtained the a gene set of “h.all.v7.5.1. symbols” from MSigDB. Mariathasan et al. built gene sets in which genes related to certain biological processes are stored (35). Based on the above gene set, GSVA was performed using the “GSVA” and “limma” packages to visualize alterations in signaling pathways among three subtypes (36). We used the ESTIMATE algorithm to calculate the immune score. The immunophenotype (IPS) is a better predictor of response to anti-CTLA4 and anti-PD1 regimens, and we downloaded the relevant scores from The Cancer Immunome Atlas (TCIA) for the TCGA-LIHC cohort.
Estimation of TME cell infiltration
Cohorts of 23 immune-related cells were downloaded and collated (37). 23 immune infiltrating cells in tumor samples were analyzed by ssGSEA enrichment using the “GSVA” software package. The score calculated using ssGSEA were performed to express relative abundance of different immunocytes in the samples (38).
m7G score construction
In order to quantitate the m7G modification pattern of individual tumors, we constructed a system called m7G score, which was established as follows:
We selected overlapping DEGs found in different m7G clusters. Prognostic analysis was then performed by using univariate Cox regression analysis for the above DEGs. Extraction of genes with significant prognosis was used to construct the m7G score by principal component analysis (PCA). We extracted PC1 and PC2 as signature scores. We then used a similar approach to define the m7G score as in previous studies (39, 40). m7Gscore=∑(PC1i+PC2i), i is the expression of genes associated with the m7G phenotype.
Collection of immune checkpoint blockade clinical information and gene expression
The result of a systematic search we performed was in the inclusion of an immunotherapy cohort: uroepithelial carcinoma intervening with atezolizumab (IMvigor210 cohort). The downloaded data were normalized and converted to TPM values.
Drug sensitivity analysis
We utilized the “pRRophetic” package to analyze the sensitivity to different m7G clusters to different small molecule drugs. We utilized CellMiner database to assess the association between different m7G regulators and drug sensitivity (41).
Cell culture and transfection
Human liver cancer cell line (Huh-7 and HepG2) was purchased from the American Type Culture Collection. Huh-7 cells and HepG2 cells were cultured in DMEM (Gibco) containing 10% fetal bovine serum (Gibco) and were cultured in a humidified incubator with 5% CO2 at 37°C. Si-NUDT16 (Suzhou, China, sequences-1: 5’GGUUAAUAAUAGAGAGCUAUG’3;sequences-2:5’CGACAGAUGUUGAGGAGAAUG’3) were used for transfection.
Cell adhesion assay
Add 50 µl of fibronectin (Biocoat) or vitronectin (PeproTech) to a 96-well plate (Corning) and incubate overnight at 4 degrees Celsius. The unbound fibronectin was washed off the next day and the 96-well plate was closed with 1% BSA for two hours. 10,000 cells were added to each well and cultured in DMEM (Gibco) for 2 hours. Unbound cells were washed away, fixed with 4% paraformaldehyde for 15 min and stained with 0.1% crystal violet for 15 min.
Statistical analyses
The Student’s t-test was applied to normally distributed variables and the Wilcoxon rank sum test was applied to non-normally distributed variables. The Kruskal-Wallis test and one-way ANOVA were applied for the nonparametric and parametric methods, respectively (42). Survival curves were prognostically analyzed using the Kaplan-Meier method, and log-rank tests were used to determine the significance of differences. We used a univariate Cox regression model to calculate the hazard ratios (HR) of m7G regulators and m7G phenotype-associated genes. Independent prognostic factors were identified by multivariate Cox regression models. We stratified the samples into m7G score high and low subgroups using the surv-cutpoint function in the ‘survival’ package. The specificity and sensitivity of m7G score were assessed using receiver operating characteristic (ROC) curves, and the area under the curve (AUC) was calculated using the ‘timeROC’ package. The waterfall function of maftools package was used to present the mutation landscape. We used the ‘RCircos’ package to map the copy number variation of 24 m7G regulators on 23 pairs of chromosomes. All p-values were bilateral and p-values less than 0. 05 was statistically significant.
Results
Landscape of genetic variation of m7G regulators in liver cancer
We explored the role of 24 m7G RNA methylation-regulated genes of HCC in this study (Table S2). GO enrichment and Metascape analysis were performed on 24 m7G regulators, and the result showed significantly enriched biological processes (Figure 2A; Figure S1A). We first established the incidence of somatic mutations in 24 m7G regulators in HCC. 25 (6. 9%) samples out of 364 showed genetic alterations in m7G regulators, mainly consisting of missense mutations. GEMIN5 and EIF4G3 had the highest mutation frequency, followed by CYFIP1 (Figure 2B). Further analysis of the 24 m7G regulators showed that CNV mutations were prevalent. AGO2, NCBP2, GEMIN5 and LARP1 all showed extensive CNV amplification. In contrast, EIF4G3, EIF4E, DCPS, EIF4E3, and EIF4A1 had widespread CNV deletions (Figure 2C). The CNV alteration positions of the 24 m7G regulators on the chromosomes are depicted in Figure 2D. Principal component analysis (PCA) was performed on tumor and normal samples, and 24 m7G regulators were found to thoroughly separate them (Figure 2E). Further analysis yielded that only NUDT10 and EIF4E3 were expressively down-regulated in HCC samples, while the other 22 genes were expressively up-regulated in HCC samples (Figure 2F). The expression of CNV-amplified m7G regulators was markedly higher in HCC specimens than in normal control specimens, such as AGO2, NCBP2, GEMIN5 and LARP1, while the expression of EIF4E3 was significantly lower in tumor specimens (Figures 2C, F). Furthermore, Spearman correlation analysis was used to evaluate the interregulatory effects between these m7G regulators (Figure S1B). Cox regression analysis of these m7G regulators was performed in relation to the prognosis of HCC patients (Figures S1C, D). A forestplot showed that NUDT16 was considered as a risk factor. The above analyses showed that the genomic and transcriptomic landscapes of m7G regulatory factors were linked and different in normal and HCC samples. Therefore, genetic variation and altered expression of m7G regulatory factors played significant roles in the development of HCC.
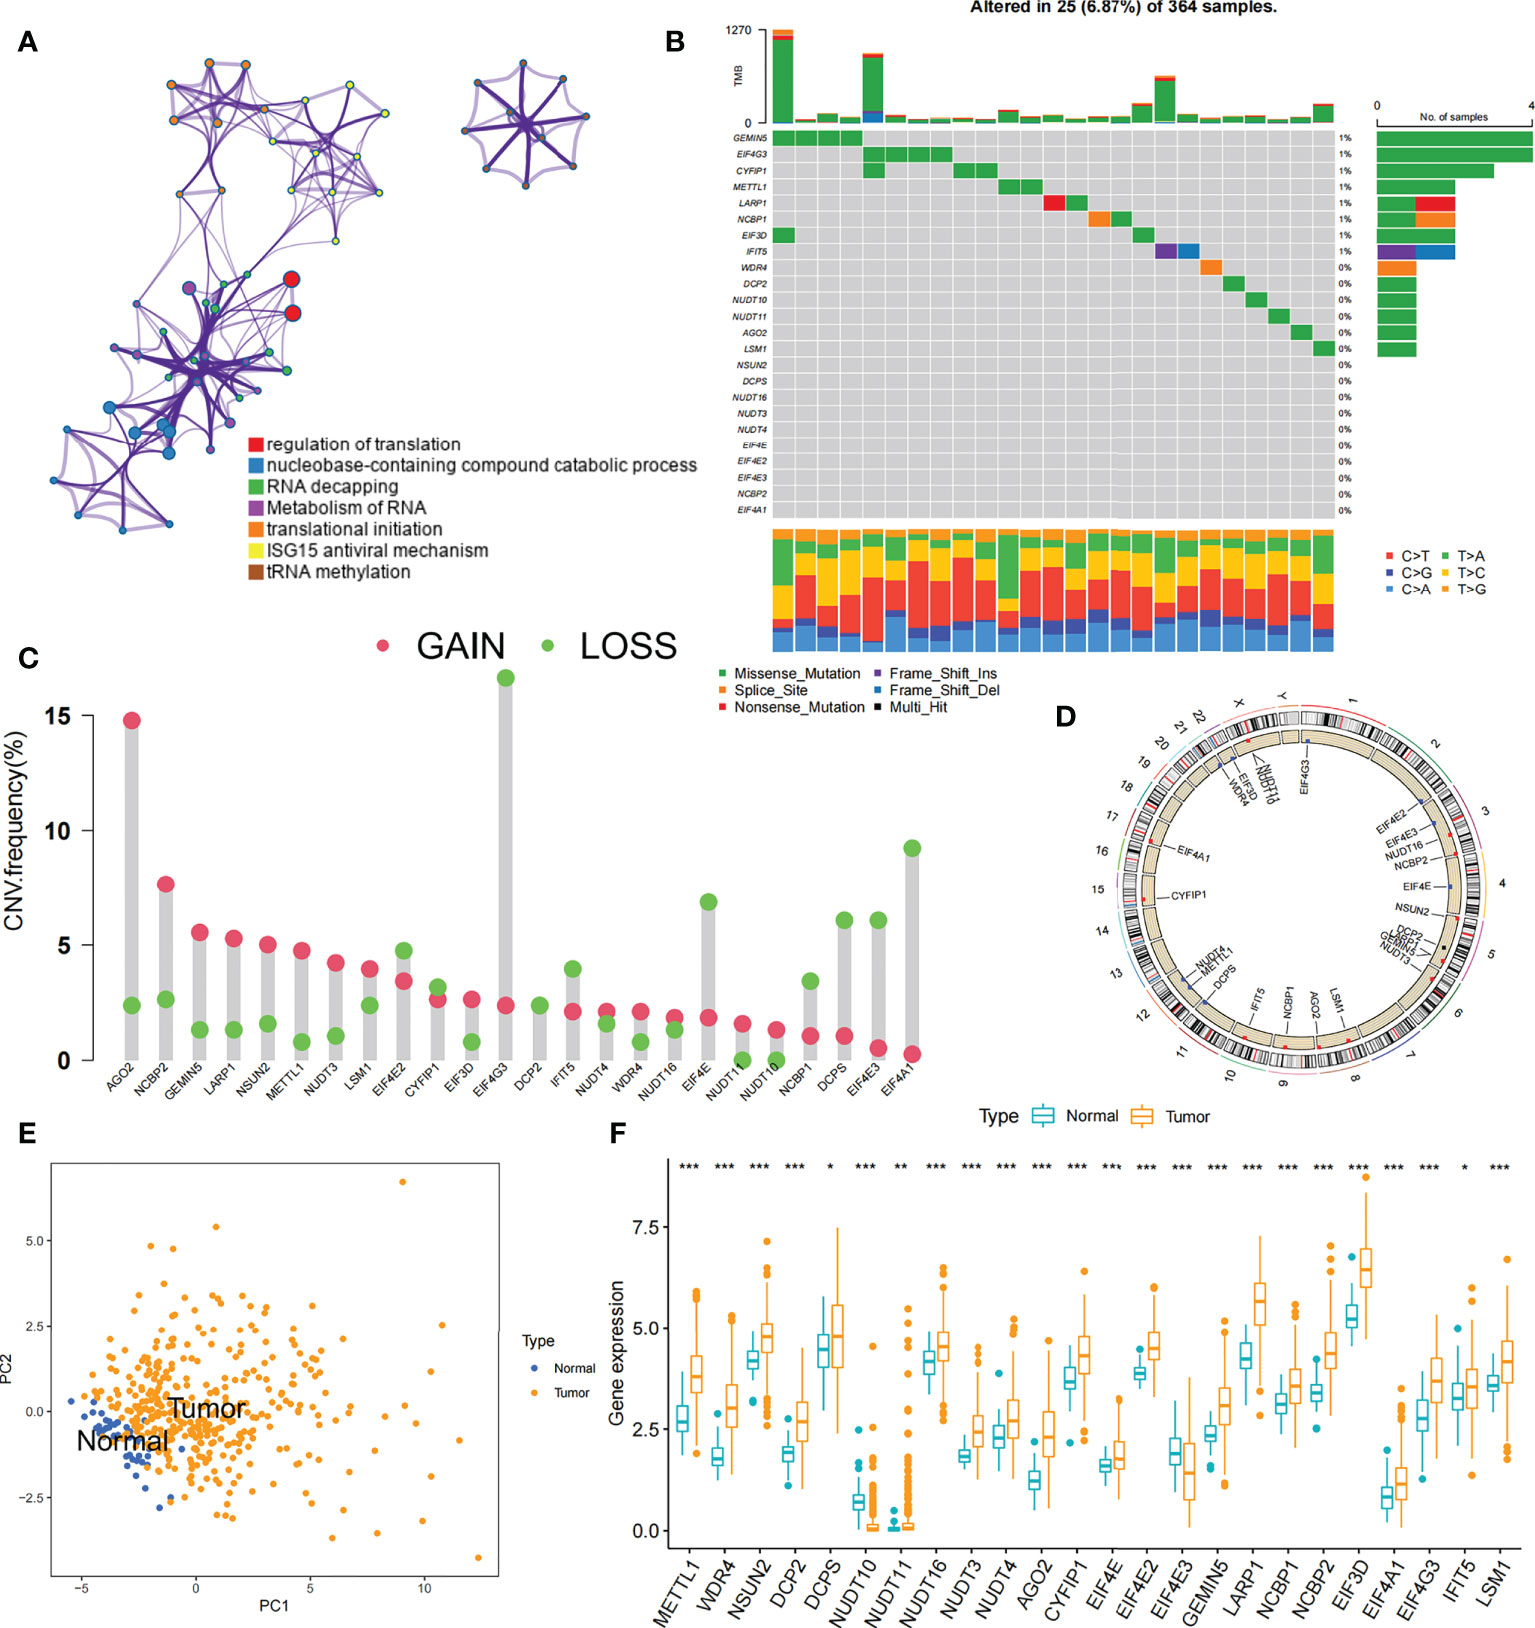
Figure 2 Profiles of genetic alterations of m7G regulators in HCC. (A) Metascape enrichment network. Clustering annotations were color-coded. (B) Among 364 HCC samples, 25 occurred genetic alterations in 24 m7G genes with a frequency of 6.87%, consisting mainly of missense mutations. The right-hand side numbers represent the frequency of mutations in individual regulators. Each column indicates a single samples. (C) The frequency of CNV mutations in 24 m7G regulators was prevalent. The column indicates alteration frequency. The amplification frequency, red dots.; The deletion frequency, green dots. (D) CNV of the m7G regulator changes position on the chromosome. (E) PCA of 24 m7G regulators that can distinguish tumor patients from normal patients. (F) Differences in mRNA expression levels of 24 m7G regulators between HCC and normal patients. Asterisks represent statistical p-values (*P< 0. 05; **P< 0. 01; ***P< 0. 001).
Identification of m7G modification patterns mediated by 24 regulators
Data of 364 samples with liver cancer in TCGA-LIHC cohort were used for analysis. In the m7G regulator network, the interactions and connections between 24 m7G regulators and their prognostic significance in HCC patients were comprehensively described. The results suggested that the intercommunication of these 24 m7G regulators may function critically for the formation of distinct m7G modification patterns and associated with cancer development and progression (Figure 3A). With these assumptions, we used unsupervised clustering to stratify samples into distinct m7G modification patterns according to these 24 m7G regulators. Accordingly, we stratified three different clusters of modified patterns, including 78 cases in cluster A, 134 cases in cluster B and 152 cases in cluster C (Table S3; Figures S2A–D). We referred to these subgroups m7G cluster A-C, among which m7G cluster B and C showed a prominent survival advantage, while m7G cluster A had the worst prognosis (Figure 3B). Furthermore, we noticed that there were remarkable differences in the expression of m7G regulators among distinct m7G modification patterns. The vast majority of genotypes were significantly elevated in the m7G cluster A subtype, such as METTL1, WDR4, DCP2, etc (Figure 3C; Figure S2E).
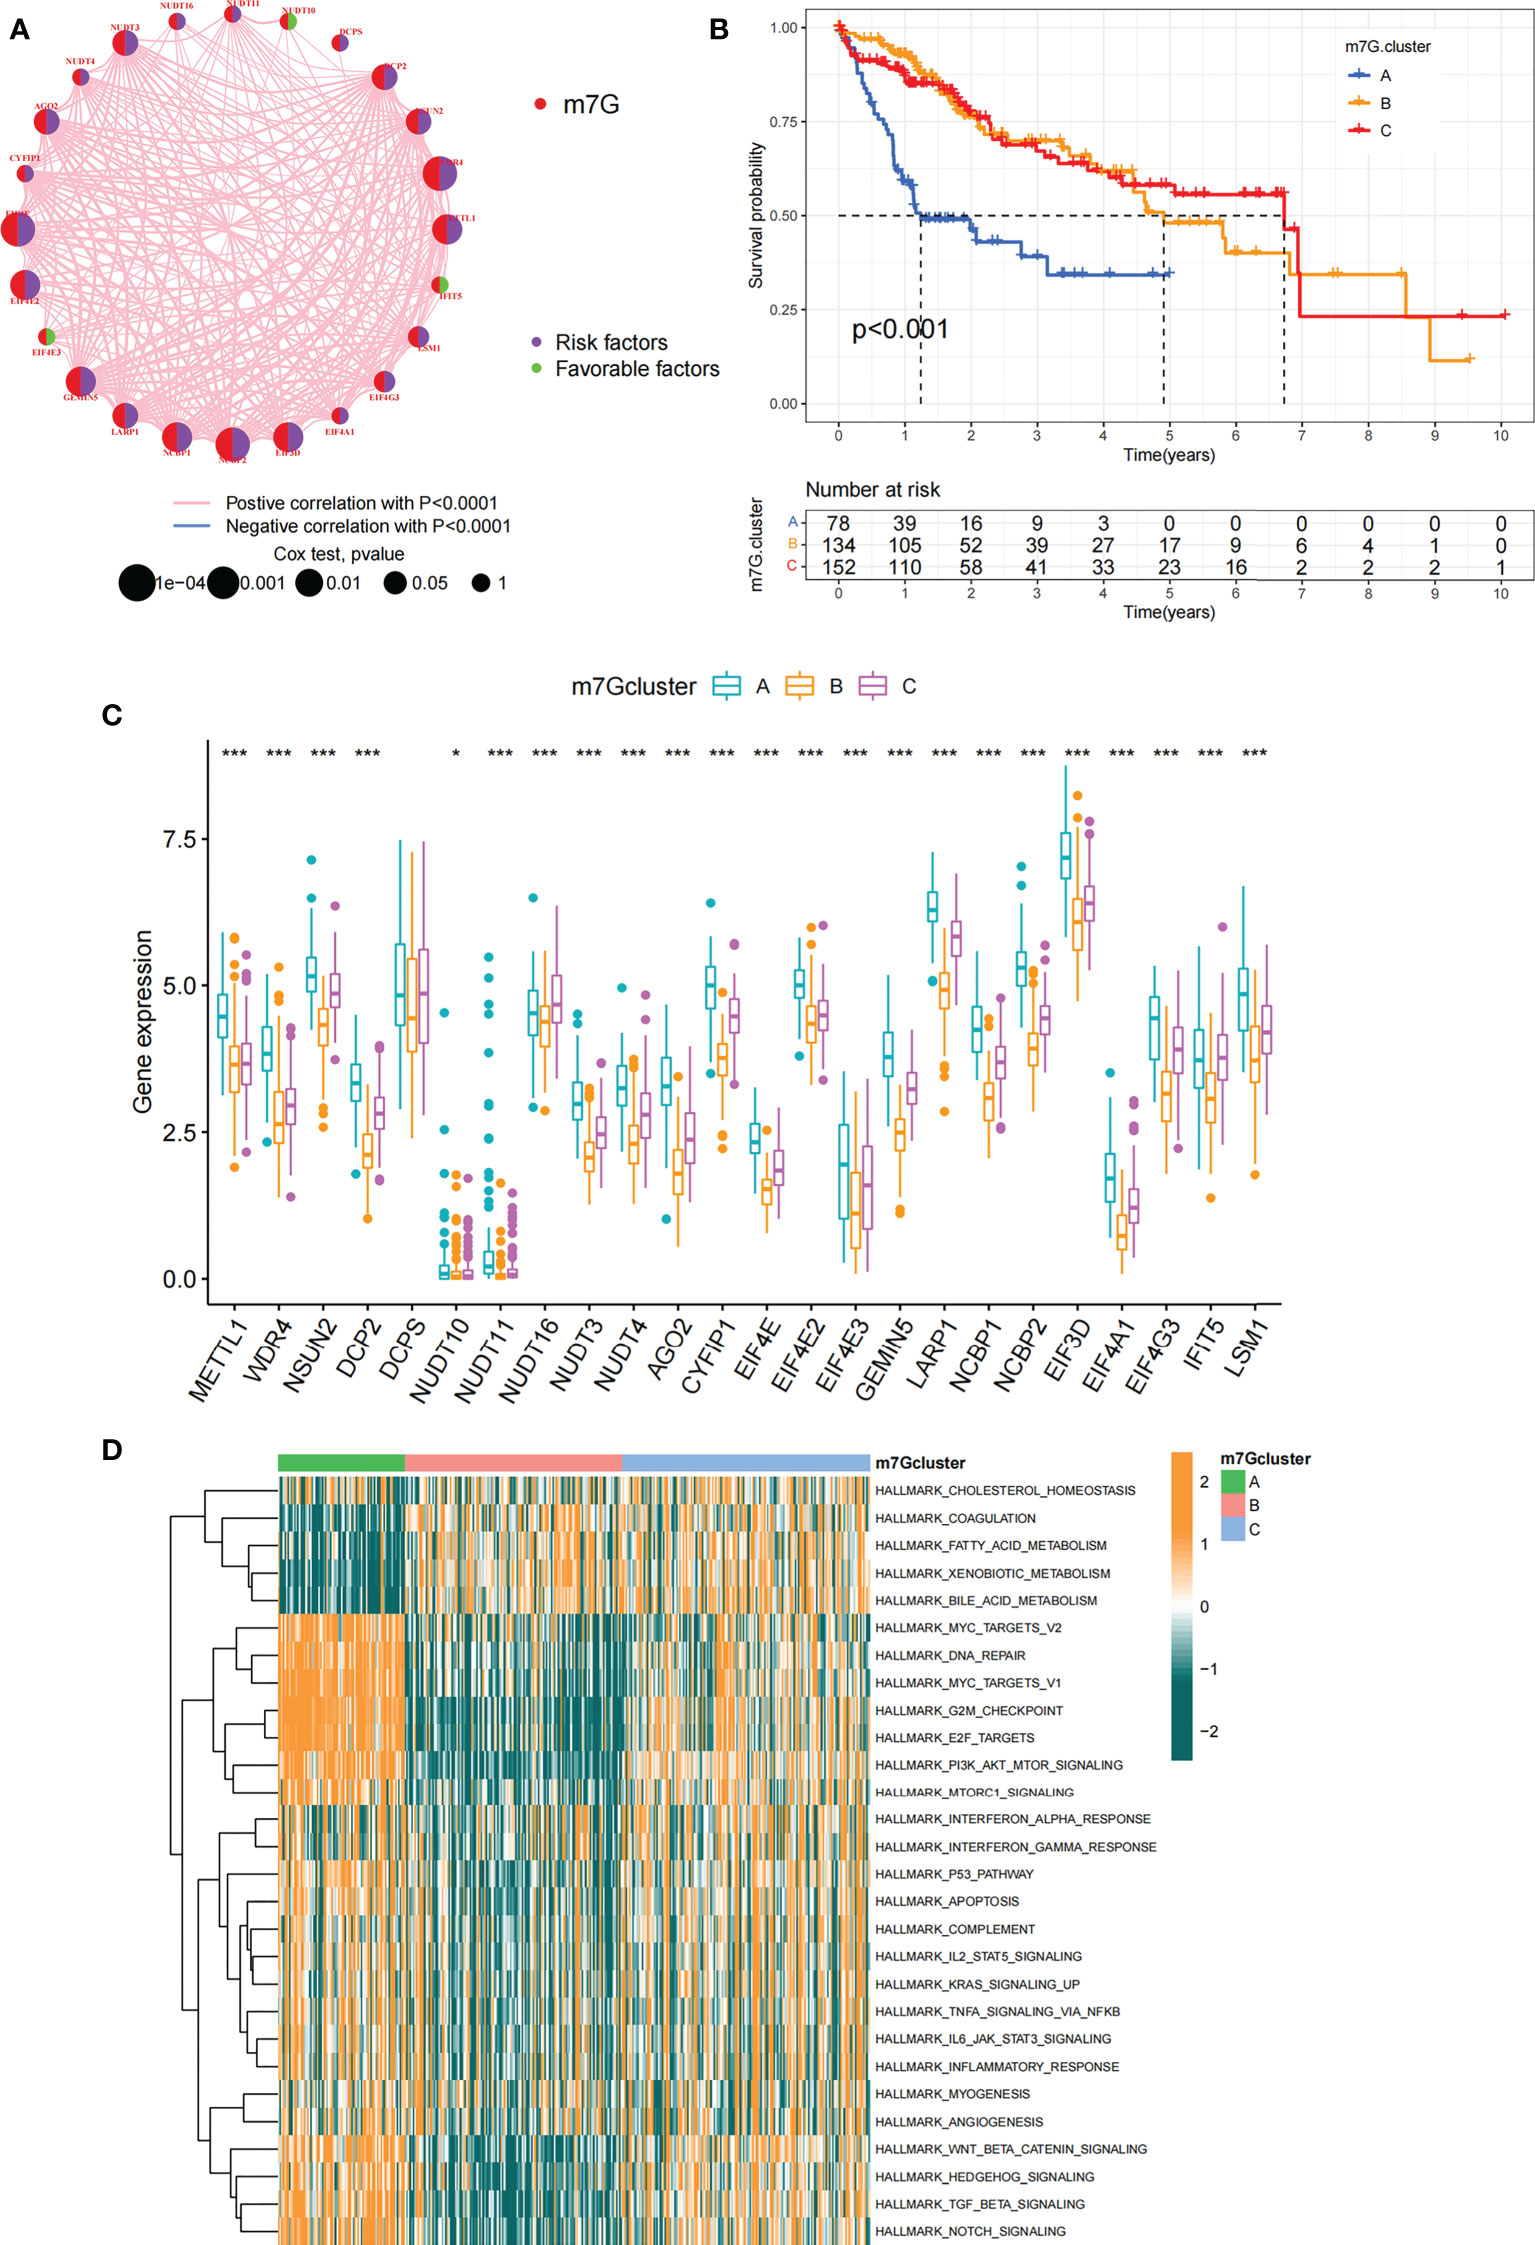
Figure 3 m7G modification patterns and related biological pathways. (A) Interaction of 24 m7G regulators expressed in HCC. The size of every circle indicated the prognostic effects of individual regulators and scaled by p-value. m7G regulators, red; favorable factors, green; risk factors, purple. (B) Survival curve for survival of 364 HCC patients in TCGA-LIHC cohort of different m7G clusters. The numbers of patients in m7G cluster A, B, and C are 78, 134, and 152, respectively. (C) Comparing the expression of 24 m7G regulators between three m7G clusters. (D) GSVA enrichment analysis displaying the activation status of biological pathways with different m7G clusters. The heatmap was made to visualize these biological processes, with yellow representing activated pathways and green representing inhibited pathways. Asterisks represent statistical p-values (*P < 0. 05; ***P < 0. 001).
The m7G modification patterns characterized by distinct immune landscapes
In order to explore biological behavior behind these distinct m7G clusters, GSVA enrichment analysis was performed. The results showed that m7G cluster A was remarkably abundant in oncogenic activated related processes, such as Myc targets, PI3K AKT MTOR signaling pathway. While m7G cluster B showed enrichment in metabolism-related pathways, such as fatty acid metabolic signaling pathways, as well as m7G cluster C that was remarkably abundant in processes related to immune activation, such as inflammatory response and complement signaling pathway (Figure 3D). Additionally, we constructed heatmap for visualizing and comparing the relative abundance of 23 immune infiltrating cells under different clusters (Figure 4A). Surprisingly to us, subsequent analysis of TME cells infiltrates showed that m7G cluster A was abundant in innate immunocyte infiltrates, including activated dendritic cell, immature dendritic cell, plasmacytoid dendritic cell, and MDSC. However, patients in m7G cluster A showed no matched survival advantage. Previous studies have found that immune rejection tumors were distinguished by the presence of numerous immunocytes, but these immunocytes remain in the stroma surrounding the tumor cell nests without penetrating the parenchyma of the tumor cell nests. Stromal activation in TME was considered T-cell suppressive (43). GSVA analysis revealed that cluster A was remarkably relevant to stromal activation such as EMT and TGFb, which confirmed our speculations (Figure 4B). The above results verified our suspicions. We further characterized the immune infiltration using CIBERSORT and found that antitumor lymphocyte subsets such as CD8 T cell and activated NK cell were mainly abundant in m7G clusters B and C (Figure 4C). Taking into account that PD-L1 is a proven biomarker to predict immunotherapy response (44), we identified a significant upregulation of PD-L1 expression levels in m7G cluster A and C subtypes (Figure 4D).

Figure 4 TME characteristics in different m7G modification patterns. (A) The heatmap used to visualize the infiltration of 23 immunocytes in three m7G clusters. Clinicopathological information including age, gender, tumor stage, and m7G cluster was shown in the annotation above. Yellow represented high expression of m7G regulators and green represented low expression. (B) In TCGA-LIHC cohort, m7G modification patterns were differentiated by distinct features. (immune-related signature, DNA repair-related signature and matrix-related signature). (C) Abundance of TME-infiltrated cells in the three m7G clusters. The line in the box indicated the median value and the scatter indicated the abnormal value. The upper and lower ends of the boxes indicated the interquartile range of values. (D) Comparison of PD-L1 expression levels of three m7G clusters. The whiskers encompassed 1.5 times the interquartile range. The upper and lower ends of the boxes indicated the interquartile range of values. Asterisks represent statistical p-values (*P < 0. 05; **P < 0. 01; ***P < 0. 001).
By Spearman correlation analysis, the specific correlation among each m7G regulator and immune cells infiltration was further characterized (Figure 5A). High expression of EIF4E3 and NUDT10/11 remarkably correlated with enhanced immune cell infiltration, whereas expression of NUDT16 was negatively relevant to the level of immunocyte infiltration. In these m7G regulators, we observed a remarkable negative association of NUDT16 with prognosis and immune infiltration (Figures 5A, B). We used ESTIMATE algorithm to quantitate the overall immunocyte infiltration in patients with high and low NUDT16 expression. It was identified that NUDT16 low expression exhibited a higher immune score, implying that NUDT16 low expression enhances immunocyte infiltration in TME, thus corroborating the above results (Figure 5C). We then investigated the differences in the specificity of 23 TME-infiltrating immunocytes in patients with high and low NUDT16 expression. We found significantly increased infiltration of 23 TME immunocytes in the tumor with low NUDT16 expression compared to those with high expression (Figure 5D). We noticed that NUDT16 was significantly and negatively relevant to the infiltration level of activated dendritic cells and CD8 T cells. Furthermore, we also found that NUDT16 was seriously and negatively related to the levels of several immune-related functions such as T cell co inhibition, T cell co stimulation, CCR, check point and APC co stimulation (Figure 5E).
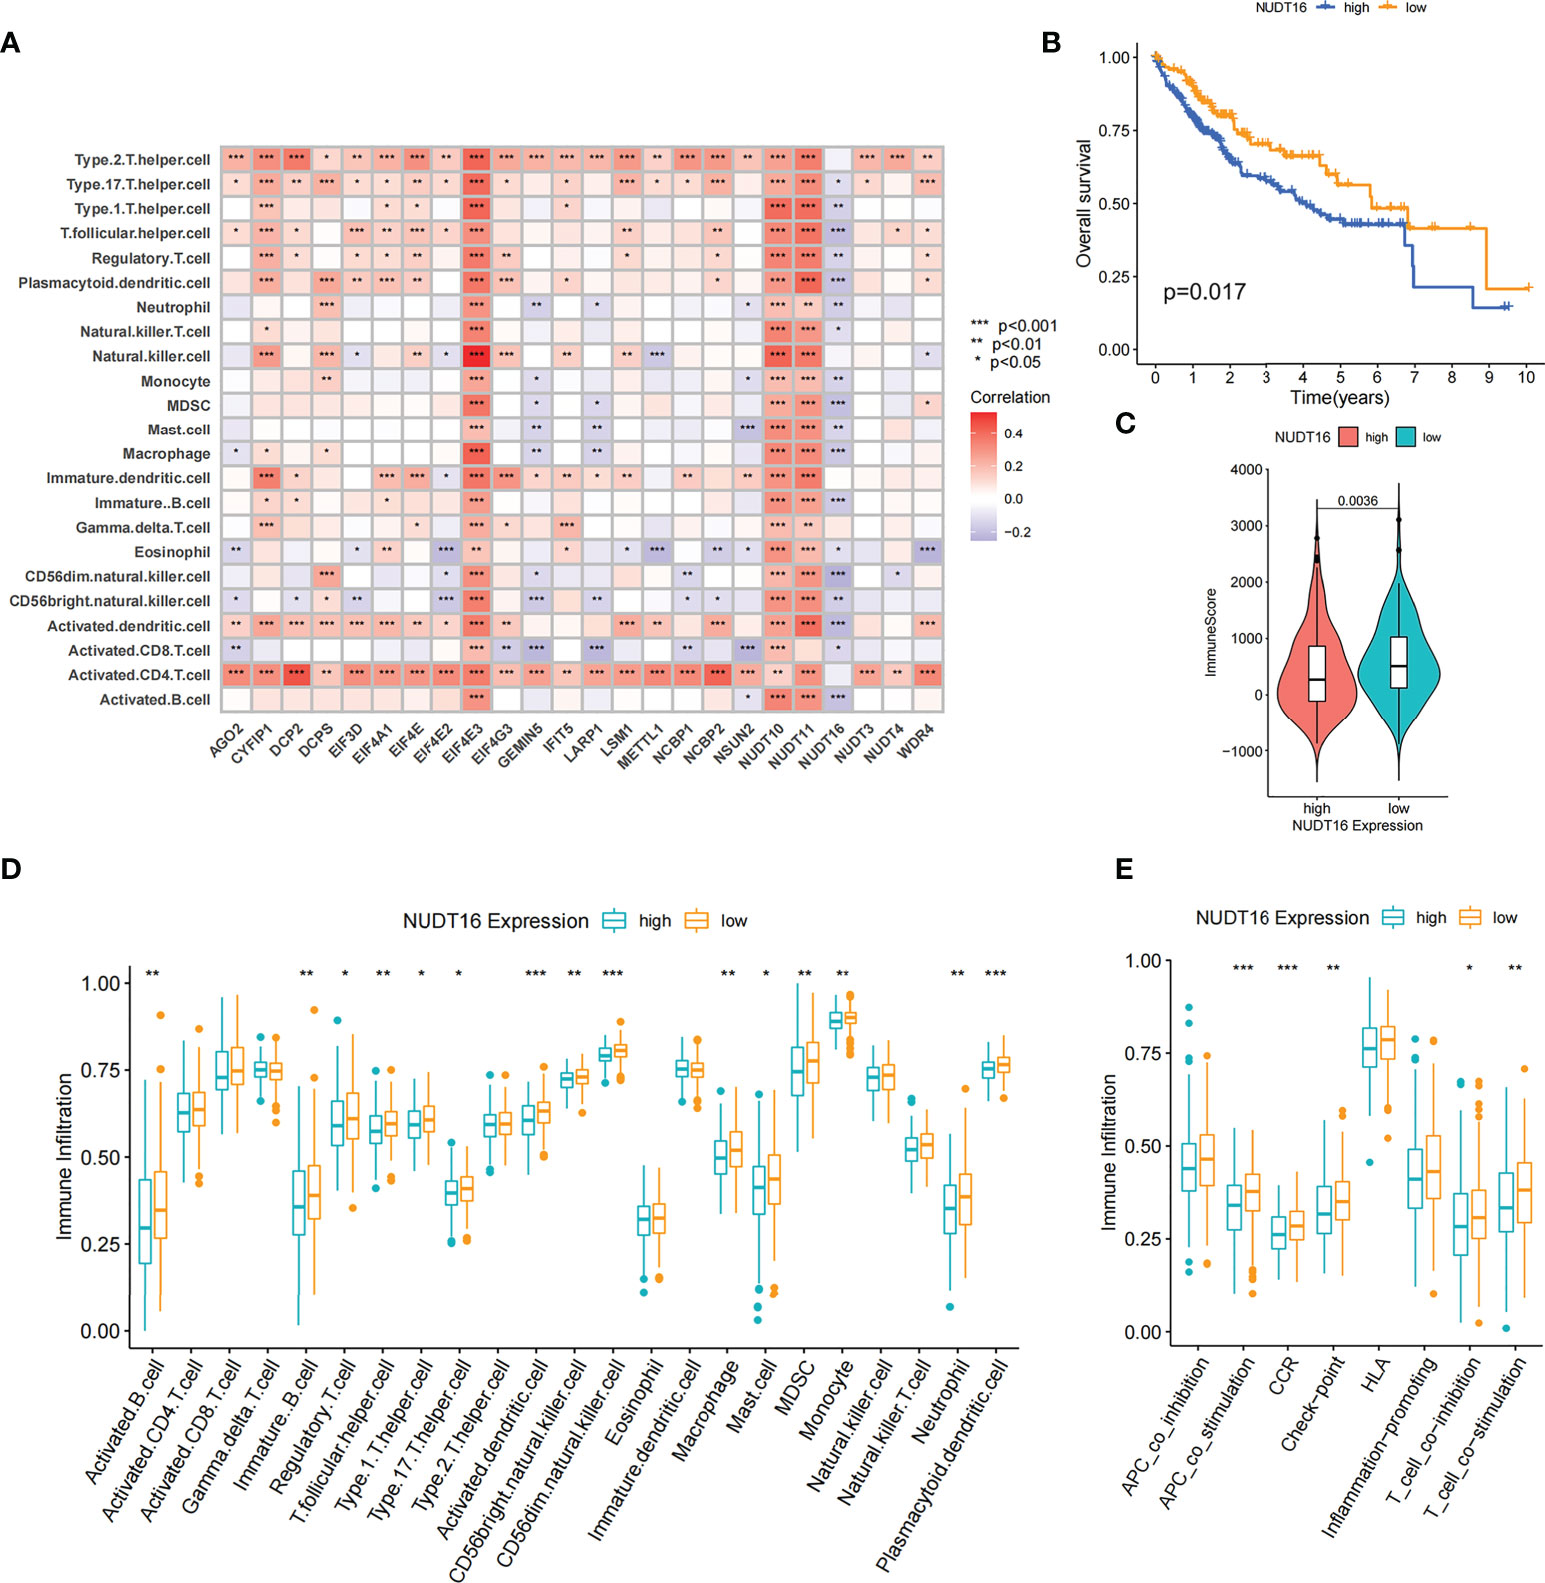
Figure 5 Correlation of TME infiltration with m7G regulators and the role of NUDT16 in hepatocellular carcinoma. (A) The correlation between each immunocyte and individual m7G regulators was analyzed by spearman analysis. (B) Overall survival was analyzed using Kaplan-Meier curves for high and low NUDT16 expression subgroups. (C) Distribution of immune scores in high and low NUDT16 expression subgroups. (D) Comparison of the differences of individual immunocytes between the high and low NUDT16 expressing subgroups. (E) Comparison of the differences in immune-related functional levels between high and low NUDT16 expressing subgroups. Asterisks represent statistical p-values (*P < 0. 05; **P < 0. 01; ***P < 0. 001).
To further validate the effect of NUDT16 on TME immune infiltration, we performed further analysis using the LIRI-JP cohort. Consistent with previous result, patients with low NUDT16 expression had higher immune score (Figure S3A). We further compared the infiltration of aDCs and CD8 T cells between high and low NUDT16 subgroups and showed that they were more infiltrated in the low NUDT16 expression group (Figures S3B, C). Based on the above results, we found that NUDT16 was significantly and negatively relevant to the infiltration level of activated dendritic cell, which are responsible for antigen presentation and initial T-cell activation and have a significant role in tumor immunity. To further verify the effect of NUDT16 on the activation of DCs, we examined the expression of specific markers of aDCs in the high and low NUDT16 groups. These markers were identified by Pornpimol et al. and can specifically represent aDCs (37). As expected, the expression of specific markers of aDCs was increased in the low expression group of NUDT16, suggesting that increased expression of NUDT16 may inhibit the activation of DCs (Figure S3D). Activation of dendritic cells is dependent on the high expression of MHC molecules, co-stimulatory factors and adhesion factors. We therefore compared the expression of MHC molecules, co-stimulatory factors and adhesion factors in the high and low NUDT16 expression groups. The result showed that CD80, CD86, HLA-DMA, HLA-DMB, HLA-F, HLA-L, ICAM1, ICAM2 and PDCD1 were significantly elevated in the NUDT16 low expression group (Figure S3E). This result further demonstrated that high expression of NUDT16 may inhibit the activation of DCs and decrease the expression of MHC molecules, co-stimulatory factors and adhesion factors. Based on these results, we hypothesized that NUDT16 may impede antitumor immune responses by inhibiting the activation of dendritic cells. We also noted that the expression of various inflammatory cytokines such as IL6, IL8, IL10, IL18, CSF1, CSF2, CCL1, CCL2, VEGFA, VEGFB, VEGFC, NGF and FGF1 were increased in the NUDT16 low expression group (Figure S3F). Therefore, we also speculated that high expression of NUDT16 may suppress tumor immunity by influencing the expression of multiple immune-related cytokines in TME.
m7G methylation modification patterns in the LIRI-JP cohort
To verify whether the m7G correlation type was applicable to other datasets, we performed validation on the LIRI-JP cohort. Similar to the clustering of TCGA-LIHC dataset, unsupervised clustering identified three completely different patterns of m7G modifications in LIRI-JP cohort (Table S4, Figures S4A–F). The three different m7G modification patterns differed significantly in the transcriptional profile of m7G (Figure S4F). m7G cluster A was characterized by increased expression of METTL1, NUDT3/4/11, CYFIP1, EIF4E, EIF4E2, GEMIN5, NCBP2, EIF3D, EIF4A1, LSM1, AGO2, and decreased expression of NUDT16; m7G cluster B had high expression of only NUDT16; the expression of WDR4, DCP2, LARP1 was significantly increased in m7G cluster C group (Figure S4E). One-way ANOVA also confirmed significant differences in m7G regulator expression between the three subtypes (Figure S4G). Prognostic analysis also indicated that m7G cluster A and B had better survival, while m7G cluster C had worse survival (Figure S4H).
DEGs associated with the m7G phenotype in hepatocellular carcinoma
Although we previously classified HCC patients into three different subtypes based on m7G regulator expression. However, the genetic alterations between these subtypes remained unclear. Therefore, we further explored the overlapping differentially expressed genes (DEGs) in the distinct m7G subtypes. We considered 26 DEGs representing key distinguishing indicators of the three m7G modification patterns as m7G-associated signatures, which were illustrated with Venn diagrams (Figure 6A). GO enrichment analysis of these characteristic genes was conducted and it showed the biological processes associated with RNA modification and transcription were markedly enriched (Figure 6B). The results indicated that the overlapping DEGs were characterized by m7G modifications and could be considered as m7G-associated gene signatures. We performed unsupervised clustering algorithm based on these m7G phenotype-associated characteristic genes to obtain three stable transcriptome phenotypes (Figures S5A–D). The patients were eventually classified into three distinct subgroups of m7G gene signatures with different clinicopathological characteristics, and were redefined as m7G gene cluster A-C (Figure 6C). These showed that three different m7G methylation modification patterns were indeed present in hepatocellular carcinoma. Survival analysis showed statistically remarkable differences in prognosis between three m7G gene signatures in HCC samples. m7G gene cluster B showed better prognosis for survival, and m7G gene cluster A showed worse prognosis (Figure 6D). The expression levels of 24 m7G regulators in three gene signature subgroups were compared (Figure S5E). Consistent with expectations, we could observe remarkable differences in m7G regulatory expression among three m7G gene clusters. To explore the roles of m7G-related phenotypes in immunocyte infiltration, we compared 23 immune cell types among three m7G gene clusters (Figure 6E). The results showed significant differences in immune infiltration among three m7G gene clusters.
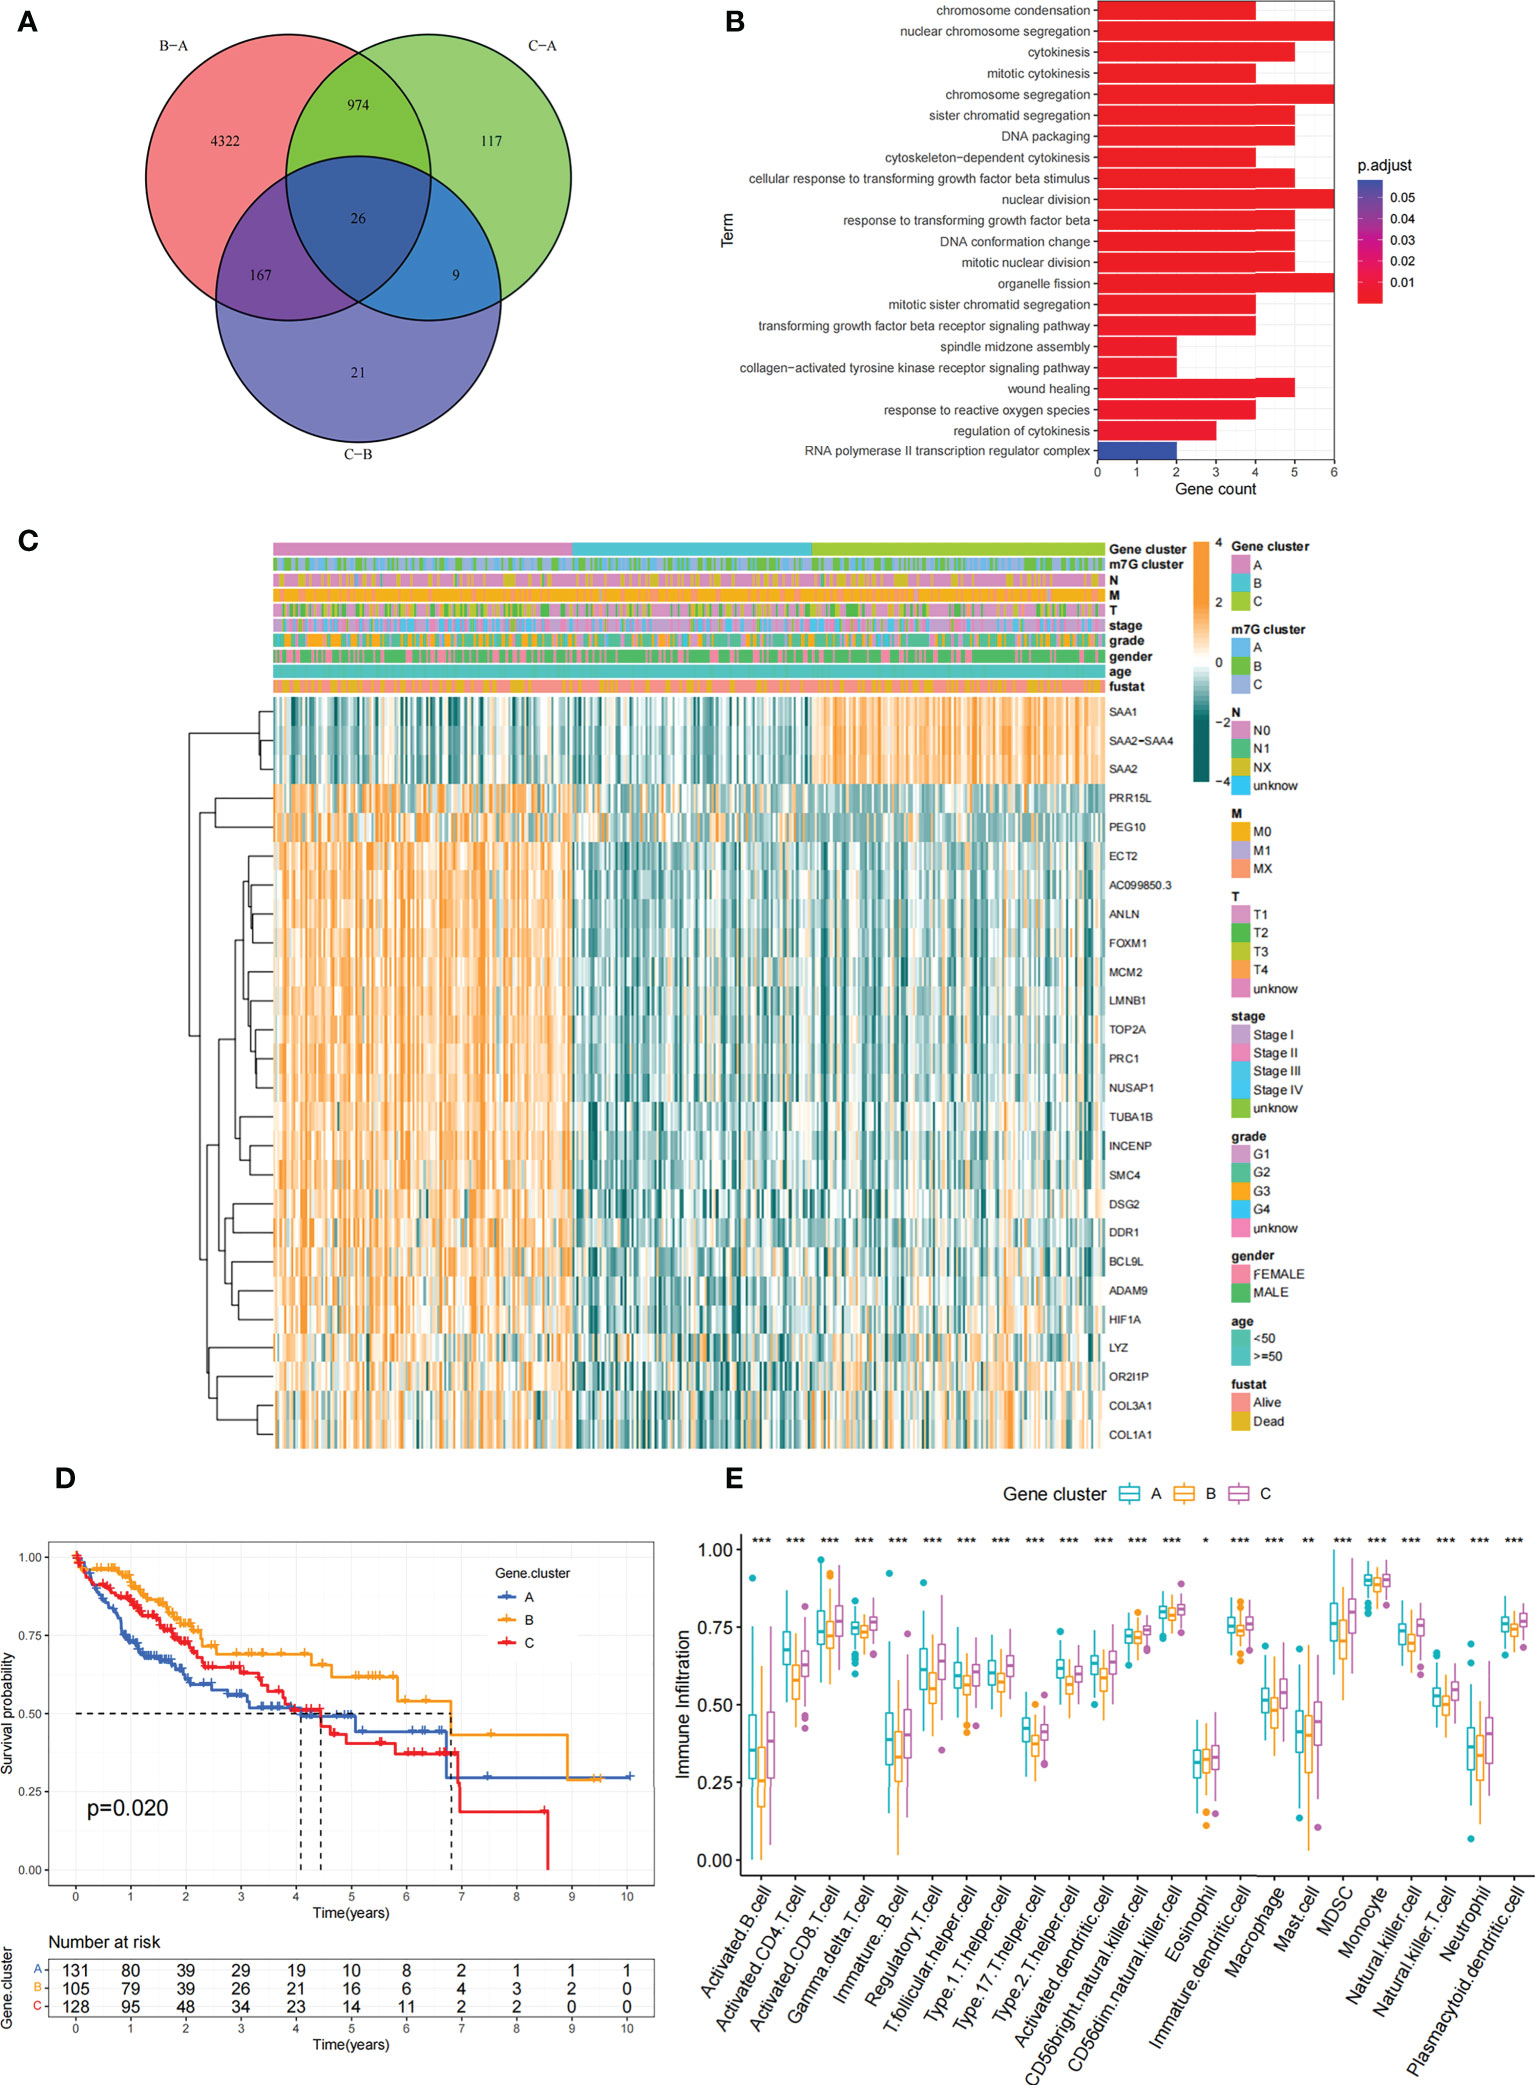
Figure 6 Construction of differential expression of m7G gene signatures and functional annotation. (A) Venn diagram showing 26 m7G-related DEGs between three m7G clusters. (B) Functional annotation of m7G-related genes using GO enrichment analysis. The color depth of the bars represent the amount of gene enrichment. (C) Unsupervised clustering of DEGs associated with overlapping m7G phenotypes classified patients into different gene clusters, which were called m7G gene cluster A, B and (C) The m7G gene cluster, m7G cluster, TMN stage, gender, and age were used as patient annotations. (D) Survival curves for m7G phenotype-associated genes were plotted. (P=0. 02). (E) Abundance of individual TME-infiltrated cells in the three m7G gene clusters. Asterisks represent statistical p-values (*P < 0. 05; **P < 0. 01; ***P < 0. 001).
Constructing the m7G score and exploring its clinical significance
Our previous studies found roles for m7G modification in prognosis and regulation of immunocyte infiltration, but the above discussions were based on patient populations only and were unable to predict accurately m7G methylation modification pattern in individual patients. Accordingly, we used previously identified m7G-related characteristic genes to construct a system called m7G score, which could quantify the pattern of m7G modifications in each patient. In consideration of the complexity of m7G modification quantification, we used an alluvial diagram (Figure 7A; Table S5) to illustrate the workflow of m7G score construction. These results indicated that m7G gene cluster B and C exhibited a higher m7G score, whereas m7G gene cluster A was linked to a lower m7G score (Figure S6A). Notably, m7G cluster A showed the lowest m7G score, which was significantly lower than the other two m7G clusters (Figure S6B). The relationship between known bio-signatures and m7G scores was examined. The heatmap of the correlation matrix showed that the m7G score was negatively correlated with DNA damage repair and DNA replication (Figure 7B). We further identified the ability of the m7G score to predict prognosis in terms of survival outcomes, using a method of dividing patients into subgroups with high or low scores with a critical value of -2.4267. Consistent with expectations, patients with high m7G scores in TCGA-LIHC cohort were remarkably relevant to a better prognosis (Figure 7C). In addition, a predictive advantage of our established risk model could be seen in the results of the ROC curve analysis (Figure S6C). Analysis of multivariate Cox regression models taking into account the gender, age, tumor grade, and TMN stage of patients demonstrated that the m7G score was a reliable and independent biomarker for assessing patient prognosis (Figure S6D).
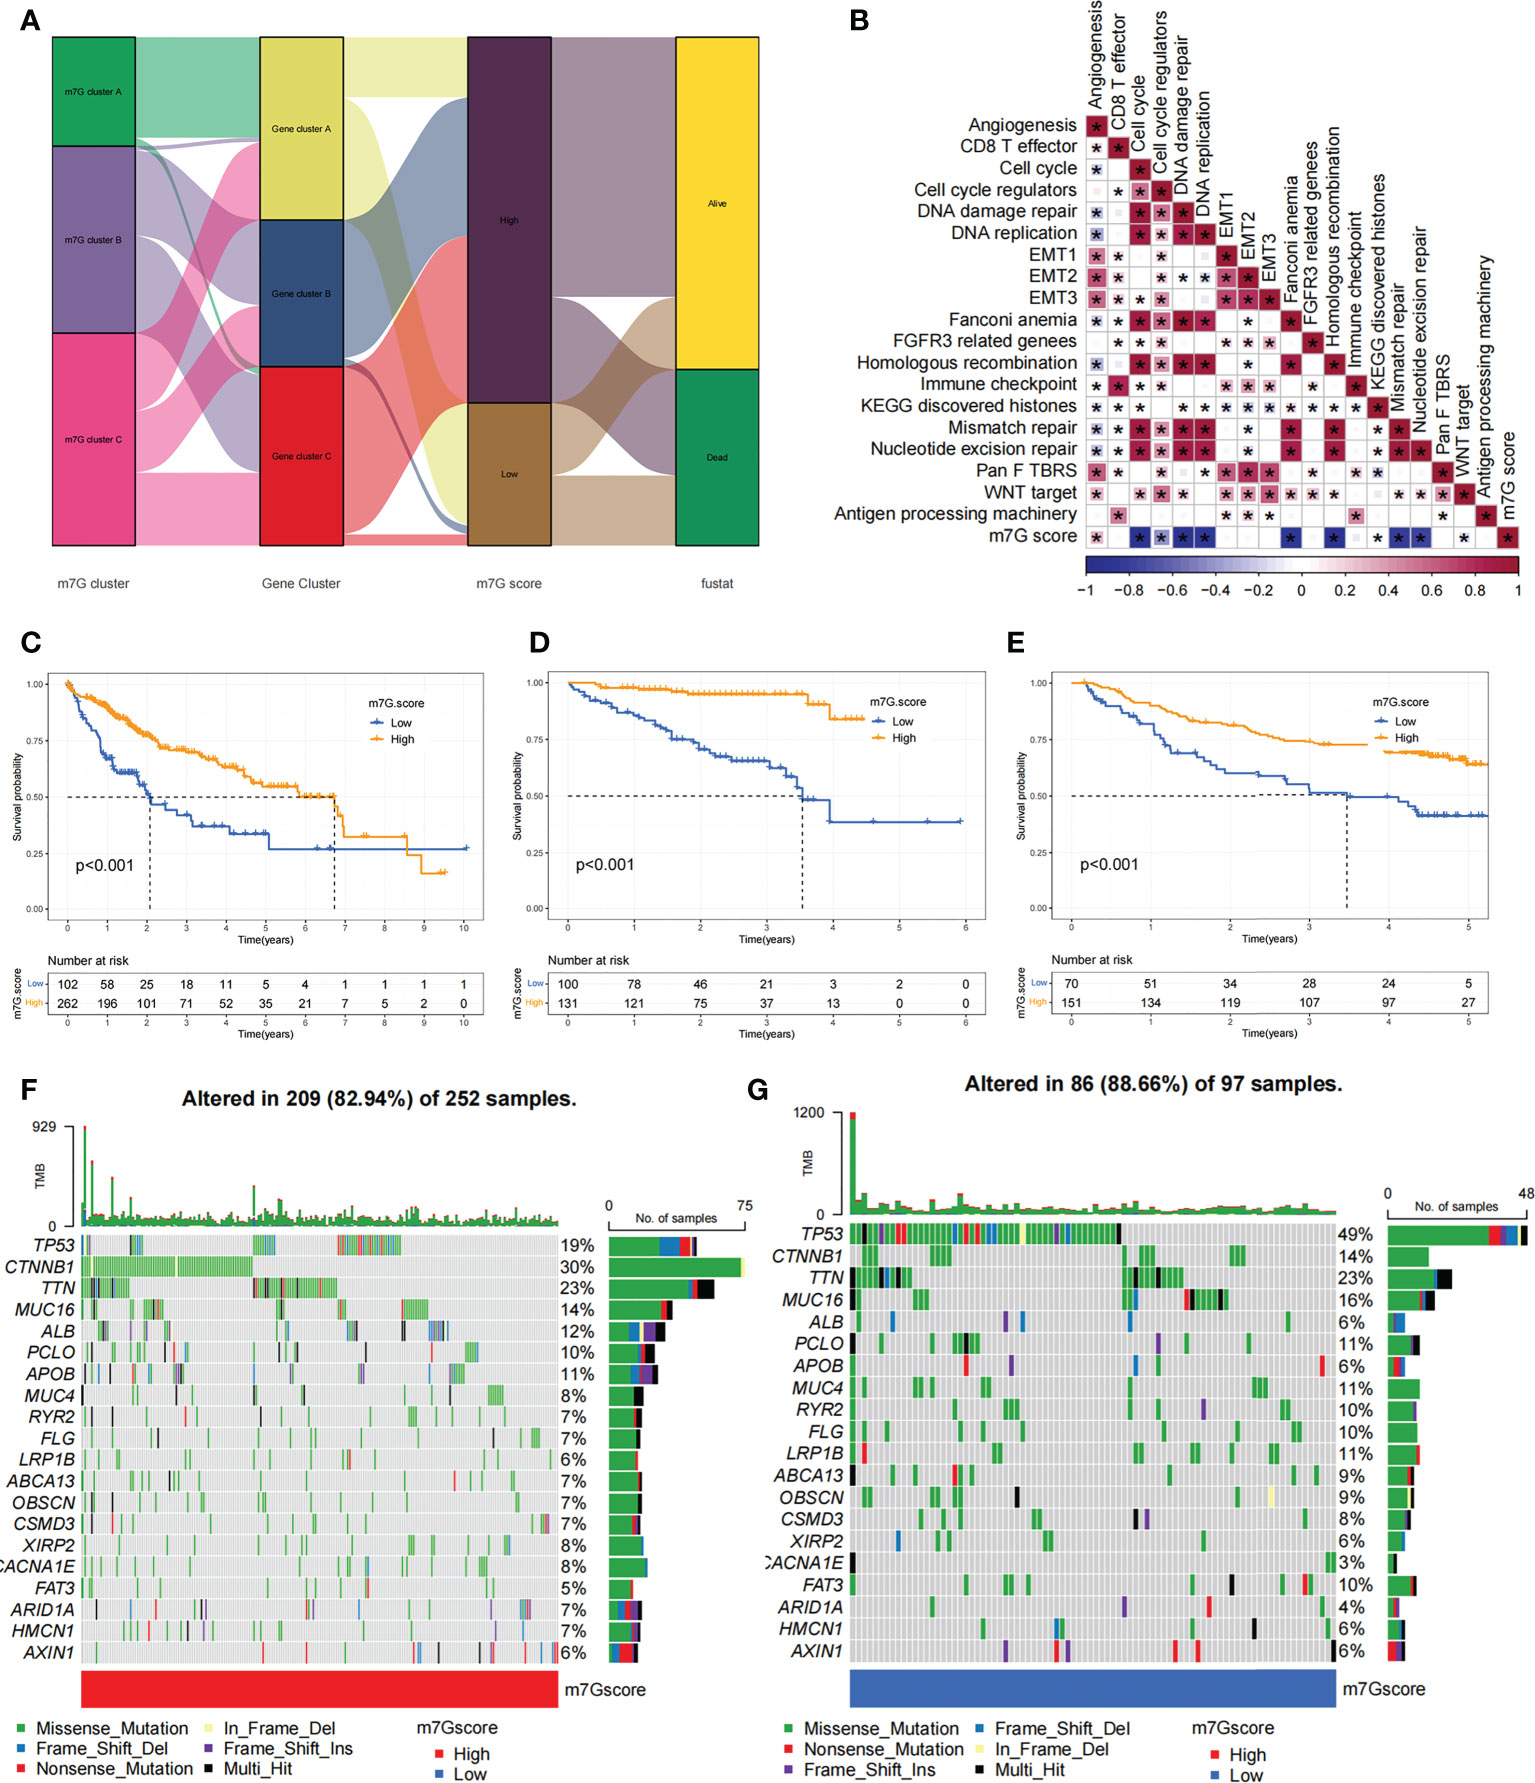
Figure 7 Construction of the m7G score and exploration of the relevance of its clinical features. (A) Alluvial plots showed changes in m7G clusters, gene clusters, m7G score and patient survival status. (B) Associations between m7G scores and certain biogenetic markers were analyzed. Positive associations were colored in red and negative associations were colored in blue. (C) Survival curves for the high and low m7G score patient subgroups in TCGA-LIHC cohort. P< 0. 001. (D) Survival curves for high and low m7G score subgroups of patients in LIRI-JP cohort. P< 0. 001. (E) Survival curves for high and low m7G score subgroups of patients in GSE14520 cohort. P< 0. 001. (F, G) The mutation status of SMGs in TCGA-LIHC cohort was divided into high (F) and low (G) m7G score subgroups. Each column represents single patient. The top bar shows the tumor mutation burden(TMB), and the numbers on the right indicates the mutation frequency of individual genes. Asterisks represent statistical p-values (*P < 0. 05).
We next validated the m7G scoring scheme by combining genomic information and clinical features from the LIRI-JP cohort. The m7G score was found to have potential prognostic predictive value in the LIRI-JP cohort (Figure S6E), and patients with a higher m7G score had a significant survival benefit (Figure 7D). To further validate the reliability of the m7G score, we also used GSE14520 cohort in order to identify the association between the m7G score and patient prognosis (Table S6). As expected, the high m7G score subgroup showed a significant survival advantage relative to the low subgroup (Figure 7E). Multifactorial analysis of the GSE14520 cohort similarly supported that the m7G score could be considered an independent prognostic factor for HCC (Figure S6F). The above findings strongly suggested that m7G score could represent the m7G modification pattern of HCC patients and predict patient prognosis.
We made further significant mutation gene (SMG) analysis for both high and low m7G subgroups in HCC samples. SMG mutation landscape revealed that TP53 (19% vs. 49%) had a higher somatic mutation rate in the low m7G score subgroup, while CTNNB1 (30% vs. 14%) had a higher somatic mutation rate in the high m7G score subgroup (Figures 7F, G).
We compared the differences in m7G score between distinct clinical trait subgroups and showed that higher tumor grade and higher TME stage were associated with lower m7G scores (Figures 8A, B). And no significant differences were found in m7G scores between age and gender subgroups (Figures S6G, H). The above findings suggested that the m7G score might be used to assess certain clinical features, like tumor grade and clinical staging.
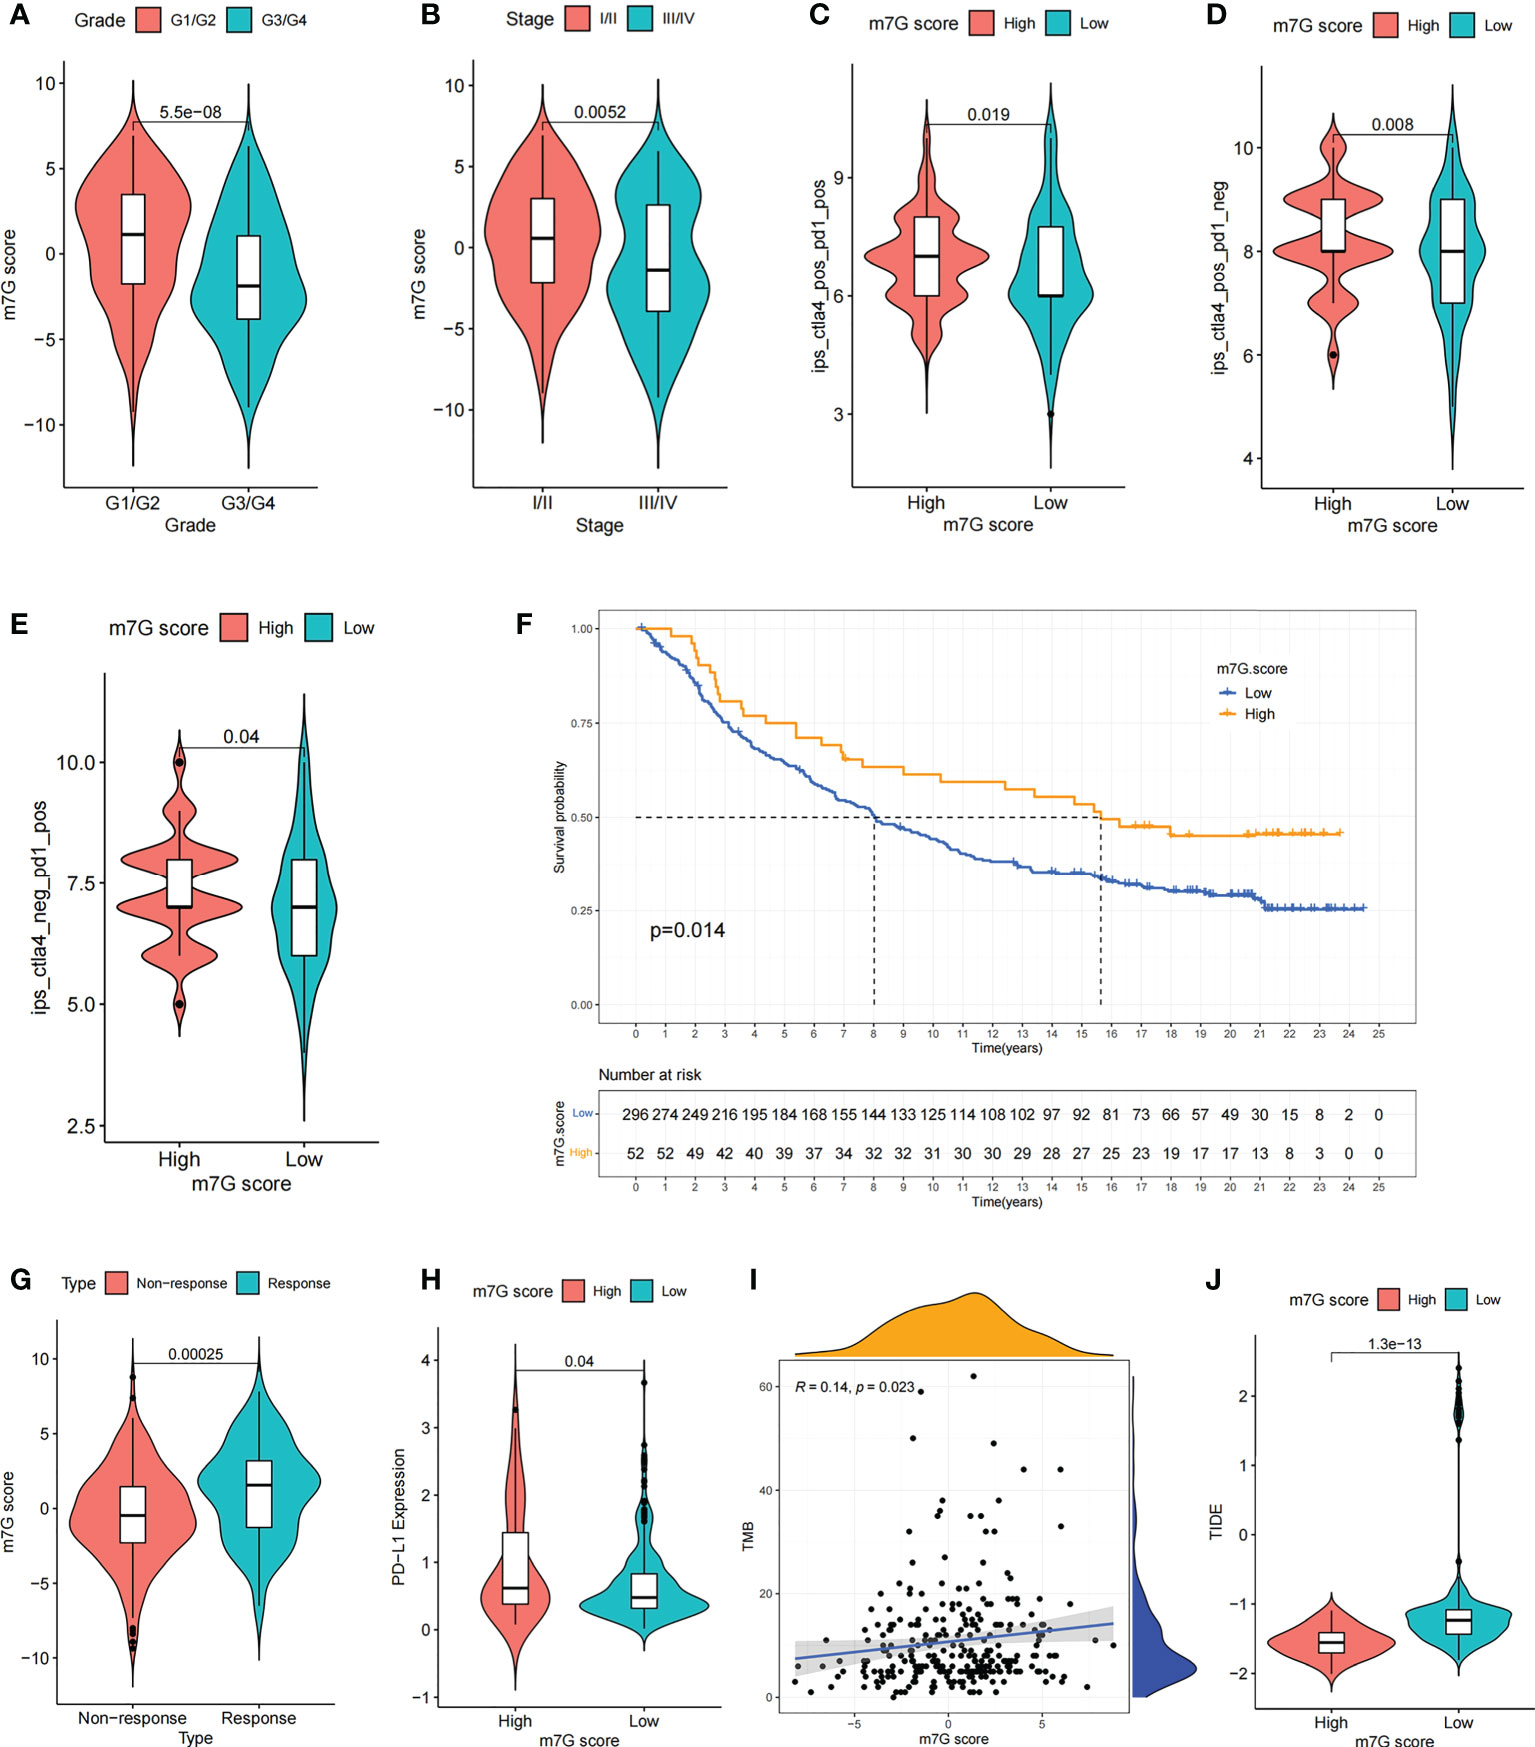
Figure 8 The m7G score predicts immunotherapeutic benefits. (A, B) Comparison of differences in m7G scores between tumor grade subgroups (A) and TME stage subgroups (B). (C–E) Comparison of differences in IPS scores between high and low m7G score subgroups. (F) Comparison of m7G score between different anti-PD-L1 treatment response subgroups in IMvigor210 cohort. (G) Survival curves for high and low m7G score subgroups of patients in IMvigor210 cohort. P< 0. 05. (H) Comparison of PD-L1 expression between high and low m7G score subgroups in IMvigor210 cohort. (I) m7G score and TMB were significantly and positively correlated in IMvigor210 cohort. (J) Comparison of differences in TIDE scores between high and low m7G score subgroups in IMvigor210 cohort.
The m7G score in predicting the efficacy of immunotherapy
Recently, a major breakthrough in antitumor therapeutics has been identified in the form of ICI therapy represented by PD-1/CTLA-4 inhibitors. Besides the well-known TML, MSI, and PD-L1 (45, 46), IPS is strongly recommended for the assessment of immune responses. In our analysis, we found that IPS was remarkably elevated in the high m7G scoring group (Figures 8C–E). These discoveries indirectly suggested that the characterization of m7G modification pattern has an essential role in mediating tumor immune responses.
Given the strong association of m7G scores with immune response, the next step was to investigate whether m7G-modified signatures could be a predictor of patient response to ICI therapy in an independent immunotherapy cohort. Patients with higher m7G score had remarkable benefits of treatment and clinical response to anti-PD-L1 immunotherapy compared to patients with lower m7G score in the anti-PD-L1 cohort (IMvigor210) (Figures 8F, G). Furthermore, PD-L1 expression was significantly higher in patients with high m7G scores (Figure 8H). In addition to PD-L1, tumor mutation burden (TMB) and TIDE can also be used to assess the immune response. High TMB is associated with higher treatment response rates and longer survival in patients treated with ICI. Our analysis showed that higher m7G score was associated with higher TMB (Figure 8I). The TIDE algorithm can be used to assess tumor immune evasion. Higher TIDE score suggests that the tumor is more likely to induce immune evasion, indicating that the tumor is poorer in response to ICI treatment. Our result also showed that TIDE was significantly decreased in the high m7G score group, suggesting that patients with high m7G score may have a better response to immunotherapy (Figure 8J). These results demonstrate that the m7G score could potentially be used to predict immunotherapy response in patients. In summary, the results of our study strongly indicate that the m7G score could predict patient prognosis and patient response to immunotherapy.
Comparsion of IC50 of small molecule drugs between different m7G clusters
Through drug sensitivity analysis, 126 small molecule drugs with potential use for the treatment of liver cancer were identified (Table S7). Our results indicated that m7G cluster A was sensitive to Lapatinib, AZD6244, BMS.536924 and Bicalutamide, while m7G cluster B was sensitive to ABT. 888, ATRA, Bortezomib, Doxorubicin and Sorafenib, and m7G cluster C was more sensitive to Docetaxel, Paclitaxel and KU.55933 were more sensitive (Figures 9A–L). Notably, sorafenib is currently an effective first-line treatment for advanced hepatocellular carcinoma. And our result found that m7G cluster B was more sensitive to sorafenib (Figure 9A). We then evaluated the relationship between the expression of 24 m7G regulators and medication sensitivity (Table S8, Figure S7). The above results suggest that exploring different m7G methylation modification patterns could be used to predict and guide clinical drug therapy for HCC patients.
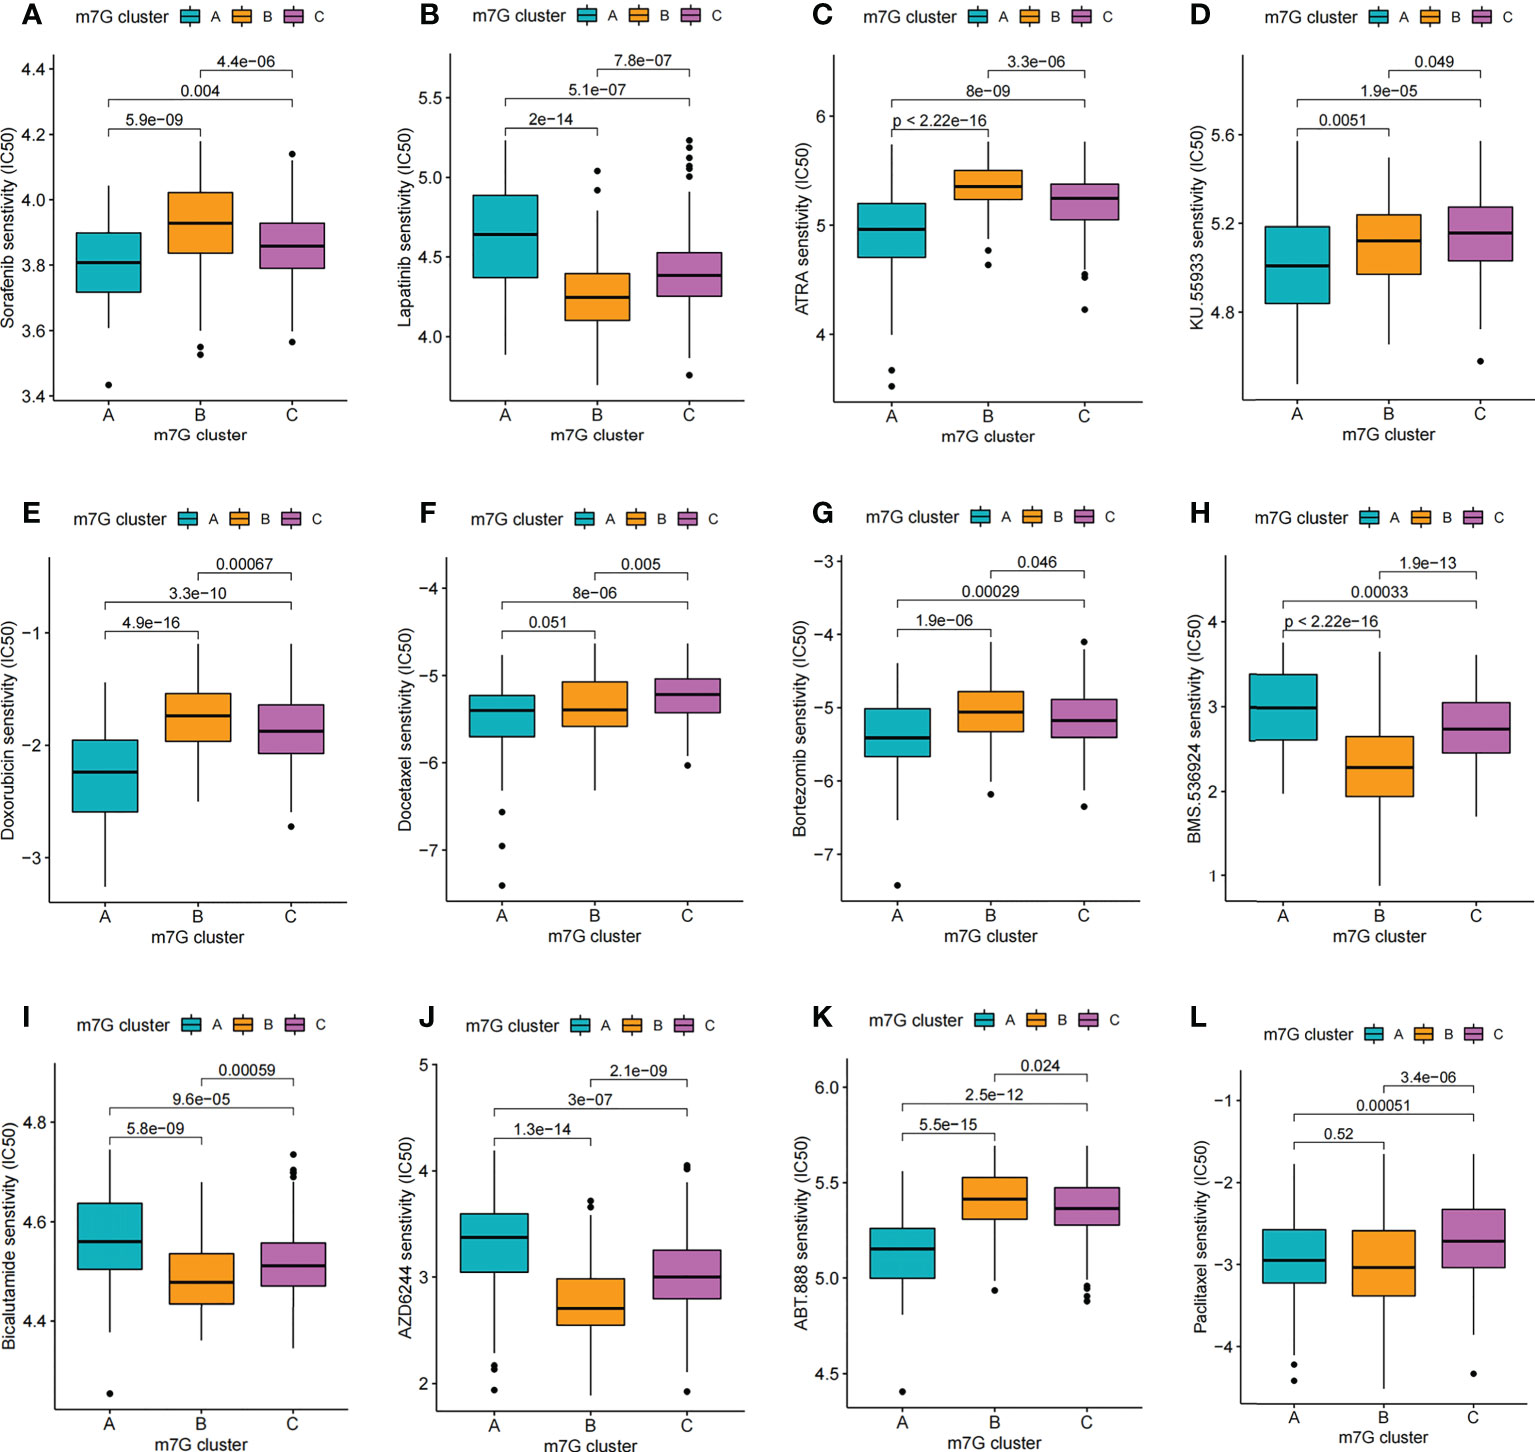
Figure 9 Comparison of drug sensitivity. (A–L) Comparison of IC50 of small molecule drugs between different m7G clusters.
Immunohistochemical detection of NUDT16 expression distribution
Given the potential role of NUDT16 in hepatocellular carcinoma progression, our previous study comparing the expression of NUDT16 in tumor and normal tissues showed that NUDT16 was highly expressed in tumor tissues. In order to further validate above result, we compared NUDT16 levels in HCC and adjacent non-cancerous tissues. IHC staining indicated that the level of NUDT16 expression in HCC tissues was distinctly higher than that in adjacent non-cancerous tissues (Figures 10A, B).
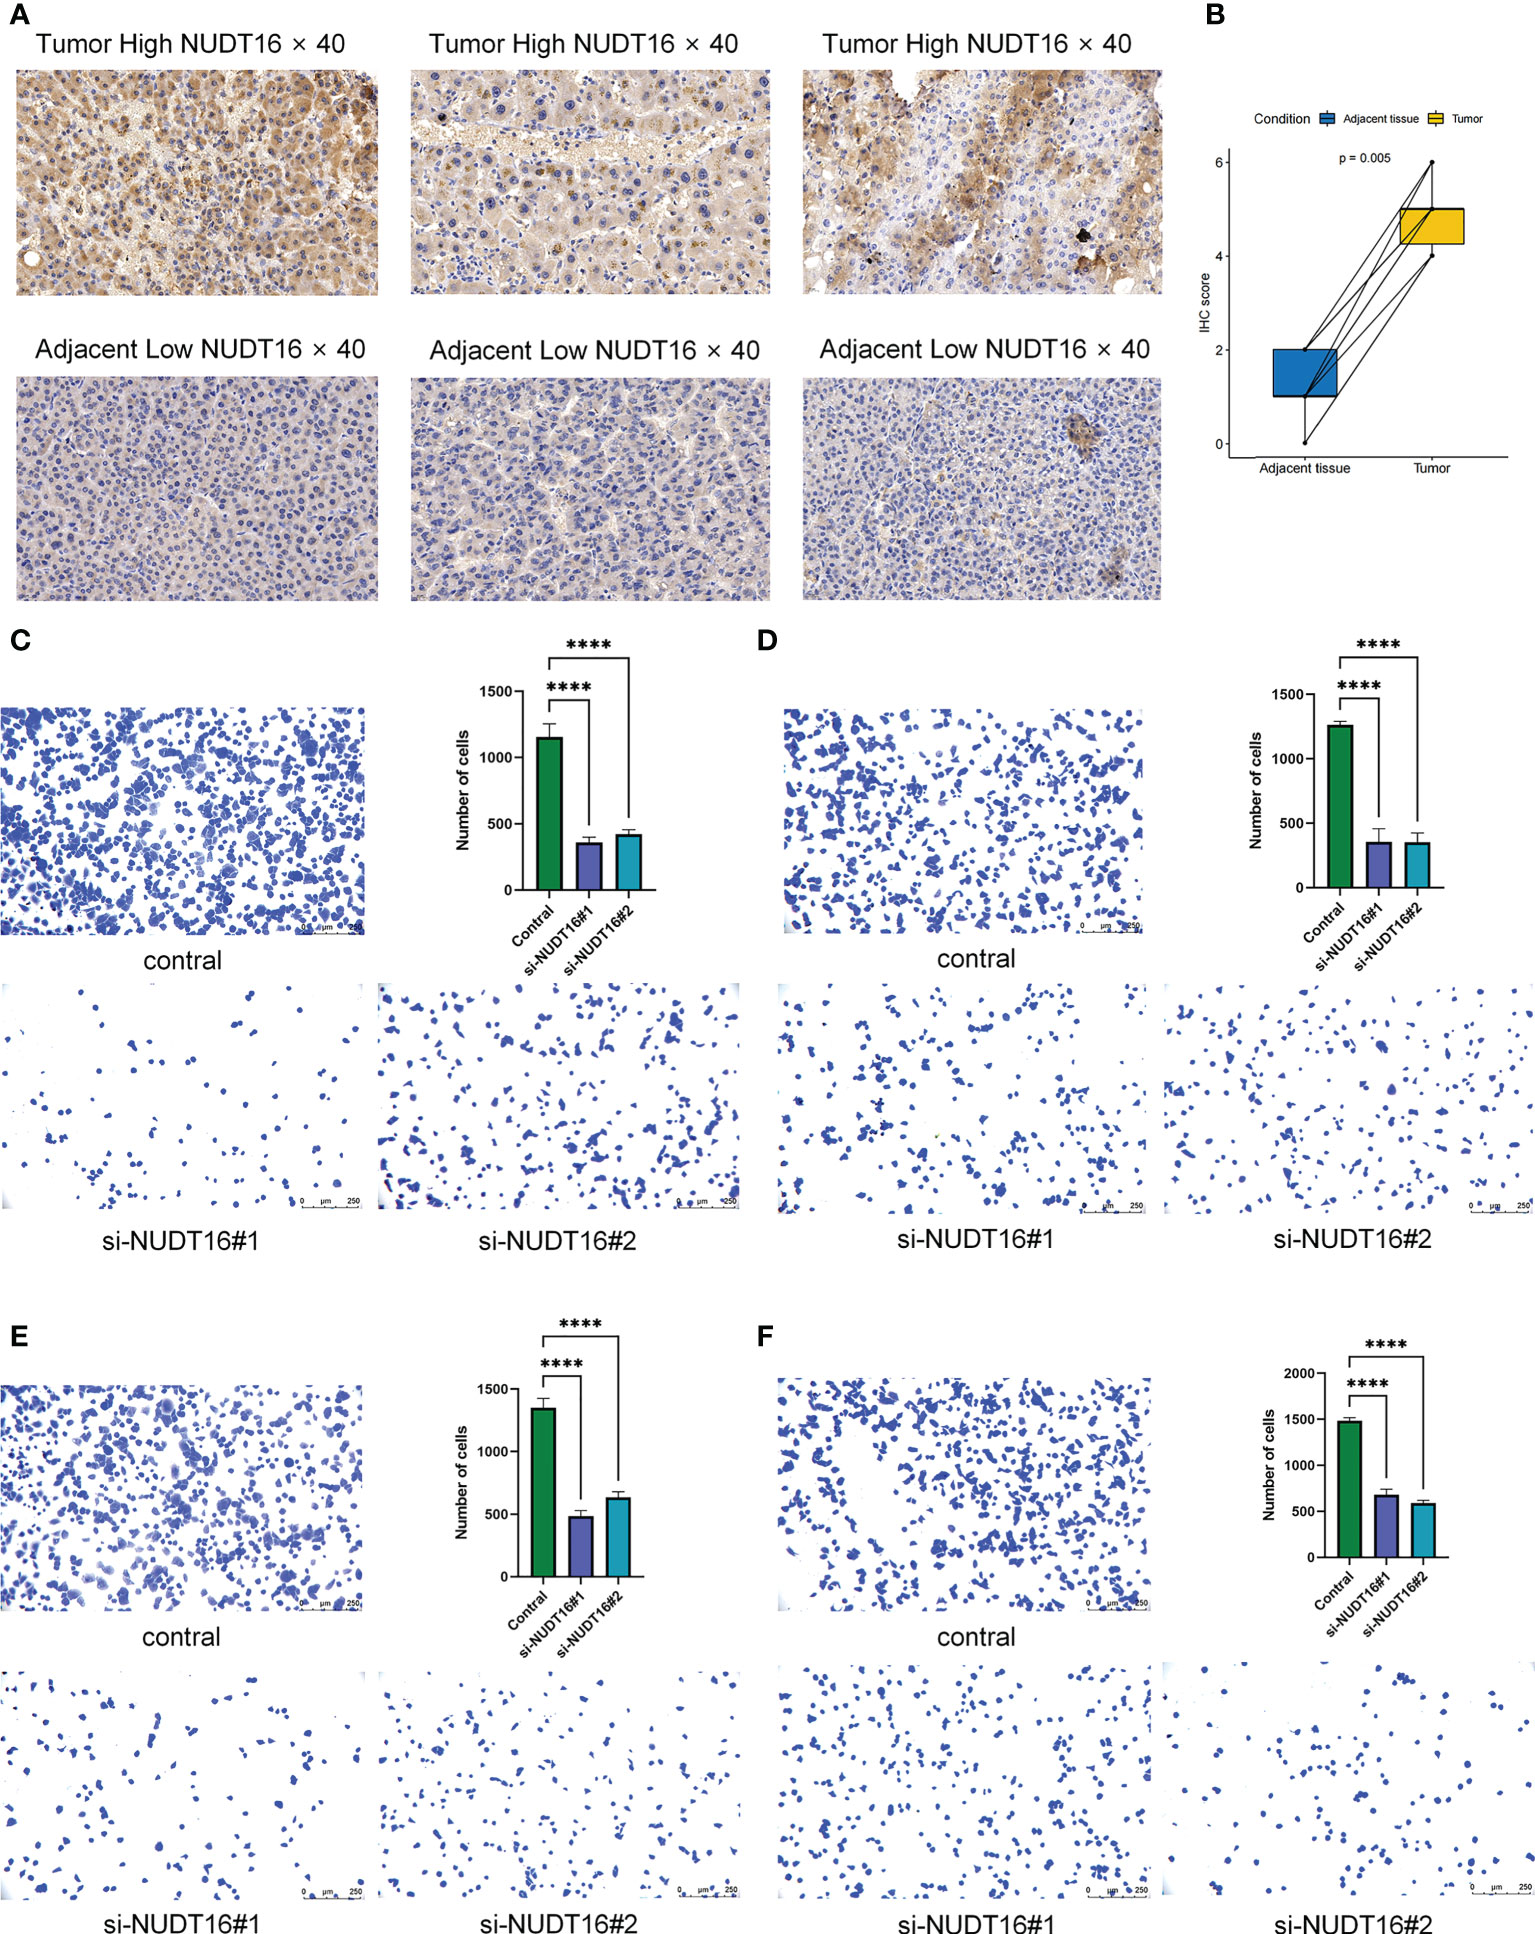
Figure 10 Immunohistochemical analysis of NUDT16 expression in HCC tissues and adjacent tissues and effect of NUDT16 on the adhesion ability of HCC cells. (A) High NUDT16 expression in HCC tissues at 40× magnification. Low NUDT16 expression in adjacent tissues at 40× magnification. (B) Comparison of NUDT16 IHC scores in HCC tissues and paired adjacent tissues. (C) Comparing the adhesion ability of Huh-7 cells to fibronectin between control and si-NUDT16 groups. (D) Comparing the adhesion ability of Huh-7 cells to vitronectin between control and si-NUDT16 groups. (E) Comparing the adhesion ability of HepG2 cells to fibronectin between control and si-NUDT16 groups. (F) Comparing the adhesion ability of HepG2 cells to vitronectin between control and si-NUDT16 groups. (****P< 0. 0001).
NUDT16 influenced the adhesion of HCC cells
We previously found that NUDT16 was highly expressed in HCC tissues and that it may influence the immune infiltration in TME. Further, we used cell adhesion assays to explore the effect of NUDT16 on the adhesion of HCC cells to the extracellular matrix. Fibronectin and vitronectin are important component of the extracellular matrix in the TME, so we explored the effect of NUDT16 on the ability of HCC to adhere to fibronectin and vitronectin. The result showed that the adhesion ability of Huh-7 cells to fibronectin (Figure 10C) and vitronectin (Figure 10D) was decreased in si-NUDT16 compared to the control group. Similarly, we found that the adhesion ability of HepG2 cells to fibronectin (Figure 10E) and vitronectin (Figure 10F) was decreased in si-NUDT16 compared to the control group.
Discussion
Liver cancer has a high morbidity and mortality rate, so reliable diagnosis and survival prediction are urgently needed. Increasing evidence suggested that m7G modification played integral roles in tumor progression (26, 27). Previous studies on m7G methylation modification were mostly focused on individual regulatory molecules such as METTL1 and WDR4, and were less abundant than those on other types of RNA methylation modifications (47–51). The overall features regulated by the combination of multiple m7G regulators have not been completely clarified. Even though there are also numerous previous research that has the role of m7G regulator-mediated epigenetic regulation in the immune environment (32, 50), there is still little understanding of the overall TME infiltration properties mediated by the combined action of various m7G regulators. Therefore, studying the integral features mediated by the combined effects of various m7G regulators, and identifying different m7G modification patterns in TME will strengthen our understanding of the role of m7G methylation in the antitumor immune response and help guide more effective immunotherapeutic strategies.
In this study, we revealed three distinct m7G clusters based on 24 m7G regulators, and the TME cell permeation characteristics were significantly different among these three subtypes. The m7G cluster A was characterized by natural immunity and stromal activation, especially activation of EMT, TGFb signaling pathways, which were thought to be T cell suppressive (43). Thus, the finding that cluster A was abundant in innate immunocyte infiltration but had a poorer prognosis could be explained. m7G cluster B and C were characterized by adaptive immune activation, manifested by significant enrichment of antitumor lymphocyte subsets such as T-cell CD8 and NK cells. Taking into account that PD-L1 is a proven biomarker to predict immunotherapy response (44). Our study also found remarkable upregulation of PD-L1 expression in m7G A and C subtypes, and this finding may help to predict the efficacy of immunotherapy. Combined with the cell permeation characteristics of TME between the three subtypes, it is quite possible to confirm the reliability of our immunophenotypic classification of the distinct m7G clusters. More recent literature has reported that activation of EMT- and TGFb-related pathways could impede lymphocyte infiltration into tumor parenchyma (51), and it has been proposed that targeting specific molecular inhibitors of TGFb could remodel the tumor microenvironment and reinstate antitumor immunity (35, 52). Accordingly, we hypothesize that HCC patients in m7G cluster A may benefit from the combination of ICB drugs and TGFb blockade.
In addition, this study found that DEGs with different m7G modification patterns were found to be significantly enriched in biological processes involving RNA modification and transcriptional correlates in this study, and these DEGs were recognized as m7G-related signature genes. We identified three gene clusters based on m7G signature genes and found that they clustered similarly with m7G modifications, and both were significantly correlated with patient survival prognosis. In order to quantitate the pattern of m7G modification in individual HCC patients and thus more precisely guide the treatment strategy for individual patients, we further developed “m7G score”, a quantitative system to define it. According to this scoring system, m7G subtypes B and C, which were characterized by adaptive immune activation, presented a higher m7G score. In contrast, the m7G A subtype, characterized by natural immunity and significant stromal activation, presented a lower score.
What’s more, we found that the m7G score was significantly relevant with IPS, a predictor of immune response. This finding implies that our m7G score has a potential predictive advantage in the precise immunotherapy of liver cancer. In fact, we validated the constructed m7G scoring system with three liver cancer cohorts (TCGA-LIHC cohort, LIRI-JP cohort, GSE14520 cohort) and confirmed our hypothesis that the m7G score would be regarded as an independent prognostic biomarker of HCC. Moreover, we validated that the m7G score is a reliable predictor of patient survival outcomes and immunotherapy response through another independent ICI cohort (IMvigor210).
While elucidating the results of m7G modification clustering, we also discussed the roles of individual m7G regulators specifically in tumor immunomodulation. Dai et al. found in their recent studies that METTL1 and WDR4 were upregulated in patients with intrahepatic cholangiocarcinoma(ICC) and that METTL1-mediated m7G tRNA modification selectively regulated oncogenic genes including EGFR pathway and cell cycle genes in ICC through a codon frequency-dependent mechanism mRNA translation. This is associated with poor prognosis in ICC patients (53). Meanwhile, numerous studies have also disclosed the functions and potential mechanisms played by METTL1 and WDR4 in other cancer types, as they were found to significantly upregulate and regulate the translation of oncogenic mRNAs in multiple cancer types, and they were considered to be a tumorigenic oncogene (54, 55). In our research we also found that METTL1 and WDR4 expression was upregulated in hepatocellular carcinoma tissues and correlated with reduced survival time, and also found that high METTL1 and WDR4 expression was distinctively and negatively relevant with the level of NK cell infiltration. In addition, NUDT16 was brought to our attention in our study because of its remarkable negative association with both tumor prognosis and immunocyte infiltration. Thereafter, we focused on analyzing the specific association between NUDT16 and immunocyte infiltration, while comparing the expression of NUDT16 in HCC tissues and adjacent non-cancerous tissues by IHC staining. Based on these findings, we hypothesized that NUDT16-mediated m7G methylation modification might impede antitumor immune responses by inhibiting the activation of DCs. In this study, NUDT16 was also found to be commonly altered and significantly upregulated in CNV among tumor tissues, indicating that it may also promote the development and progression of HCC. In the future, we need to further validate the effects of NUDT16-mediated m7G modification on tumor immunosuppression mechanisms in biological experiments such as cell culture and mouse models.
The assessment of human tumor significant mutation gene (SMG) is an important foundation for cancer diagnosis, treatment and rational choice of therapy. Previous studies have shown that TP53 mutations occur in many tumor types and suppress antitumor immune responses (56). In our study, the somatic mutation rate of TP53 was found to be significantly higher in the low m7G score subgroup of m7G than in the high m7G score subgroup. These tumor driver gene mutations associated with m7G scores were significantly associated with tumor immunity, showing that there is a complex interaction between m7G modifications and tumor immunogenomic features.
Nevertheless, our study is not without any limitations. Although our model has incorporated 24 recognized m7G RNA methylation regulators, more need to be incorporated in the future to optimize our model and improve the accuracy of prediction. Although we have performed multiple validations of the resulting prediction models, more independent datasets could be incorporated in the future to reduce potential biases. On the other hand, as the main findings of this study were obtained through comprehensive bioinformatics analysis, biological experiments such as cell culture and mouse models are needed to further explore the detailed mechanisms of how m7G regulators interplay with each other.
In this study, we performed a comprehensive evaluation of m7G modification patterns in 816 hepatocellular carcinoma samples based on 24 m7G regulatory factors and made a systematic correlation of these modification patterns with TME cells infiltration characteristics. These comprehensive analyses revealed a broad regulatory mechanism of m7G methylation modifications on tumor microenvironment. In short, differences in m7G modification patterns are a non-negligible factor contributing to the heterogeneity and complexity of the individual tumor microenvironment. Assessing the m7G modification patterns of individual tumors would help enhance our perception of TME infiltration characteristics and provide significant insights into immunotherapy efficacy.
Data availability statement
The original contributions presented in the study are included in the article/Supplementary Material. Further inquiries can be directed to the corresponding author.
Ethics statement
The studies involving human participants were reviewed and approved by Ethics Committee of Beijing Youan Hospital. The patients/participants provided their written informed consent to participate in this study.
Author contributions
LW contributed to the design, writing, experiments and data analysis of the manuscript. FM reviewed and edited the manuscript. FM, XiL and YF recruited patients and obtained samples. All authors contributed to the article and approved the submitted version.
Funding
This work was supported by the National Science and Technology Major Project (2018ZX10302205-005).
Conflict of interest
The authors declare that the research was conducted in the absence of any commercial or financial relationships that could be construed as a potential conflict of interest.
Publisher’s note
All claims expressed in this article are solely those of the authors and do not necessarily represent those of their affiliated organizations, or those of the publisher, the editors and the reviewers. Any product that may be evaluated in this article, or claim that may be made by its manufacturer, is not guaranteed or endorsed by the publisher.
Supplementary material
The Supplementary Material for this article can be found online at: https://www.frontiersin.org/articles/10.3389/fimmu.2022.1022720/full#supplementary-material
Abbreviations
AUC, Area under the curve; DEGs, Differentially expressed genes; EMT, Epithelial-mesenchymal transition; HCC, Hepatocellular carcinoma; ICC, Intrahepatic cholangiocarcinoma; ICI, Immune checkpoint inhibitor; IHC, Immunohistochemical; m7G, N7-methylguanosine; PCA, Principal component analysis; ROC, Receiver operating characteristic; SMG, Significant mutation gene; TME, Tumor microenvironment.
References
1. Villanueva A. Hepatocellular carcinoma. N Engl J Med (2019) 380(15):1450–62. doi: 10.1056/NEJMra1713263
2. Llovet JM, Kelley RK, Villanueva A, Singal AG, Pikarsky E, Roayaie S, et al. Hepatocellular carcinoma. Nat Rev Dis Primers (2021) 7(1):6. doi: 10.1038/s41572-020-00240-3
3. Yang JD, Hainaut P, Gores GJ, Amadou A, Plymoth A, Roberts LR. A global view of hepatocellular carcinoma: Trends, risk, prevention and management. Nat Rev Gastroenterol Hepatol (2019) 16(10):589–604. doi: 10.1038/s41575-019-0186-y
4. Tang W, Chen Z, Zhang W, Cheng Y, Zhang B, Wu F, et al. The mechanisms of sorafenib resistance in hepatocellular carcinoma: Theoretical basis and therapeutic aspects. Signal Transduct Target Ther (2020) 5(1):87. doi: 10.1038/s41392-020-0187-x
5. Llovet JM, Castet F, Heikenwalder M, Maini MK, Mazzaferro V, Pinato DJ, et al. Immunotherapies for hepatocellular carcinoma. Nat Rev Clin Oncol (2022) 19(3):151–72. doi: 10.1038/s41571-021-00573-2
6. Cheng AL, Hsu C, Chan SL, Choo SP, Kudo M. Challenges of combination therapy with immune checkpoint inhibitors for hepatocellular carcinoma. J Hepatol (2020) 72(2):307–19. doi: 10.1016/j.jhep.2019.09.025
7. Letouze E, Shinde J, Renault V, Couchy G, Blanc JF, Tubacher E, et al. Mutational signatures reveal the dynamic interplay of risk factors and cellular processes during liver tumorigenesis. Nat Commun (2017) 8(1):1315. doi: 10.1038/s41467-017-01358-x
8. Lan Q, Liu PY, Bell JL, Wang JY, Huttelmaier S, Zhang XD, et al. The emerging roles of rna M(6)a methylation and demethylation as critical regulators of tumorigenesis, drug sensitivity, and resistance. Cancer Res (2021) 81(13):3431–40. doi: 10.1158/0008-5472.CAN-20-4107
9. Wang YP, Lei QY. Metabolic recoding of epigenetics in cancer. Cancer Commun (Lond) (2018) 38(1):25. doi: 10.1186/s40880-018-0302-3
10. Boccaletto P, Stefaniak F, Ray A, Cappannini A, Mukherjee S, Purta E, et al. Modomics: A database of rna modification pathways. 2021 update. Nucleic Acids Res (2022) 50(D1):D231–D5. doi: 10.1093/nar/gkab1083
11. Xiao W, Adhikari S, Dahal U, Chen YS, Hao YJ, Sun BF, et al. Nuclear M(6)a reader Ythdc1 regulates mrna splicing. Mol Cell (2016) 61(4):507–19. doi: 10.1016/j.molcel.2016.01.012
12. Roundtree IA, Luo GZ, Zhang Z, Wang X, Zhou T, Cui Y, et al. Ythdc1 mediates nuclear export of N(6)-methyladenosine methylated mrnas. Elife (2017) 6. doi: 10.7554/eLife.31311
13. Wang X, Lu Z, Gomez A, Hon GC, Yue Y, Han D, et al. N6-Methyladenosine-Dependent regulation of messenger rna stability. Nature (2014) 505(7481):117–20. doi: 10.1038/nature12730
14. Zhou J, Wan J, Gao X, Zhang X, Jaffrey SR, Qian SB. Dynamic M(6)a mrna methylation directs translational control of heat shock response. Nature (2015) 526(7574):591–4. doi: 10.1038/nature15377
15. Li HB, Tong J, Zhu S, Batista PJ, Duffy EE, Zhao J, et al. M(6)a mrna methylation controls T cell homeostasis by targeting the il-7/Stat5/Socs pathways. Nature (2017) 548(7667):338–42. doi: 10.1038/nature23450
16. Lin S, Liu Q, Lelyveld VS, Choe J, Szostak JW, Gregory RI. Mettl1/Wdr4-mediated M(7)G trna methylome is required for normal mrna translation and embryonic stem cell self-renewal and differentiation. Mol Cell (2018) 71(2):244–55.e5. doi: 10.1016/j.molcel.2018.06.001
17. Sikorski PJ, Warminski M, Kubacka D, Ratajczak T, Nowis D, Kowalska J, et al. The identity and methylation status of the first transcribed nucleotide in eukaryotic mrna 5' cap modulates protein expression in living cells. Nucleic Acids Res (2020) 48(4):1607–26. doi: 10.1093/nar/gkaa032
18. Song B, Tang Y, Chen K, Wei Z, Rong R, Lu Z, et al. M7ghub: Deciphering the location, regulation and pathogenesis of internal mrna N7-methylguanosine (M7g) sites in human. Bioinformatics (2020) 36(11):3528–36. doi: 10.1093/bioinformatics/btaa178
19. Enroth C, Poulsen LD, Iversen S, Kirpekar F, Albrechtsen A, Vinther J. Detection of internal N7-methylguanosine (M7g) rna modifications by mutational profiling sequencing. Nucleic Acids Res (2019) 47(20):e126. doi: 10.1093/nar/gkz736
20. Tomikawa C. 7-methylguanosine modifications in transfer rna (Trna). Int J Mol Sci (2018) 19(12). doi: 10.3390/ijms19124080
21. Pandolfini L, Barbieri I, Bannister AJ, Hendrick A, Andrews B, Webster N, et al. Mettl1 promotes let-7 microrna processing Via M7g methylation. Mol Cell (2019) 74(6):1278–90.e9. doi: 10.1016/j.molcel.2019.03.040
22. Boulias K, Greer EL. Put the pedal to the Mettl1: Adding internal M(7)G increases mrna translation efficiency and augments mirna processing. Mol Cell (2019) 74(6):1105–7. doi: 10.1016/j.molcel.2019.06.004
23. Yang B, Wang JQ, Tan Y, Yuan R, Chen ZS, Zou C. Rna methylation and cancer treatment. Pharmacol Res (2021) 174:105937. doi: 10.1016/j.phrs.2021.105937
24. Chen Z, Zhu W, Zhu S, Sun K, Liao J, Liu H, et al. Mettl1 promotes hepatocarcinogenesis Via M(7) G trna modification-dependent translation control. Clin Transl Med (2021) 11(12):e661. doi: 10.1002/ctm2.661
25. Zhu S, Wu Y, Zhang X, Peng S, Xiao H, Chen S, et al. Targeting N(7)-methylguanosine trna modification blocks hepatocellular carcinoma metastasis after insufficient radiofrequency ablation. Mol Ther (2022). doi: 10.1016/j.ymthe.2022.08.004
26. Liao J, Yi Y, Yue X, Wu X, Zhu M, Chen Y, et al. Methyltransferase 1 is required for nonhomologous end-joining repair and renders hepatocellular carcinoma resistant to radiotherapy. Hepatology (2022). doi: 10.1002/hep.32615
27. Xia P, Zhang H, Xu K, Jiang X, Gao M, Wang G, et al. Myc-targeted Wdr4 promotes proliferation, metastasis, and sorafenib resistance by inducing Ccnb1 translation in hepatocellular carcinoma. Cell Death Dis (2021) 12(7):691. doi: 10.1038/s41419-021-03973-5
28. Sheng J, Zhang J, Wang L, Tano V, Tang J, Wang X, et al. Topological analysis of hepatocellular carcinoma tumour microenvironment based on imaging mass cytometry reveals cellular neighbourhood regulated reversely by macrophages with different ontogeny. Gut (2022) 71(6):1176–91. doi: 10.1136/gutjnl-2021-324339
29. Ma L, Hernandez MO, Zhao Y, Mehta M, Tran B, Kelly M, et al. Tumor cell biodiversity drives microenvironmental reprogramming in liver cancer. Cancer Cell (2019) 36(4):418–30.e6. doi: 10.1016/j.ccell.2019.08.007
30. Han D, Liu J, Chen C, Dong L, Liu Y, Chang R, et al. Anti-tumour immunity controlled through mrna M(6)a methylation and Ythdf1 in dendritic cells. Nature (2019) 566(7743):270–4. doi: 10.1038/s41586-019-0916-x
31. Wang L, Hui H, Agrawal K, Kang Y, Li N, Tang R, et al. M(6) a rna methyltransferases Mettl3/14 regulate immune responses to anti-Pd-1 therapy. EMBO J (2020) 39(20):e104514. doi: 10.15252/embj.2020104514
32. Zhang B, Wu Q, Li B, Wang D, Wang L, Zhou YL. M(6)a regulator-mediated methylation modification patterns and tumor microenvironment infiltration characterization in gastric cancer. Mol Cancer (2020) 19(1):53. doi: 10.1186/s12943-020-01170-0
33. Wang L, Wu J, Song S, Chen H, Hu Y, Xu B, et al. Plasma exosome-derived sentrin sumo-specific protease 1: A prognostic biomarker in patients with osteosarcoma. Front Oncol (2021) 11:625109. doi: 10.3389/fonc.2021.625109
34. Mlecnik B, Tosolini M, Kirilovsky A, Berger A, Bindea G, Meatchi T, et al. Histopathologic-based prognostic factors of colorectal cancers are associated with the state of the local immune reaction. J Clin Oncol (2011) 29(6):610–8. doi: 10.1200/JCO.2010.30.5425
35. Mariathasan S, Turley SJ, Nickles D, Castiglioni A, Yuen K, Wang Y, et al. Tgfbeta attenuates tumour response to pd-L1 blockade by contributing to exclusion of T cells. Nature (2018) 554(7693):544–8. doi: 10.1038/nature25501
36. Hanzelmann S, Castelo R, Guinney J. Gsva: Gene set variation analysis for microarray and rna-seq data. BMC Bioinf (2013) 14:7. doi: 10.1186/1471-2105-14-7
37. Charoentong P, Finotello F, Angelova M, Mayer C, Efremova M, Rieder D, et al. Pan-cancer immunogenomic analyses reveal genotype-immunophenotype relationships and predictors of response to checkpoint blockade. Cell Rep (2017) 18(1):248–62. doi: 10.1016/j.celrep.2016.12.019
38. Newman AM, Liu CL, Green MR, Gentles AJ, Feng W, Xu Y, et al. Robust enumeration of cell subsets from tissue expression profiles. Nat Methods (2015) 12(5):453–7. doi: 10.1038/nmeth.3337
39. Sotiriou C, Wirapati P, Loi S, Harris A, Fox S, Smeds J, et al. Gene expression profiling in breast cancer: Understanding the molecular basis of histologic grade to improve prognosis. J Natl Cancer Inst (2006) 98(4):262–72. doi: 10.1093/jnci/djj052
40. Zeng D, Li M, Zhou R, Zhang J, Sun H, Shi M, et al. Tumor microenvironment characterization in gastric cancer identifies prognostic and immunotherapeutically relevant gene signatures. Cancer Immunol Res (2019) 7(5):737–50. doi: 10.1158/2326-6066.CIR-18-0436
41. Reinhold WC, Sunshine M, Liu H, Varma S, Kohn KW, Morris J, et al. Cellminer: A web-based suite of genomic and pharmacologic tools to explore transcript and drug patterns in the nci-60 cell line set. Cancer Res (2012) 72(14):3499–511. doi: 10.1158/0008-5472.CAN-12-1370
42. Hazra A, Gogtay N. Biostatistics series module 3: Comparing groups: Numerical variables. Indian J Dermatol (2016) 61(3):251–60. doi: 10.4103/0019-5154.182416
43. Chen DS, Mellman I. Elements of cancer immunity and the cancer-immune set point. Nature (2017) 541(7637):321–30. doi: 10.1038/nature21349
44. Sun C, Mezzadra R, Schumacher TN. Regulation and function of the pd-L1 checkpoint. Immunity (2018) 48(3):434–52. doi: 10.1016/j.immuni.2018.03.014
45. Chen H, Yang M, Wang Q, Song F, Li X, Chen K. The new identified biomarkers determine sensitivity to immune check-point blockade therapies in melanoma. Oncoimmunology (2019) 8(8):1608132. doi: 10.1080/2162402X.2019.1608132
46. Chen H, Chong W, Wu Q, Yao Y, Mao M, Wang X. Association of Lrp1b mutation with tumor mutation burden and outcomes in melanoma and non-small cell lung cancer patients treated with immune check-point blockades. Front Immunol (2019) 10:1113. doi: 10.3389/fimmu.2019.01113
47. Shen S, Zhang R, Jiang Y, Li Y, Lin L, Liu Z, et al. Comprehensive analyses of M6a regulators and interactive coding and non-coding rnas across 32 cancer types. Mol Cancer (2021) 20(1):67. doi: 10.1186/s12943-021-01362-2
48. Chen Y, Peng C, Chen J, Chen D, Yang B, He B, et al. Wtap facilitates progression of hepatocellular carcinoma Via M6a-Hur-Dependent epigenetic silencing of Ets1. Mol Cancer (2019) 18(1):127. doi: 10.1186/s12943-019-1053-8
49. Li Q, Ni Y, Zhang L, Jiang R, Xu J, Yang H, et al. Hif-1alpha-Induced expression of M6a reader Ythdf1 drives hypoxia-induced autophagy and malignancy of hepatocellular carcinoma by promoting Atg2a and Atg14 translation. Signal Transduct Target Ther (2021) 6(1):76. doi: 10.1038/s41392-020-00453-8
50. Chong W, Shang L, Liu J, Fang Z, Du F, Wu H, et al. M(6)a regulator-based methylation modification patterns characterized by distinct tumor microenvironment immune profiles in colon cancer. Theranostics (2021) 11(5):2201–17. doi: 10.7150/thno.52717
51. Tauriello DVF, Palomo-Ponce S, Stork D, Berenguer-Llergo A, Badia-Ramentol J, Iglesias M, et al. Tgfbeta drives immune evasion in genetically reconstituted colon cancer metastasis. Nature (2018) 554(7693):538–43. doi: 10.1038/nature25492
52. Panagi M, Voutouri C, Mpekris F, Papageorgis P, Martin MR, Martin JD, et al. Tgf-beta inhibition combined with cytotoxic nanomedicine normalizes triple negative breast cancer microenvironment towards anti-tumor immunity. Theranostics (2020) 10(4):1910–22. doi: 10.7150/thno.36936
53. Dai Z, Liu H, Liao J, Huang C, Ren X, Zhu W, et al. N(7)-methylguanosine trna modification enhances oncogenic mrna translation and promotes intrahepatic cholangiocarcinoma progression. Mol Cell (2021) 81(16):3339–55 e8. doi: 10.1016/j.molcel.2021.07.003
54. Ma J, Han H, Huang Y, Yang C, Zheng S, Cai T, et al. Mettl1/Wdr4-mediated M(7)G trna modifications and M(7)G codon usage promote mrna translation and lung cancer progression. Mol Ther (2021) 29(12):3422–35. doi: 10.1016/j.ymthe.2021.08.005
55. Ying X, Liu B, Yuan Z, Huang Y, Chen C, Jiang X, et al. Mettl1-M(7) G-Egfr/Efemp1 axis promotes the bladder cancer development. Clin Transl Med (2021) 11(12):e675. doi: 10.1002/ctm2.675
Keywords: hepatocellular carcinoma, m7G modification, tumor microenvironment, immunotherapy, prognosis, drug response
Citation: Wang L, Hu X, Liu X, Feng Y, Zhang Y, Han J, Liu X and Meng F (2022) m7G regulator-mediated methylation modification patterns define immune cell infiltration and patient survival. Front. Immunol. 13:1022720. doi: 10.3389/fimmu.2022.1022720
Received: 18 August 2022; Accepted: 18 October 2022;
Published: 28 October 2022.
Edited by:
Ashish Tyagi, Texas A&M University, United StatesReviewed by:
Rio Sugimura, The University of Hong Kong, Hong Kong SAR, ChinaManling Huang, The First Affiliated Hospital of Sun Yat-sen University, China
Copyright © 2022 Wang, Hu, Liu, Feng, Zhang, Han, Liu and Meng. This is an open-access article distributed under the terms of the Creative Commons Attribution License (CC BY). The use, distribution or reproduction in other forums is permitted, provided the original author(s) and the copyright owner(s) are credited and that the original publication in this journal is cited, in accordance with accepted academic practice. No use, distribution or reproduction is permitted which does not comply with these terms.
*Correspondence: Fankun Meng, mengfankun@ccmu.edu.cn