 Jiaqi Hu
 Chongyin Han1
 Jiayuan Zhong
 Huisheng Liu
 Rui Liu
 Wei Luo
 Fei Ling
- 1School of Biology and Biological Engineering, South China University of Technology, Guangzhou, China
- 2School of Mathematics, South China University of Technology, Guangzhou, China
- 3The First People’s Hospital of Foshan, Sun Yat-sen University, Foshan, China
- 4Pazhou Lab, Guangzhou, China
Immunotherapy has achieved positive clinical responses in various cancers. However, in advanced colorectal cancer (CRC), immunotherapy is challenging because of the deterioration of T-cell exhaustion, the mechanism of which is still unclear. In this study, we depicted CD8+ T-cell developmental trajectories and characterized the pre-exhausted T cells isolated from CRC patients in the scRNA-seq data set using a dynamic network biomarker (DNB). Moreover, CCT6A identified by DNB was a biomarker for pre-exhausted T-cell subpopulation in CRC. Besides, TUBA1B expression was triggered by CCT6A as DNB core genes contributing to CD8+ T cell exhaustion, indicating that core genes serve as biomarkers in pre-exhausted T cells. Remarkably, both TUBA1B and CCT6A expressions were significantly associated with the overall survival of COAD patients in the TCGA database (p = 0.0082 and p = 0.026, respectively). We also observed that cellular communication between terminally differentiated exhausted T cells and pre-exhausted T cells contributes to exhaustion. These findings provide new insights into the mechanism of T-cell exhaustion and provide clue for targeted immunotherapy in CRC.
Introduction
Colorectal cancer (CRC) is the third most commonly diagnosed cancer and the fourth most fatal cancer globally (1). With the entry of tumor therapy into the PD1/PD-L1 immunization era, many cancers have achieved clinical success except for some CRC patients (2). Most T cells in advanced CRC patients are exhausted (3), and T cell exhaustion is considered to be an important factor affecting the efficacy of immunotherapy in patients with CRC (4). T-cell exhaustion is a process of dysfunction that commonly occurs in cancer; it is caused by antigens and persistence of inflammation (4, 5). However, the process of CD8+ T cell exhaustion in CRC is partially unclear. Exhausted T cells have been characterized by progressive loss of effector functions, high and sustained inhibitory receptor expression, homeostatic self-renewal, and distinct transcriptional (6). Additionally, it has been demonstrated that in the immune microenvironment of non-small cell lung cancer (NSCLC), there is a certain kind of pre-exhausted CD8+ T cell population (7), which leads to poor prognosis, during T-cell exhaustion. Thus, it is vital to find pre-exhausted T cells in CRC based on the T-cell exhaustion process. Targeting pre-exhausted T cells may have a larger clinical window than those targeting only terminal Tex cells. Single-cell RNA sequencing is a powerful tool to resolve the diversity of T cells in the CRC microenvironment. Combined scRNA-seq and DNB together, we might be able to find pre-exhausted CD8+ T cells and core functional molecular network in CRC microenvironment. However, it is unknown whether these genes play a role in driving pre-exhausted CD8+ T cell toward exhaustion.
Many factors contribute to T-cell exhaustion, including cytokines, transcription factors, and cell–cell interactions (4). A previous study found that the large-scale T-cell activation, release of cytokines and chemokines, and massive T cell proliferation lead to profound T-cell exhaustion in humans by the stimulation of CD3 (8). However, it is unknown whether these genes play a role in driving pre-exhausted CD8+ T toward exhaustion. These genes may be breakthroughs in suppressing T cell exhaustion or may be able to serve as important clinical prognostic indicators. Besides, multi-region single-cell sequencing reveals that cell-cell communication in tumor microenvironment somehow also facilitates immune escape (9). And cell-cell communication can provide additional insight to improve predicting response to therapies (10). Thus, pre-exhausted CD8+ T cells may contribute significantly to T cell exhaustion at both the molecular and cellular levels.
In this study, we aimed to elucidate the process of T-cell exhaustion in CRC and identify relevant targets and biomarkers in pre-exhausted T cell. To identify the biomarkers for pre-exhausted T cell in CRC, we constructed the CD8+ T-cell differentiation trajectory in CRC tumor tissues on the scRNA-seq data set provided by Zemin Zhang’s lab (GSE108989) (11, 12). We also used the DNB method in scRNA-seq data sets to analyze the gene network changes of CD8+ T cells in CRC tumor tissues during exhaustion and explain the functions of those core genes at network level. Lastly, we explored the cellular communication between pre-exhausted T cells and terminal Tex cells, finding how Tex cells promote pre-exhausted cells to exhaust. In conclusion, this study not only successfully identified a population of pre-exhausted T cells in the CRC immune microenvironment but also elucidated their bidirectional role in T cell exhaustion at both network and cellular levels. We hope that these results will provide novel prognosis markers or helpful targets for better immunotherapy in CRC.
Materials and Methods
Theoretical Basis
The SCE method is designed to detect a critical state before a critical transition from the relatively normal state into the exhausted state (Figure 1A). There exists a group of molecules defined as DNB biomolecules, which satisfy the following three statistic conditions:
1. SDin for genes inside the DNB group drastically increases, where SDin represents the standard deviation or coefficient of variation;
2. PCCin for genes inside the DNB group drastically increases, where PCCin represents the Pearson’s correlation coefficient;
3. PCCout rapidly decreases, where PCCout represents the Pearson’s correlation coefficient between any one member in the DNB group and any other non-DNB member;
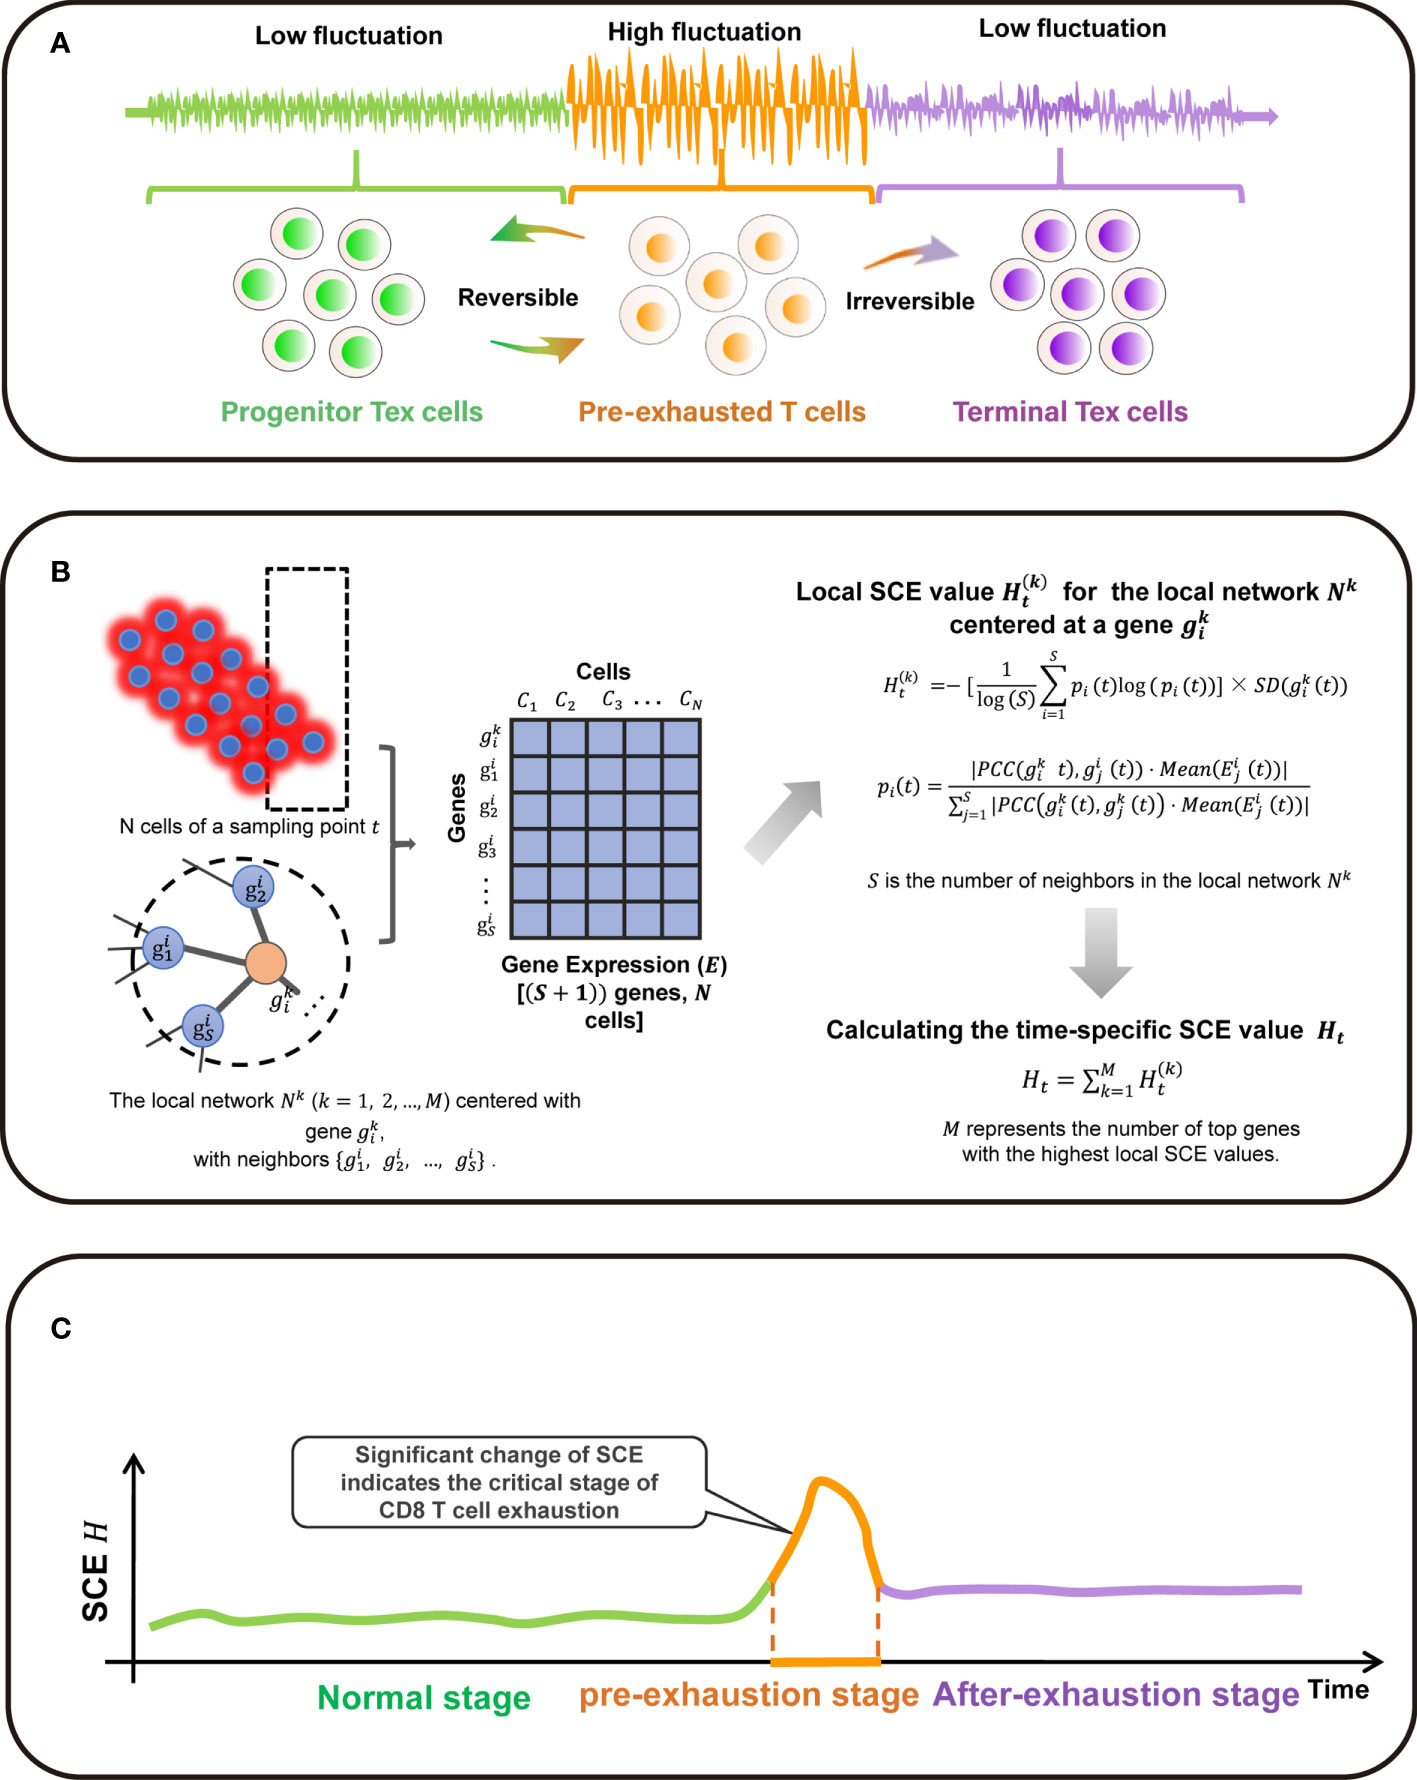
Figure 1 Overall project design together with algorithm details. (A) The three stages transition of PPI network during T cell exhaustion progression in classic dynamic network biomarker theory. (B) Single-cell sample-based node entropy algorithm. (C) A spike of the SNE curve exists in T cell exhaustion progression.
The abovementioned three statistic conditions are necessary conditions for phase transition in biological system. According to that, it is obvious that the critical transition of a system is actually quantified by some variables that are strongly fluctuating. The perturbation of local networks of these variables provides the early-warning signals of the critical transition.
Algorithm to Detect the Signal of Critical Transition Based on Single-Cell Entropy (SCE)
Given the time series of single-cell RNA sequencing (scRNA-seq) data, the following algorithm is carried out to predict the critical transition (Figure 1B).
[Step 1] Normalizing the scRNA-seq data. At each time point, the logarithm + is applied to normalize the initial gene expression matrix with M rows/genes and N columns/cells.
[Step 2]. Map the genes to protein-protein interaction (PPI) network defined as a global template network NG. In this work, the PPI network is downloaded from the STRING database, in which all the isolated nodes are discarded. Clearly, each individual’s PPI network is identical as the global template network NG.
[Step 3] Extracting each local network/subnetwork from global template network NG. Specifically, there are M local networks Nk (k = 1, 2, 3, …, M) corresponding to its M genes. The local network Nk is centered at a gene , whose 1st-order neighbors are the edges
[Step 4] Calculating the gene-specific local SCE value for each local network at a sampling point t. Given a local network Nk centered at a gene , the corresponding local SCE value is obtained from
with
where represents the Pearson’s correlation coefficient (PCC) between the center gene and a neighbor at a sampling point t and represents the standard deviations of the central gene at a sampling point t. The value represents the gene expression of a neighbor and constant S is the number of neighbors in the local network Nk. Thus, the local SCE value (Eq. (2)) is dependent not only on the expression of the center gene of a local network but also on the contribution from the neighboring genes.
[Step 5] Calculating the time-specific SCE value Ht based on a group of genes with highest local SCE values, i.e.,
where constant T is an adjustable parameter representing the number of top 5% genes with the highest local SCE values. In Eq. (4), Ht can be considered as the SCE score of sampling point t and detect the early-warning signals of the critical transition. At each time point, the specific SCE values of a certain cell population is used as the time-specific SCE score in the tipping-point detection.
When the system approaches the vicinity of the critical point, the signaling genes or dynamical network biomarker (DNB) molecules exhibit obviously collective behaviors with large fluctuations, leading to the property that the Pearson’s correlation coefficient (PCC) and gene expression of DNB members in a critical state are different from those in a before-transition state. Moreover, the term in Eq. (1) also brings a boost to the SCE score of the local network Nk. Therefore, the local SCE value in Eq. (2) or the time-specific SCE value Ht increases when the system is near the tipping point (Figure 1C).
Data Processing and Trajectory Analysis
The scRNA-seq data of CD8+ T cells were from 12 CRC patients from Zemin Zhang’s lab with the accession number GSE108989 (11). The validation of bulk RNA-seq data of COAD was from the TCGA database (13). Then, the exhausted CD8+ T cell differentiation trajectory was inferred after dimension reduction and cell ordering in R package Monocle (version 2.14.0).
Differential Expression and Functional Enrichment Analysis
We performed clustering analysis using Seurat (version 3.2.1) pipelines. The FindNeighbors parameters of 1:20 and resolution parameters of 1.6 were set for CD8+ T cells subpopulation. The function of FindMarkers in R package Seurat (version 3.2.1) was used to find DEG for each cluster. The DEG analysis was performed in with DESeq2 package (version 1.26.0). Both Gene Ontology (GO) and Kyoto Encyclopedia of Genes and Genomes (KEGG) pathway enrichment analyses were performed by clusterProfiler package (version 3.14.3). Also, Cluego (version 2.5.7) plug-in of Cytoscape (version 3.7.2) was adopted for go enrichment analysis. The GSVA analysis was performed using R package GSVA (version 1.34.0). Reactome pathway analysis was performed by Reactome (https://reactome.org) (14).
PPI Network Analysis and Web Tool
The interaction of DNB genes was conducted by Cytoscape (version 3.7.2) software. We exported the adjacency matrix by visualizing in Cytoscape (3.7.2), calculating the degree of each gene using the CytoHubba plugin, and selecting the top 50 genes for visualization. Functional protein interaction analysis was performed using STRING (https://string-db.org/). The possible interaction between cell populations was evaluated using iTALK (version 0.1.0) based on the curated available ligand-receptor pairs implemented in the package. Overall survival curves based on gene expression levels of COAD patients were drawn using the GEPIA2 database (http://gepia2.cancer-pku.cn/).
Statistics and Visualization
We used R (version 3.6.2) for statistical analysis and visualization. The detailed code is available from the link of GitHub (https://github.com/james778800/CRC_Tex_DNB). p ≤ 0.05 was considered to be statistically significant.
Results
Result 1: Trajectory of CD8+ T Cell Exhaustion in CRC and Identification of Cell Subtypes
Single-cell sequencing captured CD8+ cells from different sample origins, including PTC (CD8+ T cells from peripheral blood), NTC (CD8+ T cells from adjacent normal colorectal tissues), and TTC (CD8+ T cells from the tumor). Based on the cluster analysis results, TTC was specific to PTC and NTC (Figure 2A). Exhausted T cells were present in all three tissues, and a series of genes associated with T cell exhaustion in TTC was differentially expressed genes (DEG) (additional file: Table 1). High expression of exhausted T-cell marker genes supported by established studies (4–6, 15), including CXCL13, HAVCR2, and PDCD1, was concentrated in tumor tissue in single-cell transcriptional profiles. T-cell infiltration and exhaustion was specific to tumor tissues, more severely than that in other tissues. High expression of FOS was specific for CD8+ T cells in normal CRC tissue, and SELL was specific for PTC. In addition, the expression of exhaustion marker gene LAYN was high in NTC and TTC (Figure 2B and Figure S1B). Thereafter, we extracted a sample of 1646 labeled CD8+ T cells from tumor tissues. Among them, CD8_C07-LAYN accounted for the greatest number of CD8+ T cells (Figure S1A).
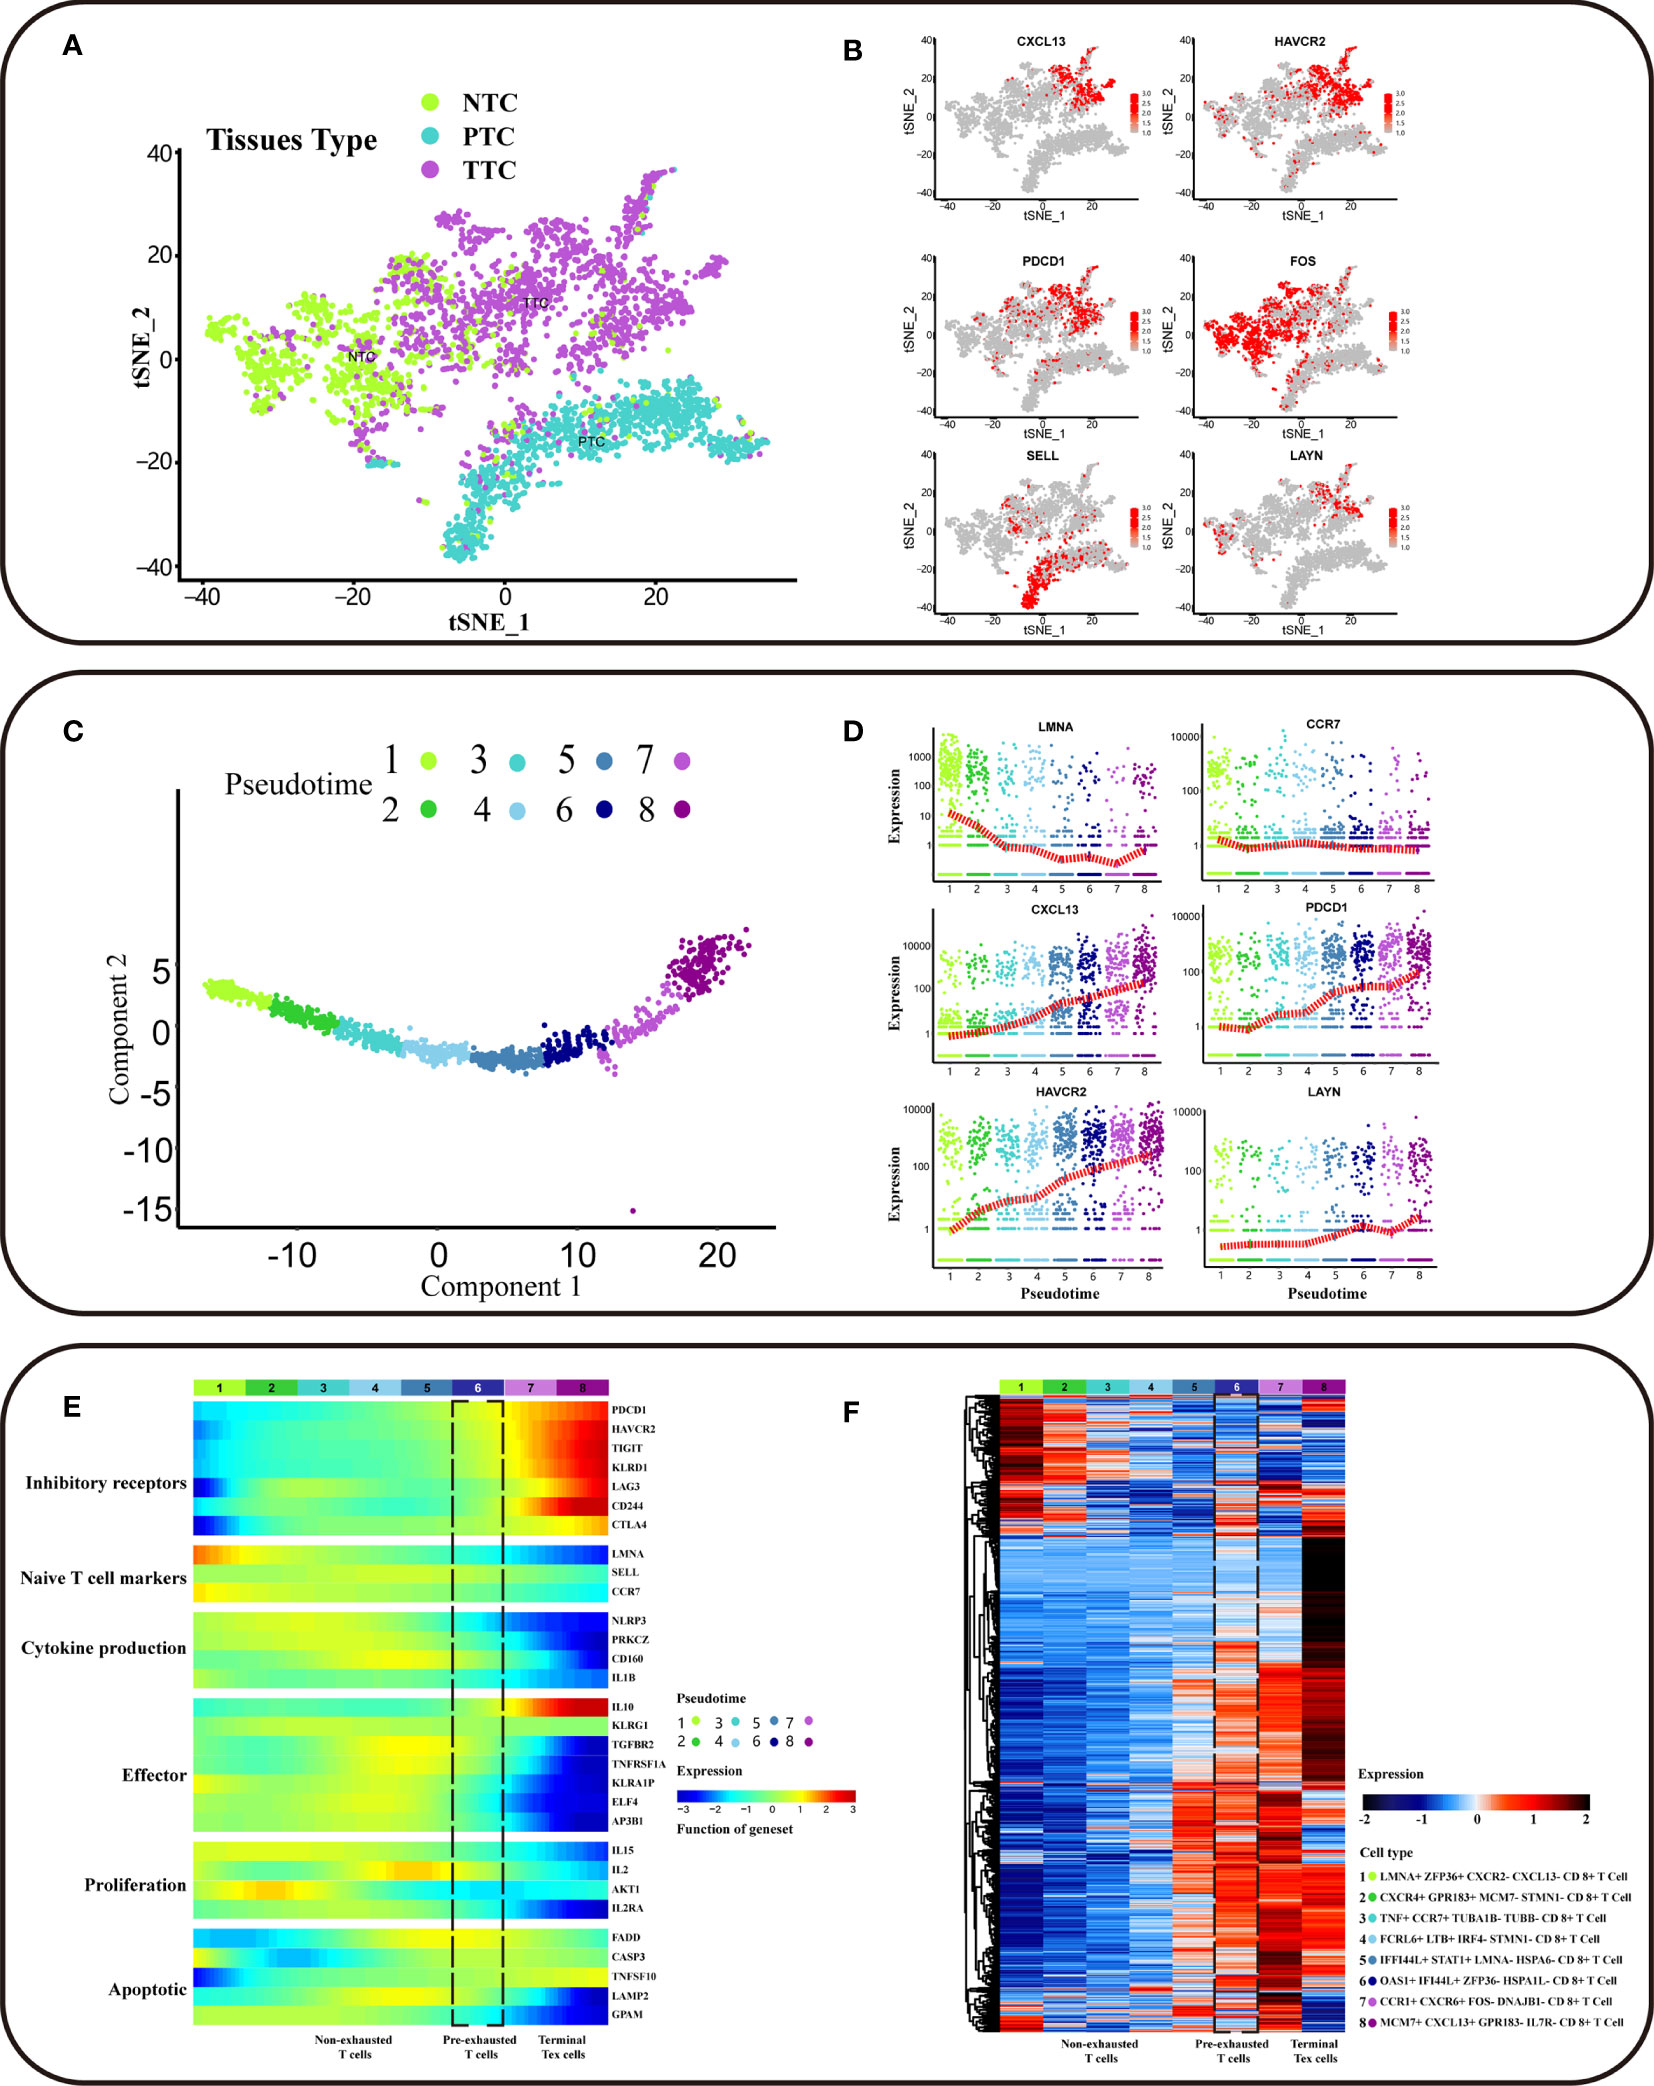
Figure 2 Trajectory of differentiation profiles of CD8+ T cells. (A) t-SNE clustering of T cells (n = 3628) from scRNA-seq of CRC patients showing three clusters (n = 3). Bright green dots for NTC (CD8+ T cells from adjacent normal colorectal tissues), blue-green dots for PTC (CD8+ T cells from peripheral blood), purple dots for TTC (CD8+ T cells from tumor). (B) The gene expression of HAVCR2, CXCL13, PDCD1, FOS, SELL, and LAYN in the scRNA-seq landscape. Low to high gene expression is indicated by a gradation from grey to red. The cell subpopulations with high gene expression correspond to sources referenced to the location of the NTC, PTC, and TTC clusters in (A). (C) Potential developmental trajectory of CD8+ T cells in tumor tissues (n = 1646) inferred by Monocle2 based on gene expression. Pseudotime is shown numbered from 1 to 8, and the start of pseudotime is indicated. (D) The expression levels of LAYN, CXCL13, CCR7, LMNA, PDCD1and HAVCR2 in different pseudotime of CD8+ T cell subpopulation. The x-axis represents pseudotime, and the y-axis represents gene expression. The red dash indicates the average gene expression. (E) The heatmap showing the dynamic expression changes of genes, including the function of T cell cytokine production, T cell apoptotic process, inhibitory receptors, cell proliferation, regulators associated with T cell exhaustion and T cell effector function. (F) The heatmap showing cell type-specific gene marker expression in the different T cell clusters. The marker genes for each cluster as determined by Seurat analysis with four selected genes per cluster highlighted on the top.
CD8+ T cell exhaustion contained eight clusters based on different intracellular gene expression patterns (Figures 2C). The CD8+ T cell subpopulation at the initiation of differentiation trajectory showed significantly high expression of LMNA and CCR7 genes (Figures 2D). Associations between PD-L1/PD-1 expression were analyzed, and PDCD1 expression was found to be increased with T-cell exhaustion. As T-cell exhaustion had not yet started, the expression of naïve T cell markers was high, besides the expression of inhibitory receptor (IRS) genes was low (Figures 2D, E). In the exhaustion process, non-exhausted and pre-exhausted and terminal exhausted T-cell subpopulations have unique characteristics. In addition to the high expression of IRS genes with the exhaustion of T cells, the key functions genes in T cell were also changed. The low expression of T cell effector function and cytokine production genes with the exhaustion of T cells, except for IL10. In addition, IL-10 was the STAT3-inducible cytokine associated with attenuated T cell activation (6). IL10 expression was high in terminal Tex cells, suggesting that immune response was decreased. In contrast, the expression of IL10 in pre-exhausted T cells was lower than terminal Tex cells, suggesting that pre-exhausted T cells may retain some immune response function. The expression of CD160 in pre-exhausted T cells was higher than terminal Tex cells, suggesting that the cytolytic effector activity of pre-exhausted T cells may begin to weaken. Besides, non-exhausted T cells can maintain cellular function and homeostatic self-renewal in an antigen-independent manner via the cytokines IL-15 (16, 17). However, the expression of IL15 was low in terminal subsets. The terminal subsets were unable to mediate homeostatic self-renewal through IL-15 and the low expression of IL15 in pre-exhausted T cells. The low expression of cell proliferation genes includes IL-2, with the exhaustion of T cells. IL-2 cytokines were involved in T-cell activation and proliferation (18, 19). The expression of IL2 was low in terminal Tex cells, and terminal subsets were inactive in responding to additional proliferative signals. Besides, the expression of IL2 was lower in pre-exhausted T cells than non-exhausted subsets, implying that the proliferative effect of pre-exhausted T cells begins to be gradually lost due to persistent antigenic signaling. The expression of genes related to apoptosis, including FADD, CASP3, LAMP3, and TNFSF10, was low in both terminal Tex cells and pre-exhausted T cells. This suggested that T- cell apoptosis was disrupted with the exhaustion of T cells (Figure 2E).
To identify the specific cell populations involved in exhaustion, we performed DEG analysis for different subpopulations of CD8+ T cells. We labeled the CD8+ T cell subpopulation at initiation of differentiation trajectory as LMNA+ ZFP36+ CXCL13− CXCR− CD8+ T cells. This subpopulation may have exhaustion potential. Also, it still has the normal immune functions, with high expression of progenitor-like CD8+ T cell marker genes (Figure 2D). In contrast, the CD8+ T cell subpopulation at end of differentiation trajectory showed high expression of inhibitory receptor (IRS) genes, including CXCL13 and HAVCR2. CXCL13 and HAVCR2 were DEGs in this subpopulation (additional file: Table 2). In addition, we observed that terminal exhausted T cell subpopulation are different. We labeled the terminal exhausted T cell as MCM7+ CXCL13+ GPR183- IL7R- CD8+ T cell and CCR1+ CXCR6+ FOS− DNAJB1− CD8+ T cell (Figure 2F). In conclusion, we explored the trajectory of CD8+ T cell exhaustion in CRC clinical tumor tissues.
Result 2: CCT6A Identified by DNB Was a Biomarker for Pre-Exhausted T Cell Subpopulation Associated With CRC Survival
We found a pre-exhausted CD8+ T cell subpopulation using the DNB method, with a strong signal of the critical state before CD8+ T cell exhaustion by a significant change of single-cell entropy (SCE) at the sixth period (Figure 3A). We labeled the sixth-period subpopulation as OAS1+ IFI44L+ ZFP36−HSPA1L− CD8+ T cells. Notably, OAS1, the pre-exhausted marker, was the DEG for these pre-exhausted CD8+ T cells and a DNB gene, indicating that the cell subpopulation started to show exhaustion characteristics and could be defined as the pre-exhausted CD8+ T cells. We obtained a total of 230 DNB genes. At the critical point, the DNB module genes fluctuated enormously with a high deviation in their gene expression and were highly correlated with the module inside. Thus, we constructed a network for DNB core genes, ranked high by the molecular degree in the network, such as CCT2, CCT5, EIF4A3, and CCT6A, which may play a key role in CD8+ T cell exhaustion (Figure 3B, Figure S1C and additional file: Table 3). GO enrichment analysis of DNB genes indicated that three GO terms were significantly enriched, including the regulation of hematopoietic stem cell differentiation, regulation of hematopoiesis, and type I interferon signaling pathway (Figures S2A–C).
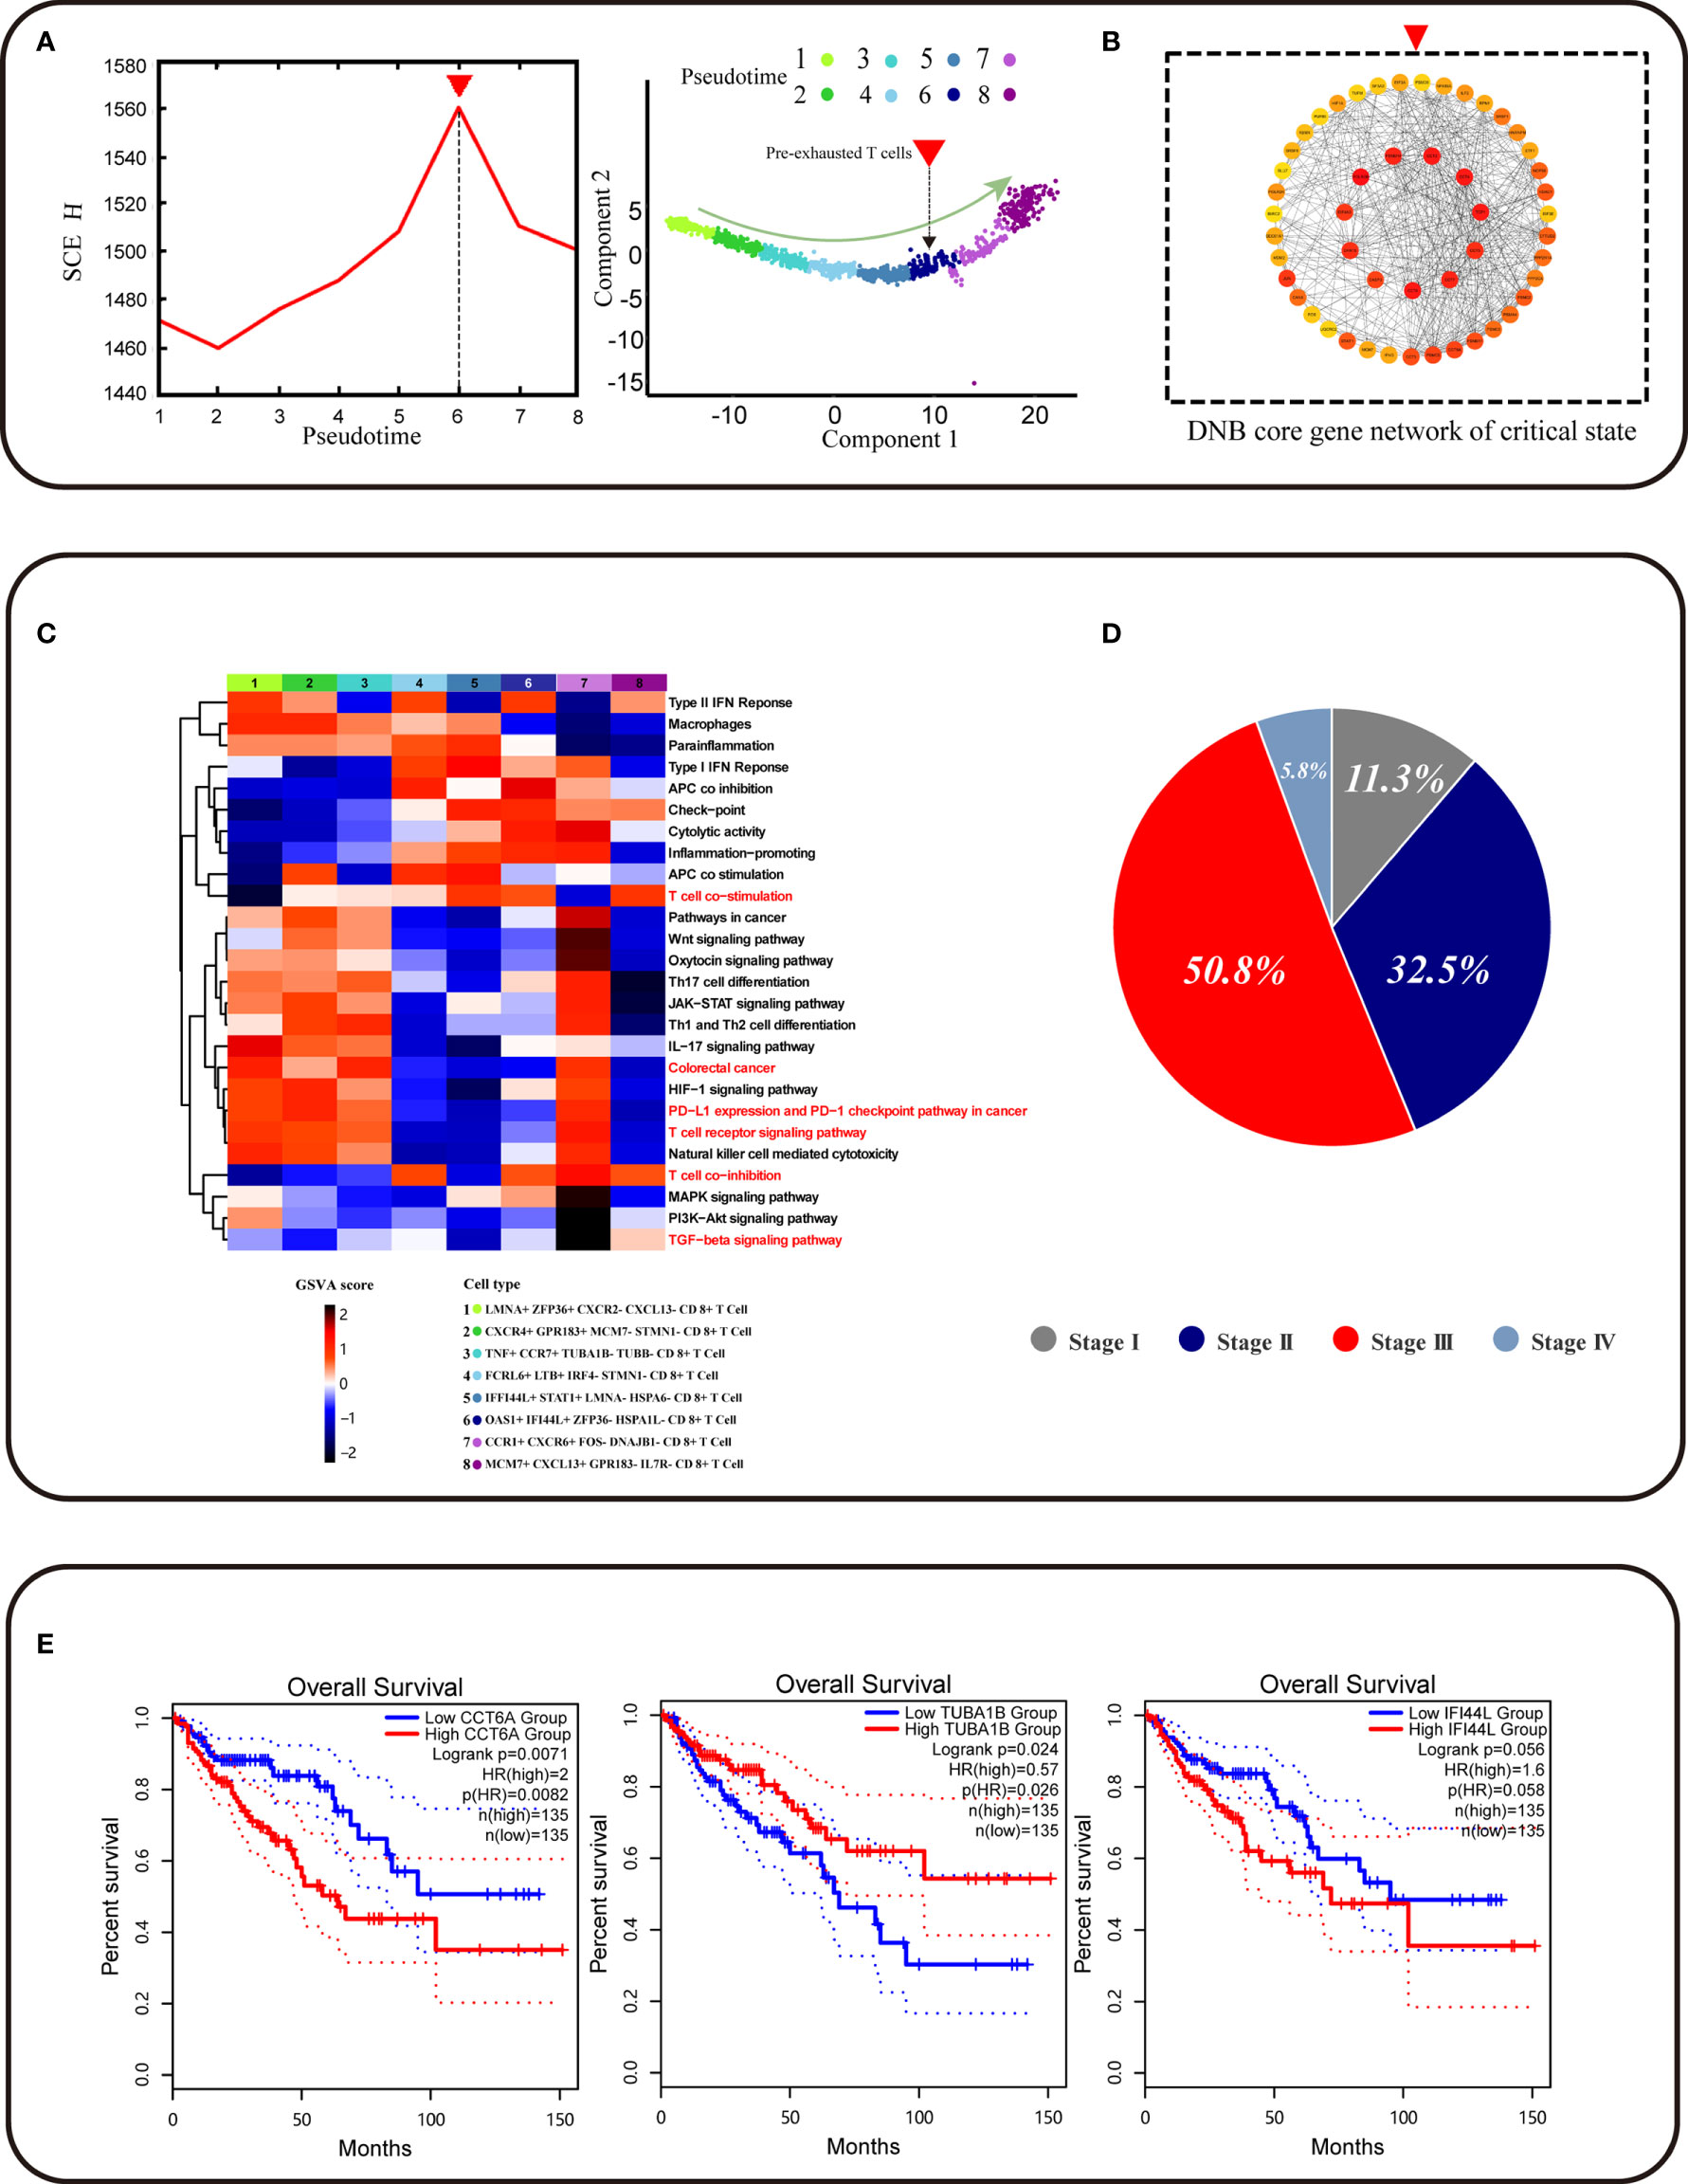
Figure 3 Identification of CD8+ T cell subtype and core genes survival analyses. (A) The graph on the left shows that the curve of SNE score H defined in Methods suddenly increases when the system is near the critical point (p = 0), which is viewed as a critical state transition at a bifurcation point. The graph on the right shows that pre-exhausted T cells were at critical state and CD8+ T cell developmental trajectory is same as Figure 2C. (B) The graph represents the gene regulatory network for the DNB core genes. (C) Function analysis (GSVA) shows that different gene sets may play a different role in CD8+ T cell exhaustion progress. (D) Pie chart representing the proportion of patients associated with different periods of colorectal cancer. (E) CCT6A TUBA1B IFI44L survival analyses using the TCGA COAD dataset.
To further identify functional changes of core DNB genes in the pre-exhausted CD8+ T cells defined by DNB, the gene set variation analysis (GSVA) analysis of these CD8+ T cells was performed. The results indicated that the correlation of T cells gradually showed functional degradation with the development of exhaustion and functional correlation in T cell co-stimulation. Functional changes were also associated with the progressive loss of normal immune function of exhausted CD8+ T cells (Figure 3C). The progressive functional increase in type1 IFN response associated with IFNG, as a DNB gene member that functions in the pathway, affects immune function. With the accumulation of cytotoxicity in CD8+ T cell differentiation, pre-exhausted CD8+ T cells gradually enter an exhausted expression pattern. We found apparent changes in the CRC pathway that showed a relationship with CRC progression. Therefore, we found a pre-exhausted T cell subpopulation with gene expression characteristics and functional transition states during T cell exhaustion.
Moreover, we found an increase in the percentage of pre-exhausted CD8+ T cells in different stages of CRC patients in the progression from stage II to stage III of cancer, indicating that the direction of potential pre-exhausted T cells differentiation was correlated with cancer progression (Figure 3D). The expression of genes related to the pre-exhausted T cell subpopulation was validated using TCGA data. IFI44L was the DEG for pre-exhausted CD8+ T cells, and the dataset of COAD in TCGA showed a correlation between this gene and patient survival (p = 0.058). CCT6A as the core gene of DNB gene network expression was significantly associated with the overall survival of COAD patients (p = 0.026) (Figure 3E). The DNB core gene CCT6A, identified using the DNB method, plays a vital role in the DNB core gene network. In addition, it is a biomarker for pre-exhausted T cell subpopulations associated with CRC survival.
Result 3: CCT6A Drives TUBA1B Expression Overturn Changes Contributed to CD8+ T Cell Exhaustion
Based on a previous study, DNB members have been considered leading factors, situated at important positions of pathways that regulate vital immune-associated processes during cell differentiation initiation and development (20, 21). DNB members could affect DNB-neighboring genes. We used a soft clustering algorithm to classify DNB-neighboring genes according to their expression trends and found that the gene expression levels of the CD8+ T cell subpopulation were altered between the critical period and after the critical period (Figure 4A). In addition, the critical period identified by the DNB method was considered as the period of pre-exhausted T cells (Figure 3A). These cells became terminal Tex cells after the critical period. Besides, a series of DNB-neighboring DEG was not only the DEG between pre-exhausted T cells and terminal Tex cells, but also as DNB-neighboring gene, including TUBA1B, IL7R, SGO1 and IL2RA etc. (Figure 4B and additional file: Table 4).
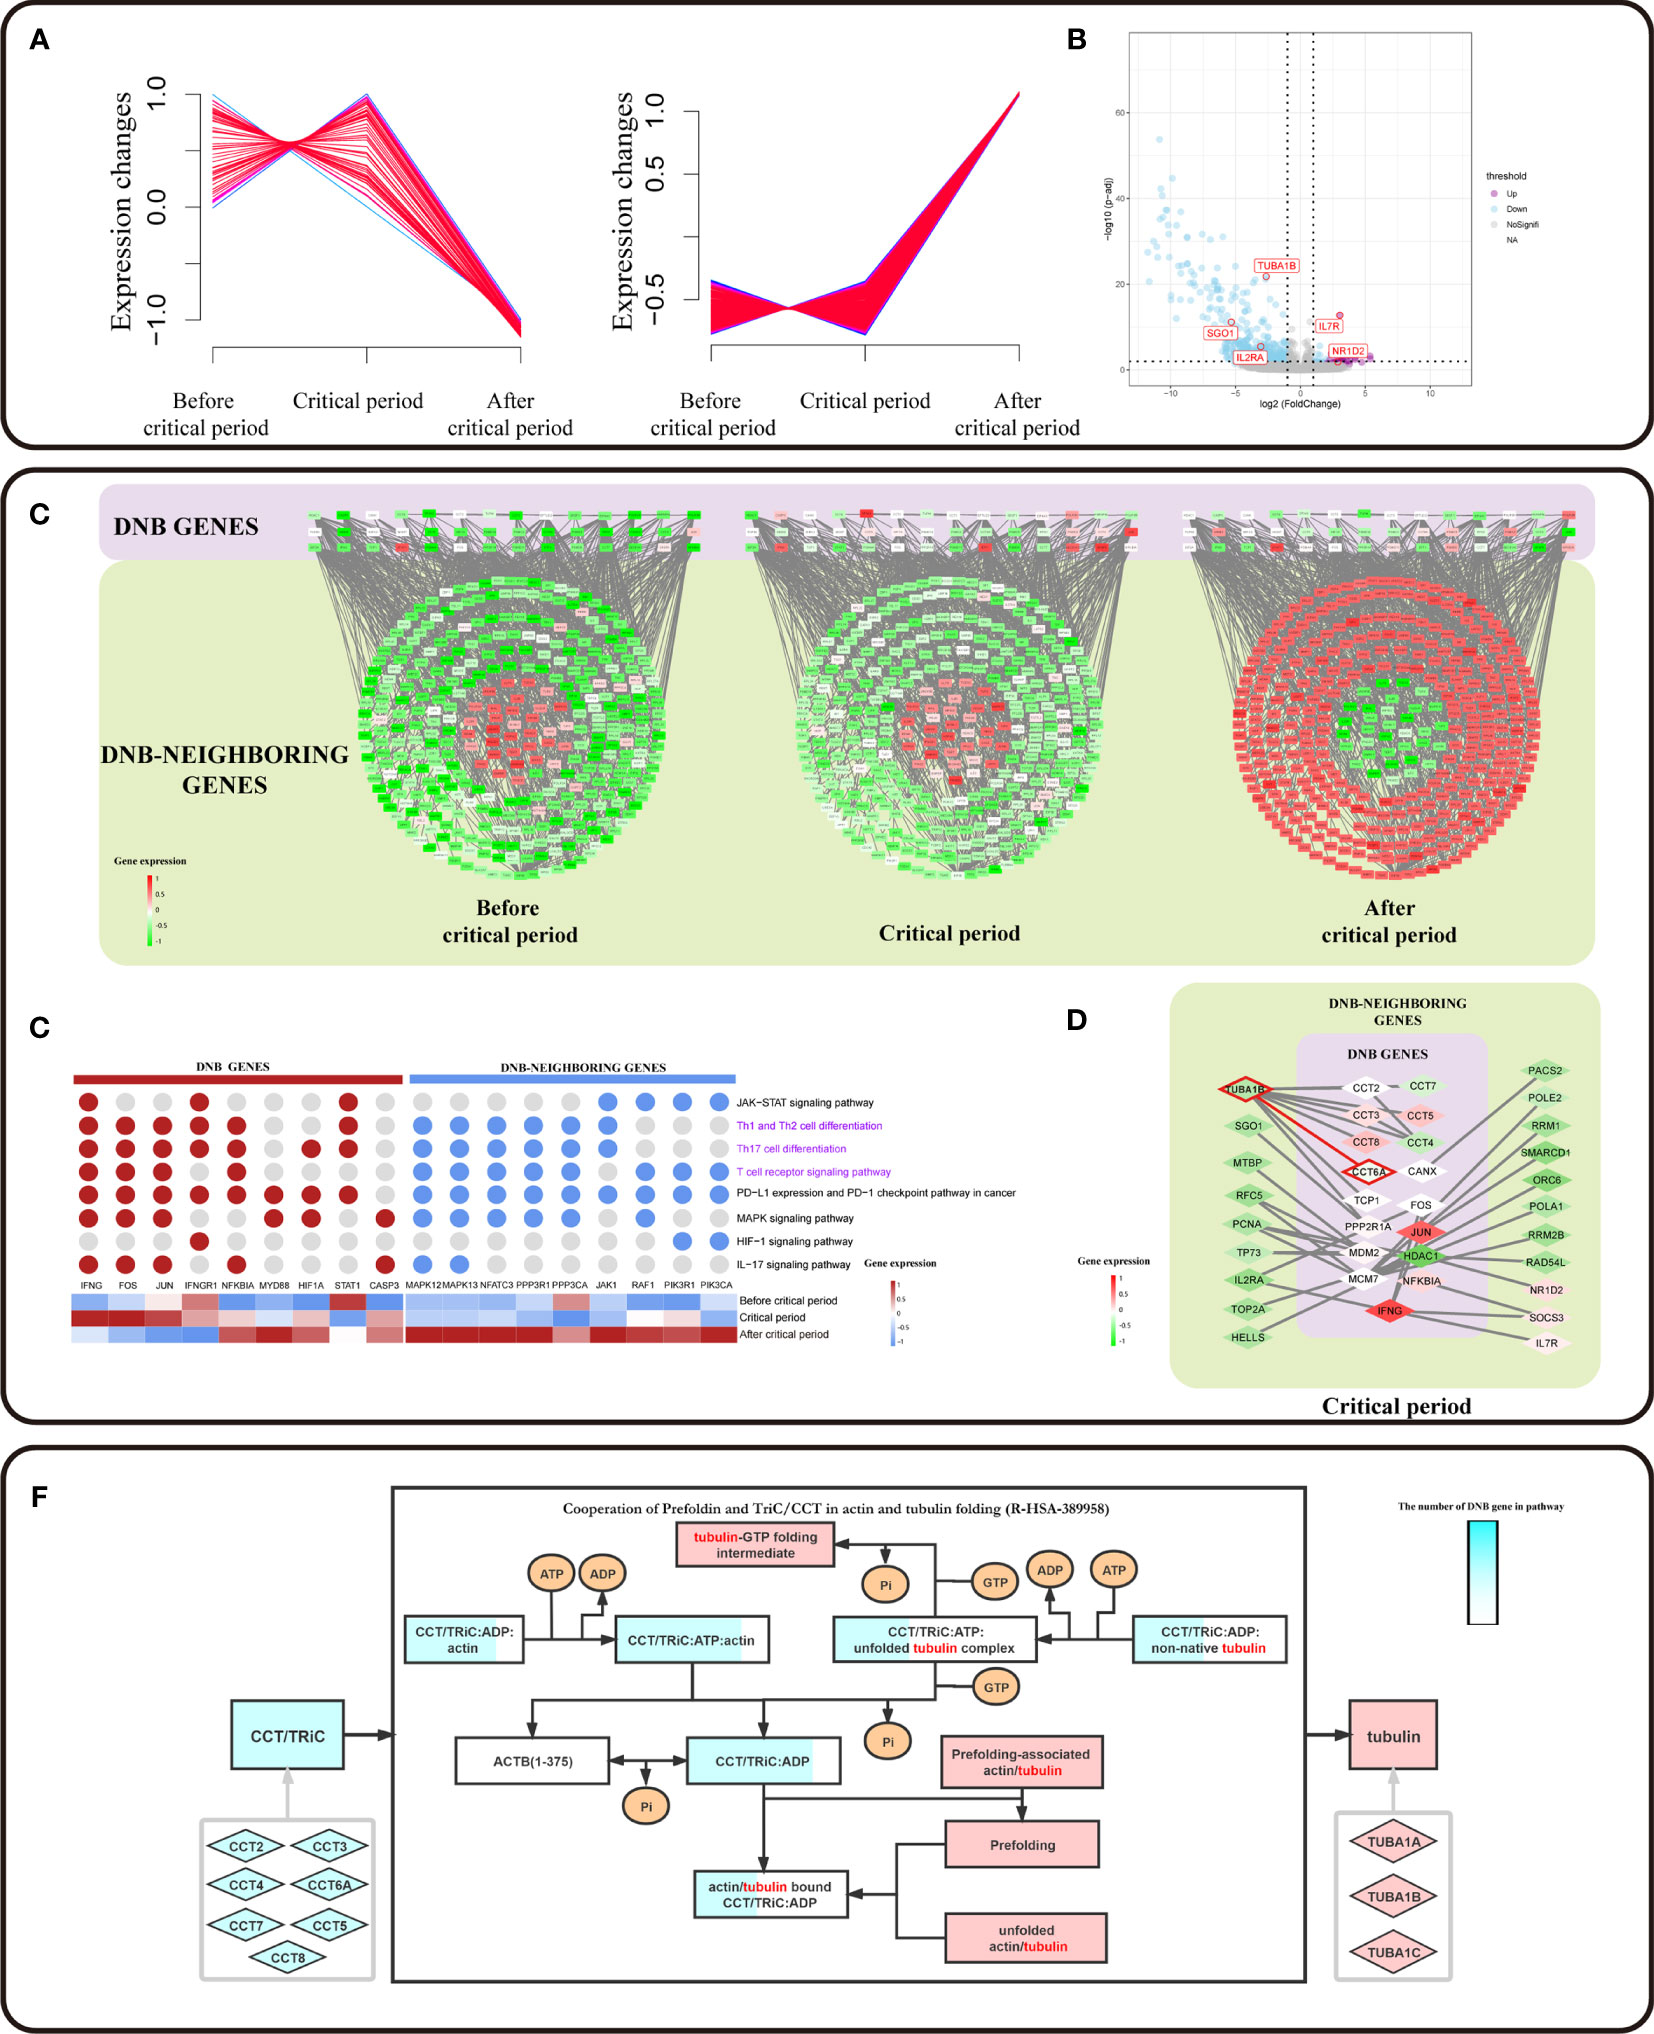
Figure 4 DNB core genes drive the flipped expression of DNB-neighboring genes. (A) The series of diagrams illustrate the patterns of dynamic changes in DNB-neighboring genes between exhaustion critical period and terminally exhausted period using Mfuzz. The x-axis represents three T cell exhaustion periods, and the y-axis represents gene expression. The dash indicates the dynamic genes expression. (B) Volcano plot of DEGs between pre-exhausted T cell subpopulation and terminal Tex cell subpopulation. Purple dots represent differentially upregulated genes, blue dots represent differentially down regulated genes, and grey dots represent non-significant genes (p value <0.05 and |logFC|>1). (C) Cytoscape visualization of DNB genes and DNB-neighboring genes interaction network, including three T cell exhaustion periods. The network nodes arranged in squares from the purple region are DNB genes. The network nodes arranged in circles from the dark green region are DNB-neighboring genes. The genes and their location in the network are the same for all three different exhaustion states, and low to high gene expression is indicated by a gradation from green to red. (D) Genes associated with pathways located in immune-related pathways (pathways associated with T cell pathways are indicated in purple). Expression of DNB genes in the pathway indicated by a gradation from blue to red. (E) Cytoscape visualization of DNB genes and DNB neighboring-DEG interaction network in the critical state. The network nodes from the purple region are DNB genes. The network nodes from the dark green region are DNB-neighboring-DEGs. Expression of genes indicated by a gradation from green to red. (F) Reactome pathway analysis results contain Cooperation of Prefoldin and TriC/CCT in actin and tubulin folding (R-HSA-389958) in human biology. The light blue rhombus represents the CCT gene family and pink represents tubulin genes. Squares represent the biological molecule. The blue area in the square represents the number of genes in the overexpression pathway.
To systematically investigate the roles of DNB core genes in pre-exhausted T cell subpopulation, we constructed a protein-protein interaction (PPI) network for DNB and DNB-neighboring genes. We found a network with a DNB core module that showed different expression patterns. DNB-neighboring genes showed expression turnover after the critical state (Figure 4C). As a result, those DNB-neighboring genes were considered as reversed genes, which had variable expression over time at the network level and played an important role in the T cell exhaustion. In addition, DNB core genes interacted with reversed genes in the network, possibly changing gene expression patterns or regulating downstream relationships. Remarkably, 69.66% of the reverse genes were enriched in immune effect-related KEGG pathways, including the JAK-STAT signaling pathway, PD-L1 expression, and PD-1 checkpoint pathway in cancer, Th1 and Th2 (Figure 4D). These pathways have upstream and downstream regulatory relationships between DNB genes and DNB-neighboring genes; transcription factors, such as FOS, JUN, and other transcription factors, are associated with DNB genes. IFNG as a member of the DNB gene plays a central role in this pathway. We localized the DNB genes and DNB-neighboring genes in the enriched pathway based on the gene expression characteristics that signify the pseudotime trajectory of CD8+ T cell exhaustion. Accordingly, we observed that the DNB-neighboring genes have turnover gene expression changes before and after the critical state and play a key role in immune-related pathways (Figure S3A), particularly PD-L1 expression and PD-1 checkpoint pathway in cancer.
Furthermore, we extracted the sub-networks of DNB-neighboring DEG and DEGs, which were from the network of DNB genes and DNB-neighboring genes. These DNB-neighboring DEGs were driven by the DNB core genes. We observed CCT family genes act as DNB core genes driving overturn changes in TUBA1B (Figure 4E and Figure S3C). We found that the expression of TUBA1B, one of the current therapeutic targets for cancer drugs, increased simultaneously with the expression of DNB gene CCT6A. TUBA1B, a DNB-neighboring DEG in pre-exhausted CD8+ T cells, was significantly associated with the overall survival of CRC patients (p = 0.0082) (Figure 3E). In addition, in TCGA colon and rectal cohorts combined cancer data sets, the CCT gene family has a synergistic expression pattern at different stages, whereas the CCT gene family has a similar expression pattern to TUBA1B in normal tissues and tumor tissues. Besides, the expression of CCT6A and TUBA1B in normal tissues had a correlation of 0.76, indicating a significant correlation. In contrast, the correlation in tumor tissues was low and insignificant (Figures S3C, D). The protein encoded by CCT6A is a molecular chaperone that is a member of the chaperonin containing the TCP1 complex (CCT), also known as the TCP1 ring complex (TriC). Reactome pathway analysis showed that unfolded tubulins bound to prefoldin were transferred to CCT via a docking mechanism. TriC/CCT forms a binary complex with unfolded β-tubulin. In actin and tubulin folding, the emerging polypeptide chain is transferred from the ribosome to TriC via prefoldin (Figure 4F). With the interactions between TriC/CCT and tubulins, CCT6A expression influenced the assembly of the TriC/CCT complex. Therefore, CCT6A drives TUBA1B, as the synergistic increase in DEG expression may contribute to CD8+ T-cell exhaustion.
Result 4: Cellular Communication Based on DNB Genes Contributes to T Cell Exhaustion
To further understand the pre-exhausted subpopulation of CD8+ T cells, we analyzed the receptor–ligand interactions between different cell subpopulations, which may change the cancer-immune microenvironment associated with exhausted differentiation of CD8+ T cells (Figure 5A). Among the interactions in the OAS1+ IFI44L+ ZFP36- HSPA1L- CD8+ T cell subpopulation, the LGALS9 gene in the immune checkpoint interacted with the exhaustion of the terminal exhausted CD8+ T cell subpopulations: CCR1+ CXCR6+ FOS− DNAJB1− CD8+ T cells and MCM7+ CXCL13+ GPR183- IL7R− CD8+ T cells, which has the receptor encoded by HAVCR2. HAVCR2 is an important biomarker during T cell exhaustion, and the protein encoded by this gene belongs to the TIM immunoglobulin superfamily. The activation of TIM-related signals pathway significantly inhibits T cell killing efficiency against colon cancer cells. Tim-3 signaling decreased the expression of perforin and granzyme B in T cells, which reduced the cytotoxicity of T cells against colon cancer cells. We observed that CXCL13 is a dynamic network marker in the MCM7+ CXCL13+ GPR183− IL7R− CD8+ T-cell population and a marker gene for terminal exhausted T cell. Receptor CXCR3 interacted with CXCL13 in the pre-exhausted T cell subpopulation. In this study, CXCL13 was the marker gene for terminally exhausted CD8+ T cell subpopulations, and CD3D was a DNB-neighboring gene. DNB genes interact with their DNB-neighbor genes and may provide feedback into the DNB gene population to affect cellular communication (Figure 5B). In summary, the expression of CD8+ T cell exhausted differentiation-associated genes is mediated by complex gene network changes.
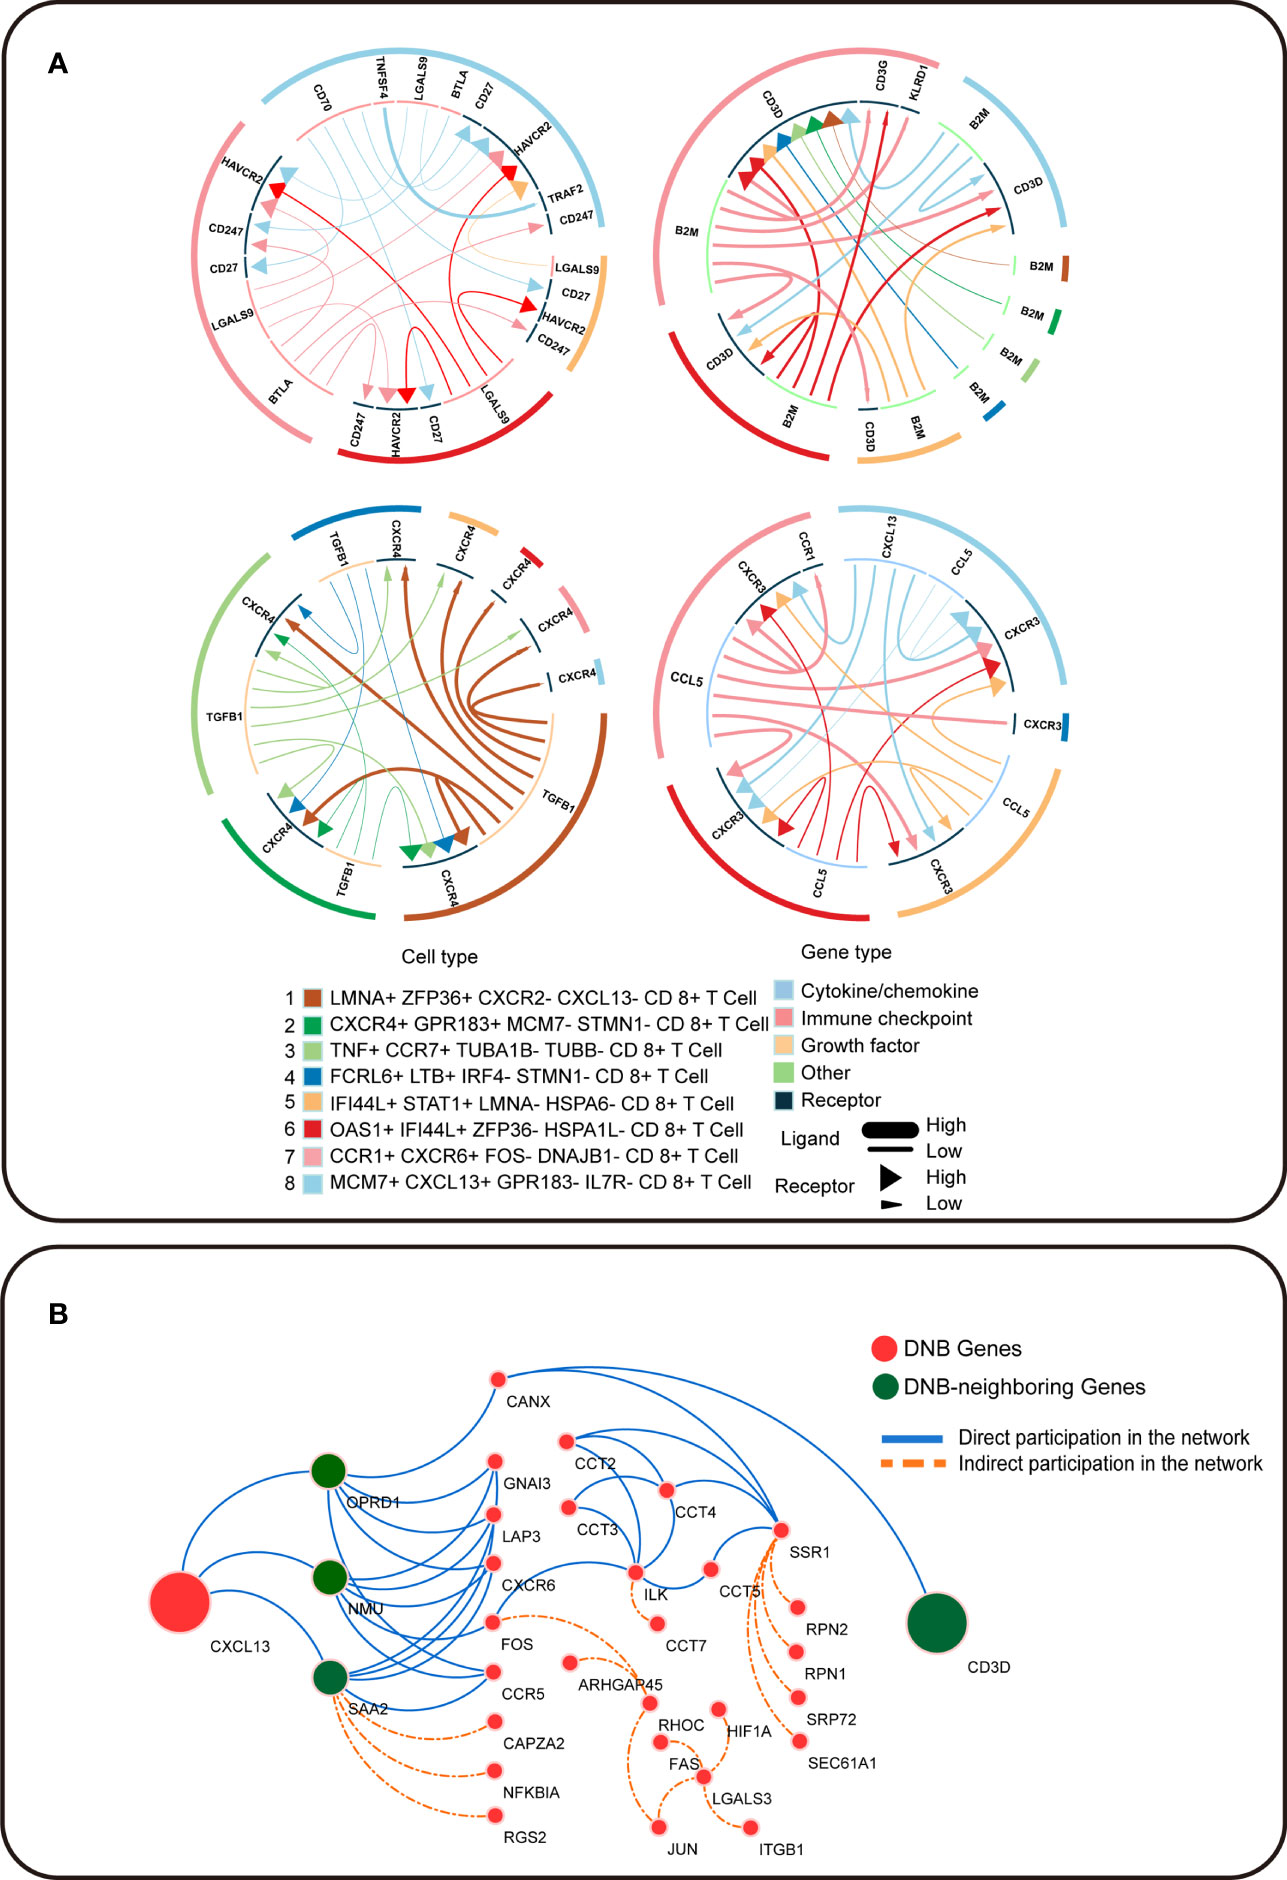
Figure 5 Intercellular communication in T cell exhaustion. (A) The receptor–ligand pairs identified by iTALK. (B) Cytoscape visualization of the protein–protein interaction network in CRC. Red circles represent DNB genes, and green circles represent DNB-neighboring genes. The solid blue line represents genes that directly participated in the network, and the orange dotted line represents genes that indirectly participated in the network.
Discussion
Deciphering the process of T cell exhaustion is a significant challenge for immunotherapy; however, scRNA-seq is an efficient tool for characterizing the cell subpopulation in CRC. This study provided the T cell exhaustion trajectory. We used DNB to identify biomarkers for pre-exhausted CD8+ T cells in the critical exhaustion period. We found receptor–ligand interactions of terminally differentiated exhausted T cells with pre-exhausted T cells at the cellular communication level.
However, this study has several limitations. The pre-exhausted T cell selected for the critical time had only 160, but the cell number could meet our analysis requirement (n > 6). More evidence is warranted through further specific knockout experiments and animal models to confirm the exact mechanism of how CCT6A drives pre-exhausted T cells to exhaustion.
The differentiation trajectory toward exhaustion provided a different cell population for cellular targeting in immune research, rather than terminal Tex cells currently used in immunotherapy (4). A key feature of Tex cells is the increased and sustained expression of multiple inhibitory receptors (IRS) (5, 6, 22). According to the expression of multiple functional genes, the inhibitory receptors of pre-exhausted cells have not been highly expressed, the function of cytokines and effectors has begun to decline, and cell proliferation and apoptosis have just begun to appear disorder. Moreover, the expression of IL2, IL10, IL12, LAYN in pre-exhausted T cells were consistent with the expression of genes in other cancer (23), suggesting that pre-exhausted T cell have common features in immune microenvironment (11).
We identified the pre-exhausted T cell subpopulation during critical exhaustion by DNB method. Compared with the traditional method based on the differential expression of molecular biomarkers in a static manner to detect molecular changes in cell subpopulations (24), DNB is superior in identifying exhausted pathological differentiation of CD8+ T cells in CRC. According to the DNB ranking, CCT6A in the CD8+ T cell subpopulation were pre-exhausted biomarkers. CCT6A was strongly correlated with survival of CRC patients, which is consisted with that CCT6A may account for the survival of non-small cell lung cancer (NSCLC) patients (25). Pre-exhausted T cells emerged as a critical transitional period, wherein the two groups of DNB-neighboring genes flipped their expression patterns. DNB-neighboring genes showed expression turnover after the exhausted critical period. Those genes were enriched in JAK-STAT signaling pathway, PD-L1 expression and PD-1 checkpoint pathway in cancer. In addition, JAK/STAT signaling pathway is critical for the response of T cells to cytokines (26). Besides, co-blockade of the LAG-3 and PD-1 pathways in chronic LCMV exhibited robust and synergistic reversal of T cell exhaustion, with similar results in tumor systems and other infection models (6). We assumed that combining PD-1 blockade with multi-targeted immunotherapy may enhance the reversal of T cell exhaustion effects. DNB-neighboring reverse genes in pre-exhausted CD8+ T cell that may provide clues to reversing exhaustion and improving the efficacy of immune response. The reversal of T cell exhaustion requires further investigation.
In the DNB core genes interaction network, CCT6A interacted with TUBA1B. CCT plays an important role in the correct synthesis and assembly of tubulin proteins (27). Tubulin was coded by TUBA1B (tubulin alpha 1b), the principal constituent of microtubules. Furthermore, CCT6A is associated with T cell reduction in cytotoxicity, immune function loss, and reduced T cell cytotoxicity during exhaustion with prolonged exposure to tumor antigens (28). In our Reaction pathway analysis, CCT6A played a role in forming tubulin folding intermediates via CCT/TriC formation of tubulin folding intermediates by CCT/TriC. During the process of CD8+ T cell normal differentiation, CD8+ T cells can activate and proliferate into Cytotoxic T lymphocyte (CTL). Besides, once the T cell receptor (TCR) of CTL specifically binds to MHC on the surface of target cells, the TCR and co-receptors accumulate towards the site of effector-target cell contact and lead to CTL polarization (29). The cytoskeletal system, including actin and tubulin, is rearranged and redistributed towards the contact site, thus ensuring that the non-specific effector molecules stored in the CTL are secreted and directed to the contacted target cells (30). However, the transcriptional profiles during T cell exhaustion were abnormal. CCT6A, as the DNB core genes, drives TUBA1B at the exhaustion critical state, may have an impact on tubulin folding, suggesting that tubulin of the cytoskeletal system of T cells prior to exhaustion may not ensure normal polarization of CD8+ CTL cells. The mechanism of CCT6A from these studies combined with DNB core gene expression patterns in ours suggested that CCT6A as the core gene have the potential to be an immunotherapy target for pre-exhausted cell.
We found that our dynamic network marker CXCL13 is involved in signaling during T cell exhaustion. Unlike studies that focus on the communication of other cell types to CD8+ T cells, we focused on the interactions between CD8+ T cell subtypes during exhaustion. In addition, we observed that CXCL13, as the ligand of terminal Tex cells, interacted with CXCR3 as the receptor of pre-exhausted T cells. CXCR3, as a co-receptor for the chemokine CXCL13, is chemotactic and involved in regulating the differentiation and development of memory cells and effector T cells (31). This indicates that cellular communication of terminal Tex cells with pre-exhausted T cells might lead to differentiation toward exhaustion. Considering that various factors mediate T cell exhaustion, the cellular communication of various CD8+ T cell subtypes during CD8+ T cell exhaustion may provide new insights into T cell exhaustion mechanisms.
In conclusion, we showed the CD8+ T cell exhaustion trajectories and characterized the pre-exhausted T cells from tumor tissues of CRC patients at the single-cell level using DNB. Both cellular communication and DNB-neighboring genes expression were actuated by DNB core genes that contribute to T cell exhaustion. The DNB core gene CCT6A provides a new clue for potential immunotherapy targets.
Data Availability Statement
Publicly available data sets were analyzed in this study. This data can be found here: GSE108989: https://www.ncbi.nlm.nih.gov/bioproject/?term=GSE108989; TCGA: https://portal.gdc.cancer.gov/repository.
Ethics Statement
The studies involving human participants were reviewed and approved by the Research and Ethical Committee of Peking University People’s Hospital. The patients/participants provided their written informed consent to participate in this study.
Author Contributions
JH and CH carried out the primary literature search. JH and JZ performed the data analysis. JH, WL and FL drafted the manuscript. JH, CH, JZ, HL, RL, and PC performed the literature search and revised the manuscript. All authors contributed to the article and approved the submitted version.
Funding
This work was supported by the National Natural Science Foundation of China (Grant Nos. 11771152, 11901203, 11971176, and 12026608), Guangdong Basic and Applied Basic Research Foundation (Grant Nos. 2019B151502062, 2021A1515012317).
Conflict of Interest
The authors declare that the research was conducted in the absence of any commercial or financial relationships that could be construed as a potential conflict of interest.
Publisher’s Note
All claims expressed in this article are solely those of the authors and do not necessarily represent those of their affiliated organizations, or those of the publisher, the editors and the reviewers. Any product that may be evaluated in this article, or claim that may be made by its manufacturer, is not guaranteed or endorsed by the publisher.
Acknowledgments
We thank Mingshu Zhang for his assistance with the data analysis. We would also like to thank Qiuhong Tan for her valuable comments.
Supplementary Material
The Supplementary Material for this article can be found online at: https://www.frontiersin.org/articles/10.3389/fimmu.2021.691142/full#supplementary-material
Supplementary Figure 1 | Genes expression of differentiation profiles in CD8+ T cells. (A) t-SNE clustering of CD8+ T cells in tumor tissue (n = 1646) from scRNA-seq of CRC patients showing 8 clusters (n =8). (B) Violin plot indicating the expression distribution of HAVCR2, CXCL13, PDCD1, FOS, SELL and LAYN in NTC, PTC and TTC. (C) The expression levels of CCT6A, SRSF1, EIF4A3 and IFI44L in different pseudotime of CD8+ T cell subpopulation. The x-axis represents pseudotime, and the y-axis represents gene expression. (D) Five heatmaps showing the dynamic expression changes of genes, including the function of T cell cytokine production, T cell apoptotic process, inhibitory receptors, cell proliferation and T cell effector function.
Supplementary Figure 2 | GO enrichment results of DNB genes. (A) Pie chart representing the proportion of the top GO terms are ranked by the GO enrichment. (B) Shown is a Cytoscape visualization of the top GO terms interaction network. (C) Histogram showing the top GO terms ranked by GO enrichment.
Supplementary Figure 3 | DNB genes drive the flipped expression of DEGs. (A) Pie chart representing the proportion of the top pathways of KEGG ranked by the KEGG enrichment. (B) The network plot shows the DNB genes interaction with DNB-neighboring DEG, including three T cell exhaustion periods. The network nodes from the purple region are DNB genes. The network nodes from the dark green region are DNB-neighboring-DEGs. The genes and their location in the network are the same for all three different exhaustion periods, and low to high gene expression is indicated by a gradation from green to red. (C) Gene expression heatmap showing gene expression of the CCT family and TUBA1B at different cancer stages and sources in TCGA COREAD dataset, and low to high gene expression is indicated by a gradation from blue to red. (D) Correlation of CCT6A and TUBA1B in TCGA COREAD dataset. The correlation coefficient (R) and significance of the correlation coefficient (P) were calculated.
Abbreviations
CRC, colorectal cancer; DNB, dynamic network biomarker; COAD, colon adenocarcinoma; TCGA, The Cancer Genome Atlas; Tex cell, exhausted T cell; GO, gene ontology; KEGG, Kyoto Encyclopedia of Genes and Genomes; READ, rectum adenocarcinoma; SCE, single-cell entropy; DEG, differentially expressed gene; IRS, inhibitory receptors; GSVA, gene set variation analysis; NSCLC, non-small cell lung cancer; PTC, CD8+ T cells from peripheral blood; NTC, CD8+ T cells from adjacent normal colorectal tissues; TTC, CD8+ T cells from tumor; TCR, T-cell receptor; CTL, cytotoxic T lymphocyte.
References
1. Bray F, Ferlay J, Soerjomataram I, Siegel RL, Torre LA, Jemal A. Global Cancer Statistics 2018: GLOBOCAN Estimates of Incidence and Mortality Worldwide for 36 Cancers in 185 Countries. CA: Cancer J Clin (2018) 68(6):394–424. doi: 10.3322/caac.21492
2. Yu J, Qin B, Moyer AM, Nowsheen S, Tu X, Dong H, et al. Regulation of Sister Chromatid Cohesion by Nuclear PD-L1. Cell Res (2020) 30(7):590–601. doi: 10.1038/s41422-020-0315-8
3. Jiang Y, Li Y, Zhu B. T-Cell Exhaustion in the Tumor Microenvironment. Cell Death Dis (2015) 6(6):e1792. doi: 10.1038/cddis.2015.162
4. Pauken KE, Wherry EJ. Overcoming T Cell Exhaustion in Infection and Cancer. Trends Immunol (2015) 36(4):265–76. doi: 10.1016/j.it.2015.02.008
5. Blank CU, Haining WN, Held W, Hogan PG, Kallies A, Lugli E, et al. Defining 'T Cell Exhaustion'. Nat Rev Immunol (2019) 19(11):665–74. doi: 10.1038/s41577-019-0221-9
6. McLane LM, Abdel-Hakeem MS, Wherry EJ. CD8 T Cell Exhaustion During Chronic Viral Infection and Cancer. Annu Rev Immunol (2019) 37:457–95. doi: 10.1146/annurev-immunol-041015-055318
7. Kallies A, Zehn D, Utzschneider DT. Precursor Exhausted T Cells: Key to Successful Immunotherapy? Nat Rev Immunol (2020) 20(2):128–36. doi: 10.1038/s41577-019-0223-7
8. Novis CL, Archin NM, Buzon MJ, Verdin E, Round JL, Lichterfeld M, et al. Reactivation of Latent HIV-1 in Central Memory CD4(+) T Cells Through TLR-1/2 Stimulation. Retrovirology (2013) 10:119. doi: 10.1186/1742-4690-10-119
9. Wang W, Zhong Y, Zhuang Z, Xie J, Lu Y, Huang C, et al. Multiregion Single-Cell Sequencing Reveals the Transcriptional Landscape of the Immune Microenvironment of Colorectal Cancer. Clin Trans Med (2021) 11(1):e253. doi: 10.1002/ctm2.253
10. Kumar MP, Du J, Lagoudas G, Jiao Y, Sawyer A, Drummond DC, et al. Analysis of Single-Cell RNA-Seq Identifies Cell-Cell Communication Associated With Tumor Characteristics. Cell Rep (2018) 25(6):1458–68.e4. doi: 10.1016/j.celrep.2018.10.047
11. Zhang L, Yu X, Zheng L, Zhang Y, Li Y, Fang Q, et al. Lineage Tracking Reveals Dynamic Relationships of T Cells in Colorectal Cancer. Nature (2018) 564(7735):268–72. doi: 10.1038/s41586-018-0694-x
12. Qiu X, Mao Q, Tang Y, Wang L, Chawla R, Pliner HA, et al. Reversed Graph Embedding Resolves Complex Single-Cell Trajectories. Nat Methods (2017) 14(10):979–82. doi: 10.1038/nmeth.4402
13. Wu TD, Madireddi S, de Almeida PE, Banchereau R, Chen YJ, Chitre AS, et al. Peripheral T Cell Expansion Predicts Tumour Infiltration and Clinical Response. Nature (2020) 579(7798):274–8. doi: 10.1038/s41586-020-2056-8
14. Fabregat A, Sidiropoulos K, Viteri G, Forner O, Marin-Garcia P, Arnau V, et al. Reactome Pathway Analysis: A High-Performance in-Memory Approach. BMC Bioinf (2017) 18(1):142. doi: 10.1186/s12859-017-1559-2
15. Wherry EJ, Kurachi M. Molecular and Cellular Insights Into T Cell Exhaustion. Nat Rev Immunol (2015) 15(8):486–99. doi: 10.1038/nri3862
16. Cui W, Kaech SM. Generation of Effector CD8+ T Cells and Their Conversion to Memory T Cells. Immunol Rev (2010) 236(1):151–66. doi: 10.1111/j.1600-065X.2010.00926.x
17. Jameson SC, Masopust D. Diversity in T Cell Memory: An Embarrassment of Riches. Immunity (2009) 31(6):859–71. doi: 10.1016/j.immuni.2009.11.007
18. Bachmann MF, Wolint P, Walton S, Schwarz K, Oxenius A. Differential Role of IL-2R Signaling for CD8+ T Cell Responses in Acute and Chronic Viral Infections. Eur J Immunol (2007) 37(6):1502–12. doi: 10.1002/eji.200637023
19. Gros A, Robbins PF, Yao X, Li YF, Turcotte S, Tran E, et al. PD-1 Identifies the Patient-Specific CD8(+) Tumor-Reactive Repertoire Infiltrating Human Tumors. J Clin Invest (2014) 124(5):2246–59. doi: 10.1172/JCI73639
20. Zhong J, Han C, Zhang X, Chen P, Liu R. Predicting Cell Fate Commitment of Embryonic Differentiation by Single-Cell Graph Entropy. bioRxiv (2020) 2020.04.22.055244. doi: 10.1101/2020.04.22.055244
21. Han C, Zhong J, Hu J, Liu H, Liu R, Ling F. Single-Sample Node Entropy for Molecular Transition in Pre-Deterioration Stage of Cancer. Front Bioeng Biotechnol (2020) 8(809):809. doi: 10.3389/fbioe.2020.00809
23. Guo X, Zhang Y, Zheng L, Zheng C, Song J, Zhang Q, et al. Global Characterization of T Cells in Non-Small-Cell Lung Cancer by Single-Cell Sequencing. Nat Med (2018) 24(7):978–85. doi: 10.1038/s41591-018-0045-3
24. Chen P, Liu R, Chen L, Aihara K. Identifying Critical Differentiation State of MCF-7 Cells for Breast Cancer by Dynamical Network Biomarkers. Front Genet (2015) 6:252(252). doi: 10.3389/fgene.2015.00252
25. Zhu M, Geng L, Shen W, Wang Y, Liu J, Cheng Y, et al. Exome-Wide Association Study Identifies Low-Frequency Coding Variants in 2p23.2 and 7p11.2 Associated With Survival of Non-Small Cell Lung Cancer Patients. J Thoracic Oncol Off Publ Int Assoc Study Lung Cancer (2017) 12(4):644–56. doi: 10.1016/j.jtho.2016.12.025
26. Mammadli M, Huang W, Harris R, Sultana A, Cheng Y, Tong W, et al. Targeting Interleukin-2-Inducible T-Cell Kinase (ITK) Differentiates GVL and GVHD in Allo-HSCT. Front Immunol (2020) 11:593863. doi: 10.3389/fimmu.2020.593863
27. Grantham J. The Molecular Chaperone CCT/TRiC: An Essential Component of Proteostasis and a Potential Modulator of Protein Aggregation. Front Genet (2020) 11:172. doi: 10.3389/fgene.2020.00172
28. Chen H, You HQ, Wang LF, Zhang X, Zhang JM, He W. Chaperonin-Containing T-Complex Protein 1 Subunit Serves as an Autoantigen Recognized by Human V Delta 2 Gamma Delta T Cells in Autoimmune Diseases. J Biol Chem (2016) 291(38):19985–93. doi: 10.1074/jbc.M115.700070
29. Martin-Cofreces NB, Valpuesta JM, Sanchez-Madrid F. Folding for the Immune Synapse: CCT Chaperonin and the Cytoskeleton. Front Cell Dev Biol (2021) 9:658460. doi: 10.3389/fcell.2021.658460
30. Barcia C Jr., Gomez A, Gallego-Sanchez JM, Perez-Valles A, Castro MG, Lowenstein PR, et al. Infiltrating Ctls in Human Glioblastoma Establish Immunological Synapses With Tumorigenic Cells. Am J Pathol (2009) 175(2):786–98. doi: 10.2353/ajpath.2009.081034
Keywords: colorectal cancer, dynamic network biomarker, T cell exhaustion, pre-exhausted T cell, CCT6A, TUBA1B
Citation: Hu J, Han C, Zhong J, Liu H, Liu R, Luo W, Chen P and Ling F (2021) Dynamic Network Biomarker of Pre-Exhausted CD8+ T Cells Contributed to T Cell Exhaustion in Colorectal Cancer. Front. Immunol. 12:691142. doi: 10.3389/fimmu.2021.691142
Received: 05 April 2021; Accepted: 14 July 2021;
Published: 09 August 2021.
Edited by:
William Hawse, University of Pittsburgh, United StatesReviewed by:
Wenfei Jin, Southern University of Science and Technology, ChinaDuojiao Wu, Fudan University, China
Copyright © 2021 Hu, Han, Zhong, Liu, Liu, Luo, Chen and Ling. This is an open-access article distributed under the terms of the Creative Commons Attribution License (CC BY). The use, distribution or reproduction in other forums is permitted, provided the original author(s) and the copyright owner(s) are credited and that the original publication in this journal is cited, in accordance with accepted academic practice. No use, distribution or reproduction is permitted which does not comply with these terms.
*Correspondence: Fei Ling, fling@scut.edu.cn; Pei Chen, chenpei@scut.edu.cn; Wei Luo, luowei_421@163.com