 Wei Zheng1
 Jing Miao1Lingling Luo1Gao Long1Bo Chen1Xiaoli Shu1Weizhong Gu2Kerong Peng1Fubang Li1Hong Zhao1Benson O. A. Botchway3Marong Fang3
 Mizu Jiang1*
- 1Department of Gastroenterology, Children’s Hospital, Zhejiang University School of Medicine, National Clinical Research Center for Child Health, National Children’s Regional Medical Center, Hangzhou, China
- 2Department of Pathology, Children’s Hospital, Zhejiang University School of Medicine, National Clinical Research Center for Child Health, National Children’s Regional Medical Center, Hangzhou, China
- 3Institute of Neuroscience, Zhejiang University School of Medicine, Hangzhou, China
Background: Helicobacter pylori infection is the main cause of chronic gastritis in children. Little is known about the effect of Helicobacter pylori on microbiota and immunity. This study was aimed at characterizing stomach microbiota and immune-regulatory properties of children with Helicobacter pylori colonization.
Methods: We studied 122 children who had undergone gastric endoscopy due to gastrointestinal symptoms, 57 were diagnosed with Helicobacter pylori infection. Endoscopic mucosal biopsy samples were obtained for DNA and RNA extraction. Microbiomes were analyzed by 16S rRNA profiling, with the differentially expressed genes analyzed using RNA sequencing. The RNA-sequencing results of selected genes were validated by qRT-PCR.
Results: Bacterial diversity of Helicobacter pylori-positive gastric specimens were lower than those of negative, and both groups were clearly separated according to beta diversity. Helicobacter pylori-positive group significantly reduced proportions of six phyla and eight genera; only Helicobacter taxa were more abundant in Helicobacter pylori-negative group. Gastric tissues RNA sequencing showed increased expression of multiple immune response genes in Helicobacter pylori -infection. Helicobacter pylori -infected children with restructured gastric microbiota had higher levels of FOXP3, IL-10, TGF-β1 and IL-17A expressions, which were consistent with increased CD4+T cell and macrophagocyte, compared with non-infected children.
Conclusions: Presence of Helicobacter pylori significantly influences gastric microbiota and results in lower abundance of multiple taxonomic levels in children. Meanwhile, it affects gastric immune environment and promotes the occurrence of gastritis.
Clinical Trial Registration: [http://www.chictr.org.cn], identifier [ChiCTR1800015190]
Introduction
Prior to the discovery of Helicobacter pylori (H. pylori) in 1984 (1), the human stomach was considered to be a sterile organ (2). In recent years, culturing and high-throughput sequencing of gastric juice and biopsy have revealed a complex bacterial microbiota in the upper gastrointestinal tract (3). H. pylori, a Gram-negative bacterium, is usually acquired in early childhood (4), with reported links to various degrees of gastric mucosal inflammation, such as chronic gastritis, peptic ulcers and adenocarcinoma (5, 6). H. pylori evidently predominates in the gastric mucosa of infected individuals, while uninfected individuals exhibit a higher degree of biodiversity (7, 8). The effects of H. pylori abundance on other genera and their interactions in diseases are still under investigation (9, 10). Recent analysis of the gastric microbiota revealed that patients with gastric carcinoma exhibit a dysbiotic microbial community with genotoxic potential, which is distinct from that of patients with chronic gastritis, and the bacterial interactions across stages of gastric carcinogenesis were different (11, 12). Although there is a causal relationship between H. pylori infection and duodenal ulcer disease, few studies have reported duodenal microbiota changes caused by H. pylori infection (13). Minimal research studies pertaining to the presence and composition of gastric and duodenal microflora in children have been reported. With several studies elucidating the similarity between H. pylori burden and genotype distribution in infected children and adults (14, 15), we hypothesize that presence of H. pylori in children might affect microecological composition of both stomach and duodenum (16).
Emerging evidence have shown that intestinal microbiota plays a fundamental role in regulating inflammatory responses by inducing local regulation of T cell differentiation that inhibits inflammatory response (17, 18). However, the effects of commensal microbiota and early life events in the upper digestive tract on microbial composition and immune cell responses in the upper gastrointestinal mucosa have been poorly studied, especially in humans (19). H. pylori drives local T helper 1 cell (Th1) and T helper 17 cell(Th17 responses promote gastric mucosal inflammation (20). Also, regulatory T (Treg) cells down-regulated Th1 and Th17 immune responses and reduced inflammatory reactions to H. pylori infection (21). Based on the above, we hypothesize that H. pylori infection affects microbiota changes related to the gastric mucosa, and the changes in the microbiota affects the synthesis and secretion of Tregs, which in turn affects the local immune function and inflammatory response of gastric mucosa. To address this issue, we characterized the effect of gastric H. pylori colonization on local systemic immune responses and the composition of gastro-duodenal microbiota.
Materials and Methods
Study Cohort
This study included 122 children (<16 years of age), who between January 2018 and August 2018, exhibited gastrointestinal symptoms suggestive of peptic ulcer disease, inclusive of recurrent abdominal discomfort and pain, and dyspepsia (Figure 1). The children, comprising of 70 (57.4%) boys and 52 (42.6%) girls, were admitted to the Children’s Hospital of Zhejiang University School of Medicine. The 122 children had a mean age of 10.2 ± 3.1 years. Exclusion criteria included a history of acute onset of symptoms, the use of antibiotic, antacid, H2 receptor antagonist, proton-pump inhibitor (PPI), bismuth-containing compounds, or non-steroidal anti-inflammatory drugs (NSAID) in the last 4 weeks. The study protocol was approved by the Medical Ethics Committee in the Children’s Hospital of Zhejiang University School Of Medicine (2018-IRB-004). Written informed consent was obtained from legal representatives of the children who participated in the study.

Figure 1 Flow diagram of the patients that were invited to participate in the study.
Gastric and Duodenal Biopsies and H. pylori Testing
Patients underwent esophagogastroduodenoscopy at the Children’s Hospital of Zhejiang University School of Medicine. Gastric antrum biopsies were obtained for rapid urease test, culture, histology, immunohistochemistry, quantitative RT-PCR, RNA sequence analysis and gastric microbiota studies. Duodenal bulb biopsies were obtained for histology and duodenal microbiota studies. Endoscopic findings were also recorded. Gastric mucosa biopsy samples taken from the antrum were preserved in the brain-heart infusion broth (Oxoid, Dardilly, France) with 5% glycerin and sent to the laboratory of Hangzhou Zhiyuan Medical Inspection Institute. The other biopsies were frozen at -80°C until DNA and RNA extraction. The homogenate of stomach biopsy specimens was inoculated onto Columbia agar plates (Oxoid) supplemented with 5% fresh defibrinated sheep blood and kept under microaerophilic conditions (5% O2, 10% CO2, and 85% N2) at 37°C for 3 days. Colonies displaying typical H. pylori morphology were selected and identified by Gram staining and urease, oxidase, and catalase activity test. HP infection diagnosis was determined using the diagnostic criteria from the study “Consensus on diagnosis and treatment of HP infection in children” published in the Chinese Journal of Pediatrics (22). On the basis of that study, one of the following four diagnostic criteria can be used to diagnose HP infection: 1. Positive results from gastric HP bacterial culture; 2. Positive results from the pathological examination of gastric mucosa biopsy and rapid urease test (RUT); 3. In the event of inconsistencies arising between pathological examination of the gastric mucosa and RUT results, non-invasive detection, such as 13C urea breath test (UBT) or stool antigen test (SAT) can be performed; 4. Positive results from either pathological histology of the gastric mucosa or RUT in the event of peptic ulcer bleeding. Based on test results and endoscopic findings, patients were divided into three groups (Table 1): 1. H. pylori-positive group (HP+) (n = 57) [results consistent with H. pylori infection diagnosis]; 2. H. pylori-negative group (HP-) (n = 37) [No H. pylori infection, but endoscopic examination showing mucosal edema, erosion and ulcers, histopathological examination showed various degrees of inflammation]; 3. Normal group (Control) (n = 28) [No H. pylori infection, and no abnormal endoscopic mucosal changes and no abnormal histological examination].
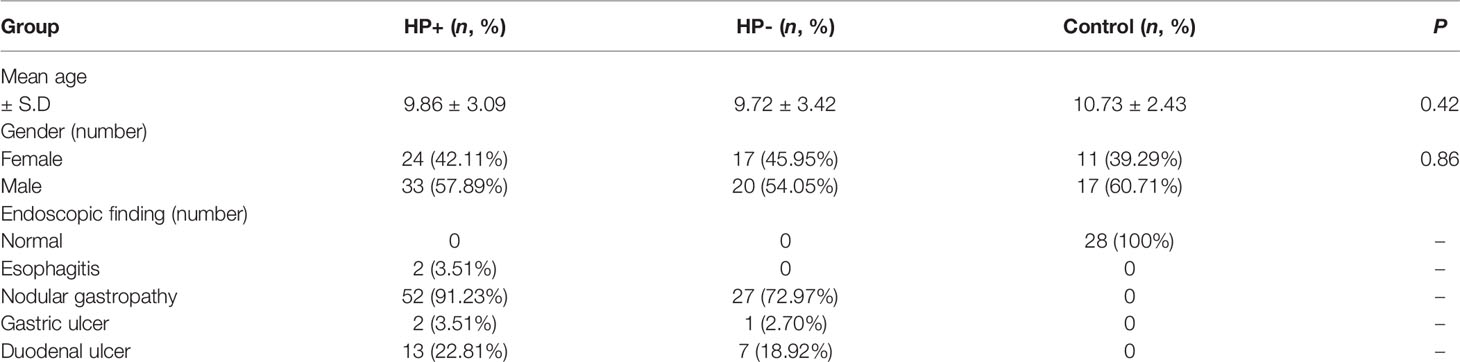
Table 1 Demographic and clinical features of the study subjects.
DNA Extraction
Community microbial genomic DNA was extracted from each biopsy sample using DNA MiniPrep kit (AXYGEN, China) (23). Briefly, the biopsy samples were lysed by incubating the sample in ATL lysis buffer with proteinase K overnight at 56°C and following mechanical lysis with Fast prep instrument (MP Biomedicals, Carlsbad, CA) for 1 minute at the level of 6.0 m/s, purified with spin columns, and eluted with 400 μl of buffer AE. Quality and quantity of DNA was measured with Nanodrop (Thermo Fisher Scientific, Massachusetts, USA). The extracted DNA was stored at −80°C prior to use.
16S rRNA Sequencing
The V3-V4 hyper-variable regions of the 16S rRNA gene were amplified using a universal primer set (341F: CCTACGGGNGGCWGCAG, 785R: GACTACHVGGGTATCTAATCC) e concentration. PCR was carried out under conditions described by Caporaso et al. (24). High fidelity DNA polymerase: TaKaRa EX Taq was used in PCR. PCRwith a barcode. All template DNAs were normalized to the sam products were separated by electrophoresis in 2% agarose gels, purified with a QIAGEN Gel Extraction Kit (QIAGEN, Germany) and pooled at equal concentrations. Sequencing libraries was generated using a TruSeqR® DNA PCR-Free Sample Preparation Kit (Illumina, United States) following the manufacturer’s recommendations, and index codes were added. Library quality was assessed on the Qubit@ 2.0 Fluorometer (Thermo Scientific) and the Agilent Bioanalyzer 2100 system. The library was sequenced on an Illumina HiSeq 2500 platform (250-bp paired-end reads) at Novogene Bioinformatics Technology Co., Ltd. (Beijing, China).
Microbiota Sequencing Data Analysis
Barcodes as well as forward and reverse primer sequences were removed and raw sequences were analyzed using the Quantitative Insight into Microbial Ecology (QIIME), version 1.9 (25). Based on distribution characteristics of low quality scores of MiSeq sequencing data, quality control of original data was executed. Chimera sequences were removed using the UCHIME algorithm to yield clean tags for further analysis (26). Sequence analysis was performed using UPARSE pipeline version 7.0.1001 (27), sequences were clustered into operational taxonomic units (OTU) assuming 97% similarity. Representative sequences for each OTU were screened for further annotation. RDP Classifier (Version 2.2) was used to annotate taxonomic information for each representative sequence based on the Green genes 97% reference data set (28). OTU abundance information was normalized using a standard sequence number corresponding to the sample with the fewest sequences. Subsequent analyses of diversity were performed based on this output-normalized data using QIIME.
Histology and Immunohistochemistry
Histology was evaluated by 2 pathologists who were blinded to the other assays. Polymorphonuclear neutrophils (PMNs) infiltration (i.e. active gastric inflammation) and mononuclear inflammatory cells (MNCs) infiltration (i.e. chronic gastric inflammation), were assessed on a 4-grade scale (0, 1, 2, and 3, corresponding to none, mild, moderate and severe respectively), according to the updated Sydney classification (29).
Immunohistochemistry (IHC) was performed using the Bond PolymerDAB Detection Kit (Leica Microsystems, Weltzar, Germany) and Bond-X automated IHC slide staining system (Leica Microsystems). Formalin-fixed, paraffin-embedded serial sections 4-mm thick was de-paraffinized and dehydrated. The sections were heated in citrate buffer (pH 6.0, 10 mmol/L) in a microwave for 20 minutes to retrieve the antigens. Endogenous peroxidase activity was blocked with 0.3% hydrogen peroxide for 10 minutes and then incubated with primary antibodies, rabbit polyclonal anti-CD4 antibody (dilution 1:500, ab133616; Abcam, Cambridge, UK) and rabbit polyclonal anti-CD68 antibody (dilution 1:1000, ab213363; Abcam). Sections were then held in phosphate-buffered saline and incubated with horseradish-peroxidase polymer for 30 minutes, with the reaction was visualized using 3,3-diaminobenzidine tetrahydrochloride for 5 minutes and counterstained with Mayer hematoxylin. CD4 and CD68 showed cytoplasmic positive reaction. The number of positive stained cells was evaluated in 10 representative visual fields (×400, 0.0625mm2).
RNA Sequencing and Data Analysis
Total RNA (6 cases in HP+ and HP-) was isolated using RNeasy mini kit (Qiagen, Germany). Paired-end libraries were synthesized by using the TruSeq™ RNA sample preparation kit (Illumina, USA) following TruSeq™ RNA Sample Preparation Guide. Briefly, the poly-A containing mRNA molecules were purified using poly-T oligo-attached magnetic beads. Following purification, the mRNA was fragmented into small pieces using divalent cations under 94°C for 8 minutes. The cleaved RNA fragments were copied into first strand cDNA using reverse transcriptase and random primers. This was followed by second strand cDNA synthesis using DNA Polymerase I and RNase H. These cDNA fragments were put through an end repair process, the addition of a single ‘A’ base, and the adapters ligated. The products were then purified and enriched with PCR to create the final cDNA library. Purified libraries were quantified by Qubit® 2.0 Fluorometer (Life Technologies, USA) and validated by Agilent 2100 bioanalyzer (Agilent Technologies, USA) to confirm the insert size and calculate the mole concentration. Cluster was generated by cBot with the library diluted to 10 pM and then sequenced on the Illumina NovaSeq 6000 (Illumina, USA). Paired-end sequence files (fastq) were mapped to the reference genome using Hisat2 (Hierarchical Indexing for Spliced Alignment of Transcripts, version 2.0.5). The output SAM (sequencing alignment/map) files were converted to BAM (binary alignment/map) files and sorted using SAM tools (version 1.3.1).
Quantitative RT-PCR Analyses for Treg Gene and Cytokine Expression
Total RNA isolation and cDNA synthesis. Total RNA (HP+, HP- and Control, 12 cases) was extracted and, after reverse transcription, real-time PCR was performed on duplicate cDNA samples for Forkhead box protein 3 (FOXP3), interleukin-10 (IL-10), transforming growth factor-β1 (TGF-β1) and interleukin-17A (IL-17A), and mRNA levels were analyzed by comparing the differences in fold change in mRNA normalized to glyceraldehyde 3-phosphate dehydrogenase mRNA. The primer sequences were as follows: GAPDH (forward), ACATCGCTCAGACACCATG; (reverse), TGTAGTTGAGGTCAATGAAGGG; FOXP3 (forward), GTGGCCCGGATGTGAGAAG; FOXP3 (reverse), GGAGCCCTTGTCGGATGATG; IL-10 (forward), CGAGATGCCTTCAGCAGAGT; IL-10 (reverse), CCCTTAAAGTCCTCCAGCAA; TGF-β1 (forward), AGTGGTTGAGCCGTGGAG; TGF-β1 (reverse), AGTGGTTGAGCCGTGGAG; IL-17A (forward), AGATTACTACAACCGATCCACCT; IL-17A (reverse), GGGGACAGAGTTCATGTGGTA.
Standard curve construction. For all cytokine and reference genes, a standard curve from serial dilutions of a known concentration of purified DNA was achieved (30). This quantified DNA consisted of the target PCR product prepared by conventional PCR from cDNA positive for the corresponding target mRNA. The copy number of each standard was calculated by standard methods using the Avogadro constant as described by Overbergh et al. (31). The log ranges of the different standard curves were from 107 copies to 1 copy. Threefold measurement for each standard dilution point over the whole standard curve range was produced to generate a reliable standard curve.
Real-time PCR and amplification protocol. PCR amplification and analysis were achieved using a LightCycler 2.0 instrument (Roche Applied Science) with software version 4.0. All reactions were performed with the LightCycler FastStart DNA master SYBR green I (Roche Applied Science) by using a 20 μl volume in each reaction capillary. For quantification of the cytokines, 2 μl DNA standard dilutions or 2 μl cDNA was added before capillaries were capped, centrifuged, and placed in the LightCycler sample carousel. Amplification conditions consisted of an initial preincubation at 95°C for 2 min (FastStart Taq DNA polymerase activation), followed by amplification of the target DNA for 40 cycles (95°C for 15 s, 60°C for 5 s, and a variable extension time at 72°C). Melting curve analysis was performed immediately after amplification at a linear temperature transition rate of 0.1°C/s from 60 to 95°C with continuous fluorescence acquisition. Expression of FOXP3, IL-10, TGF-β1 and IL-17A mRNA relative to GAPDH mRNA were determined using the 2-△△Ct method.
Statistical Analysis
Significant differences between a priori predefined groups of samples were evaluated using analysis of similarity (ANOSIM) and/or permutational multivariate analysis of variance (PERMANOVA). Statistically significant differences in relative abundance of taxa were performed using linear discriminant analysis effect size (LEfSe). A significant alpha at 0.05 and an effect size threshold of 4 were used for all biomarkers discussed in this study. For the co-occurrence network analysis, OTUs with relative abundance > 0.05% of the microbiome were subjected to Spearman correlation analysis of their occurrence patterns (32, 33), using the non-rarified sequence data. Only strong correlations (P < 0.001 after FDR correction) were visualized through network analysis with software Cytoscape 3.6 (34). The functional genes of bacterial communities based on the 16S rRNA sequencing data was analyzed by Tax4Fun (35), with the results from Tax4Fun being further analyzed using Statistical Analysis of Metagenomics Profiles (STAMP) (version 2.1.3) (36). Differences in histological data between groups were evaluated by analysis of variance. Gene abundance in RNA-seq data was expressed as fragments per kilobase of exon per million reads mapped (FPKM). Stringtie software was used to count the fragment within each gene, and TMM algorithm was used for normalization. Differential expression analysis for mRNA was performed using R package edgeR. Differentially expressed RNAs with |log2(FC)| value >1 and q value <0.05, considered as significantly modulated, were retained for further analysis. Relative expression differences of FOXP3, IL-10, TGF-β1 and IL-17A mRNA were determined using multivariate analysis of variance. All tests of significance were two sides, and P < 0.05 was considered statistically significant.
Results
Comparison of Gastric and Duodenal Microbiotas
Based on 16S rRNA bacterial gene sequencing, microbiome profiles in the gastric mucosa of 122 individuals were dominated by phyla Proteobacteria, Actinobacteria, Cyanobacteria, Bacteroidetes and Firmicutes (Figure 2A). These five phyla did also dominate the duodenal mucosa microbiota (Figure 2B). In ascertaining the reliability of bacterial diversity estimation, proportion of total bacterial species was measured using Good’s coverage estimator; the Good’s coverage index of all samples ranged from 99.6% to 99.9% (Figure 2C).
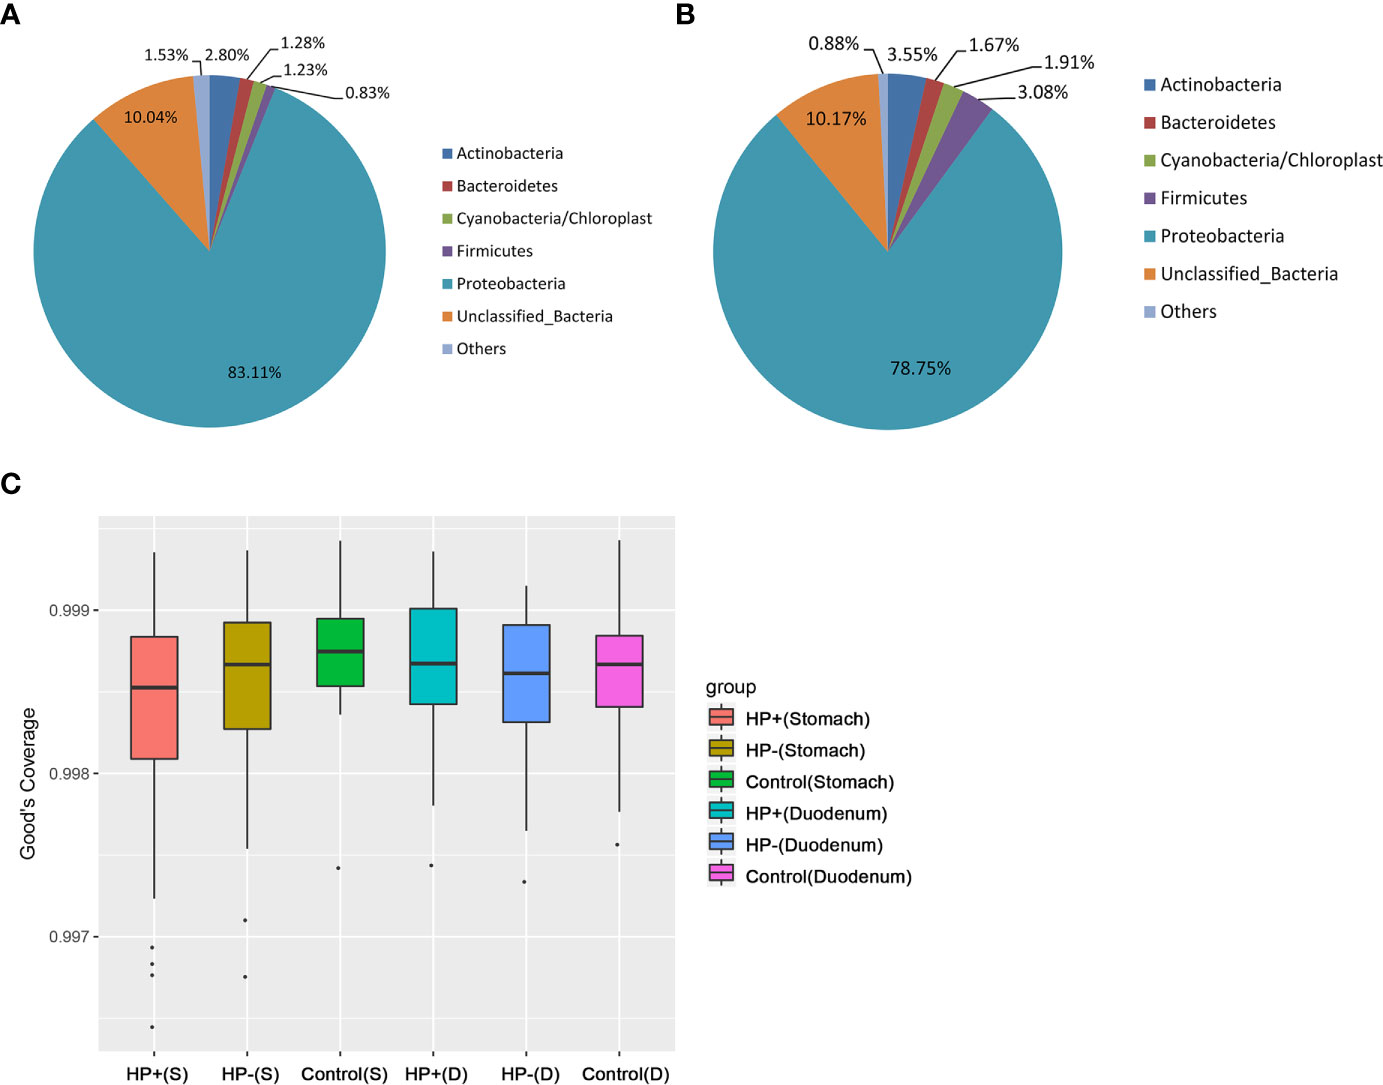
Figure 2 Gastric and duodenal microbiotas of children with and without H. pylori infection. (A) Average proportion of the five most abundant phyla of gastric bacteria in children (n = 122). (B) Average proportion of the five most abundant phyla of duodenal bacteria in children (n = 122). (C) Good’s coverage estimator measured the proportion of total bacterial species representative of each group’s gastric and duodenal sample.
The Influence of H. pylori Infection on the Gastric and Duodenal Microbiota
Bacterial diversity and abundance in the different groups. These indices, including a phylotype richness estimator (Chao1) and a phylotype diversity estimator (Shannon), were summarized. Chao1 analysis showed statistically significant differences between HP- and Control in the stomach (P = 0.019); no significant differences between HP- and Control in the duodenum were discerned (P = 0.44). Both gastric and duodenal microbiotas in HP+ were not significantly different from those of HP- (P = 0.21 and P = 0.16 respectively) (Figures 3A, B). By measuring phylotype diversity using Shannon index, we found patients in HP+ have significantly decreased gastric microbial diversity in comparison to patients in HP- (P = 0.0001); however, there was no statistical difference in duodenal microbial diversity between HP+ and HP- (P = 0.83). Both gastric and duodenal microbiotas in HP- were not significantly different from the Control (P = 0.07 and P = 0.89 respectively) (Figures 3C, D). For each sample in HP+, Helicobacter abundance and the corresponding Shannon diversity index were calculated. Linear correlation analysis indicated that phylotype diversity levels were negatively correlated with the relative abundance of Helicobacter genus (r = -0.775, P = 0.0001, 95% CI -0.654- -0.905) (Figure 3E). Beta diversity was calculated using PCoA of weighted Unifrac distances. Gastric microbiota composition in HP+ was significantly different from that of HP- (ANOSIM: R = 0.37, P = 0.001) (Figure 3F). Duodenal microbiota in HP+ and HP- was not significantly different (ANOSIM: R = 0.016, P = 0.236) (Figure 3G). Overall composition of gastric and duodenal microbiotas of HP- was similar to that of Control (ANOSIM: R = 0.02, P = 0.199 and R = 0.025, P = 0.278 respectively) (Figures 3F, G).
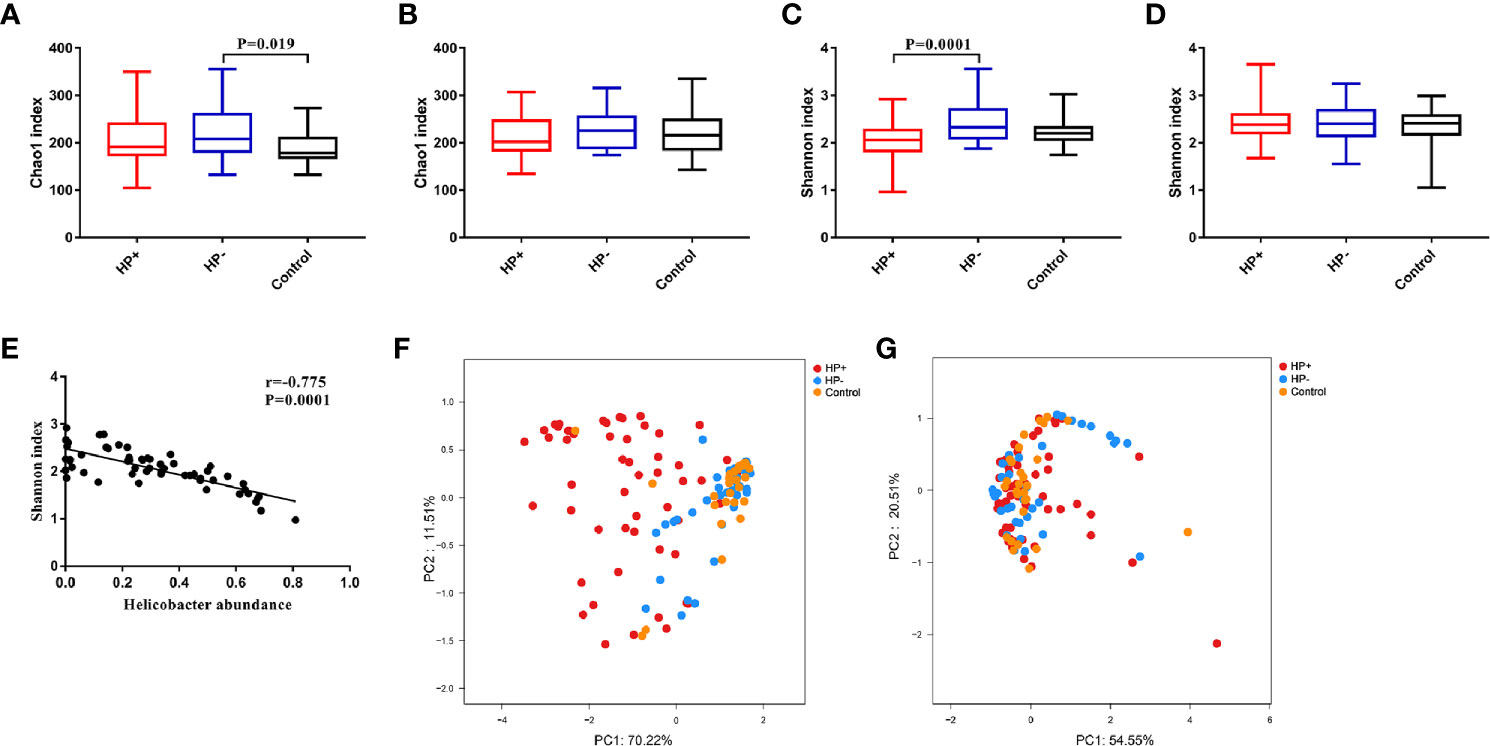
Figure 3 Alpha diversity and Beta diversity of microbiotas profile in children among the three groups. (A) Chao1 index in the stomach. (B) Chao1 index in the duodenum. (C) Shannon index in the stomach. (D) Shannon index in the duodenum. (E) Correlation between Shannon diversity and Helicobacter abundance from patients with H. pylori infection. (F) Principal coordinate analysis (PCoA) demonstrating clustering of patient groups in the stomach using weighted Unifrac as the distance measure and showing the percentage of diversity captured by each coordinate. (G) PCoA plot of duodenal microbiota among the three groups.
Comparisons between the gastric microbiota profiles in the different groups. Overall taxonomic composition of gastric microbiota in HP+ was significantly different from that of HP- based on beta diversity. Among the major phyla of gastric microbiota (when mean abundance was greater than 0.1%), clear differences were observed between HP+ and HP-. Relative abundance of six phyla (Actinobacteria, Bacteroidetes, Firmicutes, Fusobacteria, Gemmatimonadetes and Verrucomicrobia) were significantly decreased in HP+ when compared to HP- (P = 0.0006 ~ 0.016). Proportions of other major phyla were not significantly different between HP+ and HP- (Figure 4A). At genus level, we expanded the analysis to include most abundant genera (when mean abundance was greater than 0.7% in HP+ and/or HP-). Nine genera differed in abundance between HP+ and HP-, with Helicobacter being more abundant in HP+ (P = 0.0002) and Achromobacter, Devosia, Halomonas, Mycobacterium, Pseudomonas, Serratia, Sphingopyxis and Stenotrophomonas being more abundant in HP- (P = 0.0001) (Figure 4B). In HP+, there was a significant difference in relative abundance of Helicobacter genus between individuals, with abundance levels ranging from 2.19% to 80.98% (Table S1). While overall composition of gastric microbiota of HP- was similar to that of Control, differences were observed between the two groups at multiple taxonomic levels. Among major phyla of gastric microbiota, three phyla differed in abundance between HP- and Control, with Cyanobacteria, Firmicutes and Proteobacteria, being more abundant in HP- (P = 0.043, P = 0.013 and P = 0.026 respectively) (Figure 4A). At the major genus level, three genera differed in abundance; relative abundance of Bacillariophyta was higher, and relative abundances of both Acinetobacter and Helicobacter were lower in HP- (P = 0.003, P = 0.001 and P = 0.001 respectively) (Figure 4B). Relative abundance of four phyla (Actinobacteria, Cyanobacteria, Fusobacteria and Gemmatimonadetes) were significantly decreased in HP+ group when compared to Control (P = 0.0008 ~ 0.03). Proportions of other major phyla were not significantly different between HP+ group and Control (Figure 4A). At genus level, we expanded the analysis to include most abundant genera (when mean abundance was greater than 0.7% in HP+ and/or Control). Ten genera differed in abundance between HP+ and HP-, with Helicobacter being more abundant in HP+ (P = 0.0002) and Achromobacter, Acinetobacter, Devosia, Halomonas, Mycobacterium, Pseudomonas, Serratia, Sphingopyxis and Stenotrophomonas being more abundant in HP- (P = 0.0001) (Figure 4B).
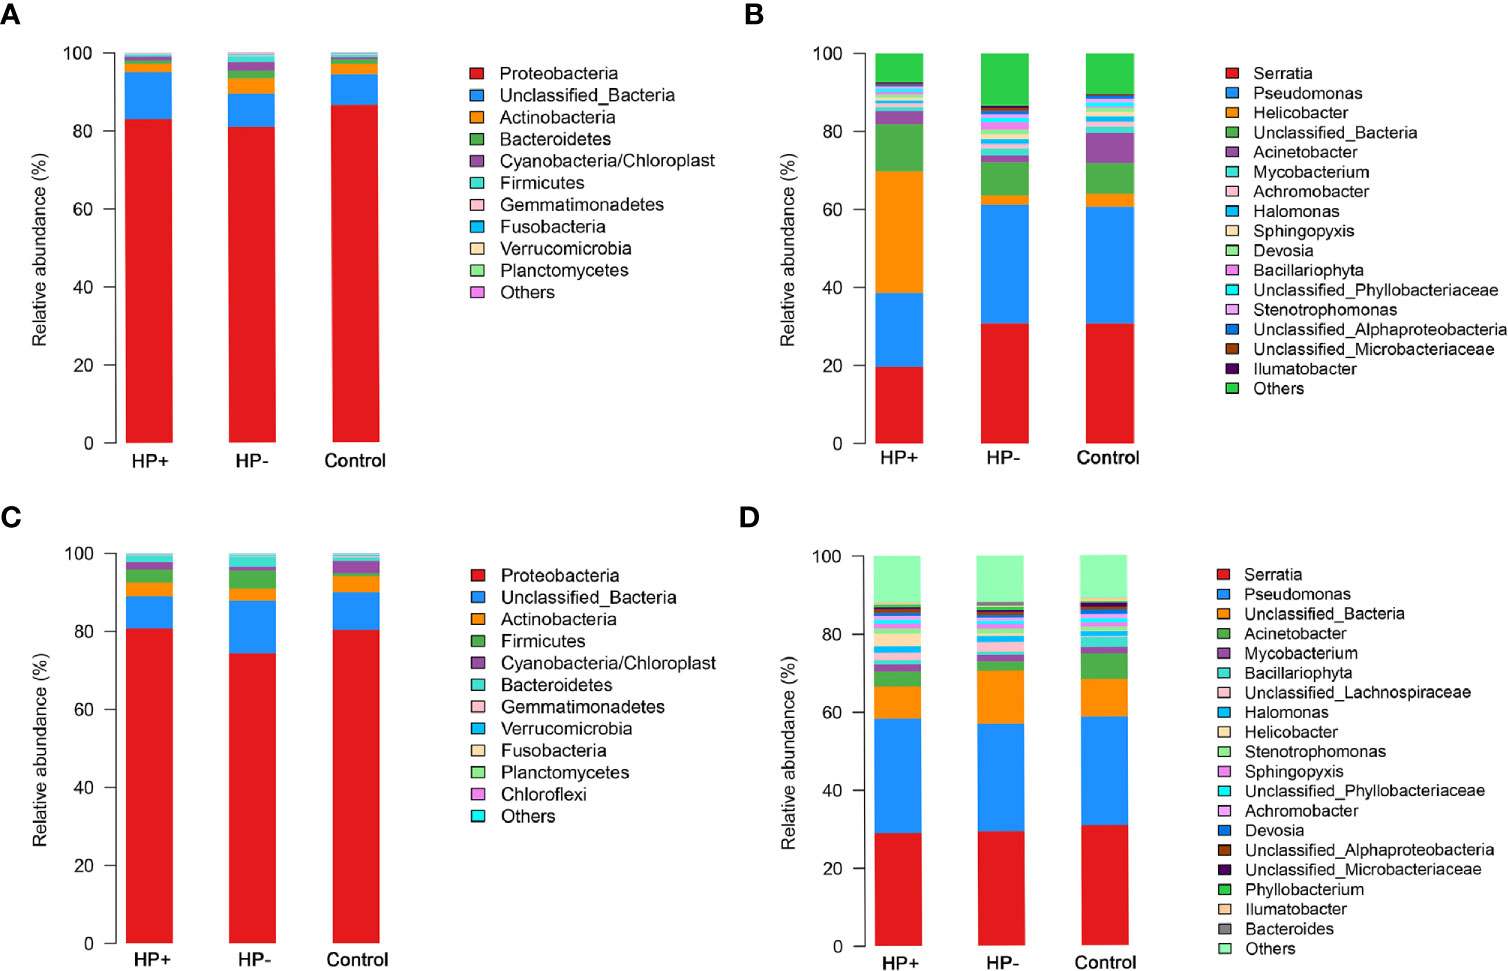
Figure 4 Differences of abundances in gastric and duodenal microbiota among different groups. Comparisons of the relative abundance of dominant bacterial taxa in gastric microbiota at the level of bacterial phylum (A) and genus (B). (C) Relative mean abundances of phyla among the three groups in duodenum. (D) Relative mean abundances of genera among the three groups in duodenum.
Comparisons between the duodenal microbiota profiles in the different groups. In contrast to differences in gastric microbiota, there were similar proportions of major phyla of duodenal microbiota between HP+ and HP-, only Proteobacteria was more abundant in HP+ (P = 0.047). Proportions of other major phyla were not significantly different between HP+ and HP- (P > 0.05) (Figure 4C). Predictably, HP+ expressed higher abundance of Helicobacter sequences than HP- (P= 0.04). With the exception of different abundances of Helicobacter, no statistically significant differences were observed at major genus level (Figure 4D). Among the major phyla in the duodenal microbiota, four phyla differed in abundance between HP- and Control, with Bacteroidetes, Cyanobacteria and Firmicutes being more abundant in HP- and Planctomycetes being more abundant in Control (P < 0.05, respectively). Proportions of other major phyla were not significantly different between HP- and Control (Figure 4C). At the major genus level, seven genera differed in abundance between HP- and Control, with Halomonas, Stenotrophomonas being more abundant in the HP- (P = 0.003 and P = 0.03 respectively) and Achromobacter, Acinetobacter, Bacillariophyta and Devosia being more abundant in the Control (P <0.01, respectively) (Figure 4D).
To identify the most relevant taxa responsible for differences among the three groups in the stomach, we conducted LEfSe analysis (37). Taxonomic distribution was visualized using a cladogram (Figures 5A, C, E). This analysis identified 12 taxa including 3 genera, which were differentially abundant between HP+ and HP-. In HP+ subset, Epsilonproteobacteria (class), Campylobacterales (order), Helicobacteraceae (family) and Helicobacter (genus) were shown to be over-represented. In HP-, Alphaproteobacteria and Gammaproteobacteria (class), Enterobacteriales and Pseudomonadales (orders), Enterobacteriaceae and Pseudomonadaceae (families), Pseudomonas and Serratia (genera) were significantly increased (Figure 5B). This analysis identified 5 taxa, including 1 genus, which were differentially abundant between HP- and Control. In HP- subset, Cyanobacteria (order) were shown to be over-represented. In Control, Proteobacteria (phyla), Pseudomonadales (order), Moraxellaceae (family) and Acinetobacter (genus) were significantly increased (Figure 5D). This analysis identified 15 taxa including 4 genera, which were differentially abundant between HP+ and Control. In HP+ subset, Epsilonproteobacteria (class), Campylobacterales (order), Helicobacteraceae (family) and Helicobacter (genus) were shown to be over-represented. In HP- group, Alphaproteobacteria and Gammaproteobacteria (class), Enterobacteriales and Pseudomonadales (orders), Enterobacteriaceae, Moraxellaceae and Pseudomonadaceae (families), Acinetobacter, Anaerovorax, Pseudomonas and Serratia (genera) were significantly increased (Figure 5F).
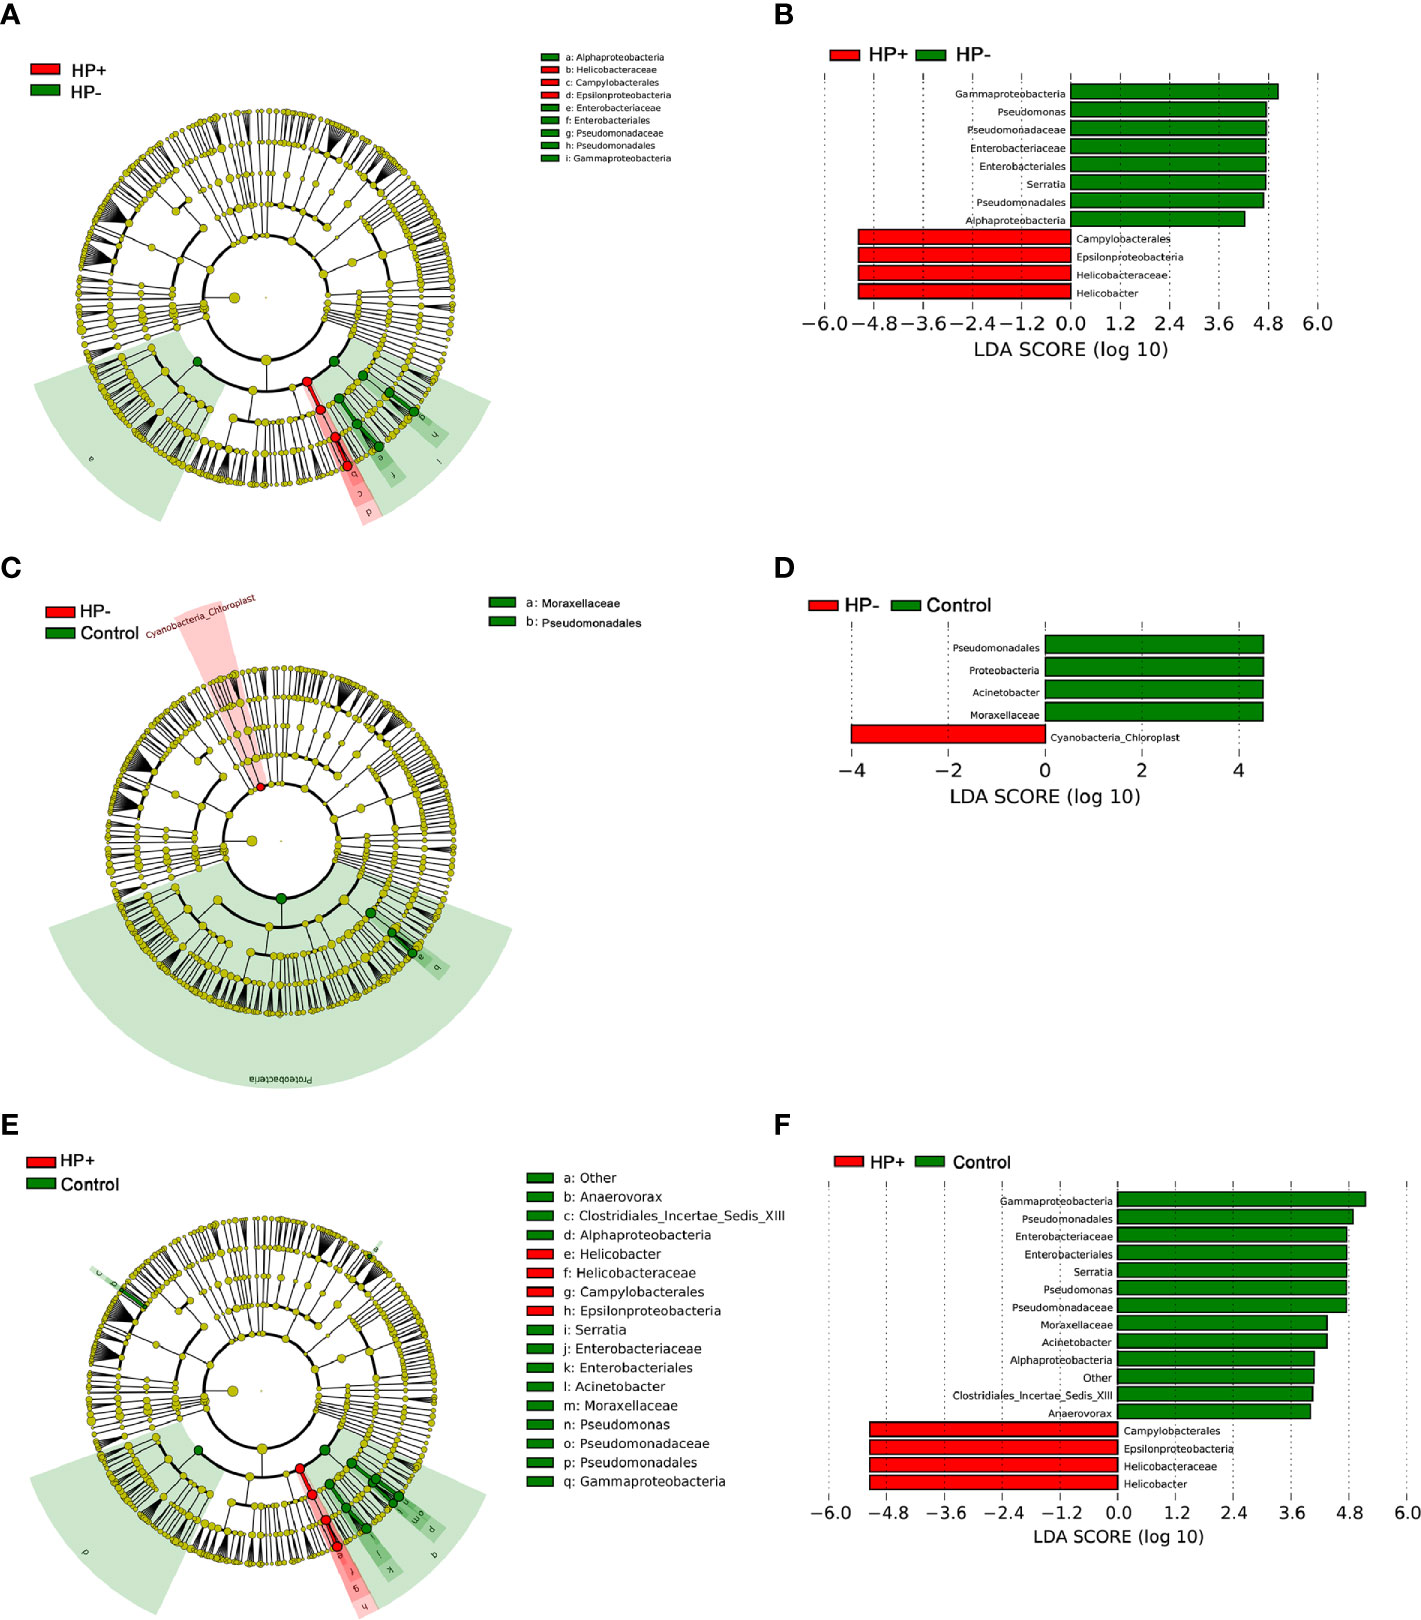
Figure 5 LEfSe identifies the taxa with the greatest differences in abundance among the three groups in the stomach. (A) The comparison between HP+ and HP-. (C) The comparison between HP- and Control. (E) The comparison between HP+ and Control. Only the taxa meeting a significant LDA threshold value of > 4 are shown. (B) The comparison between HP+ and HP-. (D) The comparison between HP- and Control. (F) The comparison between HP+ and Control.
The overall structure of the gastric microbiotas is the result of dynamic interactions between community members. In order to detect the relationship between different members of the gastric microbial communities, we constructed a network of co-occurrence OTU and interrogated the network for modules using weighted gene co-expression network analysis (WGCNA) (Figures 6A, B). The correlation networks formed different bacterial clusters in the two groups, with a more complex network of interactions in HP- than that in HP+. The most dominant member, Helicobacter, was negatively correlated with Pseudomonas, Sphingomonas and Stenotrophomonas in HP+, those genera showed mainly positive correlations within the same bacterial clusters (Figure 6A). Significant negative relationships were observed between Halomonas, Pseudomonas and Rhodovulum, and there is also an obvious negative correlation between Alloprevotella, Fusobacterium, Haemophilus, Halomonas, Loktanella, Neisseria, Porphyromonas and Rothia were amongst the most well-connected and influential bacteria observed in HP- group (Figure 6B). The functional content of the gastric microbiota was predicted by Tax4fun based on closed-reference OTU picking. We used STAMP to analyze differences at the KEGG level 3, a database for understanding metabolic functions and at the gene level. In our present study, there were considerable gastric microbiota associated KEGG gene function changes in HP+ than HP-. At KEGG level 3 that included 396 KEGG pathways, we identified 24 different KEGG pathways that were significantly different between HP+ and HP- (Figure 6C). The KEGG results of the top 11 pathways enrichment are shown in Table 2, while 5 different KEGG pathways were significantly downregulated in HP+.
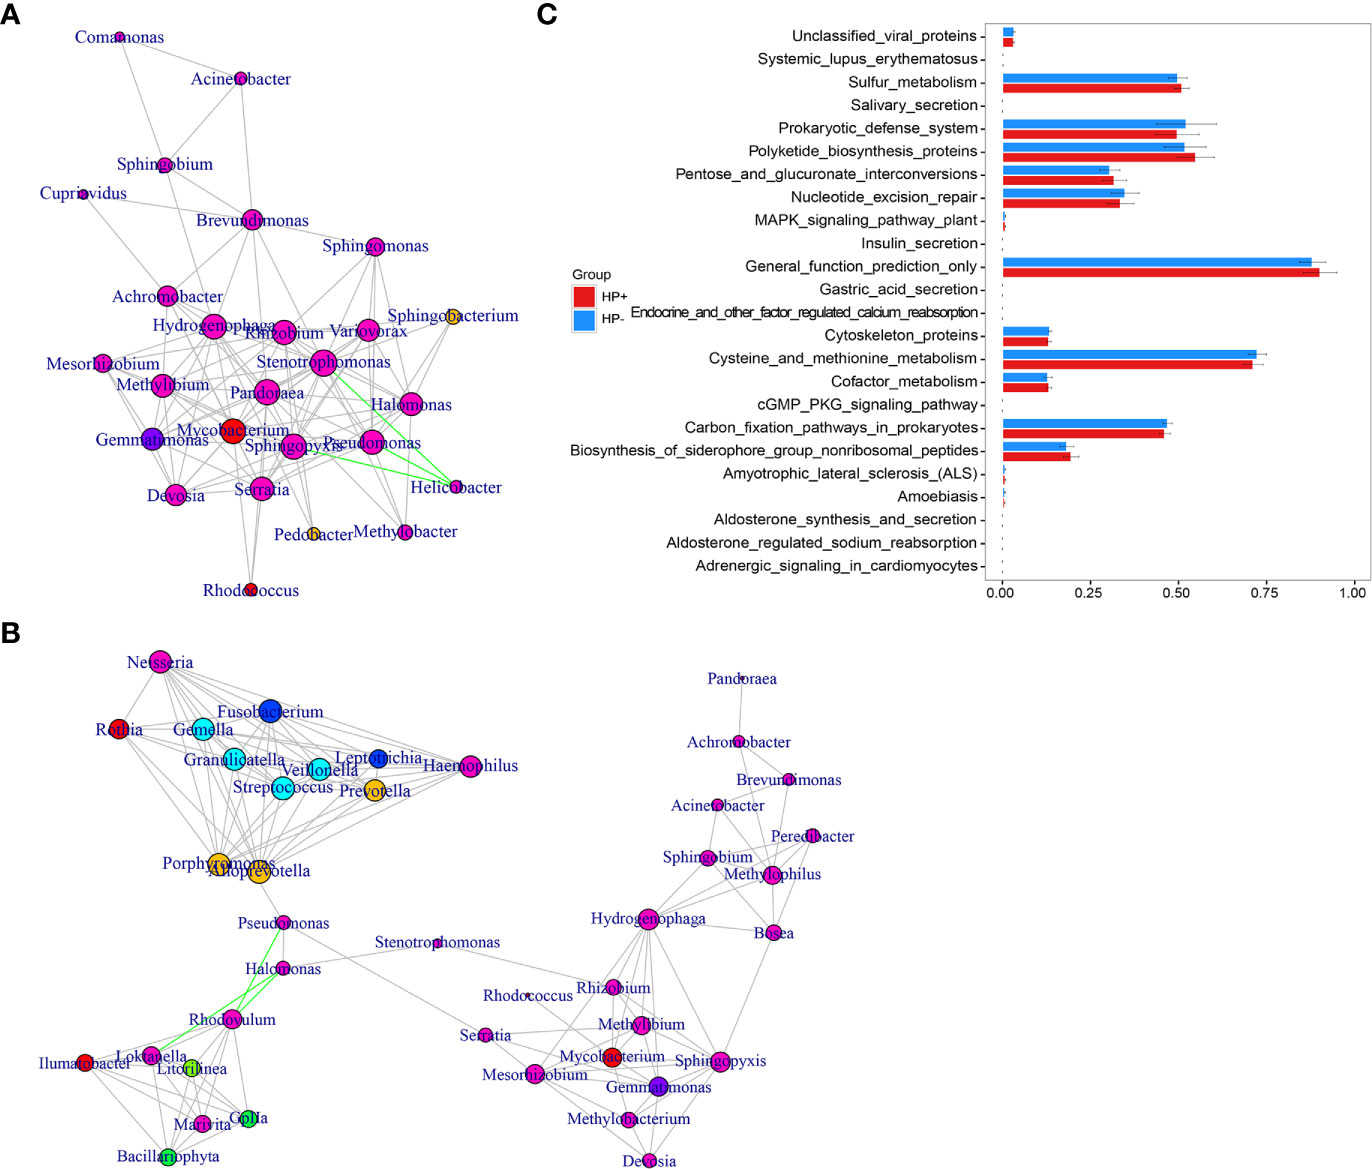
Figure 6 Correlation strengths of the abundant gastric microbiota and Tax4fun-based microbiome study in different stomach microhabitats. Correlation network of the abundant gastric microbiota in HP+ (A) and HP- (B). The genera were connected (Gray: positive correlation; Green: negative correlation) when the pair-wise correlation values were significant (P < 0.05) after adjusting the P values for multiple comparisons. Furthermore, sub-community detection was performed by placing the genera in the same sub-community (represented by color of nodes) when many links were found at correlation values > 0.6 between members of the sub-community. The size of the nodes represents the degree of connections. Statistical Analysis of Metagenomics Profiles (STAMP) was used to analyze the different bacterial functions between HP+ and HP- at the KEGG level 3 (C).
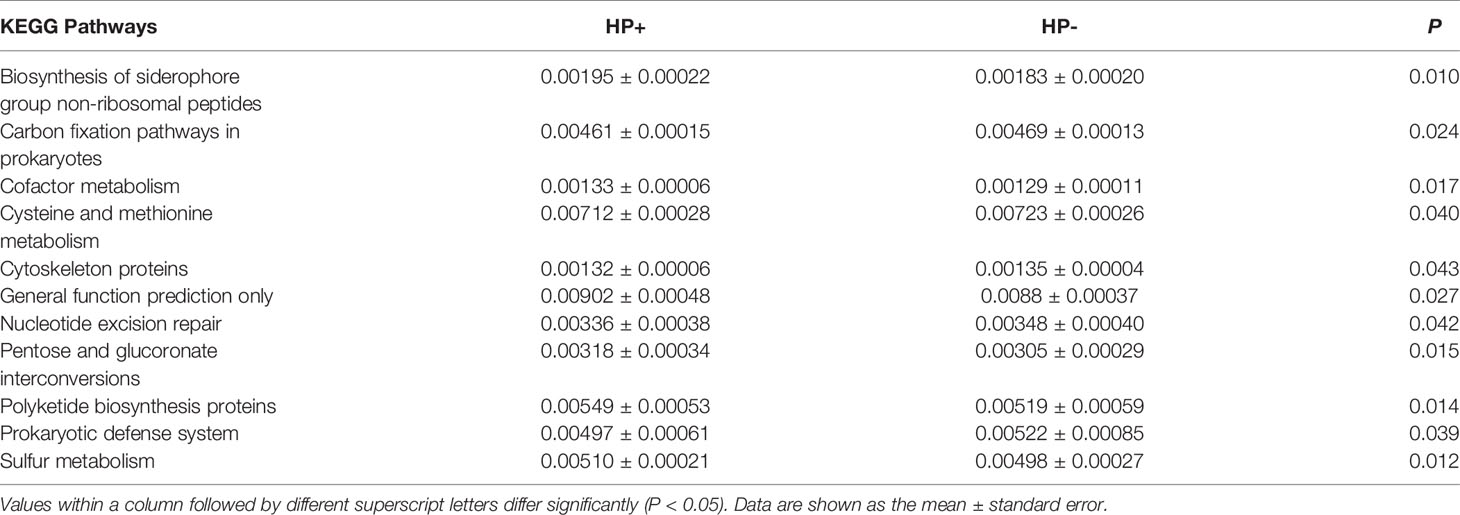
Table 2 The selected main microbial pathways grouped into level-3 functional categories using Tax4Fun.
Immune Factors Associated With H. pylori Infection and the Gastric Microbiota
The gastric histological scores of PMN and MNC infiltrations were significantly higher in HP+ than in both HP- and Control (Table 3). There was no statistically significant difference in the duodenal histological scores of PMN and MNC infiltrations among the three groups.
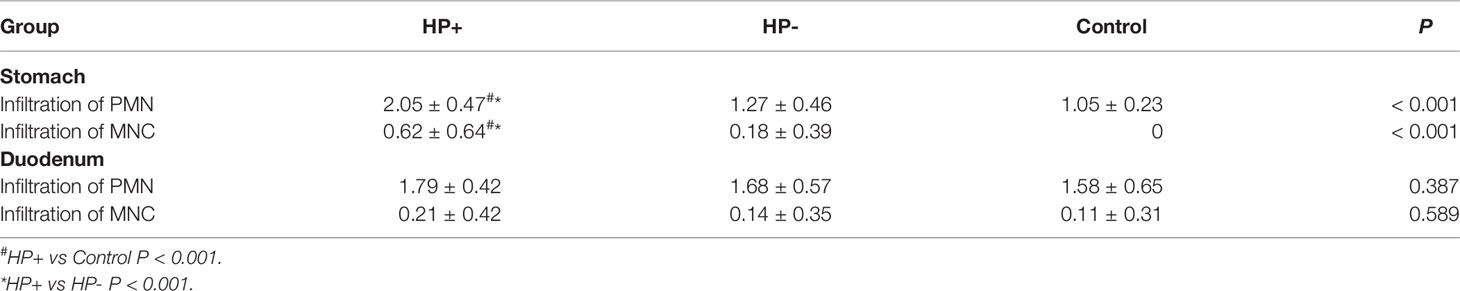
Table 3 Histological scores of gastric mucosa and duodenal mucosa according to the updated Sydney classification.
Relation of CD4+ T cells, macrophages (CD68+) with H. pylori infection.The presence of CD4+ T cells and macrophages in the gastric mucosa were determined in two consecutive sections. IHC staining suggested that the children in HP+ (33 samples) had a significant higher number of CD4+ cells than the children in both HP- (17 samples) and Control (13 samples) (Figures 7A, B). The number of CD68+ in HP+ (33 samples) was significantly higher than in both HP- (17 samples) and Control (13 samples) (Figures 7A, C). In the duodenal mucosa, there was no statistically significant difference in either CD4+ T cells or CD68+ among the three groups (Figures 7A–C).
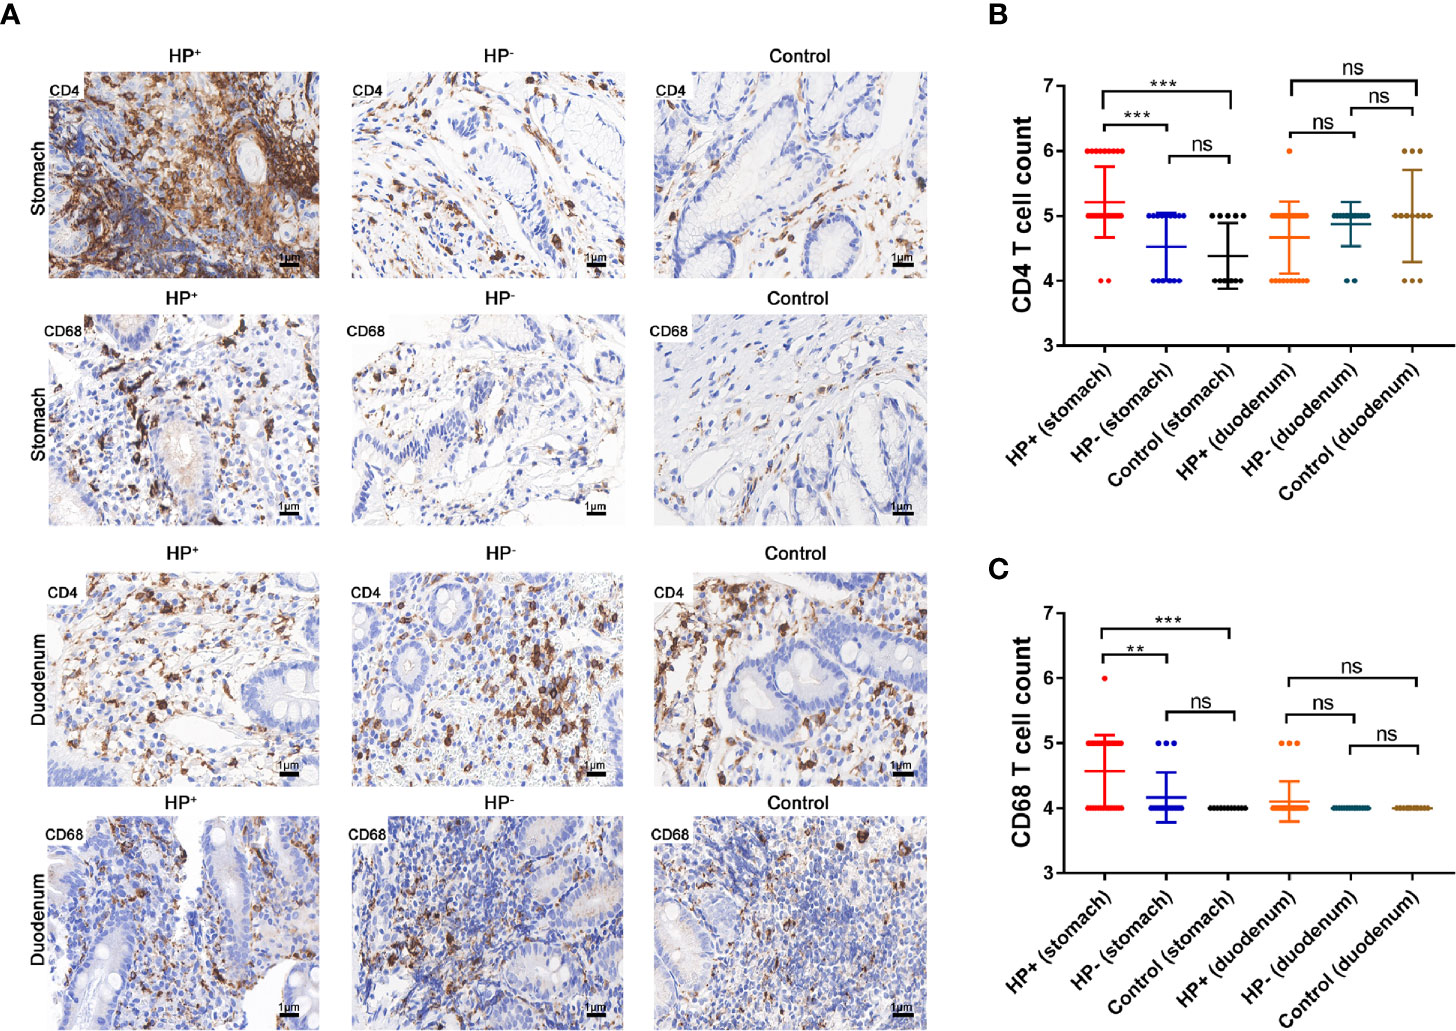
Figure 7 The expression of CD4+ T cells and CD68+ were assessed by immunohistochemical staining. (A) Immunohistochemical staining of CD4+ T cells and CD68+ in the gastric mucosa and duodenal mucosa (original magnification ×400). (B) Immunohistochemical score of CD4+ T cells. **P < 0.01, ***P < 0.001. (C) Immunohistochemical score of CD68+. **P < 0.01, ***P < 0.001.
Analysis of differential gene expression of H. pylori infection: The volcano diagram results showed significant differentially expressed genes (DEGs) in the gastric mucosa between HP+ and HP-. Out of the 1011 dysregulated genes detected in HP+, 180 genes were upregulated (fold change ≥ 2) and 831 genes were downregulated (fold change ≥ 2) (Figure 8A). Go classification of DEGs: To determine the function of differentially expressed genes, all DEGs were mapped to terms in the GO database. Differentially expressed mRNA was clustered in 57 GO terms. The top 10 GO terms for aggregation of differentially expressed mRNA were cell, cell composition, cellular process, single-organism process, binding, biological regulation, biological process regulation, cell membrane, response to stimulation and organelle (Figure 8B). KEGG pathway analysis of DEGs between HP+ and HP-: In order to explore the mechanism of H. pylori infection, we performed KEGG pathway analysis of the dysregulated genes in the gastric mucosa between HP+ and HP-. The results indicated that Th17, Th1 and Th2 cell differentiation, T cell receptor signaling pathway, Cytokine-cytokine receptor interaction, TGF-β1 signaling pathway may be involved in the pathogenesis of H. pylori infection, so we choose these pathways to further analyze. The KEGG results of the top 30 pathways enrichment are shown in Figure 8C. Gene expression cluster: A hierarchical cluster of DEGs is partially shown in Figure 8D. Genes involved in the T cell receptor signaling pathway (IL-10), Th17 cell differentiation (IL-17A, FOXP3), and TGF-β1 signaling pathway (TGF-β1) were significantly upregulated in HP+ when compared to HP-.
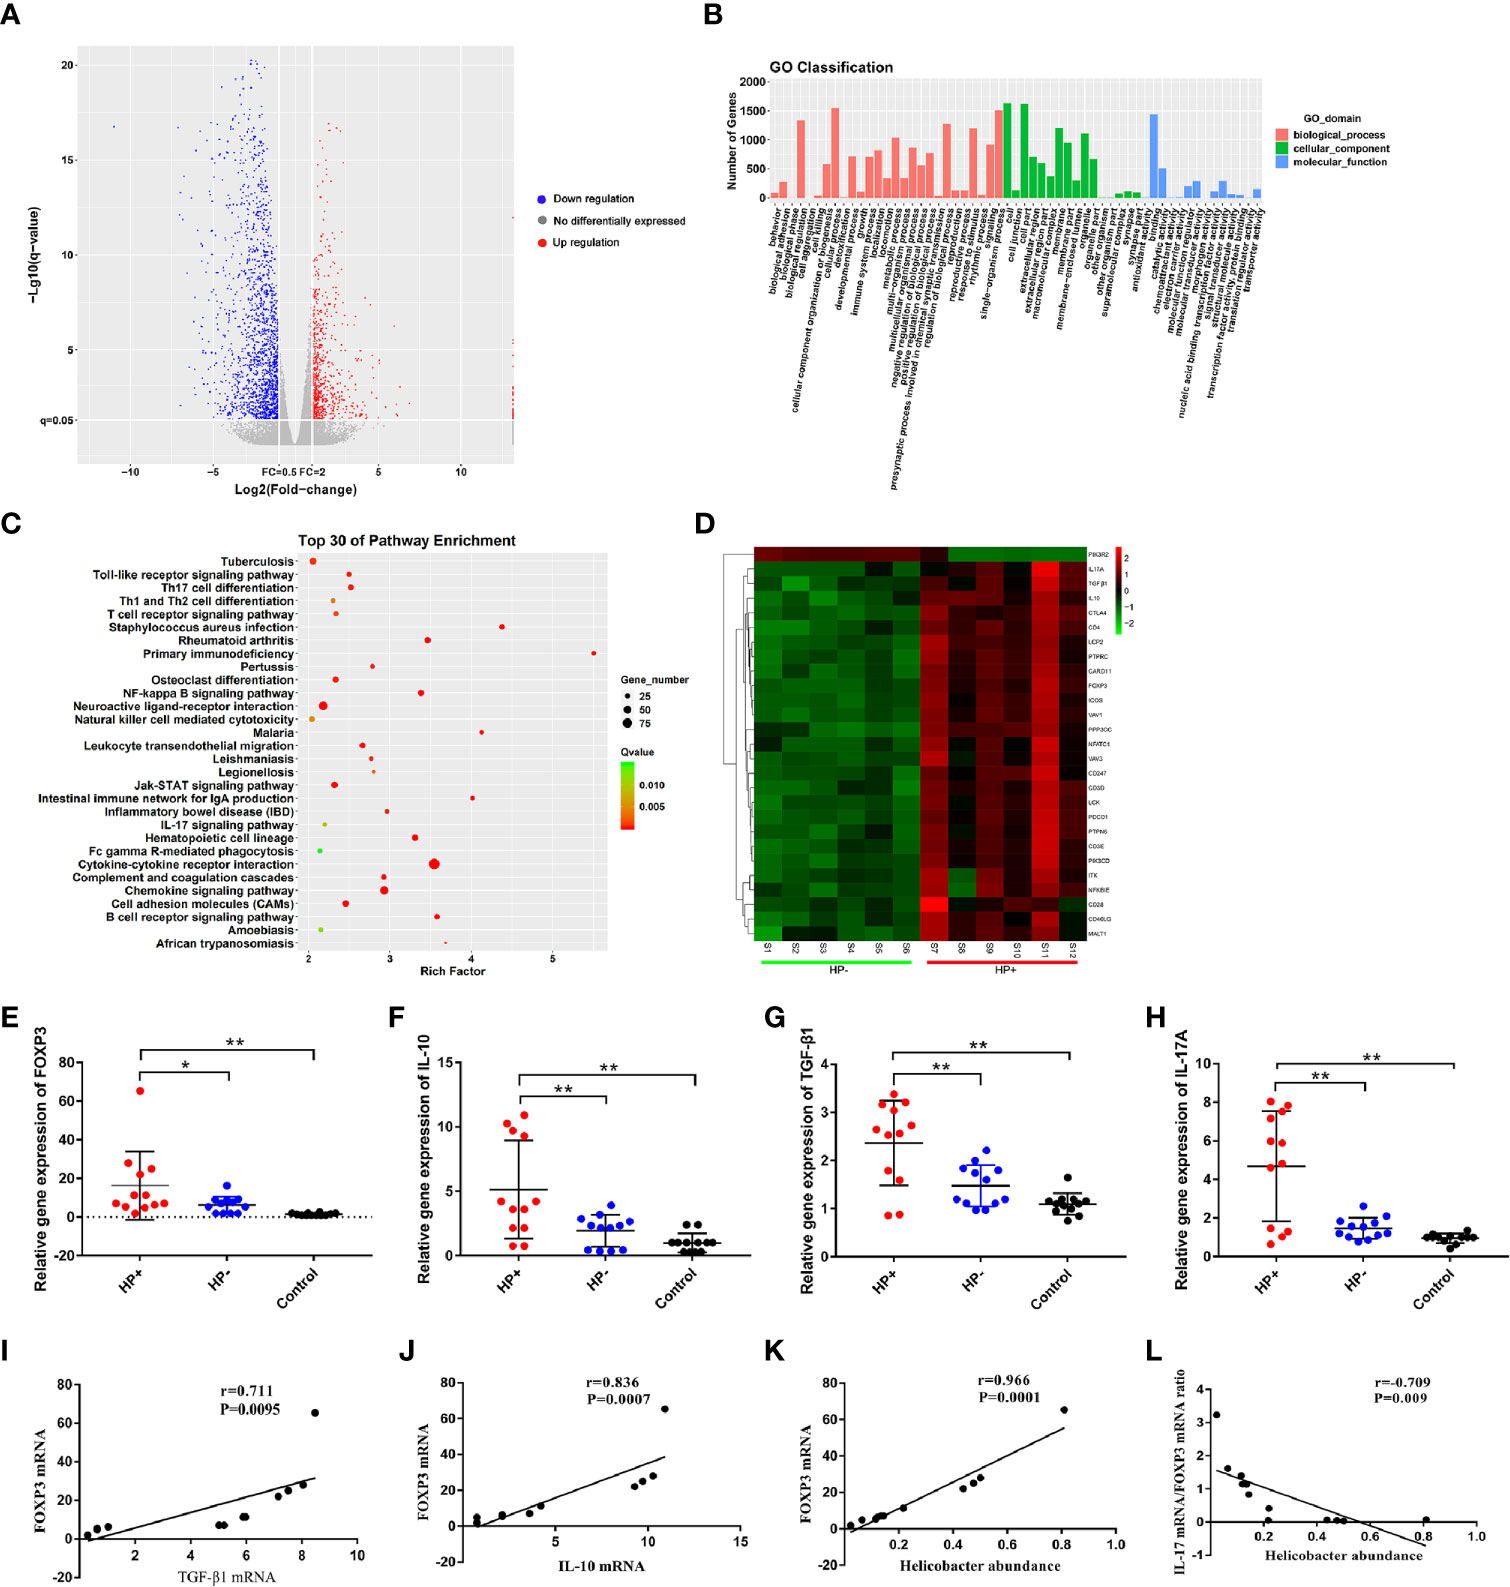
Figure 8 Analysis of differential gene expression using RNA sequencing, and quantitative RT-PCR validation of the selected dysregulated genes associated with T cell receptor signaling pathway, Th17 cell differentiation and TGF-β1 signaling pathway. (A) The volcano diagram showed significantly differentially expressed genes (DEGs) in gastric mucosa between HP+ and HP-. Red and green spots represented up-regulated and down-regulated genes respectively. Black spots indicated genes that were not differentially expressed between the two groups. (B) Go classification of DEGs between HP+ and HP-. The x-axis indicated the subcategories, the left y-axis represented the percentage of a specific category of DEGs and the right y-axis indicated the number of DEGs. (C) Scatter plot for KEGG enrichment results. The top 30 enrichment pathways are shown in the senior bubble chart. The Rich factor is the ratio of DEGs numbers annotated in this pathway term to all gene numbers annotated in this pathway term. (D) Cluster analysis of DEGs annotated in pathways associated with T cell receptor signaling pathway, Th17 cell differentiation and TGF-β1 signaling pathway. Samples S1 to S6 were in HP- and S7 to S12 were in HP+. The expression levels of FOXP3 (E), IL-10 (F), TGF-β1 (G) and IL-17A (H) were validated using qRT-PCR. The bar graph shows the expression of each gene in one group relative to the average expression levels in the other group. *P < 0.05; **P < 0.01, indicate a statistically significant difference. FOXP3 gene expression in relation to the regulatory cytokines gene expression and Helicobacter abundance level. (I) FOXP3 versus TGF-β1 gene expression; (J) FOXP3 versus IL-10 gene expression; (K) FOXP3 gene expression versus Helicobacter abundance level; (L) The ratio of IL-17A mRNA/FOXP3 mRNA versus Helicobacter abundance level.
The RNA sequencing results of selected genes were validated by real-time RT-PCR. The dysregulated genes, FOXP3, IL-10, TGF-β1 and IL-17A in mRNA expression profiling results were selected for qRT-PCR validation. The qRT-PCR results showed that the expression of FOXP3, IL-10, TGF-β1 and IL-17A were increased in the gastric mucosa of HP+ than in both HP- and Control (Figure 8E-H). In HP+, FOXP3 levels were positively correlated with TGF-β1 (r = 0.711, P = 0.0095, 95% CI 0.788- 0.994; Figure 8I) and IL-10 levels (r = 0.836, P = 0.0007, 95% CI 0.650- 0.929; Figure 8J). Also, a significant correlation was identified between FOXP3 level and Helicobacter abundance level (r = 0.966, P = 0.0001, 95% CI 0.616- 0.974; Figure 8K). To determine whether H. pylori infection affected Treg and Th17 cells, the correlation between IL-17 mRNA/FOXP3 mRNA ratio and Helicobacter abundance level was evaluated; the ratio was inversely associated with Helicobacter abundance level (r = -0.709, P = 0.009, 95% CI -0.600- -0.930; Figure 8L).
Discussion
Despite numerous studies addressing the microbiota of upper gastrointestinal tract (38), these studies are usually performed on a small number of adults infected with H. pylori. Information pertaining to gastric mucosal samples in children infected with H. pylori is scarce. Microbiota analyses show complexity and richness of the human gastric and duodenal bacterial community (39, 40), with the most abundant phyla being Proteobacteria, Firmicutes, Bacteroidetes, Fusobacteria and Actinobacteria (41, 42). In this study, we found a similar pattern. Phylum Proteobacteria was the dominant bacterial group in both stomach and duodenum irrespective of H. pylori infection, with a relative abundance of more than 80.00%. This was much higher than the relative abundance that had been reported in previous studies (42, 43). Studies have also reported Streptococcus, Lactobacillus, Bacteroides, Staphylococcus, Prevotella, Fusobacterium and Veillonella to be the prominent genera in the stomach (40, 44). We found a considerable higher concentration of mucosal samples belonging to Serratia, Pseudomonas, Helicobacter, Acinetobacter, Achromobacter and Mycobacterium. The distribution of gastro-duodenal microbiota was different from previous reports (40, 41, 44, 45). We believe the underlying reason had to do with various factors such as age, genetics, region and dietary habit.
At genus level, there was a significant change in microbial community of gastric microbiota between HP+ and HP-. In HP+, we found differences of relative abundance of Helicobacter genus between individuals in HP+ to be significant (from 2.19% to 80.98%) in the stomach. The samples with low abundance of Helicobacter genus could have been due to either a recent colonization with H. pylori or the children being colonized by a less virulent strain that was not able to dominate the ecosystem (43). Also, H. pylori DNA was present in the biopsy samples of subjects that were considered to be H. pylori-negative by conventional methods. It is possible that the number of H. pylori bacteria in these samples (HP- and Control) were too low to be detected by conventional methods and too few to elicit host antibody production. It could have also been due to the high sensitivity of 16SrRNA high-throughput sequencing. Although a recent study reported the influence of Helicobacter on the community to be more evident in duodenal samples of adults (41, 45), we, however, studied the duodenal bulb mucosal microbiota in children and ended up with a contrasting inference in our present study.
The present study indicates an inverse relationship between microbial diversity and Helicobacter abundance as well as the probable modulation of microbial abundance by Helicobacter (7, 9). Co-occurrence networks indicated that there were clear negative relationships between Helicobacter and the other genera. The increase in bacterial Shannon diversity among H. pylori-negative individuals has been previously described and would match with the study in which it was reported that higher microbiota diversity was associated with better health (46). That said, Tax4Fun analysis indicated that a variety of metabolic pathways were affected by the HP infection; the lower metabolic pathways might be associated with worse health.
Studies have reported that gastric epithelial cells and dendritic cells in the subepithlial space are localized to monitor the gastric microbiota (47–49). In mice, certain members of the gut microbiota and their metabolites have been shown to induce Treg responses in the lower intestinal mucosa. Studies have implicated Tregs to be associated with reduced Th1 and Th17 mediated gastritis in humans (14, 15). Colonization of Bacteroides fragilis, a prominent human commensal, was shown to induce Tregs and production of IL-10 by polysaccharide A via TLR2 signaling (50, 51). Clusters IV and XIVa of the genus Clostridium promoted Treg cell accumulation, colonization of GF mice by 46 strains of Clostridium provided an environment rich in TGF-β and affected Foxp3+ Treg number and function in the colon (52). Studies have demonstrated that development of Th17 cells in the small intestine can be potently induced by colonization of commensal Clostridia-related segmented filamentous bacteria (SFB) (53–55), a cascade of events initiated by SFB adhesion to the small intestine epithelium to promote IL-17 expression in RORγt+ CD4+ T cells in the gut (56). However, the role of microbiota in inducing Treg in the upper digestive tract has received little investigative attention, particularly in humans (42). Our results suggest that there is a significant correlation between H. pylori infection, gastric microbiota and the Treg response. Treg cells and Th17 cells are functionally antagonistic to each other, in host tolerance or defense against pathogens, especially on mucosal surfaces (57). The balance of Treg and Th17 cells play an important role in the persistence of H. pylori and related diseases (58). We found that FOXP3 mRNA was associated with Helicobacter abundance level; IL-17A mRNA/FOXP3 mRNA ratio was inversely correlated with Helicobacter abundance level. These indicate that the balance between Treg and Th17 cells may be biased towards Treg, which is beneficial to the persistence of bacteria, leading to chronic active gastritis. Predicted functional changes in gastric microbial communities identified alpha Linolenic acid metabolism and Arachidonic acid metabolism to be significantly upregulated, with cGMP signaling pathway and cAMP signaling pathway being significantly downregulated at KEGG level 3 in H. pylori-infected children. Thus, the gastric microbiota in H. pylori-infected children might generate short chain fatty acids and small molecules capable of modulating mucosa Treg responses (59).
It is worth noting that this study had limitations. Firstly, while it has been reported that the gastrointestinal microbiota is dynamic and can be influenced by many external factors such as drug or diet (4), we excluded subjects with recent intake of antibiotic, PPI and NSAID. Also, all biopsies were taken at fasting state during endoscopy so as to minimize the potential influence by meal. Secondly, as all cases were selected from Children’s Hospital of Zhejiang University School of Medicine, there is the possibility of results having confounding variables that are inevitable in all single-centered studies. In view of that, result from large-scale multicenter prospective clinical studies is recommended.
In summary, we report the gastric microbiota and an increased gastric Treg response in children with H. pylori infection. The gastric microbiota can down-regulate gastric inflammation in H. pylori infected children by inducing Treg responses. Our results present a comprehensive and novel perspective on microbial communities of gastric and duodenal ecosystem, which is of great significance to further study H. pylori colonization in-vivo.
Data Availability Statement
The datasets presented in this study can be found in online repositories. The names of the repository/repositories and accession number(s) can be found below: https://www.ncbi.nlm.nih.gov/sra/PRJNA680429.
Ethics Statement
The study protocol was approved by the Medical Ethics Committee in the Children’s Hospital of Zhejiang University School Of Medicine (2018-IRB-004). Written informed consent to participate in this study was provided by the participants’ legal guardian/next of kin.
Author Contributions
WZ and MJ designed the study. WZ, KP, FL, and HZ collected samples. LL, GL, and BC facilitated DNA sequencing. JM and XS facilitated RNA sequencing. WZ and WG facilitated Histology and Immunohistochemistry. WZ prepared the manuscript. BB, MF, and MJ reviewed and edited the final version. All authors contributed to the article and approved the submitted version.
Funding
This work was supported by grants from the National Natural Science Foundation of China (No. 81270459), the Public Welfare Project of Science Technology Department of Zhejiang Province (No. 2016C33152), the Scientific Research Fund of National Health and the Family Planning Commission-Major Science and Technology Project of the Zhejiang Province Medical and Health (No. WKJ-ZJ-1622), and Key Research and Development Project of Zhejiang Province (No. 2021C03064).
Conflict of Interest
The authors declare that the research was conducted in the absence of any commercial or financial relationships that could be construed as a potential conflict of interest.
Supplementary Material
The Supplementary Material for this article can be found online at: https://www.frontiersin.org/articles/10.3389/fimmu.2021.625586/full#supplementary-material
References
1. Marshall BJ, Warren JR. Unidentified curved bacilli in the stomach of patients with gastritis and peptic ulceration. Lancet (1984) 1:1311–5. doi: 10.1016/S0140-6736(84)91816-6
2. Beasley DE, Koltz AM, Lambert JE, Fierer N, Dunn RR. The Evolution of Stomach Acidity and Its Relevance to the Human Microbiome. PloS One (2015) 10:e0134116. doi: 10.1371/journal.pone.0134116
3. Bik EM, Eckburg PB, Gill SR, Nelson KE, Purdom EA, Francois F, et al. Molecular analysis of the bacterial microbiota in the human stomach. Proc Natl Acad Sci U S A (2006) 103:732–7. doi: 10.1073/pnas.0506655103
4. He C, Yang Z, Lu N. Imbalance of gastrointestinal microbiota in the pathogenesis of Helicobacter pylori-associated diseases. Helicobacter (2016) 21:337–48. doi: 10.1111/hel.12297
5. Atherton JC, Blaser MJ. Coadaptation of Helicobacter pylori and humans: ancient history, modern implications. J Clin Invest (2009) 119:2475–87. doi: 10.1172/JCI38605
6. Malfertheiner P. The intriguing relationship of Helicobacter pylori infection and acid secretion in peptic ulcer disease and gastric cancer. Dig Dis (2011) 29:459–64. doi: 10.1159/000332213
7. Andersson AF, Lindberg M, Jakobsson H, Bäckhed F, Nyrén P, Engstrand L. Comparative analysis of human gut microbiota by barcoded pyrosequencing. PloS One (2008) 3:e2836. doi: 10.1371/journal.pone.0002836
8. Sung J, Kim N, Kim J, Jo HJ, Park JH, Nam RH, et al. Comparison of gastric microbiota between gastric juiceand mucosa by next generation sequencing method. J Cancer Prev (2016) 21:60–5. doi: 10.15430/JCP.2016.21.1.60
9. Maldonado-Contreras A, Goldfarb KC, Godoy-Vitorino F, Karaoz U, Contreras M, Blaser MJ, et al. Structure of the human gastric bacterial community in relation to Helicobacter pylori status. ISME J (2011) 5:574–9. doi: 10.1038/ismej.2010.149
10. Eun CS, Kim BK, Han DS, Kim SY, Kim KM, Choi BY, et al. Differences in gastric mucosal microbiota profiling in patients with chronic gastritis, intestinal metaplasia, and gastric cancer using pyrosequencing methods. Helicobacter (2014) 19:407–16. doi: 10.1111/hel.12145
11. Coker OO, Dai Z, Nie Y, Zhao G, Cao L, Nakatsu G, et al. Mucosal microbiome dysbiosis in gastric carcinogenesis. Gut (2018) 67:1024–32. doi: 10.1136/gutjnl-2017-314281
12. Ferreira RM, Pereira-Marques J, Pinto-Ribeiro I, Costa JL, Carneiro F, Machado JC, et al. Gastric microbial community profiling reveals a dysbiotic cancer-associated microbiota. Gut (2018) 67:226–36. doi: 10.1136/gutjnl-2017-314205
13. Wacklin P, Laurikka P, Lindfors K, Collin P, Salmi T, Lähdeaho ML, et al. Altered duodenal microbiota composition in celiac disease patients suffering from persistent symptoms on a long-term gluten-free diet. Am J Gastroenterol (2014) 109:1933–41. doi: 10.1038/ajg
14. Harris PR, Wright SW, Serrano C, Riera F, Duarte I, Torres J, et al. Helicobacter pylori gastritis in children is associated with a regulatory T-cell response. Gastroenterology (2008) 134:491–9. doi: 10.1053/j.gastro.2007.11.006
15. Serrano C, Wright SW, Bimczok D, Shaffer CL, Cover TL, Venegas A, et al. Downregulated Th17 responses are associated with reduced gastritis in Helicobacter pylori-infected children. Mucosal Immunol (2013) 6:950–9. doi: 10.1038/mi.2012.133
16. Brawner KM, Morrow CD, Smith PD. Gastric microbiome and gastric cancer. Cancer J (2014) 20:211–6. doi: 10.1097/PPO.0000000000000043
17. Arpaia N, Campbell C, Fan X, Dikiy S, van der Veeken J, deRoos P, et al. Metabolites produced by commensal bacteria promote peripheral regulatory T-cell generation. Nature (2013) 504:451–5. doi: 10.1038/nature12726
18. Chu H, Khosravi A, Kusumawardhani IP, Kwon AH, Vasconcelos AC, Cunha LD, et al. Gene-microbiota interactions contribute to the pathogenesis of inflammatory bowel disease. Science (2016) 352:1116–20. doi: 10.1126/science.aad9948
19. Donaldson GP, Lee MS, Mazmanian SK. Gut biogeopgraphy of the bacterial microbiota. Nat Rev Microbiol (2016) 14:20–32. doi: 10.1038/nrmicro3552
20. Korn T, Bettelli E, Oukka M, Kuchroo VK. IL-17 and Th17 cells. Annu Rev Immunol (2009) 27:485–517. doi: 10.1146/annurev.immunol.021908.132710
21. Huber S, Gagliani N, Esplugues E, O’Connor W, Huber FJ, Chaudhry A, et al. Th17 cells express interleukin-10 receptor and are controlled by Foxp3- and Foxp3+ regulatory CD4+ T cells in an interleukin-10-dependent manner. Immunity (2011) 34:554–65. doi: 10.1016/j.immuni.2011.01.020
22. Subspecialty Group of Gastroenterology, the Society of Pediatrics, Chinese Medical Association. Guidelines for Helicobacter pylori infection in children in China. Zhonghua Er Ke Za Zhi (2015) 53:496–8.
23. Bag S, Saha B, Mehta O, Anbumani D, Kumar N, Dayal M, et al. An improved method for high quality metagenomics DNA extraction from human and environmental samples. Sci Rep (2016) 6:26775. doi: 10.1038/srep26775
24. Caporaso JG, Lauber CL, Walter WA, Berg-Lyons D, Lozupone CA, Turnbaugh PJ, et al. Global patterns of 16S rRNA diversity at a depth of millions of sequences per sample. Proc Natl Acad Sci USA (2011) 108:4516–22. doi: 10.1073/pnas.100008010V7
25. Caporaso JG, Kuczynski J, Stombaugh J, Bittinger K, Bushman FD, Costello EK, et al. QIIME allows analysis of high-throughput community sequencing data. Nat Methods (2010) 7:335–6. doi: 10.1038/nmeth.f.303
26. Edgar RC, Haas BJ, Clemente JC, Quince C, Knight R. UCHIME improves sensitivity and speed of chimera detection. Bioinformatics (2011) 27:2194–200. doi: 10.1093/bioinformatics/btr381
27. Edgar RC. UPARSE: highly accurate OTU sequences from microbial amplicon reads. Nat Methods (2013) 10:996–8. doi: 10.1038/nmeth.2604
28. McDonald D, Price MN, Goodrich J, Nawrocki EP, DeSantis TZ, Probst A, et al. An improved Greengenes taxonomy with explicit ranks for ecological and evolutionary analyses of bacteria and archaea. ISME J (2012) 6:610–8. doi: 10.1038/ismej.2011.139
29. Dixon MF, Genta RM, Yardley JH, Correa P. Classification and grading of gastritis. The updated Sydney System. International Workshop on the Histopathology of Gastritis, Houston 1994. Am J Surg Pathol (1996) 20:1161–81. doi: 10.1097/00000478-199610000-00001
30. Peinnequin A, Mouret C, Birot O, Alonso A, Mathieu J, Clarencon D, et al. Rat pro-inflammatory cytokine and cytokine related mRNA quantification by real-time polymerase chain reaction using SYBR green. BMC Immunol (2004) 5:3. doi: 10.1186/1471-2172-5-3
31. Overbergh L, Giulietti A, Valckx D, Decallonne R, Bouillon R, Mathieu C. The use of real-time reverse transcriptase PCR for the quantification of cytokine gene expression. J Biomol Tech (2003) 14:33–43. doi: 10.1016/j.molbrainres
32. Barberán A, Bates ST, Casamayor EO, Fierer N. Using network analysis to explore co-occurrence patterns in soil microbial communities. ISME J (2012) 6:343–51. doi: 10.1038/ismej.2011.119
33. Cardinale M, Grube M, Erlacher A, Quehenberger J, Berg G. Bacterial networks and co-occurrence relationships in the lettuce root microbiota. Environ Microbiol (2015) 17:239–52. doi: 10.1111/1462-2920.12686
34. Shannon P, Markiel A, Ozier O, Baliga NS, Wang JT, Ramage D, et al. Cytoscape: a software environment for integratedmodels of biomolecular interaction networks. Genome Res (2003) 13:2498–504. doi: 10.1101/gr.1239303
35. Aβhauer KP, Wemheuer B, Daniel R, Meinicke P. Tax4Fun: predicting functional profiles from metagenomic 16S rRNA data. Bioinformatics (2015) 31:2882–4. doi: 10.1093/bioinformatics/btv287
36. Parks DH, Tyson GW, Hugenholtz P, Beiko RG. STAMP: statistical analysis of taxonomic and functional profiles. Bioinformatics (2014) 30:3123–4. doi: 10.1093/bioinformatics/btu494
37. Segata N, Izard J, Waldron L, Gevers D, Miropolsky L, Garrett WS, et al. Metagenomic biomarker discovery and explanation. Genome Biol (2011) 12:R60. doi: 10.1186/gb-2011-12-6-r60
38. Schulz C, Koch N, Schutte K, Pieper DH, Malfertheiner P. H. pylori and its modulation of gastrointestinal microbiota. J Dig Dis (2015) 16:109–17. doi: 10.1111/1751-2980.12233
39. Nardone G, Compare D. The human gastric microbiota: Is it time to rethink the pathogenesis of stomach diseases? United Eur Gastroenterol J (2015) 3:255–60. doi: 10.1177/2050640614566846
40. Sheh A, Fox JG. The role of the gastrointestinal microbiome in Helicobacter pylori pathogenesis. Gut Microbes (2013) 4:505–31. doi: 10.4161/gmic.26205
41. Schulz C, Schütte K, Koch N, Vilchez-Vargas R, Wos-Oxley ML, Oxley APA, et al. The active bacterial assemblages of the upper GI tract in individuals with and without Helicobacter infection. Gut (2018) 67:216–25. doi: 10.1136/gutjnl-2016-312904
42. Brawner KM, Kumar R, Serrano CA, Ptacek T, Lefkowitz E, Morrow CD, et al. Helicobacter pylori infection is associated with an altered gastric microbiota in children. Mucosal Immunol (2017) 10:1169–77. doi: 10.1038/mi.2016.131
43. Llorca L, Pérez-Pérez G, Urruzuno P, Martinez MJ, Iizumi T, Gao Z, et al. Characterization of the Gastric Microbiota in Pediatric Population According to Helicobacter pylori Status. Pediatr Infect Dis J (2017) 36:173–8. doi: 10.1097/INF.0000000000001383
44. Delgado S, Cabrera-Rubio R, Mira A, Suárez A, Mayo B. Microbiological survey of the human gastric ecosystem using culturing and pyrosequencing methods. Microb Ecol (2013) 65:763–72. doi: 10.1007/s00248-013-0192-5
45. Stearns JC, Lynch MD, Senadheera DB, Tenenbaum HC, Goldberg MB, Cvitkovitch DG, et al. Bacterial biogeography of the human digestive tract. Sci Rep (2011) 1:170. doi: 10.1038/srep00170
46. Clemente JC, Ursell LK, Parfrey LW, Knight R. The impact of the gut microbiotaon human health: an integrative view. Cell (2012) 148:1258–70. doi: 10.1016/j.cell.2012.01.035
47. Bimczok D, Grams JM, Stahl RD, Waites KB, Smythies LE, Smith PD. Stromal regulation of human gastric dendritic cells restricts theTh1 response to Helicobacter pylori. Gastroenterology (2011) 141:929–38. doi: 10.1053/j.gastro.2011.06.006
48. Bimczok D, Kao JY, Zhang M, Cochrun S, Mannon P, Peter S, et al. Human gastric epithelial cells contribute to gastric immune regulation by providing retinoic acid to dendritic cells. Mucosal Immunol (2015) 8:533–44. doi: 10.1038/mi.2014.86
49. Harris PR, Serrano CA, Villagrán A, Walker MM, Thomson M, Duarte I, et al. Helicobacter pylori-associated hypochlorhydria in children, and development of iron deficiency. J Clin Pathol (2013) 66:343–7. doi: 10.1136/jclinpath-2012-201243
50. Round JL, Mazmanian SK. Inducible Foxp3+ regulatory T-cell development by a commensal bacterium of the intestinal microbiota. Proc Natl Acad Sci USA (2010) 107:12204– 9. doi: 10.1073/pnas.0909122107
51. Round JL, Lee SM, Li J, Tran G, Jabri B, Chatila TA, et al. The Toll-like receptor 2 pathway establishes colonization by a commensal of the human microbiota. Science (2011) 332:974–7. doi: 10.1126/science.1206095
52. Atarashi K, Tanoue T, Shima T, Imaoka A, Kuwahara T, Momose Y, et al. Induction of colonic regulatory T cells by indigenous Clostridium species. Science (2011) 331:337–41. doi: 10.1126/science.1198469
53. Ivanov II, Frutos Rde L, Manel N, Yoshinaga K, Rifkin DB, Sartor RB, et al. Specific microbiota direct the differentiation of IL-17-producing T-helper cells in the mucosa of the small intestine. Cell Host Microbe (2008) 4:337–49. doi: 10.1016/j.chom.2008.09.009
54. Gaboriau-Routhiau V, Rakotobe S, Lecuyer E, Mulder I, Lan A, Bridonneau C, et al. The key role of segmented filamentous bacteria in the coordinated maturation of gut helper T cell responses. Immunity (2009) 31:677–89. doi: 10.1016/j.immuni.2009.08.020
55. Ivanov II, Atarashi K, Manel N, Brodie EL, Shima T, Karaoz U, et al. Induction of intestinal Th17 cells by segmented filamentous bacteria. Cell (2009) 139:485–98. doi: 10.1016/j.cell.2009.09.033
56. Sano T, Huang W, Hall JA, Yang Y, Chen A, Gavzy SJ, et al. An IL-23R/IL-22 circuit regulates epithelial serum amyloid A to promote local effector Th17 responses. Cell (2015) 163:381–93. doi: 10.1016/j.cell.2015.08.061
57. Bettelli E, Carrier Y, Gao W, Korn T, Strom TB, Oukka M, et al. Reciprocal developmental pathways for the generation of pathogenic effector TH17 and regulatory T cells. Nature (2006) 441:235–8. doi: 10.1038/nature04753
58. Kabir S. The role of interleukin-17 in the Helicobacter pylori induced infection and immunity. Helicobacter (2011) 16:1–8. doi: 10.1111/j.1523-5378.2010.00812.x
Keywords: Helicobacter pylori, children, gastric microbiota, 16S rRNA, RNA sequencing, immune factor
Citation: Zheng W, Miao J, Luo L, Long G, Chen B, Shu X, Gu W, Peng K, Li F, Zhao H, Botchway BOA, Fang M and Jiang M (2021) The Effects of Helicobacter pylori Infection on Microbiota Associated With Gastric Mucosa and Immune Factors in Children. Front. Immunol. 12:625586. doi: 10.3389/fimmu.2021.625586
Received: 03 November 2020; Accepted: 08 March 2021;
Published: 24 March 2021.
Edited by:
Esaki M. Shankar, Central University of Tamil Nadu, IndiaReviewed by:
Rui Manuel Ferreira, University of Porto, PortugalSamudi Chandramathi, University of Malaya, Malaysia
Copyright © 2021 Zheng, Miao, Luo, Long, Chen, Shu, Gu, Peng, Li, Zhao, Botchway, Fang and Jiang. This is an open-access article distributed under the terms of the Creative Commons Attribution License (CC BY). The use, distribution or reproduction in other forums is permitted, provided the original author(s) and the copyright owner(s) are credited and that the original publication in this journal is cited, in accordance with accepted academic practice. No use, distribution or reproduction is permitted which does not comply with these terms.
*Correspondence: Mizu Jiang, mizu@zju.edu.cn