 Shi Zhao
 Ting Jia1
 Xiaotong Zhang
 Lu Ma
Lu Ma Guoxun Chen
- 1Department of Endocrinology, Wuhan Central Hospital, Wuhan, China
- 2School of Social Sciences, Nanyang Technology University, Singapore, Singapore
- 3College of Health, Wuhan University, Wuhan, China
- 4Department of Nutrition, University of Tennessee, Knoxville, TN, United States
Endothelial progenitor cells (EPCs) with immunological properties repair microvasculature to prevent the complications in patients with diabetes. Epigenetic changes such as DNA methylation alter the functions of cells. Tet methylcytosine dioxygenases (TETs) are enzymes responsible for the demethylation of cytosine on genomic DNA in cells. We hypothesized that EPCs of diabetic patients with peripheral artery disease (D-PAD) might have altered expression levels of TETs. Subjects who were non-diabetic (ND, n = 22), with diabetes only (D, n = 29) and with D-PAD (n = 22) were recruited for the collection of EPCs, which were isolated and subjected to analysis. The mRNA and protein expression levels of TET1, TET2, and TET3 were determined using real-time PCR and immunoblot, respectively. The TET1 mRNA expression level in ND group was lower than that in the D and D-PAD groups. The TET3 mRNA level in the ND group was higher than that in the D group, which was higher than that in the D-PAD group. The TET1 protein level in the D-PAD group, but not the D group, was higher than that in the ND group. The TET2 protein level in the D-PAD group, but not the D group, was lower than that in the ND group. The TET3 protein level in the ND group was higher than that in the D group, which was higher than that in the D-PAD group, which is the lowest among the three groups. The changes of TETs protein levels were due to the alterations of their transcripts. These probably lead to epigenetic changes, which may be responsible for the reductions of EPCs numbers and functions in patients with the D-PAD. The expression pattern of TET3 mRNA and TET3 protein in EPCs may be a biomarker of angiopathy in diabetic patients.
Introduction
The data collected in the Diabetes Control and Complications Trial initiated about three decades ago have demonstrated the importance of intensive diabetes treatment for the delay and slowdown of the progression of complications in patients with type 1 diabetes (1–3). The main mediator of complication has been consistently shown to be hyperglycemia (3). Circulating endothelial progenitor cells (EPCs) derived from the bone marrow play important roles in tissue repair to prevent or attenuate the development of diabetic complications (4, 5). The EPCs derived from the circulating mononuclear cells (MNCs) also have immunological properties such as presenting antigens and activating T cells (6, 7). Patients with diabetes mellitus have dysfunctions of EPCs, which may lead to reduced repair of their vascular system (8). The changes of EPC number and their functions have been attributed to macrovascular and microvascular complications, processes that may involve epigenetic mechanisms (8). Epigenetics defines the stable gene expression profile formed during development and cell proliferation, which is marked by the methylation profile of genomic DNA (9). Specific traits of epigenetics associated with type 2 diabetes have been identified and considered as potential biomarkers for the prevention and treatment of diabetes (10).
The DNA methylation generally occurs on the 5th carbon of cytosines of the dinucleotide CpG to form 5-methylcytosine (5mC), which happens in the cycle of demethylation and de novo methylation after the replication of the genome (9). The 5mC found at the cytosine of CpG dinucleotides has been considered to play a role in gene silencing as hypermethylation is associated with down-regulation of gene expressions (11). In mammalian cells, one pathway for the demethylation of cytosine to occur is mediated by the production of 5-hydroxymethylcytosine (5hmC), and followed by the base excision repair system to put the cytosine back into the position (11).
In humans with acute myeloid leukemia (AML), the MLL gene on 11q23 is fused to the LCX leukemia-associated protein with a CXXC domain gene on 10q22, which was cloned as Ten-eleven translocation methylcytosine dioxygenase 1 (TET1) (12). Later, through a computational search, it was found that TET1 was able to mediate the conversion of 5mC to 5hmC in an iron and α-ketoglutarate (2-oxoglutarate) dependent manner (13). The TET protein activity is also involved in the conversion of 5mC to 5-formylcytosine and 5-carboxylcytosine, two additional cytosine derivatives in genomic DNA (14). It has been thought that TET1 binds to CpG area to block the association of DNA methylation and convert 5mC to 5hmC during the embryonic stem cells differentiation and development (15). The 5hmC as an epigenetic modification reflects the pluripotent state of embryonic stem cells, and TET1 acts to determine their differentiation potential (16). So far, a family of three members (TET1, TET2, and TETE3) have been identified (16). Overexpression of TET2 in 293 cells leads to the increases of 5hmC level and DNA demethylation (17). Simultaneous deletion of both Tet1 and Tet3 results in a global loss of 5hmC and gain of 5mC in mouse embryos, indicating the roles of TET1 and TET3 in the formation of 5hmC (18). In addition, the deletion of Tet1, Tet2, and Tet3 gene concurrently leads to the stop of stem cell reprograming (19).
It has been shown that both mRNA and protein levels of TET1, but not TET2 and TET3, are higher in the inferior parietal lobule of the psychotic patients than the control subjects (20). An elevation of 5hmC level has been observed at the promoter of glutamic acid decarboxylase 67 gene in the psychotic patients, a phenomenon that is associated with the reduction of the gene expression (20). In humans, the TET2 expression level in skin wound tissue of diabetic patients is significantly higher than that in the wound of non-diabetic patients (21). This is associated with the elevation of α-ketoglutarate levels of the wound tissue, but not plasma and urine, in diabetic patients compared with those in the non-diabetic subjects (21). It has been thought that TET3 interacts with O-linked β-GlcNAc transferase to be exported out from the nuclei, which probably reduces its activity on chromatin (22). O-linked β-GlcNAc transferase has been thought to cause insulin resistance through the action on phosphoinositide production and modification of insulin receptor substrate in differentiated 3T3-L1 adipocytes (23). All these suggest that the 5hmC level could be altered in DNA of diabetic patients, and the expression levels of TET proteins may be associated these epigenetic changes.
Previously, we have shown that the amount of EPCs in patients with type 2 diabetes is negatively associated with the plasma HbA1c level (24). The functions of EPCs in type 2 diabetic patients with peripheral angiopathy are reduced (24). Others have observed the loss of 5mc in lens of patients with diabetic cataract, suggesting the involvement of TET proteins (25). This has been attributed to human lens epithelial damage through endoplasmic reticulum stress (25). The epigenome-wide analysis of a group of genes related to insulin resistance in visceral adipose tissue of morbidly obese insulin resistant and sensitive subjects have been compared to determine the methylation statuses (26). The promoter region of ZNF714 (Zinc Finger Protein 714) gene has been found to have lower methylation, which is associated with an increase of its transcription (26).
Here, we compared the mRNA and protein levels of TET1, TET2, and TET3 in non-diabetic (ND) control subjects, patients with only type 2 diabetes only (D), and patients with diabetes peripheral artery disease (D-PAD). Results shown here indicated alterations of their mRNA and protein levels in EPCs of D-PAD subjects.
Materials and Methods
Reagents
Pure ethanol and isopropanol were obtained from Sinopharm (Beijing, China). Trizol, ultrapure Agarose, Superscript III RT kit, and SYBR quantitative real-time PCR (qPCR) mix were purchased from Invitrogen (ABI-Invitrogen/ThermoFisher, Carlsbad, CA). Anti-β-Actin (ab8227), anti-TET1 (ab 105475), anti-TET2 (ab94580), and anti-TET3 (ab139311) antibodies were obtained from Abcam (Cambridge, MA, USA). All other molecular biology and immunoblot reagents were obtained from MDL biotech Application Co (Beijing, China) unless described otherwise.
Study Subjects
Patients of D (n = 29, 15 males and 14 females) and D-PAD (n = 22, 8 males and 14 females) groups were recruited during their visits in the clinic of the Endocrinology Department at the Central Hospital of Wuhan. ND subjects (n = 22, 9 males and 13 females) were recruited from the general population. Type 2 diabetes was determined using blood glucose cut-off values as defined by World Health Organization. PAD of the lower extremities was diagnosed on the basis of a history of claudication or rest pain, bilateral pulses examination and duplex ultrasound. Patients were graded according to the Leriche/Fontaine clinical classification of chronic lower extremity ischemia (27). Exclusion criteria for all subjects were any of the following clinical conditions: advanced microvascular diseases (diabetic retinopathy and nephropathy), auto-immune diseases, neoplasm, acute or chronic infections, recent (< 6 months) surgery or vascular intervention, age >80 years, recent (< 6 months) myocardial infarction, hemodialysis and use of immunosuppressive medication. All subjects were screened for cardiovascular risk factors to establish confounding effects, including: smoking, hypertension, BMI and dyslipidemia, and were measured ankle-brachial index (ABI). Plasma levels of glucose, glycated hemoglobin (HbA1c), triacylglycerol (TAG), and low density lipoprotein (LDL) in subjects after an over-night fasting were measured by standard clinical metabolic tests. Blood samples were collected during June 2016 to October 2016. The patients and control subjects were briefed about this study. All participants had signed the informed consent form before the study enrollment. The study protocol, #[2013]IEC(S031), was approved by the Institutional Review Board (IRB) in the Wuhan Central Hospital.
EPCs Isolation and Characterization
Figure 1 shows the procedure of sample collection and process. About 30 ml of peripheral blood samples were collected from ND, D, and D-PAD subjects by venipuncture and into EDTA vacutainers. The circulating MNCs were first isolated using Ficoll (catalog number: TBD2011H, Hao Yang Biological Manufacture Co. LTD, Tianjin, China) density-gradient centrifugation from human peripheral blood buffy coats as shown in Rehman et al. (28). Immediately after isolation, 1 × 10⁶ MNCs/ml of medium was plated on culture dishes coated with human fibronectin and maintained in endothelial basal medium (catalog number: CC-3156, Lonza, Basel, Switzerland) supplemented with EGM SingleQuots (catalog number: CC-417, Lonza) and 20% FCS (Catalog number: 16000-044, Gibco/Thermo Fisher Scientific). After being cultured for 3 days, non-adherent cells were removed by thorough washing with PBS. To confirm the EPC phenotype, adherent cells were incubated with 2.4 g/ml DiI-conjugated acetylated low-density lipoproteins (Dil-Ac-LDL, Invitrogen) at 37°C for 1 h and fixed with 4% paraformaldehyde for 10 min. After fixation, cells were incubated with FITC-labeled Ulex europaeus agglutinin I (catalog number: AL-1063, Vector, Olean, NY) for 1 h. Labeled cells were visualized with an inverted fluorescent microscope, and the adhered EPCs were determined by positive staining of both FITC–ulex-lectin and DiI-acLDL. Cell nuclei were stained with DAPI. The fluorescent results indicated that more than 95% of adherent cells were acLDL(+)ulex-lectin(+), demonstrating the high purity of EPCs used in the studies.
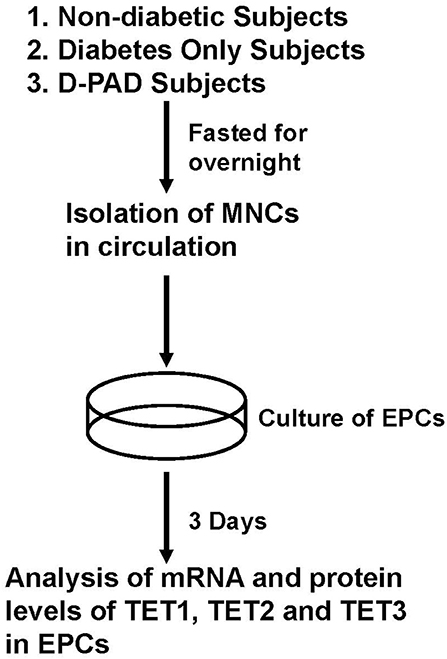
Figure 1. Procedures of isolation, preparation and analysis of EPCs from subjects in ND, D, and D-PAD groups. The recruited subjects were fasted overnight before their peripheral blood samples were collected for the collection of circulating mononuclear cells (MNCs). MNCs were cultured for 3 days as described in the Materials and Methods section. Total cell RNA and proteins were extracted and subjected to analysis of real-time PCR and immunoblot, respectively. ND, non-diabetic; D, Diabetes only; D-PAD, diabetes peripheral artery disease.
RNA Isolation
For RNA isolation, each cell sample was dissolved in 1 ml Trizol reagent. After that, 0.5 ml of chloroform was added to the mixture, which was vortexed and then, placed on ice for 5 min for settlement. The mixture was centrifuged at 12,000 × g and 4°C for 15 min. The RNA containing upper aqueous phase was carefully removed and mixed with 0.5 ml of isopropanol at room temperature for 10 min. For RNA precipitation, the mixture was centrifuged at 12,000 × g and 4°C for 10 min. The RNA pellet was washed once with 1 ml 75% Ethanol and centrifuged at 7,500 × g and 4°C for 5 min to precipitate it. The pellet was air-dried and dissolved in 50 μl DEPC-treated H2O until further process.
cDNA Synthesis
For the cDNA synthesis, the following components were included in a 20-μl reaction, 200 ng RNA in 10 μl, 1 μl of 50 μM oligo-dT, 1 μl of 50 μM random hexamer, 1 ul 10μM dNTP mix, 4 μl 5X first-strand buffer (250 mM Tris-HCl, pH 8.3, 375 mM KCl, 15 mM MgCl2), 2 μl 100 mM DTT, and 1 μl Superscript III reverse transcriptase (200 U). The RNA, oligo-dT and random hexamer were mixed first, incubated at 65°C for 5 min, and immediately put on ice. After that, 5 × first-strand buffer, DTT and reverse transcriptase were added, mixed well by pipetting gently up and down, and then, the mixture was incubated at 42°C for 60 min. This reverse transcription reaction was then incubated at 85°C for 10 min to inactivate the reverse transcriptase. The synthesized cDNA was stored at −20°C before being used for qPCR analysis.
Quantitative qPCR Analysis
Each SYBR green based qPCR reaction contains, in a final volume of 20 μl, 2 μl of cDNA from 20 ng of reverse transcribed total RNA, 2 μl mixture of the forward and reverse primers at 5 μM total concentration, 10 μl of 2 × SYBR Green PCR Master Mix (Applied Biosystems) and 6 μl H2O. The sequences of primers used for the detection of the indicated genes are shown in Table 1. Triplicate PCR reactions were carried out using 7900 Real-Time PCR System (Applied Biosystems). The reaction conditions were 95°C for 2 min, followed by 40 cycles of 94°C for 20 s (s), 65°C for 20 s and 65°C for 30 s. The gene expression level was normalized to that of invariable control gene, β-actin. Data were presented as the minus cycle threshold (ΔCT, the Ct of gene of interest minus the Ct of β-actin) (29, 30).
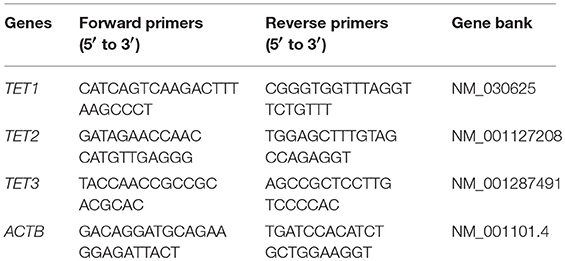
Table 1. Sequences of primers (5′ to 3′) used in the real-time PCR for the detection of TET1, TET2, TET3 and the control gene ACTB (β-actin gene).
Western Blot Analysis
To lyse the cells, 0.1 ml of RIPA buffer was used to suspend every 1 × 10⁶ EPCs, and the mixture was kept on ice for 20 min. The lysates were centrifuged at 12,000 × g and 4°C for 10 min. The supernatant containing EPC total cellular proteins was stored at −80°C until being used. Total cellular proteins (50 μg) of the EPCs were separated in 10% sodium dodecyl sulfate polyacrylamide gel at 8 v/cm. The proteins in the gels were transferred to PVDF membrane (Millipore, Norcross, GA, USA). The PVDF membranes were incubated in TBST containing 5% non-fat milk for 1 h at room temperature, and then incubated in 5% dry-milk TBST containing 1 μg/ml of anti-TET1, anti-TET2, or anti-TET3 antibody at 4°C for overnight. After that, membranes were washed three times in TBST for 5 min each, and then, incubated in TBST containing 8% non-fat milk with goat anti-rabbit IgG conjugated with horseradish peroxidase (1/5,000 dilution) for 1 h at room temperature. After that, membranes were washed three times in TBST for 5 min each, and then, the bound-secondary antibody was detected using chemiluminescence (ECL Western Blotting Substrate, Thermo Scientific) through exposure to X-ray films (Phenix Research Products, Candler, NC). The films were scanned at 300 dpi using a HP ScanJet 2200 Scanner. The densities of the corresponding protein bands were normalized to that of the β-actin of the same sample using ImageJ software (National Institute of Health, MD).
Statistical Analysis
Data of both male and females were analyzed together. Multiple linear regression analyses was conducted to determine the differences among three groups and between two groups (D and D-PAD groups) on the expression of mRNA and protein levels of TET1, TET2, and TET3 genes after being adjusted for sex, BMI, ABI, HbA1c, TAG, and LDL. One-way ANOVA with LSD post-hoc statistical analysis was performed when more than two groups were compared. All statistical analyses were performed using SPSS statistical software (IBM, version 17). Data were presented as means ± S.E.M. A p < 0.05 was considered statistically significant.
Results
Measurements of Anthropometric and Plasma Parameters of Subjects in ND, D, and D-PAD Groups
Table 2 shows the baseline anthropometric and plasma parameter data of subjects in ND, D, and D-PAD groups. The data of male and female subjects were analyzed together. The conclusions did not differ when they were analyzed separately. Patients in D-PAD group had similar age, BMI, and levels of HbA1c, TG, LDL, and glucose as those in D group. The subjects in ND group had lower plasma levels of HbA1c and glucose, and were younger than those in D-PAD and D groups. Patients in D-PAD group had higher ABI value than subjects in the ND group.
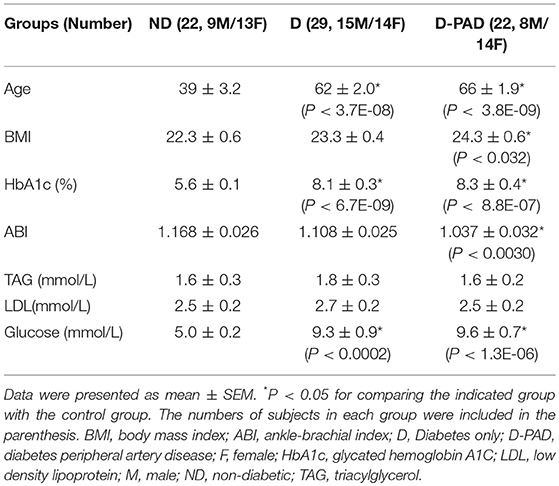
Table 2. Baseline anthropometric and plasma parameters of subjects in D-PAD, D, or ND groups collected after fasting for overnight.
Comparison of Expression Levels of TET1, TET2, and TET3 mRNA in EPCs of Subjects in ND, D, and D-PAD Groups
Figure 2 shows the relative mRNA levels of TET1 (A), TET2 (B), and TET3 (C) genes presented as –ΔCt (Ct of β-actin—Ct of the indicated gene) in the forms of column and scatter plot. As shown in Figure 2A, the relative TET1 mRNA expression level in EPCs of the subjects in ND group was lower than those in D and D-PAD groups (a > b). The relative TET1 mRNA levels of those subjects in the D and D-PAD groups were not different from each other. As shown in Figure 2B, there was a reduction trend of relative TET2 mRNA expression level in EPCs of the D-PAD group in comparison with that of the ND group. However, it did not reach statistical significance. Therefore, the TET2 mRNA levels in EPCs of subjects of in three groups were not different from each other.
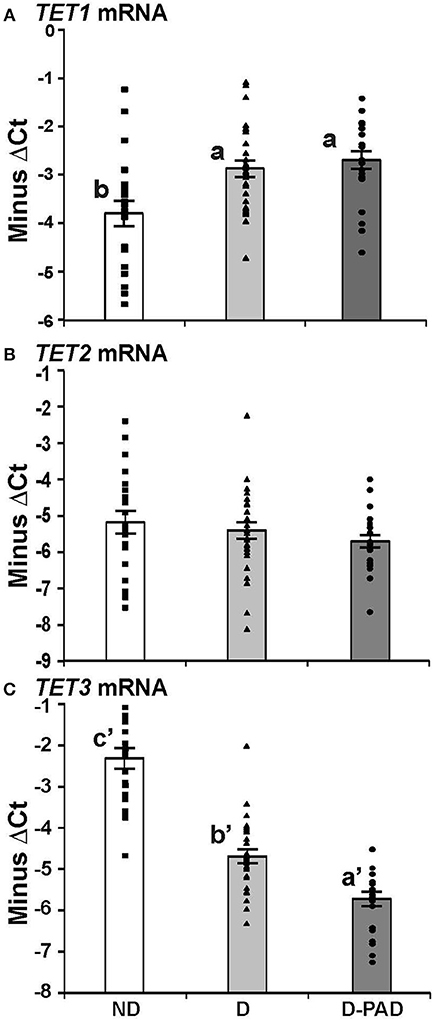
Figure 2. Comparison of the relative expression levels of TET1 (A), TET2 (B), and TET3 (C) mRNA in EPCs of subjects in ND, D and D-PAD groups. EPCs were isolated from subjects in ND (n = 22), D (n = 28), and D-PAD (n = 22) groups and cultured as described in the Material and Methods section. Total RNA of EPCs was isolated and subjected to real-time PCR analysis. The results were presented as mean ± SEM of the –ΔCT (the CT of β-actin—the CT of indicated transcript). The distribution ranges of the –ΔCT values of their genes were shown with the columns in the graph. The data were analyzed with one way ANOVA (a > b, P < 0.0012 for comparing ND and D-PAD groups, and P < 0.0034 for comparing ND and D groups; and a′ < b′ < c′, P < 7.1E-11 for comparing ND and D groups, and P < 7.2E-05 for comparing D and D-PAD groups). ND, non-diabetic; D, Diabetes only; D-PAD, diabetes peripheral artery disease.
On the other hand, the relative TET3 mRNA levels in EPCs of subjects in ND group were higher than that of the D group as shown in Figure 2C. More importantly, the relative TET3 mRNA levels in EPCs of subjects in the D group were higher than that in the D-PAD group. The relative TET3 mRNA level in D-PAD group was the lowest among the three groups (a′ < b′ < c′).
Comparison of Relative TET1, TET2, and TET3 mRNA Levels in Three Groups (ND, D, and D-PAD Group) via Multiple Linear Regression Analysis Adjusted for Anthropometric and Plasma Parameters
The results of multiple linear regression analysis were shown in Table 3. The differences of the relative expression of TET1 mRNA, and TET3 mRNA between the ND group and the D or D-PAD groups were statistically significant. Compared with that in the ND group, the average relative TET1 mRNA values of D and D-PAD groups increased by 1.212 and 1.407, respectively, after being adjusted for sex, BMI, ABI, HbA1c, TAG, and LDL. Compared with that in the ND group, the average relative TET3 mRNA values in the D and D-PAD groups decreased by 2.161 and 3.158, respectively, after being adjusted for sex, BMI, ABI, HbA1c, TAG, and LDL.
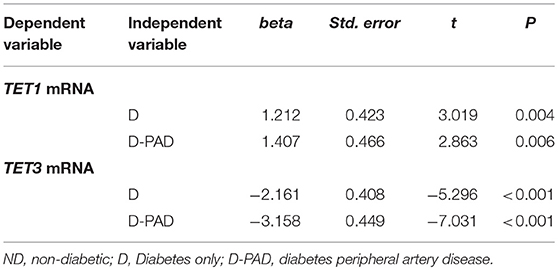
Table 3. Multiple linear regression analysis to compare the TET1 and TET3 mRNA levels in ND group with that in D and D-PAD groups.
Comparison of Levels of TET1, TET2, and TET3 Proteins in EPCs of Subjects in ND-D and D-PAD Groups
To determine whether the changes of TET mRNA transcripts correspond to the alterations of their protein amounts, the expression levels of TET1, TET2, and TET3 proteins in these three groups were determined using immunoblot, normalized to that of the house-keeping gene, β-actin, and presented as the ratio of the density of indicated protein to that of β-actin as shown in Figure 3. Figure 3A shows the relative expression levels of TET1 protein in EPCs of the three groups. The relative TET1 protein level in EPCs of the subjects in the D-PAD group, but not that of the D group, was higher than that in the ND group (a > b). This result matched partially with the mRNA data (Figure 2A).
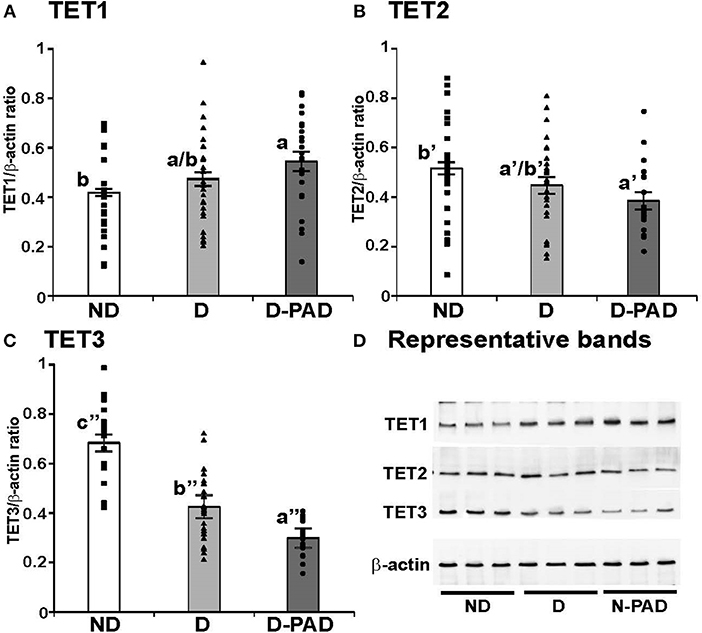
Figure 3. Comparison of the relative expression levels of TET1 (A), TET2 (B), and TET3 (C) protein, and representative immunoblot results of these three proteins (D) in EPCs of subjects in ND, D and D-PAD groups. EPCs were isolated from subjects in ND (n = 22), D (n = 28), and D-PAD (n = 22) groups and cultured as described in the Material and Methods section. Total cellular proteins of EPCs were isolated and subjected to immunoblot using the specific antibodies to β-actin (the invariable loading control), TET1, TET2, and TET3. The distribution ranges of the ratios of the densities of the indicated protein to β-actin were shown with the columns in the graph. The results were presented as mean ± SEM of the ratios of the indicated protein to β-actin. (D) shows the representative immunoblot images of TET1, TET2, TET3, and the house-keeping protein β-actin using three protein samples each in ND, D, and D-PAD groups. The data were analyzed with one way ANOVA (a > b, P < 0.03 for comparing ND and D-PAD groups; a′ < b′, P < 0.02 for comparing ND and D-PAD groups; a″ < b″ < c″, P < 1.12E-07 for comparing ND and D groups, and P < 0.0002 for comparing D and D-PAD groups). ND, non-diabetic; D, Diabetes only; D-PAD, diabetes peripheral artery disease.
Interestingly, the relative TET2 protein level in EPCs of the patients in the D-PAD group, but not that of the D group, was lower than that of the ND group as shown in Figure 3B (a′ < b′). This result matched the reduction trend of the TET2 mRNA shown in Figure 2B.
Figure 3C shows that the relative expression level of TET3 protein in EPCs of the subjects in ND group was higher than that of the patients in the D group, which was even higher than that of the patients in the D-PAD group (a″ < b″ < c″). TET3 protein level in the D-PAD group was the lowest in the three groups.
Figure 3D shows the representative immunoblot images of TET1, TET2, TET3, and the house-keeping protein β-actin using three EPC protein samples each in ND, D, and D-PAD groups. The results supported the data shown in Figures 3A–C.
Comparison of TET1, TET2, and TET3 Protein Levels in Three Groups (ND, D, and D-PAD) via Multiple Linear Regression Analysis Adjusted for Anthropometric and Plasma Parameters
Table 4 showed the results of the multiple linear regression to compare the relative expression levels of TET proteins in the ND groups with that in the D and D-PAD groups. The differences of the relative expression levels of TET1, TET2, and TET3 proteins in the three groups were statistically significant. Compared with that of the subjects in the ND group, the average relative value of TET1 protein in the D-PAD group increased by 0.23 after being adjusted for sex, BMI, ABI, HbA1c, TAG, and LDL. Compared with that of the subjects in the ND group, the average relative value of the TET2 protein level in the D-PAD group decreased by 0.196 after being adjusted for sex, BMI, ABI, HbA1c, TAG, and LDL. Compared with that of the subjects in the ND group, the average relative values of TET3 protein levels in the D and D-PAD groups decreased by 0.261 and 0.37, respectively, after being adjusted for sex, BMI, ABI, HbA1c, TAG, and LDL.
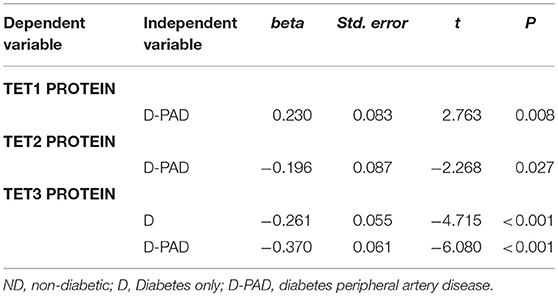
Table 4. Multiple linear regression analysis to compare the TET1, TET2, and TET3 protein levels in ND group with that in D and D-PAD groups.
Comparison of TET mRNA and TET Protein Levels in the D and D-PAD Groups Via Multiple Linear Regression Analysis After Adjusted for Anthropometric and Plasma Parameters
Table 5 shows the results of multiple linear regression analysis to compare relative TET mRNA and protein levels in the D with that in the D-PAD groups. The differences of relative TET3 mRNA and protein levels between D and D-PAD groups were statistically significant. Compared with the values in the D group, the average relative values of TET3 mRNA and TET protein expression levels in the D-PAD group decreased by 1.137 and 0.125, respectively, after being adjusted for sex, BMI, ABI, HbA1c, TAG, and LDL. Compared with that in the D group, the average relative value of the TET3 mRNA level in the D-PAD group decreased by 1.939 for each unit increase of ABI after adjusted for sex, BMI, HbA1c, TAG, and LDL.
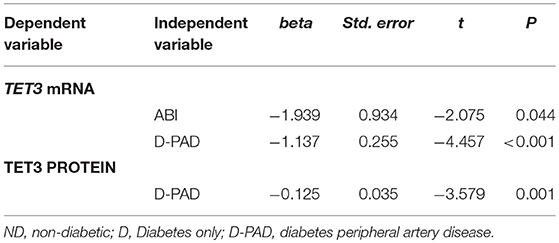
Table 5. Multiple linear regression analysis to compare the TET3 mRNA and TET3 protein levels in D group with that in D-PAD group.
Discussion
Here, the expression levels of TET1, TET2, and TET3 mRNA and their proteins in EPCs of ND, D and D-PAD subjects were compared. Our results demonstrated that TET1 and TET3 mRNA and proteins in EPCs of these three groups were expressed differently. It indicates that the epigenetic changes might have occurred during the development and progression of type 2 diabetes, which may be responsible for the reductions of EPCs number and their functions in patients of D-PAD groups.
The expression patterns of TET1, TET2, and TET3 proteins in EPCs of the three groups appeared to match well with that of their mRNA in the same groups. This indicates that the changes of TETs protein levels were mainly due to the alterations of their mRNA expression. The TET1 and TET2 mRNA and their proteins levels in EPCs of the D and D-PAD groups were not significantly different from each other, indicating that their limited association with the development of PAD. On the other hand, the TET3 mRNA and TET3 protein levels in EPCs of D-PAD patients were lower than that of the D group, which was lower than that of the control group, the group with the highest TET3 mRNA and protein levels. This result indicates that the expression levels of TET3 mRNA and TET3 protein in EPCs decrease along with the progression of the diabetes mellitus. The correlation of the decrease of TET3 mRNA expression and the increase of ABI values further supports this conclusion. The association of TET3 expression with the PAD development suggests the possibility of using this phenomenon as a biomarker for the D-DAP diagnosis.
The TET1 mRNA levels in the D and D-PAD groups and its protein level in the D-PAD were higher than that in the ND group. The elevated TET1 protein level suggests that an increase of amount of DNA 5hmC in EPCs of the D-PAD group. This assumption is supported by a recent report showing that global DNA 5hmC level in the peripheral blood of uncontrolled diabetic patients is higher than that of well-controlled patients and healthy individuals, which correlates with the plasma level of HbA1c (31). If the uncontrolled diabetic patients are in the same category as our D and D-PAD group, the results of our study and their observation seem to support each other well. It suggests that the alteration of TET1 mRNA and TET1 protein expression levels can be a biomarker for the development of type 2 diabetes.
However, in the same report, the TET1 mRNA level in the peripheral blood of uncontrolled diabetic patients is higher than that of control subjects, which is higher than that of the well-control diabetic subjects (31). This does not support any association of diabetes or the DNA 5hmC amount with the expression level of TET1 mRNA. In addition, the DNA 5mC level in the uncontrolled diabetic patients is also higher than that in the well-controlled diabetic and control subjects (31). This phenomenon seems to indicate that the increase of TET1 mRNA expression can only be used to explain part of the picture, which led the authors to suggest that additional mechanisms such as DNA oxidation may contribute to the changes of DNA 5mC and 5hmC (31). The oxidative state may be related to the production of 5hmC levels as vitamin C has been shown to stimulate the formation of 5hmC in cultured mouse embryonic fibroblasts, probably through reducing the inactive Fe3+ to the active Fe2+ for the activity of TETs (32–34). Unfortunately, the cited study only measured TET1 mRNA expression level, but not that of TET2 and TET3 in the peripheral blood (31). As shown in our study, the protein levels of TET3 in EPCs of the D and D-PAD groups were lower than that of the ND group. The reduction of TET3 protein expression level may increase the amounts of 5mC in those genomic places relying on TET3 for the production of 5hmC. Whether the DNA oxidation or change of relative proportions of TET1 and TET3 contributes to the alteration of global DNA methylation status remains to be determined in future work.
The existence of 5mC and 5hmC allows variations of DNA structure, which leads to more variables than cytosine alone (35). The alterations of TETs expression levels in the EPCs of the D-PAD group imply the contribution of epigenetic to the reduction of EPC number and cellular functions along with the development of diabetes and complications. The remaining questions are how these changes of TET expression levels lead to alterations of cellular functions; what the regulatory mechanisms of these TETs expression are in response to the development of disease stages; what the physiological consequences of the induction of TET1 and reduction of TET3 are. In addition, whether the increase of 5hmC globally in the whole genome or locally in particular genes remains to be further investigated. The variation of 5mC and 5hmC amounts in a gene's promoter locally may be critical for its regulation. Recently, it has been shown that TET2 can be phosphorylated by AMP activated protein kinase, a process that is impeded in the presence of high glucose through the reduction of TET2 protein stability (36). This shows the importance of post-translational modification in the regulation of activities of TET proteins. Obviously, more studies are needed to explore the potential uses of these findings for the prevention and treatment of diabetes and its complications. This will be helpful for those patients with diabetes.
Our findings here have shown a potential epigenetic mechanism for the development of complications in patients with diabetes. One limitation here is that the age of subjects in the ND group is younger than that of the patients in D and D-PAD groups. However, this does not affect the conclusion drawn from the TET3 mRNA and proteins as its levels in EPCs of D-PAD patients are lower than that of D group, which patients in both groups have no difference in age. Another limitation is that data of male and female subjects were analyzed together. This was due to limited number of subjects in both sex. Nevertheless, additional studies using age controlled subjects and more subject numbers in both sex are warranted in the future.
As far as we know, our data, for the first time, demonstrated an association of the expression levels of TETs in EPCs with the development of PAD. It is urgent to determine whether the changes of TET3 expression is the consequence of PAD development or the cause of it. In addition, the epigenetic changes in cells of diabetic patients seemed to be present in other cells as shown in the introduction section. This appears to indicate that some general factors presenting in diabetic patients contribute to the epigenetic changes. These factors may cause the increase of TET1 and decrease of TET3 expression levels, which become possible intervention points for the prevention and treatment of diabetes and its complications. It will be interesting to find out whether the changes of TET1 and TET3 expression levels in the EPCs will be reversed in diabetic patients treated with bariatric surgery or delayed in those treated with drugs for the control of blood glucose. When specific tools such as specific inhibitors or activators of TETs are developed and available, they may be tested to prevent or intervene the onset or progress of complications associated with diabetes.
Author Contributions
SZ and GC designed the projects and experiments. TJ and HM collected the samples, preparations, and performed the experiments. YT, XZ, XT, and LM analyzed the data. SZ, RL, and GC organized the results and wrote the paper. All authors reviewed and approved this manuscript.
Conflict of Interest Statement
The authors declare that the research was conducted in the absence of any commercial or financial relationships that could be construed as a potential conflict of interest.
Acknowledgments
The authors thank the National Natural Science Foundation of China for financial support (No. 81370942 to SZ).
References
1. The Diabetes Control and Complications Trial Research Group. The effect of intensive treatment of diabetes on the development and progression of long-term complications in insulin-dependent diabetes mellitus. N Engl J Med. (1993) 329:977–86. doi: 10.1056/NEJM199309303291401
2. The Diabetes Control and Complications Trial/Epidemiology of Diabetes Interventions and Complications (DCCT/EDIC) Study Research Group. The Diabetes Control and Complications Trial/Epidemiology of Diabetes Interventions and Complications (DCCT/EDIC) Study Research Group. Intensive diabetes treatment and cardiovascular disease in patients with type 1 diabetes. N Engl J Med. (2005) 353:2643–53. doi: 10.1056/NEJMoa052187
3. Zinman B, Genuth S, Nathan DM. The diabetes control and complications trial/epidemiology of diabetes interventions and complications study: 30th anniversary presentations. Diabetes Care (2014) 37:8. doi: 10.2337/dc13-2111
4. Fadini GP. A reappraisal of the role of circulating (progenitor) cells in the pathobiology of diabetic complications. Diabetologia (2014) 57:4–15. doi: 10.1007/s00125-013-3087-6
5. Fadini GP, Avogaro A. It is all in the blood: The multifaceted contribution of circulating progenitor cells in diabetic complications. Exp Diabetes Res. (2012) 2012:742976. doi: 10.1155/2012/742976
6. Choi J, Enis DR, Koh KP, Shiao SL, Pober JS. T Lymphocyte?Endothelial Cell Interactions. Annu Rev Immunol. (2004) 22:683–709. doi: 10.1146/annurev.immunol.22.012703.104639
7. Raemer PC, Haemmerling S, Giese T, Canaday DH, Katus HA, Dengler TJ, et al. Endothelial progenitor cells possess monocyte-like antigen-presenting and T-cell-co-stimulatory capacity. Transplantation (2009) 87:340–9. doi: 10.1097/TP.0b013e3181957308
8. Berezin AE. Endothelial progenitor cells dysfunction and impaired tissue reparation: The missed link in diabetes mellitus development. Diabetes Metabo Syndrome Clin Res Rev. (2017) 11:215–20. doi: 10.1016/j.dsx.2016.08.007
9. Jaenisch R, Bird A. Epigenetic regulation of gene expression: how the genome integrates intrinsic and environmental signals. Nat Genet. (2003) 33:245. doi: 10.1038/ng1089
10. Gillberg L, Ling C. The potential use of DNA methylation biomarkers to identify risk and progression of Type 2 diabetes. Front Endocrinol. (2015) 6:43. doi: 10.3389/fendo.2015.00043
11. Ooi SKT, Bestor TH. The colorful history of active DNA demethylation. Cell (2008) 133:1145–8. doi: 10.1016/j.cell.2008.06.009
12. Ono R, Taki T, Taketani T, Taniwaki M, Kobayashi H, Hayashi Y. LCX, leukemia-associated protein with a CXXC Domain, is fused to MLL; in acute myeloid leukemia with trilineage dysplasia having t(10;11)(q22;q23). Cancer Res. (2002) 62:4075–80.
13. Tahiliani M, Koh KP, Shen Y, Pastor WA, Bandukwala H, Brudno Y, et al. Conversion of 5-Methylcytosine to 5-Hydroxymethylcytosine in Mammalian DNA by MLL Partner TET1. Science (2009) 324:930. doi: 10.1126/science.1170116
14. Ito S, Shen L, Dai Q, Wu SC, Collins LB, Swenberg JA, et al. Tet proteins can convert 5-methylcytosine to 5-formylcytosine and 5-carboxylcytosine. Science (2011) 333:1300. doi: 10.1126/science.1210597
15. Xu Y, Wu F, Tan L, Kong L, Xiong L, Deng J, et al. Genome-wide regulation of 5hmC, 5mC, and gene expression by Tet1 hydroxylase in mouse embryonic stem cells. Mol Cell (2011) 42:451–64. doi: 10.1016/j.molcel.2011.04.005
16. Koh KP, Yabuuchi A, Rao S, Huang Y, Cunniff K, Nardone J, et al. Tet1 and Tet2 regulate 5-hydroxymethylcytosine production and cell lineage specification in mouse embryonic stem cells. Cell Stem Cell (2011) 8:200–13. doi: 10.1016/j.stem.2011.01.008
17. Kong L, Tan L, Lv R, Shi Z, Xiong L, Wu F, et al. A primary role of TET proteins in establishment and maintenance of De Novo bivalency at CpG islands. Nucleic Acids Res. (2016) 44:8682–92. doi: 10.1093/nar/gkw529
18. Kang J, Lienhard M, Pastor WA, Chawla A, Novotny M, Tsagaratou A, et al. Simultaneous deletion of the methylcytosine oxidases Tet1 and Tet3 increases transcriptome variability in early embryogenesis. Proc Natl Acad Sci USA. (2015) 112:E4236–45. doi: 10.1073/pnas.1510510112
19. Hu X, Zhang L, Mao SQ, Li Z, Chen J, Zhang RR, et al. Tet and TDG mediate DNA demethylation essential for mesenchymal-to-epithelial transition in somatic cell reprogramming. Cell Stem Cell (2014) 14:512–22. doi: 10.1016/j.stem.2014.01.001
20. Dong E, Gavin DP, Chen Y, Davis J. Upregulation of TET1 and downregulation of APOBEC3A and APOBEC3C in the parietal cortex of psychotic patients. Transl Psychiatr. (2012) 2:e159. doi: 10.1038/tp.2012.86
21. Tan Q, Wang W, Yang C, Zhang J, Sun K, Luo HC, et al. α-ketoglutarate is associated with delayed wound healing in diabetes. Clin Endocrinol. (2016) 85:54–61. doi: 10.1111/cen.13047
22. Zhang Q, Liu X, Gao W, Li P, Hou J, Li J, et al. Differential regulation of the Ten-Eleven Translocation (TET) family of dioxygenases by O-Linked β-N-Acetylglucosamine Transferase (OGT). J Biol Chem. (2014) 289:5986–96. doi: 10.1074/jbc.M113.524140
23. Yang X, Ongusaha PP, Miles PD, Havstad JC, Zhang F, So WV, et al. Phosphoinositide signalling links O-GlcNAc transferase to insulin resistance. Nature (2008) 451:964. doi: 10.1038/nature06668
24. Zhao S, Wang H, Li B, Mao H, Shao S. Changes of proportion and function of endothelial progenitor cells in type 2 diabetes mellitus with peripheral angiopathy and their possible mechanisms. Chin J Diabetes (2007) 15:42–3. doi: 10.3321/j.issn:1006-6187.2007.01.017
25. Palsamy P, Bidasee KR, Ayaki M, Augusteyn RC, Chan JY, Shinohara T. Methylglyoxal induces endoplasmic reticulum stress and DNA demethylation in the Keap1 promoter of human lens epithelial cells and age-related cataracts. Free Radical Biol Med. (2014) 72:134–48. doi: 10.1016/j.freeradbiomed.2014.04.010
26. Crujeiras AB, Diaz-Lagares A, Moreno-Navarrete JM, Sandoval J, Hervas D, Gomez A, et al. Genome-wide DNA methylation pattern in visceral adipose tissue differentiates insulin-resistant from insulin-sensitive obese subjects. Transl Res. (2016) 178:13–24. doi: 10.1016/j.trsl.2016.07.002
27. Pentecost MJ, Criqui MH, Dorros G, Goldstone J, Johnston KW, Martin EC, et al. Guidelines for peripheral percutaneous transluminal angioplasty of the abdominal aorta and lower extremity vessels. J Vasc Interv Radiol. (2003) 14:S495–515. doi: 10.1016/S1051-0443(07)61267-6
28. Rehman J, Li J, Orschell CM, March KL. Peripheral blood “Endothelial Progenitor Cells” are derived from monocyte/macrophages and secrete angiogenic growth factors. Circulation (2003) 107:1164. doi: 10.1161/01.CIR.0000058702.69484.A0
29. Li Y, Liu Y, Chen G. Vitamin A status affects the plasma parameters and regulation of hepatic genes in streptozotocin-induced diabetic rats. Biochimie (2017) 137:1–11. doi: 10.1016/j.biochi.2017.02.012
30. Zhang Y, Li R, Li Y, Chen W, Zhao S, Chen G. Vitamin A status affects obesity development and hepatic expression of key genes for fuel metabolism in Zucker fatty rats. Biochem Cell Biol. (2012) 90:548–57. doi: 10.1139/o2012-012
31. Pinzón-Corts JA, Perna-Chaux A, Rojas-Villamizar NS, Díaz-Basabe A, Polanía-Villanueva DC, Jácome MF, et al. Effect of diabetes status and hyperglycemia on global DNA methylation and hydroxymethylation. Endocr Connect. (2017) 6:708–25. doi: 10.1530/EC-17-0199
32. Blaschke K, Ebata KT, Karimi MM, Zepeda-Martínez JA, Goyal P, Mahapatra S, et al. Vitamin C induces Tet-dependent DNA demethylation and a blastocyst-like state in ES cells. Nature (2013) 500:222–6. doi: 10.1038/nature12362
33. Dickson KM, Gustafson CB, Young JI, Züchner S, Wang G. Ascorbate-induced generation of 5-hydroxymethylcytosine is unaffected by varying levels of iron and 2-oxoglutarate. Biochem Biophys Res Commun. (2013) 439:522–7. doi: 10.1016/j.bbrc.2013.09.010
34. Minor EA, Court B, Young JI, Wang G. Ascorbate induces Ten-Eleven translocation (Tet) methylcytosine dioxygenase-mediated generation of 5-hydroxymethylcytosine. J Biol Chem. (2013) 288:13669–74. doi: 10.1074/jbc.C113.464800
35. Bestor TH, Edwards JR, Boulard M. Notes on the role of dynamic DNA methylation in mammalian development. Proc Natl Acad Sci USA. (2015) 112:6796–9. doi: 10.1073/pnas.1415301111
Keywords: endothelial progenitor cells, tet methylcytosine dioxygenases, diabetes with peripheral artery disease, demethylation, diabetes
Citation: Zhao S, Jia T, Tang Y, Zhang X, Mao H, Tian X, Li R, Ma L and Chen G (2018) Reduced mRNA and Protein Expression Levels of Tet Methylcytosine Dioxygenase 3 in Endothelial Progenitor Cells of Patients of Type 2 Diabetes With Peripheral Artery Disease. Front. Immunol. 9:2859. doi: 10.3389/fimmu.2018.02859
Received: 13 July 2018; Accepted: 20 November 2018;
Published: 06 December 2018.
Edited by:
Jixin Zhong, Case Western Reserve University, United StatesReviewed by:
Lixin Zhu, University at Buffalo, United StatesYa-Xiong Tao, Auburn University, United States
Copyright © 2018 Zhao, Jia, Tang, Zhang, Mao, Tian, Li, Ma and Chen. This is an open-access article distributed under the terms of the Creative Commons Attribution License (CC BY). The use, distribution or reproduction in other forums is permitted, provided the original author(s) and the copyright owner(s) are credited and that the original publication in this journal is cited, in accordance with accepted academic practice. No use, distribution or reproduction is permitted which does not comply with these terms.
*Correspondence: Shi Zhao, zhaoshiwuhan@sina.com
Guoxun Chen, gchen6@utk.edu