 Ines Wagner1Daniel Schefzyk2Jens Pruschke2
 Gerhard Schöfl1Bianca Schöne1Nicole Gruber1Kathrin Lang1Jan Hofmann2Christine Gnahm2Bianca Heyn1Wesley M. Marin3Ravi Dandekar3
 Jill A. Hollenbach3Johannes Schetelig2,4Julia Pingel2
 Paul J. Norman5Jürgen Sauter2
 Alexander H. Schmidt1,2
 Vinzenz Lange1*
- 1DKMS Life Science Lab, Dresden, Germany
- 2DKMS, Tübingen, Germany
- 3San Francisco School of Medicine, University of California, San Francisco, San Francisco, CA, United States
- 4Department of Internal Medicine I, University Hospital Carl Gustav Carus at the Technische Universität Dresden, Dresden, Germany
- 5Division of Biomedical Informatics and Personalized Medicine, and Department of Immunology, University of Colorado Anschutz Medical, Aurora, CO, United States
The killer-cell immunoglobulin-like receptor (KIR) genes regulate natural killer cell activity, influencing predisposition to immune mediated disease, and affecting hematopoietic stem cell transplantation (HSCT) outcome. Owing to the complexity of the KIR locus, with extensive gene copy number variation (CNV) and allelic diversity, high-resolution characterization of KIR has so far been applied only to relatively small cohorts. Here, we present a comprehensive high-throughput KIR genotyping approach based on next generation sequencing. Through PCR amplification of specific exons, our approach delivers both copy numbers of the individual genes and allelic information for every KIR gene. Ten-fold replicate analysis of a set of 190 samples revealed a precision of 99.9%. Genotyping of an independent set of 360 samples resulted in an accuracy of more than 99% taking into account consistent copy number prediction. We applied the workflow to genotype 1.8 million stem cell donor registry samples. We report on the observed KIR allele diversity and relative abundance of alleles based on a subset of more than 300,000 samples. Furthermore, we identified more than 2,000 previously unreported KIR variants repeatedly in independent samples, underscoring the large diversity of the KIR region that awaits discovery. This cost-efficient high-resolution KIR genotyping approach is now applied to samples of volunteers registering as potential donors for HSCT. This will facilitate the utilization of KIR as additional selection criterion to improve unrelated donor stem cell transplantation outcome. In addition, the approach may serve studies requiring high-resolution KIR genotyping, like population genetics and disease association studies.
Introduction
The human killer cell immunoglobulin-like receptor (KIR) gene family resides on the long arm of human chromosome 19 in a region that varies between 100 and 200 kb in size. This region is characterized by highly diverse haplotypes, that differ both in gene content and copy number of the KIR genes (1–5). KIR genes encode transmembrane glycoproteins, expressed on the surface of natural killer (NK) cells (6, 7), which are an important component of the innate immune system and provide a first line of defense against infectious agents and tumor cells (8). KIR are key modulators of NK cell activity with activating and inhibiting family members. Activating KIR induce target cell killing upon receptor stimulation, and inhibitory KIR counteract NK cell activation thereby playing an important part in the detection of HLA downregulation: a common mechanism of immune evasion of virally infected cells or tumor cells (9, 10).
The importance of the interactions between KIR and HLA molecules has been well established: KIR and HLA class I have been found to be actively co-evolving (11, 12). KIR binding specificity and affinity to HLA class I molecules, and consequently patterns of resistance to specific diseases are influenced by complex interactions of allelic polymorphisms of both KIR and HLA class I genes (13–18).
Successful allogeneic hematopoietic stem cell transplantation (HSCT) crucially depends on a close match of HLA class I and class II alleles between donor and recipient (19), and HLA matching remains the most important criterion for unrelated donor selection (20). Yet, consideration of additional factors such as KIR may further improve transplantation outcome. Several studies reported an influence of donor KIR genotype on long-term survival after transplantation (21–27). Owing to the fact that KIR and HLA genes reside on different chromosomes, unrelated donors and recipients who are HLA-matched rarely share identical KIR genes. Genotyping the KIR genes of potential stem cell donors at high resolution upon registration and providing this information in addition to the HLA genotypes would thus be beneficial for optimizing the unrelated donor selection process (28, 29).
Due to the complexity of the human KIR region, high-resolution genotyping is not straightforward. There are 15 KIR genes and two KIR pseudogenes named (30). In this study we will refer to this classical KIR gene nomenclature, even though KIR3DL1/KIR3DS1 and likewise KIR2DL2/KIR2DL3 constitute alleles of the same gene (31). On the other hand, we treat KIR2DL5A and KIR2DL5B, which are highly homologous genes allocated to clearly distinct genomic locations (32), as a single gene. Six KIR genes (KIR2DL1, KIR2DL2/3, KIR2DL5, KIR3DL1, KIR3DL2, KIR3DL3) encode inhibitory glycoproteins with long (L) cytoplasmic tails, while six genes encode glycoproteins with short (S) cytoplasmic tails that induce activation (KIR2DS1, KIR2DS2, KIR2DS3, KIR2DS4, KIR2DS5, KIR3DS1). KIR2DL4 exhibits both activating and inhibitory functions (33). Two pseudogenes are not expressed as proteins (KIR2DP1, KIR3DP1). Four genes are present in most of the common haplotypes and have been designated “framework” genes (KIR3DL3, KIR3DP1, KIR2DL4, KIR3DL2). They mark the centromeric and telomeric boundaries of the KIR region (2, 11). The KIR region shows extensive genetic diversity at three distinct levels (2, 5, 11). First, KIR haplotypes vary with respect to gene content, i.e., the presence or absence of specific KIR genes on a haplotype (2, 11). Next, some KIR genes are subject to copy number variation (CNV), having up to four copies on a single haplotype (5). Finally, individual KIR genes show extensive sequence polymorphism with currently 907 alleles being described in total (IPD-KIR Database, Release 2.7.1) (30). Allelic diversity across genes ranges from 16 alleles for KIR2DS3 and KIR2DS1 to 158 alleles for KIR3DL2.
Established KIR genotyping methods focus on assessing KIR gene content, i.e., patterns of presence or absence for individual KIR genes (34, 35). Methods that report CNV or allelic differences have been developed (5, 31, 36), but they are mostly designed to serve the needs of the research community and do not support the cost and scale requirements for high-volume stem cell donor registry typing.
DKMS registers volunteers for stem cell donation across Germany, Poland, the USA, the UK, and Chile. Since 2013, the high-throughput genotyping facility of DKMS (DKMS Life Science Lab, Dresden, Germany) has been applying next generation sequencing (NGS) for high-throughput HLA genotyping (37, 38). After initially developing this NGS-based workflow for six HLA genes we extended the donor typing profile by adding CCR5 and the blood groups ABO and RHD (38–40). Here, we describe the workflow and the algorithm used to provide cost-effective high-volume KIR genotyping at allelic resolution. We compare the results to established KIR genotyping methods and present an analysis of KIR allele frequencies based on a subset of more than 300,000 samples.
Materials and Methods
Aim
Our short-amplicon-based NGS workflow for HLA genotyping achieves extreme cost efficiency for high-throughput genotyping by omitting the classical NGS library preparation steps. Instead, short amplicons are designed to match the instrument sequencing length. Upon pooling all targeted loci, molecular indexes and adapters required for sequencing are added using a second PCR reaction. Here, we describe the workflow and the algorithm used to provide KIR genotypes at allelic resolution. The output gives full gene presence/absence, copy number and allele data represented in the GL string format (41), which is a standard that enables communication of results among clinics and researchers (42).
Samples and Consent to Participate
Volunteers from Germany, Poland, USA, and UK provided samples to DKMS for registration as potential HSCT donors. HLA and KIR genotyping was performed on these samples between October 2016 and August 2018. All subjects gave written informed consent for HLA and KIR genotyping in accordance with the Declaration of Helsinki. The described genotyping is within the scope of the consent forms signed at recruitment and performed as a genotyping service. UCSF sample collection with written informed consent (accuracy assessment based on 360 samples) was approved by the Institutional Review Board of the University.
DNA Isolation and Quantification
DNA was isolated from 150 μl whole blood or a single nylon “FLOQSwab ™ hDNA free” (Copan Italia Spa, Brescia, Italy) using the magnetic-bead-based “chemagic DNA Blood Kit special” or “chemagic DNA Buccal Swab kit special” (Perkin Elmer, Baesweiler, Germany), respectively. DNA was eluted in 100 μl elution buffer (10 mM Tris-HCl pH8.0). DNA concentrations were measured by fluorescence (SYBR Green, Biozym, Hessisch Oldendorf, Germany) using the TECAN infinite 200 Pro (Tecan, Männedorf, Switzerland) plate reader. Samples with DNA concentrations of <2 ng/μl were excluded from KIR genotyping.
Reference Samples With KIR Genotyping Information
We obtained genomic DNA from a panel of 93 International Histocompatibility Working Group (IHWG) cell lines (43). The samples were diluted to a concentration of 20 ng/μl. An additional set of 360 reference samples were derived from a collection of healthy individuals stored in the UCSF multiple sclerosis biorepository. Both sample sets had been previously genotyped for KIR at allelic resolution (31).
Amplicon Design and PCR Amplification
Primers were designed to target KIR exons 3, 4, 5, 7, 8, and 9. As exon 8 is very short (53 bp) and close to exon 9 a combined amplicon was designed for these two exons. Primer mixes contained 10–14 primers per amplicon to cover all KIR genes in a multiplexed assay. Amplicon sizes varied between 249 and 448 bp. Four separate PCR reactions (exon 4, exon 5, exons 3, and 7 multiplexed, one amplicon spanning exons 8 and 9) were performed in 10 μl volume using 384-well plates with FastStart™ Taq DNA Polymerase (Roche, Basel, Switzerland) and the associated buffer system (38). For each sample, the four PCR reactions were pooled using volumes appropriate to obtain balanced read coverage for each KIR exon. A secondary PCR was performed on the pool to elongate the amplicons with indexes and sequencing adapters for Illumina sequencing as described before (38). Target-specific primers and index primers were obtained from Metabion (metabion international AG, Planegg, Germany).
Library Preparation and Sequencing
After the indexing PCR, 384 barcoded samples were pooled together. Pooled PCR products were purified with SPRIselect beads (BeckmanCoulter, Brea, USA) with a ratio of 0.6:1 beads to DNA and subsequently quantified by qPCR using the Library Quant Illumina Kit (KAPA Biosystems, Boston, USA). Commonly, 10 purified and quantified KIR amplicon pools were combined with 10 amplicon pools targeting the HLA, blood group and CCR5 genes as described previously (38). Denaturation and dilution of the sequencing library were executed as recommended by Illumina (MiSeq Reagent Kit v2-Reagent Preparation Guide). Libraries usually consisting of 3,840 samples were loaded at 12.5 pM onto HiSeq flow cells with 10% PhiX spiked in. Paired-end sequencing was performed for 2 times 249 cycles with HiSeq Rapid SBS Kits v2 (500 Cycles) on HiSeq2500 (Illumina, San Diego, USA) instruments.
Nextype for KIR
The general design of the neXtype software for KIR allele-level genotyping follows the design of neXtype for HLA genotyping as described previously (37). However, there are two major challenges for short-amplicon-based KIR genotyping: First, gene content varies depending on the haplotypes. Second, some KIR genes show very high sequence homology either partially or completely with other KIR genes. Therefore, particular exonic sequences may not only be shared across alleles of the same KIR gene but also across two or more distinct KIR genes. Hence, some fundamental assumptions of our established HLA genotyping algorithm do not hold true: For KIR genotyping we cannot assume that one (homozygous) or two (heterozygous) sequences are identified for each amplified locus. Instead, the number of distinct sequence features per exon varies from sample to sample.
These circumstances increase the algorithmic challenge to distinguish between original sample sequences, and PCR or sequencing artifacts. The most abundant sequencing artifacts are PCR-crossover products and single base errors. In HLA genotyping, these can easily be identified by their reduced read coverage compared to at most two original allele sequences. In KIR genotyping, however, the natural spread of read coverage and the variation in sequence features present require a different strategy. To deal with this and other challenges (described below), we determine the genomic copy number (ECN, Exon-sequence Copy Number) of individual sequence features by taking advantage of the multiplexed amplification of all KIR genes in a single PCR reaction per amplicon. This allows calculating the read count of each individual sequence feature in reference to the read count of other sequences, after correcting for preferential amplification (see below). Applying this normalization algorithm, artifacts are clearly separated from single copy sequences (Figure 1). ECN estimation becomes less accurate with increasing copy numbers (Figure 1). However, only one and two copies per haplotype are common, whereas three and more copies are rather rare (5). The ECN estimation is used for four purposes:
1) Identification of artifacts. The ECN estimation outperforms simple absolute or relative thresholds because of the underlying calibration algorithm.
2) Restriction of the result space. The ECN estimation decreases the number of valid combinations of exonic sequences, particularly for sequences shared across several KIR genes. In these cases the number of theoretically valid exon combinations is often very high. By incorporating the ECN estimations many of these combinations can be eliminated.
3) Determination of gene copy number. Based on the ECNs the copy number of KIR genes can be determined even if the same allele is present in several copies.
4) Calculation of a quality score. For every KIR gene a quality score is calculated based on the deviation of the calculated copy numbers from the allocated copy numbers (copy number used) for this solution across all exons. This quality score was identified as the most effective means for the identification of erroneous results in our experiments.
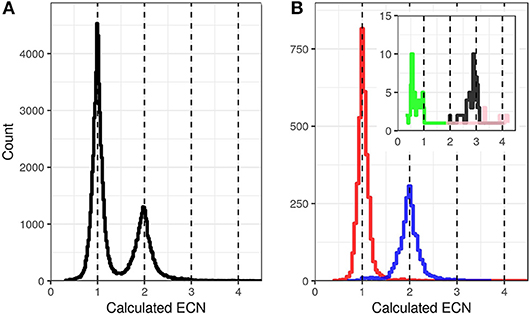
Figure 1. Exon Sequence Copy Number (ECN) calculation based on relative read coverage. Distribution of the calculated ECNs of all exon sequences of 1,000 randomly selected samples (A) and 93 reference samples with known KIR genotypes (B). The ECNs were calculated for all detected exon sequences and plotted as events in histograms with a bin size of 0.02. For (B) the events were separated and color coded based on the known ECNs according to the reference genotypes with ECN = 0 (green, inlay), ECN = 1 (red), ECN = 2 (blue), ECN = 3 (black, inlay), and ECN = 4 (pink, inlay).
Taken together, the determination of the ECNs and their incorporation into the algorithm reduce the result space and improve accuracy for allele-level KIR genotyping.
neXtype analyses the sequencing data in seven consecutive steps:
Step1: Amplicon Assignment
Based on the primer sequences each read is assigned to one of the five KIR amplicon groups (exon3, exon4, exon5, exon7, exon8/9) as described before (37).
Step2: Allele Matching
Using the extant IPD-KIR Database information, the sequences of alleles that are indistinguishable at a given exon are gathered into Exon Allele Groups (EAGs). The allele assignment for this study was based on the IPD-KIR Database, Releases 2.6.1 and 2.7.1 (44). For each exon, these EAG sequences are assembled into a decision tree (37).
The exon-assigned reads are mapped to their corresponding decision trees allowing mismatches. After mapping all reads, the algorithm delivers a set of EAGs and the number of reads mapped to each EAG. We term those EAGs that share their sequence across different genes as “bridging” EAGs. Bridging EAGs cannot be assigned a priori to a single gene.
Step3: EAG Classification
After all reads are matched, EAGs are classified based on read counts, patterns of sequence mismatches and other statistical properties (Table 1). EAGs identified at this point as artifacts are flagged and eliminated from subsequent analyses.
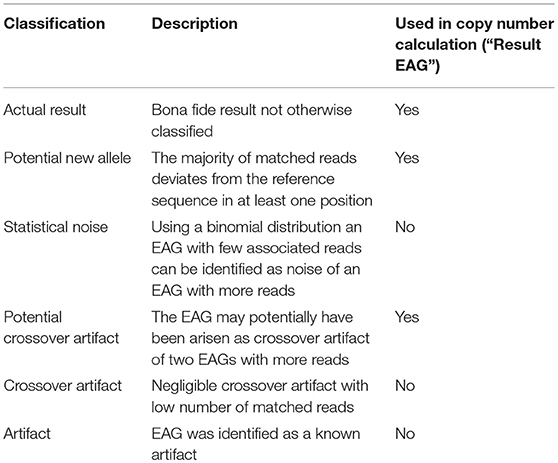
Table 1. Classification of detected sequence features (EAGs).
Step4: Copy Number Calculation
Applying calibration parameters experimentally derived for each batch of PCR primers (see below), the copy number calculation converts the read count for each EAG to an exon sequence copy number (ECNc). The gene copy number (GCNc) is calculated from the average of the (non-bridging) ECNc over the exons. Note that ECNc and GCNc are rational numbers and used without rounding in the following calculations.
Step5: Exon Combination
In this step, KIR alleles are called by “exon combination.” In this process gene-specific EAGs are combined and compared to the known IPD-KIR Database allele sequences. Only EAG combinations (EAGCs) corresponding to an allele in the IPD-KIR Database are accepted. EAGCs are further combined into EAGC sets, which represent all the potential combinations of alleles present in the genotype. The number of EAGCs (alleles) in a valid EAGC set is constrained by the rounded calculated gene copy number (GCN). To allow for uncertainty in GCN estimation, EAGC sets based on GCN ± 1 are considered.
The decision on which of the EAGC sets represents the final result for a gene is based on least squares scores. This score incorporates the relative difference between the used (ECNu) and calculated (ECNc) exon copy numbers per EAGC set. Each set is allocated a score S which is defined as
where EAG1 to EAGn comprise all member EAGs of an EAGC set and, in addition, EAGs detected but not part of the evaluated EAGC set. Consequently, unused EAGs (ECNu = 0) increase the score because the sum over the squares comprises these EAGs (ECNu in the denominator is set equal to 1 in that case). For normalization, the squared error is divided by the sum of all detected ECNc which equals approximately the GCN multiplied by the number of exons analyzed. The set with the smallest score is identified as the best result. In some cases several results have identical scores. Such ambiguities are reported in the GL string and we refer to them as phasing ambiguities.
In the case of bridging EAGs, we consider the respective genes jointly when building EAGC sets. A simplified example is shown in Figure 2. The bridging set with the lowest overall score is chosen as the final result.
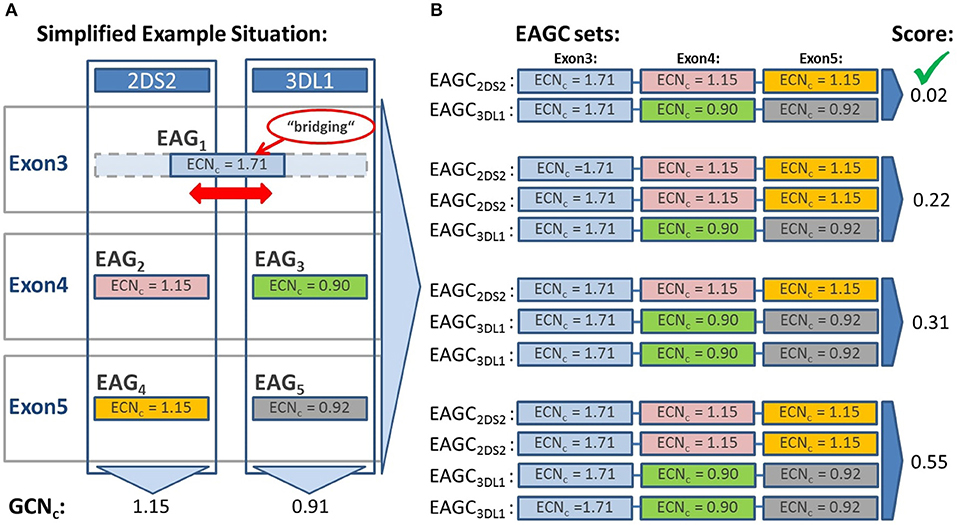
Figure 2. Evaluation of result sets based on the calculation of the result set score S. The result set score S is calculated to evaluate potential results and identify the most likely one. Each result set is composed of different combinations of detected exon sequences (EAGs). This example depicts three exons of two genes sharing in exon 3 the same sequence (bridging EAG). (A) EAGs identified in each exon with associated Exon Sequence Copy Numbers (ECNcs). The ECNcs are derived from the number of detected reads by applying several normalization and correction factors. The gene copy number (GCNc) is estimated for each gene by first building the sum of the ECNcs of all EAGs in each exon and then averaging the sums over the exons (ignoring exons with bridging EAGs). (B) Based on the detected EAGs neXtype calculates result sets (EAGC sets) consisting of EAG combinations (EAGCs) which correspond to named alleles. In this example EAGC sets with one or two copies per gene are evaluated because the calculated gene copy number (GCNc) is close to 1 for both genes. The EAGC set with one copy of each gene yields the lowest score of 0.02 and is therefore selected as final result.
Step6: Result Rating
The exon combination results are subjected to the following sanity checks:
1) Is a pre-defined minimum read number obtained for each exon?
2) Are all framework genes present?
Results not passing checks 1 or 2 are blocked and flagged for repeated experimental analysis but may be approved in step 7 after analyst review.
3) Is the copy number of each of the framework genes equal to 2?
4) Are the GCNs of the best results identical?
Results not passing checks 3 or 4 are flagged for manual verification.
5) Is the score S of each EAGC set < = 0.1?
6) Are all EAGs with an ECNc > 0.6 included in the result set?
7) Is no EAG with ECNc < 0.4 included in the result set?
8) Is ECNc-ECNu < 0.4 for the majority of used EAGs?
9) Is no potential new allele included in the result set?
Results not passing checks 5–9 trigger fallback to presence/absence (POS/NEG) calling of the corresponding gene. To report presence/absence of a gene, the GCNc is evaluated: For GCNc > 0.5 the gene is reported as present, otherwise as absent.
The final result is represented in terms of a genotype list (GL) string (41) for each gene, for example:
This GL string for the gene KIR2DL4 represents a copy number of two with two possible realizations (genotype ambiguity, denoted by “|”). In one realization one copy has an allele ambiguity (denoted by “/”). To report presence or absence of a gene, “POS” or “NEG” are used in the GL string.
Step7: User Interaction
neXtype allows the user to orchestrate the result if required. All classified EAGs not included in one of the EAGC are displayed in addition to the results. The user can add one of those EAGs or flag an EAG as artifact and start a recalculation. It is also possible to exclude a complete exon from the calculation, which may yield a higher level of ambiguities. In addition, the GCNs can be changed manually.
Determination of the KIR Calibration Parameters
We derive the ECNcs from the relative read count of an individual EAG vs. all reads of the exon. However, certain sequences, representing particular genes or alleles, are amplified more efficiently than others. To account for EAG, gene and batch-dependent amplification differences, we introduce three calibration parameters FACTOR_AI, FACTOR_1, and FACTOR_2. For each new reagent batch these parameters are empirically determined by processing at least 1,000 samples (calibration set) including the 93 IHWG samples with known KIR genotype.
As described above the reads are assigned to EAGs. As a first calibration step, read counts per EAG are normalized by the total number of reads identified for the respective exons.
To these normalized read counts, FACTOR_AI is applied to compensate for amplification imbalances between EAGs of the same gene and exon. This calibration parameter is derived for each EAG by empirically determining the peak density corresponding to ECN = 1 based on plots of the normalized read counts of the calibration set.
Next, FACTOR_1 is applied to compensate for amplification imbalances between genes and exons. This calibration parameter is derived for each gene and exon (with the calibration set) by applying k-means clustering (45) to the read counts, normalized by the previous two steps. FACTOR_1 is then derived from the centroid coordinates of the cluster, empirically determined to correspond to ECN = 1.
Finally, to fine-tune calculated ECNs, FACTOR_2 is applied. To derive FACTOR_2 during parameter determination, ECNs are estimated for each EAG based on reads counts normalized by the previous three steps. These estimates are clustered by applying k-means clustering. FACTOR_2 is then derived from the centroid coordinates of the clusters, empirically determined to correspond to ECN = 1 for each locus and exon.
The performance of the calibration parameters is reviewed by manual inspection of density plots derived from the final ECN estimates. Here, the presence of one to two peaks per EAG that correspond to either ECN = 1 or ECN = 2 is verified. Further, the accuracy of typing results of samples with known genotype is another criterion for the approval of a set of calibration parameters for routine typing.
Characterization of Novel Alleles
To characterize novel alleles for submission to KIR-IPD we applied a redundant full-gene sequencing workflow as previously described for the characterization of novel HLA alleles (46). Briefly, the novel allele was amplified in two independent KIR gene specific long-range PCRs covering the gene from UTR to UTR using PrimeSTAR GXL DNA Polymerase (Takara, Kyoto, Japan). One PCR product was sequenced on Illumina MiSeq instruments after fragmentation and library preparation. The other PCR product was sequenced on PacBio Sequel instruments as unfragmented long amplicon product. The DR2S software (https://github.com/DKMS-LSL/DR2S) was applied to derive fully phased high-quality error-corrected sequences, incorporating both long-read and short-read data (47). The final sequence was submitted to ENA and subsequently KIR-IPD using Typeloader (48).
Results
Validation, Precision, Accuracy
Given the complexity of KIR genotyping at the allelic level, thorough verification of the workflow and algorithm is essential. A major hurdle is the lack of reference material genotyped to the same depth and breadth. During setup, testing, validation, and optimization of the workflow and algorithm we extensively took advantage of 93 IHWG reference samples that had been previously genotyped for all KIR genes at allelic resolution (31). To estimate the precision, we experimentally analyzed a random set of 190 samples 10 times. Finally, we estimated the accuracy of our KIR typing approach by analyzing a further set of 360 samples genotyped at KIR allele-level.
Initial Validation on 93 IHWG Reference Samples
For initial validation of the workflow and algorithm, we analyzed 93 reference samples with predetermined allelic KIR genotypes (31). Analysis was performed blinded. Given 16 analyzed KIR genes, those 93 samples equal 1,488 genotypes on the level of the individual KIR genes that could feature none, one, or several alleles for each gene. KIR genes not present in the respective samples according to the reference data were correctly flagged as absent in 413 cases. In 224 cases (15%) genes were correctly flagged as present, but no allele level was reported (The analysis software reports presence instead of allele-level results if novel alleles are identified or results do not meet all quality criteria). Eight hundred fifty-one genotypes were reported at the allelic level: 848 were in concordance with the pre-typing or have been confirmed after revisiting the reference data. Concordance criteria were: (a) identical alleles called or, in case of not fully resolved alleles, overlap in the allele sets reported in the GL string; (b) identical copy numbers of the alleles called. The three discordant results (0.2%) were due to two cases of KIR2DL4 with incorrect allele calls and one discrepancy in the copy number of KIR2DL5: three copies of an allele were erroneously called instead of two in a homozygous sample. The two KIR2DL4 cases resulted from a noise filter that disregarded true sequences in rare circumstances, resulting in incorrect allele calls. This filter, inherited from the HLA analysis, was found to be not required due to the quantitative approach of the KIR algorithm. It was relaxed in the subsequent release to exclude this error source.
Assessment of Precision Based on 10-Fold Repeated Analysis of 190 Samples
To assess the precision of workflow and algorithm, we randomly selected 190 samples and performed the KIR genotyping analysis ten times with this sample cohort, varying instruments, and reagent batches (using KIR-IPD 2.6.1 as reference). Based on the manually curated consensus results we determined the gene copy numbers (Figure 3A). In 6% (12 out of 190) of the samples, at least one of the KIR genes was present in three copies, underscoring the need for algorithms able to cope with that complexity. Overall, we obtained results passing quality filters for 1,752 analyses corresponding to 28,032 KIR genotypes considering 16 KIR genes. (For technical reasons we distinguish in Figure 3 between the expressed and non-expressed variants of KIR2DS4, but refer to it jointly as one KIR2DS4 genotyping result.) Within those 28,032 KIR genotypes there were only 19 (0.07%) with discordant results (Figure 3B). Of these, 15 were due to discrepancies in the copy number of the reported alleles, mostly (13/15) discrepancies regarding copy numbers of two or three. In two cases, discrepant alleles were called either instead of the correct allele (KIR3DP1) or in addition (KIR2DS4). In two further cases an absent KIR gene was falsely called as present (KIR2DL1 and KIR2DS2).
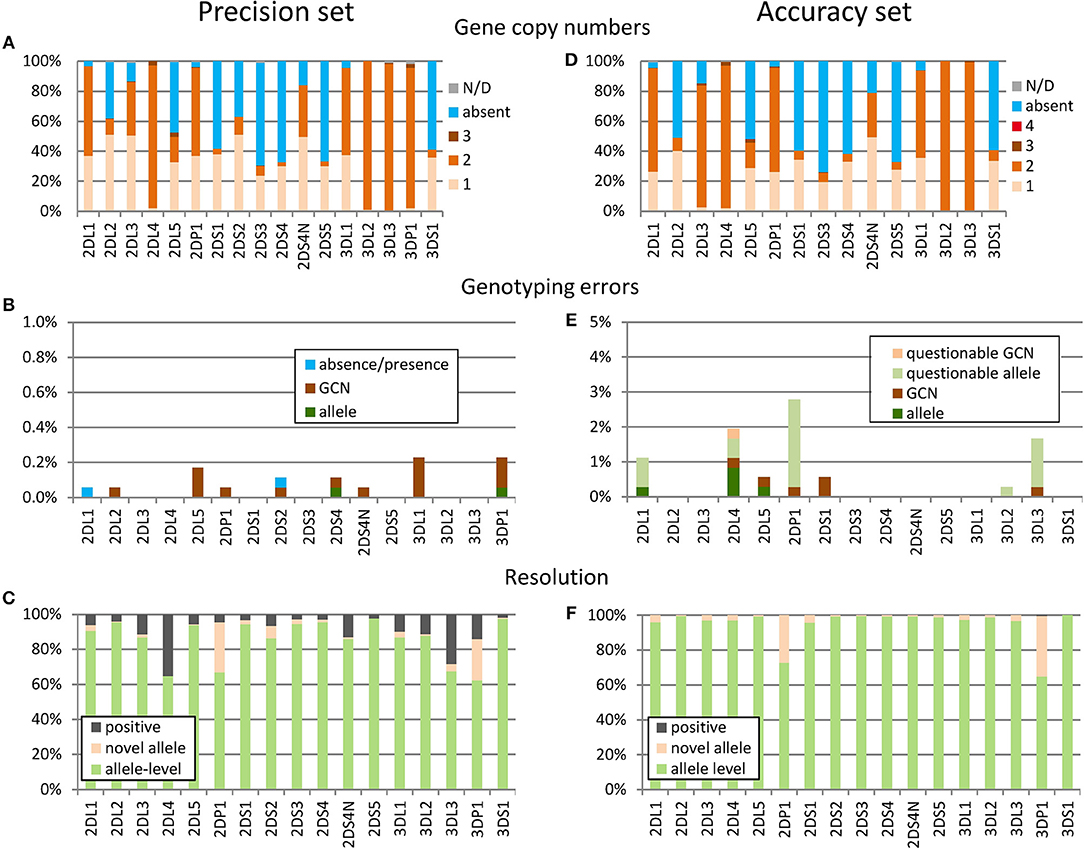
Figure 3. Assessment of precision and accuracy. (A–C) Precision set: 10-fold analysis of 190 samples. (D–F) Accuracy set: analysis of 360 samples with independent KIR genotyping data. (A,D) Gene copy numbers (GCN) based on the established consensus genotypes (A) and the corrected results (D). In very few cases the GCN could not be determined unambiguously (gray), partly due to the presence of hybrid genes. (B,E) Genotyping errors based on discrepancies between individual replicates and the manually curated consensus genotypes (B) or the ground truth reference genotypes (E). Discrepancies are labeled as “questionable” (E) if the reference genotypes are not plausible based on manual inspection of neXtype data. (C,F) Rate of allele-level results and novel alleles: to avoid spurious results the algorithm reports only the presence of individual KIR genes instead of the exact alleles if certain quality criteria are not met (positive). For the accuracy set (D–F), presence calls were largely improved to allele-level genotypes after manual inspection of the data.
Novel alleles were identified in 5.3% (160 of 3,040) of the consensus genotyping results on the individual gene level (Figure 3C). However, this average is inflated by the two pseudogenes KIR2DP1 and KIR3DP1 having several rather frequent alleles not contained in KIR-IPD 2.6.1. Not considering these genes, 2.1% (57 of 2,660) of the genotyping results included novel alleles.
To prevent erroneous calls, neXtype software reports the presence of a gene (positive) instead of distinct alleles if certain quality criteria are not met. The rate of allele level calls was similar for most genes with KIR2DL4 and KIR3DL3 being the exceptions (Figure 3C). A particular common artifact in exon 7 was identified as chief cause for KIR2DL4 underperformance. KIR3DL3 presence calls were mostly due to a neXtype reference data issue due to missing intron information.
Taken together, we obtained 99.9% concordant KIR genotyping results. The data further suggests that the KIR-IPD database currently is far from covering the alleles present in this cohort of 190 samples comprehensively.
Assessment of Accuracy Based on the Analysis of 360 Samples
In March 2017 we received an independent set of 360 samples previously analyzed for KIR allele-level genotype with the PING software pipeline (31). Validation and precision estimation were set up to mimic high-throughput operations with largely automated analysis. In contrast, these samples were analyzed meticulously as appropriate for clinical samples or clinical research studies. Therefore, samples were processed twice and neXtype results were manually curated. In particular, all neXtype presence calls were reverted to allele-level results with the exception of two cases of KIR3DP1 (Figure 3F). Data analysis was performed blinded, i.e., without knowledge of PING genotyping data. After data exchange, we worked closely together to define a ground truth based on in-depth inspection of discordant KIR typing results.
Overall, copy number distribution in this sample set resembled the 190 sample set data, with 6% of samples harboring three or four copies of specific KIR genes (Figure 3D). The frequency of novel alleles was found to be similar to the precision set: Averaging over all KIR genes, novel alleles were identified in 5.6% of the results (324 of 5,760). Excluding the two pseudogenes KIR2DP1 and KIR3DP1, novel alleles were identified in 2.0% of the results (101 of 5,040).
The dataset included 360 samples corresponding to 5,760 genotyping results, considering 16 KIR genes. However, no reference data was available for KIR3DP1 (all samples), KIR2DS2 (all samples), KIR2DL3 (147 samples) and specific other genes (21 samples) reducing the data set to 4,872 results with PING data. The neXtype genotypes were in concordance with PING genotypes in 99.3% of the cases (Figure 3E). In 11 cases (0.2%) neXtype genotyping errors were identified, including 6 cases of GCN discrepancies and 5 cases of miscalled alleles. In addition, in 21 cases (0.4%) we were not able to establish a ground truth as the two genotyping workflows delivered conflicting results that could not be resolved. In conclusion, this analysis of an independent sample set underlines the potential of the method for high accuracy studies: In this setting it delivered 99.9% allele-level genotypes, including the report of novel alleles, with an accuracy exceeding 99%.
KIR Genotyping of a Large Cohort
Between October 2016 and August 2018 we generated allele-level KIR genotyping data for 1.8 million potential HSCT donor samples from Germany (1.08 M), Poland (0.38 M), USA (0.20 M), and UK (0.17 M). Here we report on some characteristic features of a subset of 337,387 samples of this predominantly European cohort analyzed using the most recent KIR-IPD database version (2.7.1) as the reference allele set.
We further took advantage of the unprecedented cohort size with respect to KIR allele-level typing and determined allele frequencies for all detected KIR genes. The individual genes differed markedly with regard to the number of alleles present in the data set, as well as their relative allele frequencies. As reported previously (49), limited allelic diversity was found in the activating KIR genes (KIR2DS1, KIR2DS2, KIR2DS3, KIR2DS4, KIR2DS5, KIR3DS1) with currently (KIR-IPD 2.7.1) around a dozen (7 to 22) alleles per gene known at the allotype level (Figure 4). In addition to the limited overall diversity, the allele distribution in activating KIR genes was heavily skewed: The single most abundant allele of the activating KIR genes (with the exception of KIR2DS4) accounted for at least 60% (KIR2DS1) and up to 97% (KIR2DS5) of the sample set. For KIR2DS4 five common alleles were found at largely similar frequencies. In contrast, the inhibiting KIR genes generally displayed more diversity (Figure 5). In particular, for the genes with three Ig-domains (KIR3DL1, KIR3DL2, KIR3DL3) many different alleles were identified at rather evenly distributed frequencies. Among genes with two Ig domains, KIR2DL1 and KIR2DL4 demonstrated rather broad allele frequency distributions, while KIR2DL2, KIR2DL3, KIR2DL5 were each dominated by two common alleles having a combined frequency of ~90%.
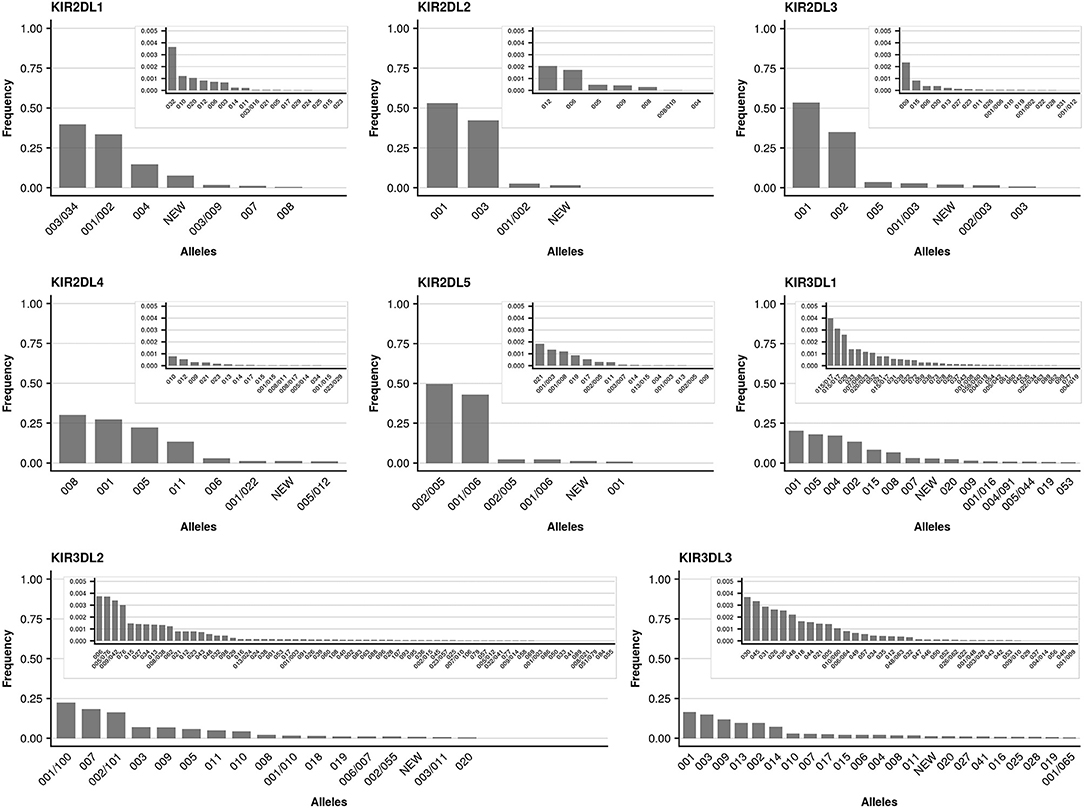
Figure 4. Allele frequencies of inhibiting KIR genes. Allele frequencies (at 3-digit resolution) of inhibiting KIR genes based on a dataset of 337,387 samples and KIR-IPD database release 2.7.1. Alleles not resolvable based on the targeted exons are separated by “/.” Due to silent mutations, two 5-digit alleles may separate into distinct 3-digit allele groups with different levels of ambiguities (e.g., KIR2DL3*001 and KIR2DL3*001/003). Alleles with frequencies below 0.005 are plotted in an inlay.
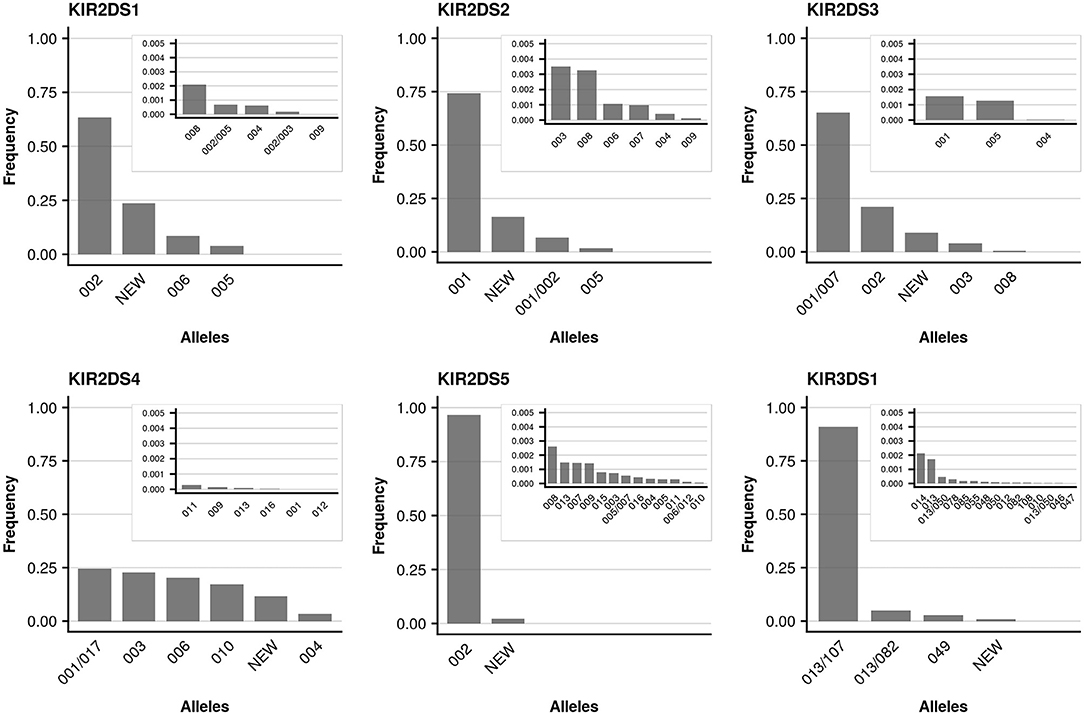
Figure 5. Allele frequencies of activating KIR genes. Allele frequencies (at 3-digit resolution) of activating KIR genes based on a dataset of 337,387 samples and KIR-IPD database release 2.7.1. Alleles not resolvable based on the targeted exons are separated by “/.” Due to silent mutations, two 5-digit alleles may separate into distinct 3-digit allele groups with different levels of ambiguities (e.g., KIR2DS2*001 and KIR2DS2*001/002). Alleles with frequencies below 0.005 are plotted in an inlay.
Owing to the large cohort size we can report allele frequencies for over two thirds (69%) of the alleles described in IPD-KIR 2.7.1 at the protein (allotype) level (Figure 6). For another 16% we can only report the frequency of allele groups which cannot be distinguished by our approach as the differentiating polymorphism lies outside the targeted regions (i.e., in exon 1 or exon 6). However, despite the large cohort size, 15% of the alleles described in IPD-KIR 2.7.1 were not detected. This likely indicates population-specific alleles not represented in our predominantly European cohort, particularly for alleles first identified in samples of African or Asian origin. On the other hand, this may be due to sequencing errors in the original submission. For example, the allele KIR2DS5*001 was not detected in our cohort. It differs from KIR2DS5*002 (97% frequency) in three positions in exon 4 which are conserved across all other KIR2DS5 alleles. Likewise, the undetected KIR2DS1*001 allele differs from KIR2DS1*003 (63% frequency) in one position in exon 3, again conserved across all other KIR2DS1 alleles.
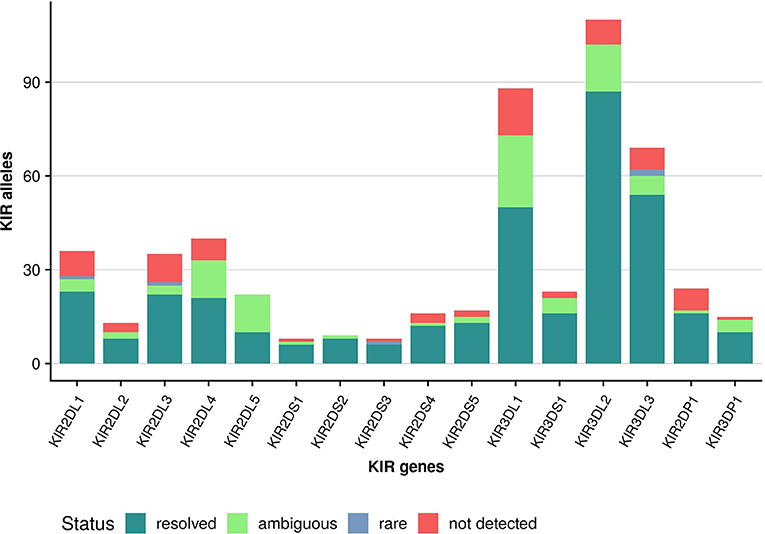
Figure 6. Coverage of IPD-KIR allotypes. KIR alleles (IPD-KIR 2.7.1) were classified at the allotype level (first three digits): unambiguously detected alleles (resolved); alleles detected at a frequency of below 0.00001 (rare); alleles detected as part of an allele group (ambiguous); not detected alleles (not detected).
In conclusion, this analysis provides a comprehensive overview of the alleles and their frequencies to be expected in a European sample set.
Detection of Novel Alleles
To estimate the diversity and frequencies of novel allele variants, we analyzed in more detail a subset of 185,170 samples that were acquired using the IPD-KIR Database Release 2.6 (44) as reference. Considering only sequences which could be assigned to a specific KIR gene with high confidence, we identified 5,203 distinct sequences with variations from reported alleles (Figure 7A, Supplementary File 1). We have begun independent validation of these allele sequences using full-gene characterization, for submission to the IPD-KIR Database (ENA accession numbers of the first 376 full-length sequences, Supplementary File 2). However, given the large number of samples yet to process, detailed results from this effort will be reported in a future study. More than 2,000 of the novel sequences were identified in at least two individuals, minimizing the risk of spurious calls. About half of the novel sequences identified encode for novel protein sequences (Figure 7B). Even when considering only the sequences identified in at least five individuals, the number of novel sequences (427) approaches the number of currently named alleles on the protein level (481, IPD-KIR Database Release 2.7) (44). Overall, the number of novel sequences identified for each KIR gene reflects the diversity pattern currently reported in the IPD-KIR Database with the inhibiting KIR genes (red, Figures 7A,B) displaying a higher variability than the activating KIR genes (green, Figures 7A,B). However, in particular for the activating genes, the genetic variability seems to be far greater than currently reported: Considering only sequences observed at least twice, we identified (averaged over all activating KIR genes) more than four times as many different protein coding sequences as currently reported. The diversity of KIR2DL1 and KIR2DL2 seems underreported as well: While we detected, for example, only 10 of the 13 KIR2DL2 sequences known at the protein level, we observed 46 distinct so far unreported KIR2DL2 sequences in at least two independent samples.
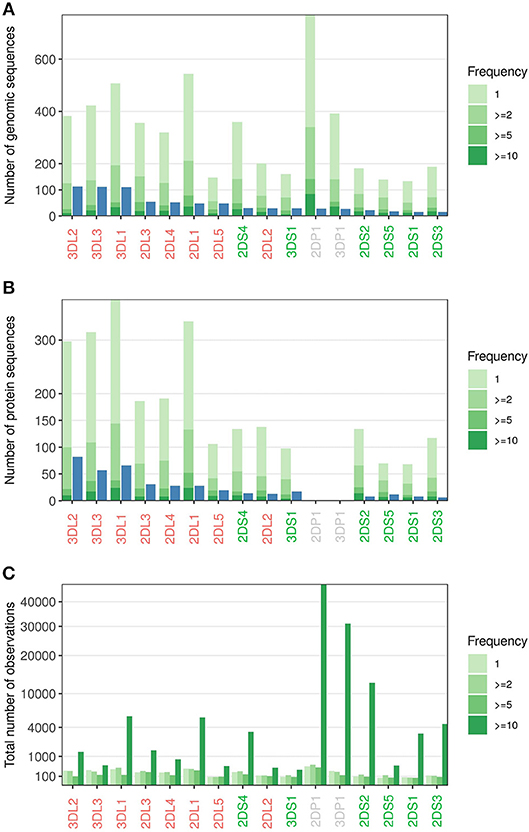
Figure 7. Novel alleles observed. (A) Number of alleles reported in IPD-KIR Release 2.6 (blue) vs. the distinct additional sequences identified in a cohort of 185,170 samples (green). The color code indicates the number of independent observations per novel sequence. (B) As in A, but only alleles/sequences giving rise to distinct protein sequences were counted. (C) Number of samples where any of the novel sequences of A was observed; grouped by the frequencies of the novel sequences. KIR genes are sorted by the number of reported alleles.
All KIR genes have in common that the few novel sequences observed more than ten times collectively comprise more samples than the high number of singletons (Figure 7C). The 11 most abundant novel sequences each occur at population frequencies of above 1%. This group included two alleles of the non-expressed genes KIR2DP1 and KIR3DP1 with frequencies exceeding 10%, presumably reflecting their limited biological relevance and the concurrently reduced research focus.
In addition to the sequence variations reported above, we frequently encountered samples with novel combinations of known exonic sequences. In other cases, one or several exonic sequences could not be detected. This may partly reflect technical limitations like variations in the primer binding region impeding amplification or insertions/deletions interfering with recognition. However, this may also reflect novel alleles, fusion genes or other genomic reorganizations. Given the quantitative algorithm applied, those special cases were readily detected and flagged. However, the exact description of those sequences requires full gene sequencing and exceeds the capabilities of the described high-throughput workflow.
Taken together, this study confirms that the most abundant alleles are adequately reflected in the database with exception of the pseudogenes harboring undescribed alleles in more than 1/5 individuals. Further, the data sheds light on the high diversity of the KIR genes that has only been touched at the surface so far. After integration of the herein described alleles, the IPD-KIR Database should better reflect at least the diversity found in the European population.
Discussion
The regulation of NK cell activity by the KIR gene family is orchestrated by a complex interplay of haplotypes including variation in gene and allele content, NK cell activation (licensing) or inactivation and interaction with HLA molecules, or other unknown ligands. A diverse set of methods has been applied over the last years to unveil the complex genetic diversity (50). Several methods were reported for assaying gene content at the absence/presence level (51–53) or quantitatively (54–56). Others have focused on the allelic characterization of specific KIR genes by either sequencing, PCR-SSOP or PCR-SSP (57–60). The comprehensive analysis of all KIR genes at allelic resolution until recently required the combination of several assays (61). In a joined study, several groups combined their expertise for the in-depth characterization of a cohort of 512 samples (49). However, only the application of NGS enabled the comprehensive characterization of the complete KIR family of genes at allelic level in one assay (29). In contrast to our approach which is based on PCR for target selection, the study by Norman et al. (31)relies on capture technology. Therefore, it is not restricted to selected exons but rather able to provide sequence information covering complete genes including all exons and introns. Despite its holistic nature, the capture assay is applicable to the analysis of large cohorts enabling studies with hundreds of samples, thereby presumably superseding most if not all of the previously published methods. Our approach, however, delivers yet another level of high-throughput capability. We routinely genotype more than 6,000 samples for the complete KIR gene family and six HLA genes on a single HiSeq run. At the same time, our KIR assay is extremely cost-efficient with the main cost drivers being five PCR reactions and about 40,000 HiSeq reads (equaling currently about $1.5 in sequencing costs) per sample. Despite this cost-optimized setup, which presumably is less than even a simple PCR-SSP assay for absence/presence KIR genotyping, we obtain allotype-level resolution, including copy number estimations.
The high-throughput data generation process is supported by a highly automated data analysis pipeline. Extensive optimization and validation ensure high-resolution KIR genotyping with high accuracy. The software is conservatively tuned, reverting to lower resolution or presence calls whenever a quality parameter indicates an increased risk of spurious results. The main challenge lies in the accurate copy number estimation of the sequence features, in particular for features present in more than two copies. While one and two copies can be estimated with good accuracy, the variance in copy number estimation increases with larger copy numbers often triggering a fallback-to-presence call. In the dataset of 337,387 samples studied here for determining KIR allele frequencies, 8% of the results at the individual KIR gene level were reported as present. Since these presence calls presumably are not completely random, they entail a potential distortion in the allele frequencies reported here. We are continuously working on reducing the rate of low-resolution genotyping results by analyzing the specific reasons and fine tuning and improving the neXtype software accordingly. However, trained analysts may inspect the warnings and all underlying data, identify inaccuracies and, based on the comprehensive picture, improve the genotyping resolution. Therefore, for clinical samples or research studies of lower numbers (up to several thousands) the workflow and software provide the opportunity for a close-to-complete (>99%) characterization at the allelic level at an extremely low error rate as demonstrated by the accuracy study. Currently, however, this implies that so far unnamed alleles are reported. Analyzing a subset of 185,170 samples, we identified 5,203 distinct novel alleles. This indicates that our current knowledge is only a faint reflection of the true KIR diversity. Full-length characterization of even the more frequent of these novel alleles will pose a major challenge. However, after developing whole KIR gene amplification assays and updating the appropriate tools for reference sequencing (46–48), we are currently in the process of submitting the first few hundred sequences to the IPD-KIR Database.
The primary motivation for this study was the potential impact of KIR-genotype informed donor selection on HSCT outcome. NK cells are thought to mediate potent anti-leukemic effects in the context of allogeneic stem cell transplantation, so called graft-vs.-leukemia reactions (62). When stem cells are transplanted from a healthy donor to a diseased patient, activity of natural killer cells partly depends on the donor compound gene content for activating and inhibitory KIR in conjunction with the KIR ligands determined largely by the HLA genotype of the patient. Both, the KIR B haplotype and the presence of the KIR2DS1 gene in the donor KIR repertoire were associated with a reduced risk of relapse and better relapse-free survival of patients with AML after allogeneic stem cell transplantation (21, 22). However, gene content analysis falls short of depicting the granular levels of interaction introduced by the large variety of KIR alleles (63). Both, binding affinity, and protein expression on the cell surface vary between different KIR allotypes. For example, disruption of the amino-acid sequence motif WSAPS in KIR3DL1 by substitution of leucine for serine at position 86 blocks the correct folding of the Ig-like domains and results in retention of the protein in the endoplasmic reticulum (64). The KIR3DL1 alleles *004, *019, *021, *036, *037, *039, *056, and *072, with *004 being one of the three most common KIR3DL1 alleles (Figure 4), share this feature and thus are usually not expressed at measurable levels on the cell surface. Variation in expression and density of KIR3DL1 has been shown to impact on AIDS progression in HIV-positive patients and on antibody-dependent cellular cytotoxicity against neuroblastoma cells (13, 54, 55). Most importantly, preliminary studies indicate that the strength of KIR allele-HLA ligand interaction may impact stem cell transplantation outcome (65). Donor selection incorporating KIR allele information may thus positively affect outcome (66). Two large studies addressing the benefits of KIR-(allele)-repertoire based donor selection are in progress (NCT02450708 & NCT01288222).
Unfortunately, fully HLA-matched donors are still not available for all patients in need for a stem cell transplant. However, as a result of the registration of millions of volunteers by the donor centers worldwide, many potential donors are available for the more abundant genotypes: e.g., at least four HLA-compatible 10/10 matched donors are available for the majority of patients with European ancestry. Therefore, a substantial proportion of patients could benefit from considering additional selection criteria. Since the effects on transplantation outcome are driven by the interaction of the KIR repertoire of donor cells with many cognate ligands on recipient hematopoietic cells encoded in the HLA class I genes, KIR genotyping of the patients is not absolutely required simplifying translation into clinical practice. Therefore, donors may be selected based on KIR/ligand information once high-resolution KIR genotyping data is available for a sufficient number of potential stem cell donors. As of August 2018 we have generated KIR genotyping data for 3.2 million potential donors, including KIR allele-level data for 1.8 million donors. Therefore, for 20% of the globally registered donors (with typing profile of at least HLA-A, -B, -C, -DRB1) KIR data is already available. Allele-level KIR data is currently available for 10% of these donors. Extrapolating the current recruitment rates we project to reach 5 million allele-level KIR typed donors by 2021. We hope that these efforts will contribute to translating experimental and clinical research efforts involving different aspects of the KIR family genes into clinical practice to further improve outcome of unrelated stem cell transplantation. In addition, availability of such a cost-efficient high-throughput workflow may prove beneficial for the further exploration of KIR genes and alleles for population and disease association studies.
Data Availability Statement
The raw data supporting the conclusions of this manuscript will be made available by the authors, without undue reservation, to any qualified researcher.
Author Contributions
KL developed and tested the primer sets. IW, DS, JPr, GS, BS, JH, CG, JSa, JPi, and VL conceived the neXtype algorithms. DS, JPr, JH, CG, and JSa implemented neXtype. BS and IW adapted the IPD-KIR allele data for neXtype. BH and NG evaluated the neXtype results. WM, RD, JAH, and PN evaluated the PING results for precision and accuracy estimations. GS, DS, and IW analyzed data and prepared figures and tables. VL, JSc, and GS wrote the manuscript. AS, GS, JSa, JPi, and VL supervised the work. All authors contributed to manuscript revision, read and approved the submitted version.
Funding
This study was supported in part by funding from NIH U19NS095774 to JAH, WM, RD, and PN.
Conflict of Interest Statement
IW, GS, BS, NG, KL, BH, AS, and VL are members of the DKMS Life Science Lab which offers commercial HLA and KIR genotyping services.
The remaining authors declare that the research was conducted in the absence of any commercial or financial relationships that could be construed as a potential conflict of interest.
Acknowledgments
We are grateful to all members of the DKMS Life Science Lab for their dedicated daily work that was fundamental for the analysis of all the donor samples. In particular we thank the teams of Nadine Rieske (sample receipt), Sonja Klemm-Mostoulinia (DNA isolation and PCR setup), Jana Heider (post-PCR and sequencing), Annett Heidl (neXtype data analysis), Lisa Müller (quality assurance), and Arend Große (laboratory automation). We thank Vineeth Surendranath for support in the development of software tools for calibration. UCSF reference samples were contributed by Professor Jorge Oksenberg, Department of Neurology, University of California, San Francisco.
Supplementary Material
The Supplementary Material for this article can be found online at: https://www.frontiersin.org/articles/10.3389/fimmu.2018.02843/full#supplementary-material
Supplementary File 1. Novel Sequences observed. 185,170 samples were analyzed for sequences deviating from the alleles contained in KIR-IPD 2.6.1. An ID was assigned to each variant. For SNPs within exons of expressed proteins, codon number, reference/variant codon sequences and corresponding amino acids are listed. For SNPs within intron regions, the 10 bases up- and downstream of the SNPs are reported. Variants with several SNPs are described in consecutive lines if the SNPs are not within the reported sequence. Variant bases are color coded in red.
Supplementary File 2. ENA accession numbers of full-length KIR sequences. In case of sequences identified and characterized in several samples, only one submission is referenced.
Abbreviations
ECN, Exon sequence Copy Number; EAG, Exon Allele Group; GCN, Gene Copy Number; EAGC, EAG Combination; KIR, Killer-cell Immunoglobulin-like Receptor.
References
1. Uhrberg M, Valiante NM, Shum BP, Shilling HG, Lienert-Weidenbach K, Corliss B, et al. Human diversity in killer cell inhibitory receptor genes. Immunity (1997) 7:753–63. doi: 10.1016/S1074-7613(00)80394-5
2. Wilson MJ, Torkar M, Haude A, Milne S, Jones T, Sheer D, Beck S, et al. Plasticity in the organization and sequences of human KIR/ILT gene families. Proc Natl Acad Sci USA. (2000) 97:4778–83. doi: 10.1073/pnas.080588597
3. Trowsdale J, Barten R, Haude A, Stewart CA, Beck S, Wilson MJ. The genomic context of natural killer receptor extended gene families. Immunol Rev. (2001) 181:20–38. doi: 10.1034/j.1600-065X.2001.1810102.x
4. Martin AM, Kulski JK, Gaudieri S, Witt CS, Freitas EM, Trowsdale J, et al. Comparative genomic analysis, diversity and evolution of two KIR haplotypes A and B. Gene (2004) 335:121–31. doi: 10.1016/j.gene.2004.03.018
5. Jiang W, Johnson C, Jayaraman J, Simecek N, Noble J, Moffatt MF, et al. Copy number variation leads to considerable diversity for B but not A haplotypes of the human KIR genes encoding NK cell receptors. Genome Res. (2012) 22:1845–54. doi: 10.1101/gr.137976.112
6. Moretta L, Moretta A. Killer immunoglobulin-like receptors. Curr Opin Immunol. (2004) 16:626–33. doi: 10.1016/j.coi.2004.07.010
7. Vilches C, Parham P. KIR: diverse, rapidly evolving receptors of innate and adaptive immunity. Ann Rev Immunol. (2002) 20:217–51. doi: 10.1146/annurev.immunol.20.092501.134942
8. Biron CA. Natural killer cell regulation during viral infection. Biochem Soc Trans. (1997) 25:687–90. doi: 10.1042/bst0250687
9. Campbell KS, Purdy AK. Structure/function of human killer cell immunoglobulin-like receptors: lessons from polymorphisms, evolution, crystal structures and mutations. Immunology (2011) 132:315–25. doi: 10.1111/j.1365-2567.2010.03398.x
10. Benson DM, Caligiuri MA. Killer immunoglobulin-like receptors and tumor immunity. Cancer Immunol Res. (2014) 2:99–104. doi: 10.1158/2326-6066.CIR-13-0219
11. Norman PJ, Hollenbach JA, Nemat-Gorgani N, Guethlein LA, Hilton HG, Pando MJ, et al. Co-evolution of human leukocyte antigen (HLA) class I ligands with killer-cell immunoglobulin-like receptors (KIR) in a genetically diverse population of sub-Saharan Africans. PLoS Genet. (2013) 9:e1003938. doi: 10.1371/journal.pgen.1003938
12. Moffett A, Colucci F. Co-evolution of NK receptors and HLA ligands in humans is driven by reproduction. Immunol Rev. (2015) 267:283–97. doi: 10.1111/imr.12323
13. Trowsdale J. The MHC, disease and selection. Immunol Lett. (2011) 137:1–8. doi: 10.1016/j.imlet.2011.01.002
14. Martin MP, Qi Y, Gao X, Yamada E, Martin JN, Pereyra F, et al. Innate partnership of HLA-B and KIR3DL1 subtypes against HIV-1. Nat Genet. (2007) 39:733–40. doi: 10.1038/ng2035
15. Sharma D, Bastard K, Guethlein LA, Norman PJ, Yawata N, Yawata M, et al. Dimorphic motifs in D0 and D1+D2 domains of killer cell Ig-like receptor 3DL1 combine to form receptors with high, moderate, and no avidity for the complex of a peptide derived from HIV and HLA-A*2402. J Immunol. (2009) 183:4569–82. doi: 10.4049/jimmunol.0901734
16. Moesta AK, Norman PJ, Yawata M, Yawata N, Gleimer M, Parham P. Synergistic polymorphism at two positions distal to the ligand-binding site makes KIR2DL2 a stronger receptor for HLA-C than KIR2DL3. J Immunol. (2008) 180:3969–79. doi: 10.4049/jimmunol.180.6.3969
17. Ahn RS, Moslehi H, Martin MP, Abad-Santos M, Bowcock AM, Carrington M, Liao W. Inhibitory KIR3DL1 alleles are associated with psoriasis. Br J Dermatol. (2016) 174:449–51. doi: 10.1111/bjd.14081
18. Hollenbach JA, Pando MJ, Caillier SJ, Gourraud P-A, Oksenberg JR. The killer immunoglobulin-like receptor KIR3DL1 combination with HLA-Bw4 is protective against multiple sclerosis in African Americans. Genes Immun. (2016) 17:199–202. doi: 10.1038/gene.2016.5
19. Petersdorf EW, Anasetti C, Martin PJ, Gooley T, Radich J, Malkki M, et al. Limits of HLA mismatching in unrelated hematopoietic cell transplantation. Blood (2004) 104:2976–80. doi: 10.1182/blood-2004-04-1674
20. Kollman C, Spellman SR, Zhang MJ, Hassebroek A, Anasetti C, Antin JH, et al. The effect of donor characteristics on survival after unrelated donor transplantation for hematologic malignancy. Blood (2016) 127:260–7. doi: 10.1182/blood-2015-08-663823
21. Cooley S, Weisdorf DJ, Guethlein LA, Klein JP, Wang T, Marsh SGE, et al. Donor killer-cell immunoglobulin-like receptor B haplotypes, recipient HLA-C1 and HLA-C mismatch enhance the clinical benefit of unrelated transplantation for acute myelogenous leukemia. J Immunol. (2014) 192:4592–600. doi: 10.4049/jimmunol.1302517
22. Venstrom JM, Pittari G, Gooley TA, Chewning JH, Spellman S, Haagenson M, et al. HLA-C-dependent prevention of leukemia relapse by donor activating KIR2DS1. N Engl J Med. (2012) 367:805–16. doi: 10.1056/NEJMoa1200503
23. Ludajic K, Balavarca Y, Bickeböller H, Rosenmayr A, Fae I, Fischer GF, et al. KIR genes and KIR ligands affect occurrence of acute GVHD after unrelated, 12/12 HLA matched, hematopoietic stem cell transplantation. Bone Marrow Transplant. (2009) 44:97–103. doi: 10.1038/bmt.2008.432
24. Witt CS. The influence of NK alloreactivity on matched unrelated donor and HLA identical sibling haematopoietic stem cell transplantation. Curr Opin Immunol. (2009) 21:531–7. doi: 10.1016/j.coi.2009.08.004
25. Cooley S, Weisdorf DJ, Guethlein LA, Klein JP, Wang T, Le CT, et al. Donor selection for natural killer cell receptor genes leads to superior survival after unrelated transplantation for acute myelogenous leukemia. Blood (2010) 116:2411–9. doi: 10.1182/blood-2010-05-283051
26. Zhao XY, Chang YJ, Xu LP, Zhang XH, Liu KY, Li D, et al. HLA and KIR genotyping correlates with relapse after T-cell-replete haploidentical transplantation in chronic myeloid leukaemia patients. Br J Cancer (2014) 111:1080–8. doi: 10.1038/bjc.2014.423
27. Mancusi A, Ruggeri L, Urbani E, Pierini A, Massei MS, Carotti A, et al. Haploidentical hematopoietic transplantation from KIR ligand–mismatched donors with activating KIRs reduces nonrelapse mortality. Blood (2015) 125:3173–82. doi: 10.1182/blood-2014-09-599993
28. Weisdorf D, Cooley S, Wang T, Trachtenberg E, Haagenson MD, Vierra-Green C, et al. KIR Donor selection: feasibility in identifying better donors. Biol Blood Marrow Transplant (2018) doi: 10.1016/j.bbmt.2018.08.022. [Epub ahead of print].
29. Schmidt AH, Lange V, Hofmann JA, Schetelig J, Pingel J. KIR genotyping data of more than three million individuals are available for global unrelated stem cell donor searches (Comment to: Weisdorf D, Cooley S, Wang T, et al. KIR donor selection: feasibility in identifying better donors. Biol Blood Marrow Transplant. 2018; doi: 10.1016/j.bbmt.2018.08.022). Biol Blood Marrow Transplant. (2018). doi: 10.1016/j.bbmt.2018.09.020. [Epub ahead of print].
30. Marsh SGE, Parham P, Dupont B, Geraghty DE, Trowsdale J, Middleton D, et al. Killer-cell immunoglobulin-like receptor (KIR) nomenclature report, 2002. Hum Immunol. (2003) 64:648–54. doi: 10.1016/S0198-8859(03)00067-3
31. Norman PJ, Hollenbach JA, Nemat-Gorgani N, Marin WM, Norberg SJ, Ashouri E, et al. Defining KIR and HLA class I genotypes at highest resolution via high-throughput sequencing. Am J Hum Genet. (2016) 99:375–91. doi: 10.1016/j.ajhg.2016.06.023
32. Pyo CW, Guethlein LA, Vu Q, Wang R, Abi-Rached L, Norman PJ, et al. Different patterns of evolution in the centromeric and telomeric regions of group A and B haplotypes of the human killer cell Ig-like receptor locus. PLoS ONE (2010) 5:e15115. doi: 10.1371/journal.pone.0015115
33. Faure M, Long EO. KIR2DL4 (CD158d), an NK cell-activating receptor with inhibitory potential. J Immunol. (2002) 168:6208–14. doi: 10.4049/jimmunol.168.12.6208
34. Gómez-Lozano N, Vilches C. Genotyping of human killer-cell immunoglobulin-like receptor genes by polymerase chain reaction with sequence-specific primers: an update. Tissue Antigens (2002) 59:184–93. doi: 10.1034/j.1399-0039.2002.590302.x
35. Ashouri E, Ghaderi A, Reed EF, Rajalingam R. A novel duplex SSP–PCR typing method for KIR gene profiling. Tissue Antigens (2009) 74:62–7. doi: 10.1111/j.1399-0039.2009.01259.x
36. Houtchens KA, Nichols RJ, Ladner MB, Boal HE, Sollars C, Geraghty DE, et al. High-throughput killer cell immunoglobulin-like receptor genotyping by MALDI-TOF mass spectrometry with discovery of novel alleles. Immunogenetics (2007) 59:525–37. doi: 10.1007/s00251-007-0222-x
37. Lange V, Böhme I, Hofmann J, Lang K, Sauter J, Schöne B, et al. Cost-efficient high-throughput HLA typing by MiSeq amplicon sequencing. BMC Genomics (2014) 15:63. doi: 10.1186/1471-2164-15-63
38. Schöfl G, Lang K, Quenzel P, Böhme I, Sauter J, Hofmann JA, et al. Lange V. 2.7 million samples genotyped for HLA by next generation sequencing: lessons learned. BMC Genom. (2017) 18:161. doi: 10.1186/s12864-017-3575-z
39. Lang K, Wagner I, Schöne B, Schöfl G, Birkner K, Hofmann JA, et al. ABO allele-level frequency estimation based on population-scale genotyping by next generation sequencing. BMC Genom. (2016) 17:374. doi: 10.1186/s12864-016-2687-1
40. Solloch UV, Lang K, Lange V, Böhme I, Schmidt AH, Sauter J. Frequencies of gene variant CCR5-Δ32 in 87 countries based on next-generation sequencing of 1.3 million individuals sampled from 3 national DKMS donor centers. Hum Immunol. (2017) 78:710–7. doi: 10.1016/j.humimm.2017.10.001
41. Milius RP, Mack SJ, Hollenbach JA, Pollack J, Heuer ML, Gragert L, et al. Genotype list string: a grammar for describing HLA and KIR genotyping results in a text string. Tissue Antigens (2013) 82:106–12. doi: 10.1111/tan.12150
42. Mack SJ, Milius RP, Gifford BD, Sauter J, Hofmann J, Osoegawa K, et al. Minimum information for reporting next generation sequence genotyping (MIRING): Guidelines for reporting HLA and KIR genotyping via next generation sequencing. Hum Immunol. (2015) 76:954–62. doi: 10.1016/j.humimm.2015.09.011
43. International Histocompatibility Working Group. Fred Hutch. Available online at: http://www.fredhutch.org/en/labs/clinical/projects/ihwg.html (Accessed October 17, 2018).
44. Robinson J, Halliwell JA, Hayhurst JD, Flicek P, Parham P, Marsh SGE. Nucleic Acids Res. (2015) 43:D423–31. doi: 10.1093/bioinformatics/bth078
45. de Hoon MJL, Imoto S, Nolan J, Miyano S. Open source clustering software. Bioinformatics (2004) 20:1453–4. doi: 10.1093/bioinformatics/bth078
46. Albrecht V, Zweiniger C, Surendranath V, Lang K, Schöfl G, Dahl A, et al. Dual redundant sequencing strategy: full-length gene characterisation of 1056 novel and confirmatory HLA alleles. HLA (2017) 90:79–87. doi: 10.1111/tan.13057
47. Schöfl G, Lang K, Schmidt AH, Lange V. OR30 Dual redundant reference sequencing (DR2S): a computational approach for phase-defined full-length HLA-gene characterization. Hum Immunol. (2016) 77:25. doi: 10.1016/j.humimm.2016.07.042
48. Surendranath V, Albrecht V, Hayhurst JD, Schöne B, Robinson J, Marsh SGE, et al. A fast and efficient automated workflow for the annotation and submission of novel full-length HLA alleles. HLA (2017) 90:25–31. doi: 10.1111/tan.13055
49. Vierra-Green C, Roe D, Hou L, Hurley CK, Rajalingam R, Reed E, et al. Allele-level haplotype frequencies and pairwise linkage disequilibrium for 14 KIR loci in 506 European-American individuals. PLoS ONE (2012) 7:e47491. doi: 10.1371/journal.pone.0047491
50. Béziat V, Hilton HG, Norman PJ, Traherne JA. Deciphering the killer-cell immunoglobulin-like receptor system at super-resolution for natural killer and T-cell biology. Immunology (2017) 150:248–64. doi: 10.1111/imm.12684
51. Nong T, Saito K, Blair L, Tarsitani C, Lee J-H. KIR genotyping by reverse sequence-specific oligonucleotide methodology. Tissue Antigens (2007) 69(Suppl. 1):92–5. doi: 10.1111/j.1399-0039.2006.762_3.x
52. Alves LGT, Rajalingam R, Canavez F. A novel real-time PCR method for KIR genotyping. Tissue Antigens (2009) 73:188–91. doi: 10.1111/j.1399-0039.2008.01184.x
53. Vilches C, Castaño J, Gómez-Lozano N, Estefanía E. Facilitation of KIR genotyping by a PCR-SSP method that amplifies short DNA fragments. Tissue Antigens (2007) 70:415–22. doi: 10.1111/j.1399-0039.2007.00923.x
54. Jiang W, Johnson C, Simecek N, López-Álvarez MR, Di D, Trowsdale J, et al. qKAT: a high-throughput qPCR method for KIR gene copy number and haplotype determination. Genome Med. (2016) 8:99. doi: 10.1186/s13073-016-0358-0
55. Vendelbosch S, de Boer M, Gouw RATW, Ho CKY, Geissler J, Swelsen WTN, et al. Extensive variation in gene copy number at the killer immunoglobulin-like receptor locus in humans. PLoS ONE (2013) 8:e67619. doi: 10.1371/journal.pone.0067619
56. Roberts CH, Jiang W, Jayaraman J, Trowsdale J, Holland MJ, Traherne JA. Killer-cell immunoglobulin-like receptor gene linkage and copy number variation analysis by droplet digital PCR. Genome Med. (2014) 6:20. doi: 10.1186/gm537
57. Boudreau JE, Luduec J-BL, Hsu KC. Development of a novel multiplex PCR assay to detect functional subtypes of KIR3DL1 alleles. PLoS ONE (2014) 9:e99543. doi: 10.1371/journal.pone.0099543
58. Gonzalez A, Meenagh A, Sleator C, Middleton D. Investigation of killer cell immunoglobulin-like receptor (KIR) gene diversity: KIR2DL2, KIR2DL5, and KIR2DS5. Tissue Antigens (2008) 72:11–20. doi: 10.1111/j.1399-0039.2008.01050.x
59. Hou L, Chen M, Steiner N, Kariyawasam K, Ng J, Hurley CK. Killer cell immunoglobulin-like receptors (KIR) typing by DNA sequencing. Methods Mol Biol. (2012) 882:431–68. doi: 10.1007/978-1-61779-842-9_25
60. Norman PJ, Abi-Rached L, Gendzekhadze K, Korbel D, Gleimer M, Rowley D, et al. Unusual selection on the KIR3DL1/S1 natural killer cell receptor in Africans. Nat Genet. (2007) 39:1092–9. doi: 10.1038/ng2111
61. Lebedeva TV, Ohashi M, Zannelli G, Cullen R, Yu N. Comprehensive approach to high-resolution KIR typing. Hum Immunol. (2007) 68:789–96. doi: 10.1016/j.humimm.2007.07.002
62. Farag SS, Fehniger TA, Ruggeri L, Velardi A, Caligiuri MA. Natural killer cell receptors: new biology and insights into the graft-versus-leukemia effect. Blood (2002) 100:1935–47. doi: 10.1182/blood-2002-02-0350
63. Boudreau JE, Mulrooney TJ, Luduec J-BL, Barker E, Hsu KC. KIR3DL1 and HLA-B Density and binding calibrate NK education and response to HIV. J Immunol. (2016) 196:3398–410. doi: 10.4049/jimmunol.1502469
64. Alicata C, Pende D, Meazza R, Canevali P, Loiacono F, Bertaina A, et al. Hematopoietic stem cell transplantation: improving alloreactive Bw4 donor selection by genotyping codon 86 of KIR3DL1/S1. Eur J Immunol. (2016) 46:1511–7. doi: 10.1002/eji.201546236
65. Giglio F, Gooley TA, Venstrom JM, Gallagher MM, Hou L, Hurley CK, et al. Donor KIR3DL1 and HLA-B allotypes control leukemia relapse after allogeneic hematopoietic stem cell transplantation. Blood (2012) 120:349. Available online at: http://www.bloodjournal.org/content/120/21/349
66. Shaffer BC, Heller G, Luduec JBL, Vahradian J, Perales M, Giralt SA, et al. Selection of unrelated allogeneic hematopoietic cell donors based on KIR3DL1 allotypes is feasible and results in improved disease-free survival in transplant recipients with MDS and AML. Blood (2016) 128:990. Available online at: http://www.bloodjournal.org/content/128/22/990
Keywords: next generation sequencing, NGS, KIR genotyping, KIR, killer cell immunoglobulin-like receptors, allele-level resolution, high-throughput
Citation: Wagner I, Schefzyk D, Pruschke J, Schöfl G, Schöne B, Gruber N, Lang K, Hofmann J, Gnahm C, Heyn B, Marin WM, Dandekar R, Hollenbach JA, Schetelig J, Pingel J, Norman PJ, Sauter J, Schmidt AH and Lange V (2018) Allele-Level KIR Genotyping of More Than a Million Samples: Workflow, Algorithm, and Observations. Front. Immunol. 9:2843. doi: 10.3389/fimmu.2018.02843
Received: 23 October 2018; Accepted: 19 November 2018;
Published: 04 December 2018.
Edited by:
Ronald Bontrop, Biomedical Primate Research Centre, NetherlandsReviewed by:
Amir Horowitz, Icahn School of Medicine at Mount Sinai, United StatesStephen K. Anderson, National Cancer Institute at Frederick, United States
Copyright © 2018 Wagner, Schefzyk, Pruschke, Schöfl, Schöne, Gruber, Lang, Hofmann, Gnahm, Heyn, Marin, Dandekar, Hollenbach, Schetelig, Pingel, Norman, Sauter, Schmidt and Lange. This is an open-access article distributed under the terms of the Creative Commons Attribution License (CC BY). The use, distribution or reproduction in other forums is permitted, provided the original author(s) and the copyright owner(s) are credited and that the original publication in this journal is cited, in accordance with accepted academic practice. No use, distribution or reproduction is permitted which does not comply with these terms.
*Correspondence: Vinzenz Lange, lange@dkms-lab.de