 Dennis O. Omondi1,2
 Mathews M. Dida1*
 Dave K. Berger3
 Yoseph Beyene4
 David L. Nsibo3
 Collins Juma4,2
 Suresh L. Mahabaleswara4
 Manje Gowda4*
- 1Department of Crops and Soil Sciences, School of Agriculture, Food Security and Environmental Sciences, Maseno University, Kisumu, Kenya
- 2Crop Science Division Bayer East Africa Limited, Nairobi, Kenya
- 3Department of Plant and Soil Sciences, Forestry and Agricultural Biotechnology Institute (FABI), University of Pretoria, Pretoria, South Africa
- 4The Global Maize Program, International Maize and Wheat Improvement Center (CIMMYT), Nairobi, Kenya
Among the diseases threatening maize production in Africa are gray leaf spot (GLS) caused by Cercospora zeina and northern corn leaf blight (NCLB) caused by Exserohilum turcicum. The two pathogens, which have high genetic diversity, reduce the photosynthesizing ability of susceptible genotypes and, hence, reduce the grain yield. To identify population-based quantitative trait loci (QTLs) for GLS and NCLB resistance, a biparental population of 230 lines derived from the tropical maize parents CML511 and CML546 and an association mapping panel of 239 tropical and sub-tropical inbred lines were phenotyped across multi-environments in western Kenya. Based on 1,264 high-quality polymorphic single-nucleotide polymorphisms (SNPs) in the biparental population, we identified 10 and 18 QTLs, which explained 64.2% and 64.9% of the total phenotypic variance for GLS and NCLB resistance, respectively. A major QTL for GLS, qGLS1_186 accounted for 15.2% of the phenotypic variance, while qNCLB3_50 explained the most phenotypic variance at 8.8% for NCLB resistance. Association mapping with 230,743 markers revealed 11 and 16 SNPs significantly associated with GLS and NCLB resistance, respectively. Several of the SNPs detected in the association panel were co-localized with QTLs identified in the biparental population, suggesting some consistent genomic regions across genetic backgrounds. These would be more relevant to use in field breeding to improve resistance to both diseases. Genomic prediction models trained on the biparental population data yielded average prediction accuracies of 0.66–0.75 for the disease traits when validated in the same population. Applying these prediction models to the association panel produced accuracies of 0.49 and 0.75 for GLS and NCLB, respectively. This research conducted in maize fields relevant to farmers in western Kenya has combined linkage and association mapping to identify new QTLs and confirm previous QTLs for GLS and NCLB resistance. Overall, our findings imply that genetic gain can be improved in maize breeding for resistance to multiple diseases including GLS and NCLB by using genomic selection.
1 Introduction
Despite its importance, maize production in Kenya is still low with an estimated average production of 1.8 t/ha-1 among smallholder farmers when compared to the country’s potential production yield of 6 t/ha-1 (Munialo et al., 2019). This is partly due to the threat of highly destructive and virulent fungal pathogens limiting crop production (Beyene et al., 2019). In this context, northern corn leaf blight (NCLB), also known as northern leaf blight (NLB) or Turcicum leaf blight (TLB), caused by Exserohilum turcicum (Pass.) (Leonard and Suggs, 1974), and gray leaf spot (GLS) caused by Cercospora zeina Crous & U Braun (Crous et al., 2006) on the African continent (Nsibo et al., 2019; Nsibo et al., 2021) are the most lethal and economically significant foliar diseases of maize (Beyene et al., 2019; Sserumaga et al., 2020).
The two diseases reduce the photosynthetic potential of a plant and eventually decrease the grain yield (Saito et al., 2018). GLS is characterized by tan-to-gray rectangular lesions that are limited within the leaf veins (Korsman et al., 2012). It is associated with yield losses of approximately 30%–50%, particularly when using susceptible lines (Kinyua et al., 2010). On the other hand, NCLB is characterized by long elliptical cigar-shaped lesions on leaves that are gray–green (Welz, 1998). NCLB or TLB has been reported to cause yield reductions of 36%–72% in susceptible maize genotypes (Berger et al., 2020). The high genetic diversity reported for C. zeina and E. turcicum in Kenya (Borchardt et al., 1998; Nsibo et al., 2021) could lead to recombining pathogen populations, hence posing a greater risk to the vulnerable susceptible lines (McDonald and Linde, 2002). Therefore, there is a need to continuously discover new sources of resistance.
The doubled haploid (DH) technology offers the fastest alternative to achieve 100% homozygosity (attained in two generations) which is essential for a mapping population and population improvement (Prasanna et al., 2021). To complement the DH technology, genotyping by sequencing platforms such as Diversity Arrays Technology (DArT) offers a high-throughput platform for genotyping single-nucleotide polymorphism (SNP) markers (Kilian et al., 2012; Sansaloni et al., 2020). The DArTseq platform is purposefully a powerful tool for genome-wide discovery of SNP markers without prior sequence information (Wenzl et al., 2004). In addition, it generates high-density linkage maps, and it is also cost-competitive (Jaccoud et al., 2001; Sánchez-Sevilla et al., 2015).
Complex traits such as GLS and NCLB resistance are controlled by polygenic genes with minor effects that are distributed throughout the genome (Welz and Geiger, 2000; Wisser et al., 2006; Poland et al., 2011; Van Inghelandt et al., 2012; Chen et al., 2015; Ding et al., 2015). Mapping of the quantitative trait loci (QTLs) based on linkage analysis is a powerful tool for identifying the genomic regions associated with the traits of interest. Previous QTL studies have mapped QTL for resistance to GLS and NCLB on all 10 maize chromosomes (Berger et al., 2014; Chen et al., 2015). A number of these QTLs have been fine-mapped with others cloned and the molecular mechanisms underlying such QTL characterized. Additionally, QTL mapping offers the advantage of mapping as early as at the F2 populations; however, this is characterized by the limited number of recombination events captured and sizeable confidence interval (Challa and Neelapu, 2018; Rashid et al., 2020).
Genome-wide association studies (GWAS) attempt to overcome the drawbacks of QTL mapping as they utilize age-old recombination events in a large array of unrelated individuals leading to high-speed decay of linkage disequilibrium (Xiao et al., 2017; Kolkman et al., 2020). GWAS studies dig into the entire genome of different varieties (considering the SNPs present in the genotypic data) to establish the link between genotypic variations and the corresponding trait (Challa and Neelapu, 2018). Kibe et al. (2020a) combined the use of linkage mapping and GWAS to detect the significant SNPs and QTL conditioning resistance to GLS in an Improved Maize for African Soils (IMAS) diversity panel and a set of DH populations in Kenya. Several putative candidate genes involved in the transportation channel were identified to have a role in plant defense. In the present study, we attempted to validate some of the GLS resistance QTLs reported in the study by Kibe et al. (2020a) by using a common tropical parent CML511.
Genomic prediction (GP) is another promising genomic tool that has been applied successfully in plant breeding programs (Crossa et al., 2017). Previous studies indicated the potential of GP to increase genetic gain and reduce the time taken in breeding programs significantly (Beyene et al., 2019; Kibe et al., 2020a; Kibe et al., 2020b). In contrast to genetic mapping which identifies significant marker–trait associations, GP uses all markers available to estimate their effects, thus providing a powerful approach to account for any effects that might have been missed by either genetic or association mapping (Beyene et al., 2019). GP exhibits a close relationship to GWAS owing to the large genomic and phenotypic datasets used by the methods (Beyene et al., 2021).
However, this does not mean the complete withdrawal of genetic mapping but rather the incorporation of the two in genetic studies as complementary approaches since each provides considerable advantages. With this background, the objectives of this study were as follows: (1) to phenotypically characterize an elite tropical DH population and 240 tropical and sub-tropical maize inbred lines panel for their responses to GLS and NCLB, including correlation with other agronomic traits; (2) to identify population-based common QTL regions and significant SNPs using GWAS and linkage mapping; and (3) to assess the usefulness of GP in breeding for GLS and NCLB resistance in tropical maize.
2 Materials and methods
2.1 Study sites and genetic material
This study used (i) a biparental DH population derived from the tropical×tropical germplasm CML511×CML546 inbred lines and (ii) an association panel made up of a collection of 239 tropical and sub-tropical maize inbred lines with early and intermediate maturity in Eastern Africa, representing some of the genetic diversity (for low N, drought, and biotic stresses, Beyene et al., 2021; Prasanna et al., 2021). The association panel was evaluated in three locations in western Kenya, at Kitale (1.0191° N and 35.0023° E, 1900 masl); Shikutsa (0°16′57.83″N and 34°45′6.71″E, 1561 masl); and Kakamega (0°17′3.19″N and 34°45′8.24″E, 1535 masl). The biparental population was evaluated across different ecologies in western Kenya; Maseno University field demonstration site in 2018 (0°00′18.2″S and 34°35′43.5″E, 1500masl), Maseno 2019 (0°00′07.0″S and 34°35′41.9″E, 1503 masl), and farmer’s field in Kabianga 2018 (0°25′24.1″S and 35°07′31.7″E, 1780 masl).
2.2 Experimental design
Two hundred and thirty (230) entries (228 DH lines and two parents) of the biparental population were planted in a 5 × 46 alpha lattice design, randomized, and replicated three times at each site by using the CIMMYT’s field book (Vivek et al., 2007). The association panel was also planted in 5 × 48 alpha lattice design, randomized, and replicated two times in each of three environments. Experimental plots consisted of 3 m long single rows with the rows spaced at 0.6 m apart. Adjacent plots were planted 0.75 m apart with an alley of 1.2 m at the end of each plot. Each plot was planted with 13 hills, with two seeds getting planted per hill. Thinning was later conducted to one plant per hill. Border rows of susceptible genotypes were also planted to act as spreaders of the pathogen. The experimental plots were managed using standard agronomic practices.
2.3 Phenotypic evaluation and data collection
GLS and NCLB disease severity (DS) were scored on a per-row basis using an ordinal 1–9 scale adapted from the work of Berger et al. (2014) for GLS and Berger et al. (2020) for NCLB. For DH population, DS ratings for GLS and NCLB were taken once per week for at least 5 weeks starting on average at 15 days after flowering (R2; reproductive stage two). All the data were collected using the CIMMYT’s field book (Vivek et al., 2007). The DS scale was used as follows: score 1 for no GLS or NCLB lesions visible on the entire plant, 2 indicated close inspection of each leaf is necessary to find lesions, 3 indicated lesions are more easily seen but are majorly restricted to leaves lying below the ears, 4 indicated individual lesions are just becoming visible on the ear leaf and the leaves above the ears, 5 indicated lesions are more visible on the leaves above the ears, with the infections capturing <10% of the top leaves, 6 indicated lesions are more easily seen on the leaves above the ear leaf with infections covering >10% of the leaf area, 7 for GLS and NCLB lesions dominating the leaf area on all the leaves with 50% of the maize leaf surface diseased, 8 for GLS and NCLB lesions prevalent on all the leaves of the maize plant with 80% of the maize leaf surface diseased, and 9 for GLS and NCLB lesions prevalent on all the leaves of the maize plant with the maize plant exhibiting a gray appearance with >80% of the maize leaf area diseased. For both GLS and NCLB, the DS scores over five intervals were used to calculate the area under the disease progress curve (AUDPC, Shaner, 1977). For the GWAS panel, both DS data were recorded at the dough stage of the plants. For DH population, data were also collected on days to anthesis (AD, the number of days from planting to when 50% of the plants in a plot were shedding pollen), days to silking (SD, the number of days from planting to when 50% of maize crops in a plot were showing silk), plant height (PH, cm), and ear height (EH, cm). Maize development stages were recorded using the scale of Purdue University (http://extension.entm.purdue.edu/fieldcropsipm/corn-stages.php).
2.4 Statistical analysis of the phenotypic data
Multi-environment trial analysis with R for windows (META-R) version 6.0 (Alvarado et al., 2015) was used to obtain the best linear unbiased estimations (BLUEs) and best linear unbiased predictions (BLUPs). In addition to BLUEs and BLUPs, META-R was also used to compute the genetic correlations among all the variables and among environments, least significant difference (LSD), grand mean, variance components, coefficients of variation (CV), and broad-sense heritability for all the variables. Analysis of the phenotypic data for both biparental population and association panel was conducted both within and across environments.
The BLUEs and the BLUPs were calculated for DS of GLS and NCLB, PH, EH, AD, SD, and the AUDPC which were the response variables. The columns in the input files were selected to be the factor names with the environment, replicate, block, and genotype as the independent variables. For analysis across environments using a lattice design, the following linear mixed model was used.
Yijkl = µ +Envi + Repj(Envi) +Blockk(Envi Repj) +Genl + Envi ×Genl + εijkl.
From the aforementioned equation, Yijkl represents the performance of the trait of interest, µ corresponds to the all-inclusive mean, Envi represents the effect of the ith environment, Repj(Envi) represents the effect of the jth replication within the ith environment, Blockk(Envi Repj) represents the effect of the kth incomplete block within the jth replication in the ith environment, Genl represents the effect of the lth genotype, Envi ×Genl represents the environment by genotype interaction, and εijk is the error variance. When calculating the BLUEs, genotypes and covariates were considered fixed effects of the model while other terms were included as random effects of the model. The covariate was considered as fixed effect of the model while all other terms were included in the random effects of the model to estimate the BLUPs. Heritability for the different traits was calculated as the ratio of the estimated genotypic variance to the estimated phenotypic variance (Knapp et al., 1985).
2.5 Genotyping and QTL mapping
The CML511×CML546 DH and parental lines were grown in a greenhouse. Maize leaf tissue samples were collected from young, healthy seedlings at the V3 stage (3–4 weeks old), stored at −80°C, and later freeze-dried for 72 h. High-quality genomic DNA was isolated from freeze-dried tissues using the standard CIMMYT laboratory protocol (CIMMYT, 2005). The DH lines were genotyped using DArTSeq in Canberra, Australia. Approximately 15,000 SNPs were used for further quality checks (Murithi et al., 2021). Trait Analysis by aSSociation Evolution and Linkage (TaSSEL) (Bradbury et al., 2007) was used to summarize genotype data by site, determine the allele frequencies, and implement quality screening. All SNP variants that were monomorphic between the two parents, had heterozygosity of >0.05 and a minor allele frequency of <0.05, were filtered, and 1,264 high-quality SNPs were retained for QTL mapping.
Redundant markers were removed using the BIN tool in QTL IciMapping v.4.2 (Meng et al., 2015). In the parameter setting window for general information, eight functionalities were used to define the mapping population. In the indicator row, 1 was selected to denote QTL mapping in actual populations and 3 as the population type as this study used a DH population. Kosambi was set as the mapping function, marker position as the marker space type, 10 as the number of chromosomes, 230 as the size of the mapping population, and 6 as the number of traits.
The number of markers in each chromosome was specified in the chromosome information part. The scores for all the DArTseq markers were transformed into genotype codes following the scores of the parents (2 denoted the marker type of the first parent, 0 denoted the second parent, 1 for the F1 marker type, and −1 for the missing markers) (Meng et al., 2015). The genetic linkage maps were constructed using the MAP functionality of QTL IciMapping v.4.2 (http://www.isbreeding.net). Three steps were followed in linkage map construction: grouping, ordering, and rippling. The logarithm of odds score was set at 3.0 for grouping. Ordering was performed using the ordering instruction with the nnTwo Opt algorithm. The sum of adjacent recombination frequencies (SARF) as the criterion and window size of 5 as the amplitude were used to ripple the marker sequence and to fine-tune the chromosome orders. All the outputting functionalities were checked, and the map was drawn using the MAP functionality (Meng et al., 2015).
In the phenotypic data, the BLUPs for the different traits were used as the input files for QTL identification across environments (Littell et al., 2007). The input file was loaded onto the project of IciMapping v.4.2 (Meng et al., 2015). In the parameter setting window ICIM-ADD, other parameters, such as step in scanning represented by cM and stepwise regression of phenotype on marker variables, were defined. An LOD threshold of 3.0 and 1000 permutations at α = 0.01 were set to declare the significant QTL. The percentage of total phenotypic variance explained by an individual QTL was determined using stepwise regression. To ascertain the actual locations of the QTL for all the traits on the chromosomes, the physical position of the identified QTL was assigned based on the known physical position of the linked markers and also available at the maize genetics and genomics database (http://www.maizegdb.org/data_center/map), as described by Berger et al. (2014). The individual QTLs were assigned names according to the QTL, trait name, chromosome, and marker position, as described in the work of Kibe et al. (2020a).
2.6 Genotyping and association mapping
The DNA of all 239 inbred lines of the association panel was extracted from seedlings at the 3–4 leaf stage and genotyped using the genotype-by-sequencing (GBS) platform at the Institute for Genomic Diversity, Cornell University, Ithaca, United States, using high-density markers, as per the procedure described by Elshire et al. (2011). SNP calling and imputation were conducted at Cornell University. For SNP calling, raw data in a FASTQ file together with the barcode information and Tags On Physical Map (TOPM) data, which had SNP position information, were used. We used TOPM data from AllZeaGBSv2.7 downloaded from Panzea (https://www.panzea.org/), which contained information for 955,690 SNPs mapped with B73 AGPv2 coordinates. SNP calling was then performed using the TASSEL-GBS pipeline (Glaubitz et al., 2014; Wang et al., 2020). Using TASSEL ver5.2 (Bradbury et al., 2007), SNPs with a heterozygosity of >5%, MAF of >0.05, and minimum count of 90% were excluded by filtering from raw GBS datasets, and 230,743 high-quality SNPs were retained for further analysis in the association panel. To explore the population structure and the ultimate number of subpopulations, principal component analysis (PCA) as described by Price et al. (2006) was conducted in TASSEL using SNPs across all panels. The first three principal components were instrumental to visualize the existing population stratification within the association panel, and this was clearly displayed in a 3D plot. The PCA plots of the association panel were computed using 230,743 SNPs; we then plotted the variance (y-axis) against the principal components (x-axis) to estimate the number of clusters within the population (Sanchez et al., 2018). The data point at which the increase in the number of principal components did not result in an increase in variance (leveling off) indicated the number of subgroups within the panel. To estimate the amount of genetic relatedness among individuals, a kinship matrix was explored.
GWAS was performed with different models to compare and choose the appropriate model with relatively less false positives. To detect marker–trait associations, GWAS was performed using the following models: (1) mixed linear models (MLMs; PCA + K + G) that incorporated PCA, kinship (K), and genotypic data as covariates; (2) the general linear model (GLM; PCA + G) which incorporated the genotype data (G) and the PCA (Q) that both acted as fixed effects to correct for the population structure; and (3) Fixed and random model Circulating Probability Unification (FarmCPU), in which the kinship (random) and the three-component analysis (fixed) were identified as covariates (Lipka et al., 2012). Single-locus GWAS models such as the GLM are characterized by high false positive rates, as a complementary model, and the MLM utilizes the Bonferroni correction to overcome the challenge of false positive rates and identify the loci of interest (Khan et al., 2021). The software TASSEL (Bradbury et al., 2007) was instrumental to run the GLM + PCA and MLM. The − log 10 p values for all the analyzed SNPs for both GLS-DS and NCLB-DS were used to construct the Manhattan plots. Q–Q plots were plotted from the estimated -log10 (p) from the association panel for GLS-DS and NCLB_DS traits. Analysis of the association panel was conducted in TASSEL based on 230,743 filtered SNPs. The R package ‘FarmCPU’ with the Genome Association and Prediction Integrated Tool (GAPIT) was used for GWAS analysis (Tang et al., 2016). The false discovery rate (FDR) was calculated for significant associations using the Benjamini and Hochberg (1995) correction method, with 8 × 10⁻⁵ as the threshold. To summarize GWAS results per chromosome, Manhattan scatter plots were generated by plotting genomic positions of the SNPs against their negative log base 10 of the p-values obtained from the GWAS model, with the F-test for the null hypothesis on the y-axis.
SNPs detected in the association panel were examined as polymorphisms in linkage disequilibrium with putative candidate genes from the B73 reference gene set (https://phytozome-next.jgi.doe.gov/jbrowse/index.html?data; Zea mays Zm-B73-REFERENCE-NAM-5.0.55) (Goodstein et al., 2012). Putative candidate genes were selected by delving into the information from Gene Ontology, Kyoto Encyclopedia of Genes and Genomes (KEGG), and protein families (Pfam) (Ashburner et al., 2000; Kanehisa and Goto, 2000; Bateman et al., 2004).
Genomic prediction was carried out with ridge regression BLUP (Zhao et al., 2012) within a biparental DH population for GLS, NCLB, and agronomic traits at five-fold cross-validation. The BLUEs across environments were used for the analysis. The same set of 1,264 high-quality uniformly distributed SNPs with no missing values and MAF>0.05 were used. For the maize association panel, quality screening criteria of SNPs with MAF >0.10 and no missing values were applied, and finally, 8,365 SNPs from the 230,743 SNPs were retained for the analyses. The prediction was ‘within population’, where training and validation sets were derived from within the biparental population. For each trait, 100 iterations were carried out for the sampling of the training and validation sets. The prediction accuracy was calculated as the correlation between the observed phenotypes and genomic estimated breeding values (GEBVs) divided by the square root of heritability (Dekkers, 2007).
3 Results
3.1 Phenotypic data
As expected for western Kenya, there was high natural disease pressure for both NCLB and GLS for all field trials of the biparental CML511×CML546 DH population (Figure 1A), as well as the association panel (Figure 1B). DS scores for both NCLB and GLS were highest at the final disease rating time point in all field trials, which corresponded in most cases to the last disease rating time point (Supplementary Table S1). A significant difference in resistance to NCLB was reported for the two parents CML511 and CML546 (p-value = 0.011831, α < 0.05). Our data show that CML511 is moderately susceptible and CML546 is more resistant to NCLB. On the other hand, the two parents differed slightly but not significantly in resistance to GLS (p-value = 0.200588, α < 0.05). For GLS, CML511 had an average score of 2.47 at the final rating, while CML546 had an average score of 4.0 at the final average DS score (Supplementary Figure S1). These evaluations show that CML511 is resistant and CML546 is moderately susceptible to GLS. A large portion of the biparental population was extensively blighted by NCLB. Transgressive segregation was observed in the population for GLS, NCLB, and AD, as some of the genotypes were more resistant or susceptible compared to the parental lines in the biparental population (Figure 1).
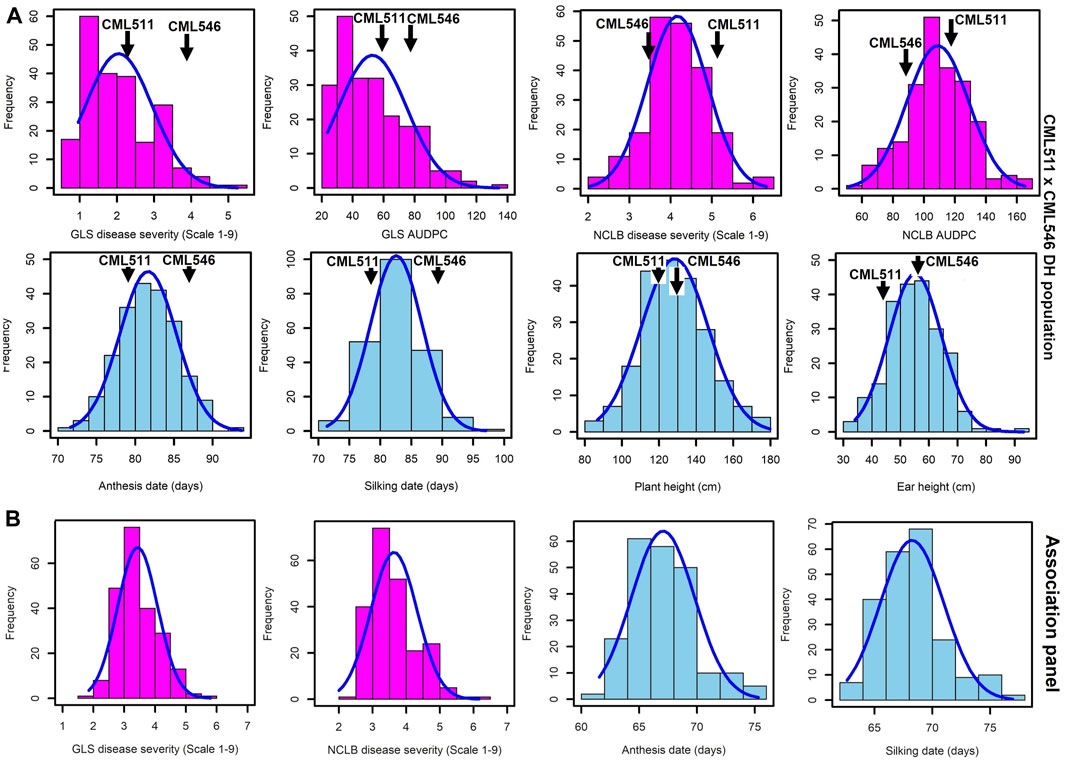
FIGURE 1. Frequency distributions for GLS, NCLB disease, and other agronomic traits, namely, anthesis date, silking date, plant height, and ear height, evaluated across the three locations in western Kenya. (A). Biparental CML511×CML546 DH population of 230 lines. (B). Association panel of 239 sub-tropical and tropical maize lines across the three locations. DS scores were for the last rating time point.
The frequency distribution of GLS DS scores was fairly skewed toward resistance in the biparental population (Figure 1A). The frequency distribution of the DS scores for NCLB in the biparental population followed an approximately normal distribution, as shown in Figure 1A. The wide segregation of DS and AUDPC scores for NCLB provided more evidence for the quantitative control of resistance. The DH population also exhibited continuous distribution for the days to anthesis, days to silking, plant height, and ear height (Figure 1A). The GLS and NCLB DS scores for the maize association panel ranged from 1.5 to 6 (Figure 1B), which were similar to the biparental DH population scores, although the association panel trended toward higher GLS and lower NCLB scores. On the other hand, the use of the nine-point rating scale revealed extensive phenotypic variation in resistance to GLS and NCLB across the association panel, with the panel harboring more resistant lines (Figure 1B). The association panel was also characterized by shorter days to anthesis compared to the biparental population (Figure 1B).
3.2 Correlations between environments and variables
In the DH population, the correlation between environments for GLS DS was positive and highly significant (p < 0.001) (Supplementary Table S2). A moderately high correlation was observed between environments for NCLB DS scores (Supplementary Table S2). The correlation across environments for AD and SD was also highly significant at p < 0.001 (Supplementary Table S2).
The analyses of variance revealed significant genotypic and genotype × environment interaction variances for GLS, NCLB DS, and AUDPC values as well as other agronomic traits (Table 1). Heritability estimates on an entry mean basis were 0.81, 0.81, 0.79, and 0.80 (Table 1) for GLS DS, AUDPC for GLS, NCLB DS, and AUDPC for NCLB, respectively in the DH population. However, the heritability estimates for DS in the association mapping panel were lower (0.35 for GLS and 0.64 for NCLB).

TABLE 1. Estimates of means, components of genotypic (σ2G), genotype × environment interaction (σ2GxE), error variances (σ2e), and heritability (h2) for the biparental CML511×CML546 DH population and the association panel evaluated across three environments each for GLS, NCLB, and other agronomic traits.
Interestingly, the correlation analyses in the DH population showed low positive significant correlation between GLS (and AUDPC_GLS) and NCLB (Figure 2), indicating that there are different genomic loci that explain the variance for each disease. The agronomic traits for reproductive traits, namely, flowering time (AD) and days to silking (SD), were significantly negatively correlated with DS and AUDPC for both GLS and NCLB diseases (Figure 3). This indicated that maize lines with earlier maturity had higher DS. As expected, ear height (EH) was highly correlated with plant height (PH). GLS DS and AUDPC values were weakly correlated with PH and EH, whereas NCLB DS and AUDPC values were positively and significantly correlated with PH and EH (Figure 3). There were weak positive and significant correlations between SD and PH/EH (Figure 3).
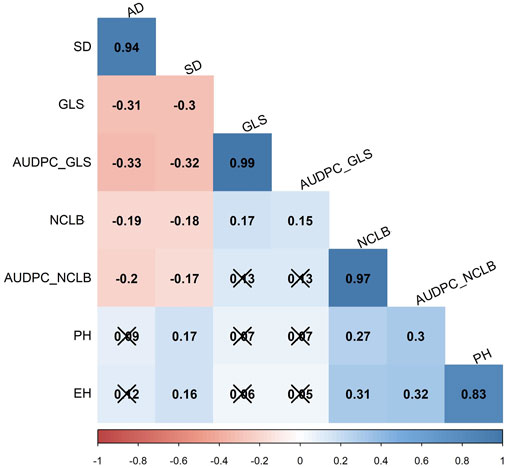
FIGURE 2. Pairwise Pearson correlation analysis for eight traits evaluated in three field trials in the biparental CML511×CML546 DH population. AD, anthesis date; SD, silking date; GLS, gray leaf spot, NCLB, northern corn leaf blight; AUDPC, area under disease progress curve; PH, plant height; and EH, ear height. The x marks indicate values that are not significant at p < 0.05.
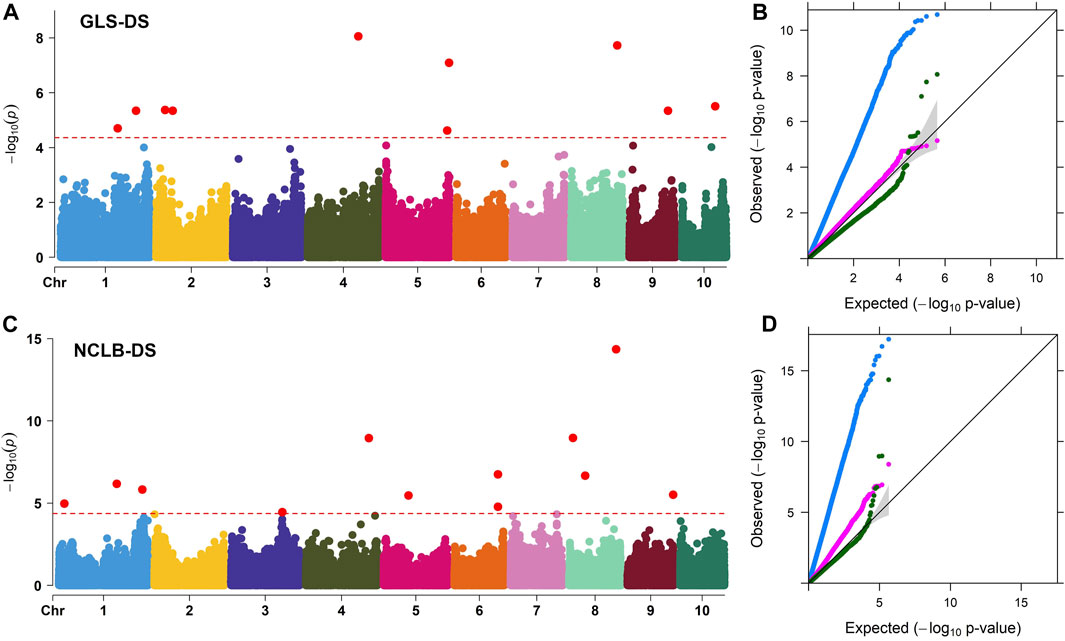
FIGURE 3. (A, C) Manhattan plots for the GWAS of GLS and NCLB disease severity in the maize association mapping panel. The dashed horizontal line of the Manhattan plot depicts the significance threshold value of p < 8 × 10⁻⁵. The x-axis indicates the SNP location along the 10 chromosomes, with chromosomes separated by different colors. Q–Q plots (B, D) of the estimated -log10(p) from association panel for GLS-DS and NCLB_DS traits. The black line bisecting the plot in Q–Q plots represents the expected p-values with no associations present. The blue line represents the observed p-values using the simplest model GLM(PCA + G) where the association between a phenotype and markers is directly detected. The pink line represents the observed p-values using the MLM (PCA + K + G) model. The green line represents the observed p-values using the FarmCPU model. G, genotype (fixed); PCA, three principal components (fixed); and K, kinship matrix (random).
3.3 Construction of the genetic linkage map and QTL analyses
The linkage map for the CML511×CML546 DH population was constructed with a total of 1,264 SNP markers. The genetic linkage map spanned a total map length of 3,344.9 cM with 2.65 cM as the average distance between two adjacent markers. The linkage map, as shown in Supplementary Figure S2, covered most of the maize genome.
Several QTLs associated with resistance to GLS and NCLB with small additive effects were detected through inclusive composite interval mapping. QTL analyses revealed 10 QTLs distributed on chromosomes 1, 2, 3, 5, 7, 9, and 10 for GLS DS which individually explained 2.6%–15.2% of phenotypic variance and together explained 64.19% of total phenotypic variance (Table 2). All 10 QTLs detected for GLS DS were also consistently detected for GLS AUDPC values (Supplementary Table S3). For NCLB DS, 13 QTLs distributed in all chromosomes except for chromosomes 9 and 10, individually explained 2.2%–8.7% which together contributed 64.94% of total phenotypic variation. AUDPC values for NCLB revealed nine QTLs together explained 45% of total phenotypic variance (Supplementary Table S3). Three QTLs on chromosomes 3, 6, and 7 were consistent across NCLB DS and AUDPC values. Among the agronomic traits, for AD, nine QTLs detected together explained 63% of the total phenotypic variance, and one QTL on chromosome 8 (qAD8_137) was a major effect QTL which explained 15.84% of phenotypic variance ((Supplementary Table S4). For SD, six QTLs were detected which together explained 60% of the total phenotypic variance. There were three QTLs on chromosomes 1, 4, and 8 that were consistent for both AD and SD. For PH, four QTLs were identified which together explained 52% of total phenotypic variance. One major effect QTL (qPH8_129) detected on chromosome 8 explained 22% of phenotypic variance. For EH, six minor effect QTLs and one major effect (qEH8_128) QTL were detected which together explained 56% of total phenotypic variance. QTL mapping predominantly revealed that the additive gene effect defined the gene action for resistance to GLS and NCLB.
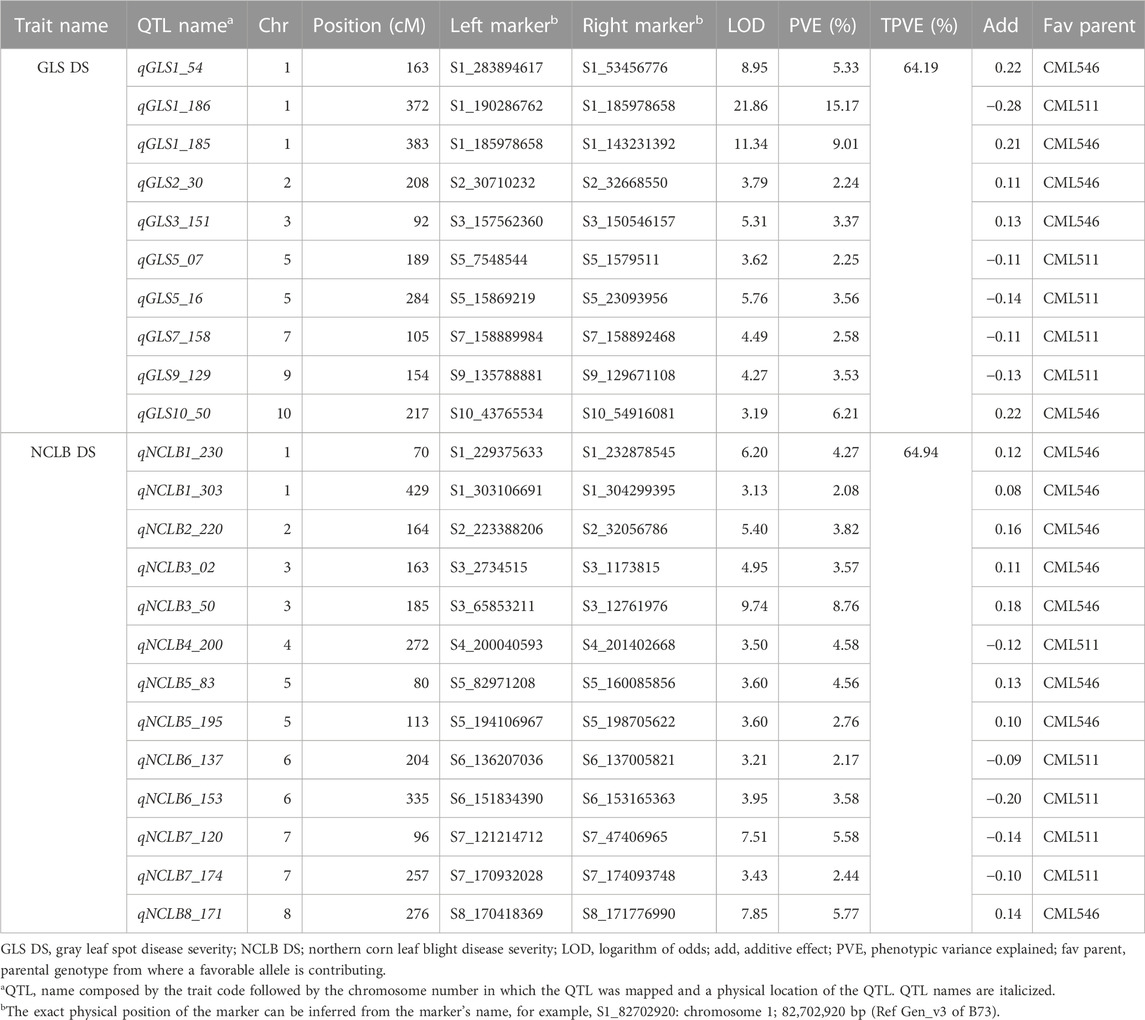
TABLE 2. QTL detected by integrated composite interval mapping analysis for resistance to GLS and NCLB in the DH population evaluated in multiple locations.
3.4 GWAS analysis
After a quality check of GBS SNP markers, 230,743 SNPs were retained for the final association analyses (Supplementary Figure S3). The kinship matrix for these 239 lines was projected in the form of a heatmap which shows the magnitude of the relationship between the individuals (Supplementary Figure S4). This clearly showed that there is no strong population structure in the association panel used here. PCAs revealed five subpopulations within the panel (Supplementary Figure S5).
Association analyses for GLS DS and NCLB DS data were performed with GLM, MLM, and FarmCPU models (Figure 3). For both GLS and NCLB DS traits, for the GLM model, the observed p-values showed higher deviation from the expected p-values which may cause high false positives. On the other hand, for the MLM model, though the observed p-values were closer to the expected p-values, overfitting of the model is observed. For the FarmCPU model, the observed p-values were close to the expected p values and were more effective in controlling the false positives (Figure 3). The FarmCPU model is known to use both fixed and random effects models iteratively which helps in avoiding overfitting of the model by stepwise regression (Liu et al., 2016). Therefore, in this study, we used the FarmCPU model in the association mapping.
Association analyses revealed 11 and 18 SNPs significantly associated with GLS DS and NCLB DS, respectively (Figure 3; Table 3). For GLS-DS, the identified SNPs were distributed across all chromosomes except for chromosomes 3, 6, and 7 (Figure 3). The Manhattan plot revealed that for GLS DS, the highest peak was reported on chromosomes 4 and 8 (Figure 3A), while for NCLB DS, the highest peak was reported on chromosome 8 (Figure 3C). Furthermore, we determined whether any of these significant GLS or NCLB disease-associated SNPs identified in the association analysis is co-located with the QTL for GLS or NCLB in the biparental DH population. Two SNPs on chromosome 1 (S1_192041854 and S1_253381765) were co-located with qGLS1_54 detected for both GLS DS and AUDPC values in the DH population (Table 2; Table 3). Another SNP on chromosome 9 (S9_130213878) was found to be collocated within the qGLS9_129 and qG_AUDPC9_129 QTL region (Table 2; Table 3). Among the 16 SNPs identified for NCLB, marker S5_83980678 is found to be within the region of NCLB DS QTL qNCLB5_83 (Table 2; Table 3).
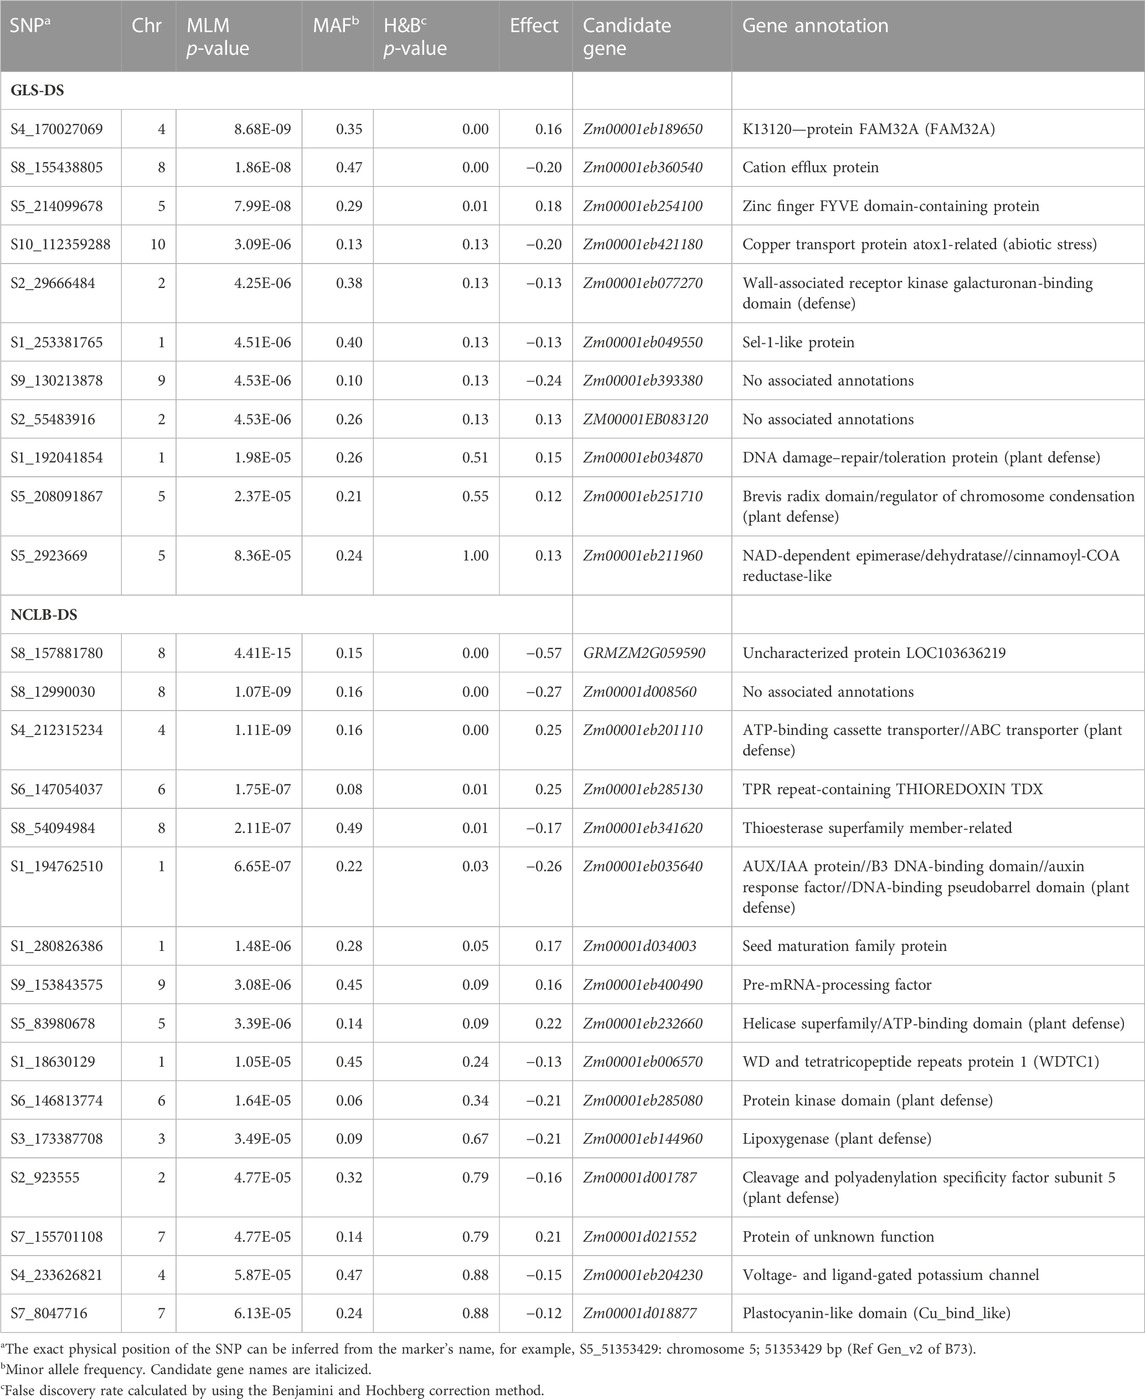
TABLE 3. Chromosomal position and SNPs significantly associated with GLS disease severity (GLS_DS) and northern corn leaf blight disease severity (NCLB-DS) detected by SNP-based GWAS in the association mapping panel.
To elucidate the molecular and physiological mechanisms controlling GLS and NCLB DS, candidate genes were identified. On all chromosomes, a total of 24 candidate genes were discovered (Table 3). Four candidate genes closely associated with the SNPs for GLS resistance were identified, namely, Zm00001eb077270, Zm00001eb034870, Zm00001d017831, and Zm00001eb211960 (Table 3). There were six candidate genes with defense response annotations that were associated with SNPs for NCLB resistance (Zm00001eb201110, Zm00001eb035640, Zm00001eb232660, Zm00001eb285080, Zm00001eb144960, and Zm00001d001787) (Table 3).
Genomic prediction captures all variations from small to large effects, which helps in improving complex traits. Prediction correlations obtained from cross-validations are commonly used to know the effectiveness of genomic predictions for different traits. In this study, we applied genomic predictions within the DH population and association panel for disease traits and also for agronomic traits (Figure 4).
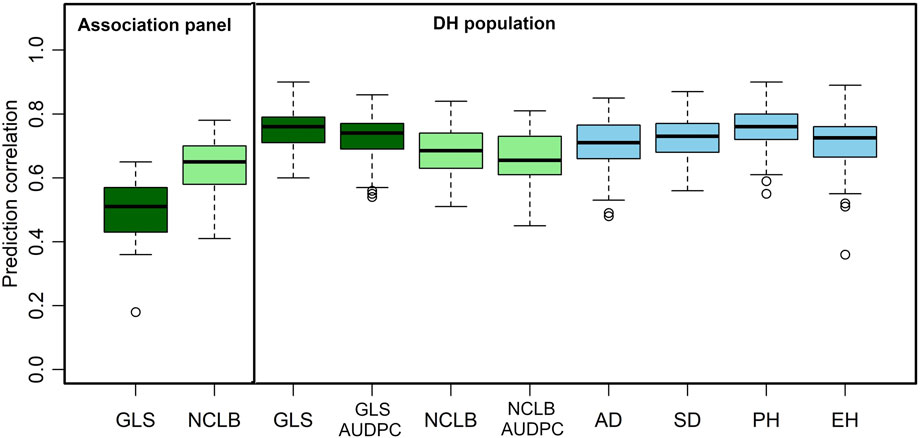
FIGURE 4. Box-whisker plots for the accuracy of genomic predictions assessed by five-fold cross-validation within association and DH population. AD, days to anthesis; SD, days to silking; PH, plant height; EH, ear height; GLS, gray leaf spot; AUDPC, area under the disease progress curve; NCLB, northern corn leaf blight.
As expected, the mean prediction correlations for the DS traits were higher in the DH population (GLS DS = 0.75, NCLB DS = 0.68) than those in the association panel (GLS DS = 0.63, NCLB = 0.49) (Figure 4). This was because of the highly relatedness among the DH lines compared to the lines in the association panel. In addition, relatively high-average prediction correlations were obtained for the other traits when validated in the DH population, namely, 0.73, 0.66, 0.71, 0.72, 0.75, and 0.71 for GLS-AUDPC, NCLB-AUDPC, AD, SD, PH, and EH, respectively.
4 Discussion
GLS and NCLB are economically important foliar diseases of maize. Understanding their genetic basis of resistance is valuable to designing an effective breeding strategy (Beyene and Prasanna, 2020). The DH population used in this study was artificially inoculated with GLS; however, the locations evaluated were also a hotspot for NCLB, so we observed both GLS and NCLB disease symptoms in the same population. For early scoring, symptoms for both diseases were clearly distinguishable, which helped to score the data with more accuracy. Scoring at a later stage of disease development was tricky due to bigger blight merging with leaf spots, so for the analyses, we used the third DS score for both GLS and NCLB. The association mapping panel was also evaluated in natural hot spots for GLS and NCLB, and scoring was performed only once at a grain-filling stage when clearly distinguished GLS and NCLB symptoms were observed. Therefore, the collected DS data represent the real response of these lines to the respective diseases. Nevertheless, both diseases appearing at the same growth stage and in the same experiment can lead to some confounding effects. Most of the lines in both the DH population and the association panel fall into the categories of resistant and moderately resistant, with a few in moderately susceptible but none in the completely susceptible category (Figure 1). Overall, the phenotypic data in this study showed a normal distribution for NCLB and GLS DS scores in both the biparental CML511×CML546 DH population and the association panel which supports the quantitative nature of resistance in these diseases (Nyanapah et al., 2020). The parental line CML511 exhibited a moderate level of resistance to GLS congruent with the observations of Kibe et al. (2020a). We also observed significant genotypic and genotype × environment interaction variance and moderate-to-high heritabilities in both the DH population and the association panel, indicating good prospects for introgressing GLS and NCLB resistance in breeding programs. Observed heritability estimates for GLS, NCLB, and other agronomic traits in the DH population are consistent with earlier studies (Wisser et al., 2011; Benson et al., 2015).
4.1 Trait correlations
There were moderate correlations in GLS and NCLB DS scores for the biparental DH population between the field trials, indicating that trait expression was relatively consistent between the evaluated locations (Supplementary Table S2). On the other hand, a significantly negative correlation was observed between DS data of GLS and NCLB, with the flowering time traits AD and SD in this study (Figure 2). This implies that lower values for AUDPC (implying higher levels of disease resistance) corresponded with longer AD or SD. Such negative correlations have also been reported in other studies (Asea et al., 2009; Wisser et al., 2011; Kolkman et al., 2020). On the contrary, some studies reported a positive correlation between GLS resistance and flowering time (Balint-Kurti et al., 2008; Zwonitzer et al., 2010; Benson et al., 2015; Mammadov et al., 2015; Liu et al., 2016). This suggests the cautious use of flowering time in the selection of lines for resistance to GLS and NCLB.
In Kenya and Uganda, the main maize-growing area is frequently affected by GLS and NCLB pathogens (Borchardt et al., 1998; Nsibo et al., 2021). When both pathogens affect the maize at the same time, more pronounced necrotic symptoms are the major concern which are probably due to the synergistic interactions of both pathogens. However, a weak correlation was observed between GLS DS and NCLB DS. One of the QTLs identified for GLS (qGLS2_30) was in proximity with the QTL identified for NCLB (qNCLB2_220). In the comparison of SNPs associated with GLS and NCLB DS in association mapping, it was observed that two SNPs (S1_194762510 and S1280826386) associated with NCLB DS were collocated within GLS QTL (qGLS1_54) (Tables 2, 3). This suggests that there are some common regions contributing to resistance for both diseases. On the other hand, the observed weak correlation between the DS of the two diseases could be attributed to the different infection strategies of the associated pathogens. Cercospora zeina is an apoplastic necrotroph and a hemibiotroph, while E. turcicum is apoplastic but then enters the vascular system of the leaf (Kotze et al., 2019). They also exploit different pathogenicity factors in causing disease symptoms (Swart et al., 2017; Human et al., 2020).
4.2 QTLs associated with GLS resistance
Most of the QTLs detected for GLS DS were also detected for GLS AUDPC (Table 2). This was well supported by the observed strong correlation (r = 0.99) between GLS DS and GLS AUDPC (Figure 2). A major QTL for GLS resistance (DS and AUDPC), qGLS1_186, which explained 15.16% of the phenotypic variance, overlapped with qGLS1_185 which also explained 9.01% of the phenotypic variance. Intriguingly, this major QTL has favorable alleles from the donor parent CML511. Kibe et al. (2020a) using the CML550×CML511 DH population also detected major effect QTL qGLS1-155 which was located within the physical position of 154–157 Mbp which overlapped with the QTL detected in the present study (qGLS1_185) spanning between 143 and 185 Mbp. Sun et al. (2021) also fine-mapped a major effect QTL at the 187–189 Mb region, and the reported flanking markers would be useful to validate in tropical germplasm.
The chromosome bin 1.06 was described as a QTL hotspot for GLS resistance as many studies reported earlier (Lehmensiek et al., 2001; Shi et al., 2007; Balint-Kurti et al., 2008; Berger et al., 2014; He et al., 2018; Lopez-Zuniga et al., 2019; Sun et al., 2021). The chromosome bin 1.06 also harbors resistance genes to several other diseases like common rust, southern leaf blight (SLB), ear rot, and NCLB (Freymark et al., 1993; Wisser et al., 2006; Chung et al., 2010b; Zwonitzer et al., 2010; Poland et al., 2011; Jamann et al., 2015). Chung et al. (2010b) demonstrated that the NCLB resistance QTL at bin 1.06 was important to protect the host against fungal penetration of E. turcicum using an introgression line population. The chromosomal region has also been associated with effects on diverse traits such as grain yield and its components, anthesis silking interval, and root and shoot traits under both water stress and optimal water environments (Ribaut et al., 1996; Tuberosa et al., 2002; Landi et al., 2010). The concentrated mapping of QTL for several traits, including multiple disease resistance in this chromosomal region, provides breeders and geneticists an opportunity to dissect them further and find tightly linked flanking markers so that this region can be utilized to develop cultivars with multiple disease resistance.
The qGLS2_30 QTL identified in this study in the chromosomal bin 2.04 overlapped with QTL reported in earlier studies using different mapping populations (Balint-Kurti et al., 2008; Lennon et al., 2017). The QTL qGLS3_151 is placed between 150 and 157 Mbp in the chromosomal bin 3.05, which has previously been identified as conditioning resistance to SLB and GLS (Zwonitzer et al., 2010; Kump et al., 2011). The QTL qGLS7_158 positioned between 157 and 159 Mbp in the chromosomal bin 7.04 was also previously reported by Berger et al. (2014) for GLS resistance. Another QTL qGLS5_16 in the chromosomal bin 5.03 is also known to have several reported markers for GLS resistance in a number of association mapping studies (Bubeck et al., 1993; Clements et al., 2000; Lehmensiek et al., 2001; Shi et al., 2007; Zhang et al., 2012; Benson et al., 2015). Overall, many of the QTLs detected in the present study overlapped between the biparental CML511 × CML546 DH population and the association panel as well as earlier studies (Supplementary Table S5). The major effect QTL for both GLS on chromosome 1 is of immediate interest to be used in resistance breeding.
Among the nine candidate genes identified for GLS resistance through association mapping, one on chromosome 2 (Zm00001eb077270) encodes a putative receptor-like protein kinase which are transmembrane signaling proteins that are able to sense changes in the extracellular environment such as pathogen invasion (Decreux et al., 2006; Qi et al., 2023). Another candidate gene on chromosome 1 (Zm00001eb034870) encodes DNA damage–repair/toleration protein that harbors a leucine-rich repeat domain which serve as the first line of defense in response to pathogen-associated molecular patterns (Ng and Xavier, 2011). The candidate gene Zm00001eb144960 on chromosome 3 encodes lipoxygenases which are known to be associated with pest resistance, response to wounding, and plant defense mechanisms where it was reported to be involved in the early response to pathogen attack (Peng et al., 1994). Overall, the detected candidate genes in the association study have annotations inferring direct or indirect involvement in plant defense.
4.3 QTL and SNPs associated with resistance to NCLB
This study identified 13 QTLs for NCLB DS and nine QTLs for NCLB AUDPC. Three of these QTLs were common for both the DS and AUDPC NCLB traits. The first example of this was QTLs qNCLB3_50 and qN_AUDPC3_50 that co-localized in the same position in bin 3.04. This significant QTL for NCLB resistance has favorable alleles from the parent CML546 (the more resistant parent). Previous research reports also identified bin 3.04 as a QTL hotspot conditioning resistance to multiple diseases including NCLB, SLB, and GLS (Lehmensiek et al., 2001; Wisser et al., 2006; Shi et al., 2007; Zwonitzer et al., 2010; Kump et al., 2011; Liu et al., 2016; Lennon et al., 2017; Martins et al., 2019).
The QTL qNCLB5_83 was positioned in the chromosomal bin 5.04. According to Miedaner et al. (2020), up to eight QTLs have been localized in this bin showing the importance of this region for NCLB resistance. Interestingly, the SNP identified through association mapping (S5_83980678) is positioned within this QTL region (Table 2, 3). It is associated with a candidate gene (Zm00001eb232660) that encodes a DNA helicase/ATP-binding domain. This type of domain has a catalytic function in unwinding of the double-stranded DNA that is instrumental in the repair of damaged DNA and DNA replication (Koonin, 1993).
Similarly, qNCLB6_153 for NCLB DS overlapped with qN_AUDPC6_153 for the AUDPC on chromosome 6 (bin 6.05). Up to four QTLs were reported from different studies in the same region (Miedaner et al., 2020). Another pair of QTL, qNCLB8_171 and qN_AUDPC8_171, corresponded with a previously reported NCLB resistance QTL by Galiano-Carneiro et al. (2021). Interestingly, none of the NCLB DS QTLs detected in this study were found in the same position with chromosomal bins associated with the qualitative Ht genes (Galiano-Carneiro and Miedaner, 2017).
An association study on NCLB revealed a significant marker linked to a candidate gene Zm00001eb201110 on chromosome 4 which encodes for an ATP-binding cassette (ABC) transporter. Plant proteins with this function are known to be associated with resistance to fungal and bacterial pathogens through the transmembrane transport of jasmonic acid or antimicrobial secondary metabolites (Zhang et al., 2020). Using GWAS, many studies showed the association of ABC transporter genes with NCLB resistance (Poland et al., 2011; Ding et al., 2015). Another candidate gene, Zm00001eb285080, on chromosome 6 encodes a protein kinase, a function known to be important in regulating the response of plants to pathogen attack (Lehti-Shiu and Shiu, 2012). There is strong evidence that protein kinases play a pivotal role in resistance to NCLB (Poland et al., 2011; Ding et al., 2015; Kolkman et al., 2020).
4.4 QTLs associated with agronomic data
The major QTL for flowering time qAD8_137 was collocated with QTLs qSD8_137 for SD, qPH8_129 for PH, and qEH8_128 for EH ((Supplementary Table S4). These QTLs also explained the major effect of phenotypic variance of 15.8%, 21.4%, 22.39%, and 22.98% for AD, SD, PH, and EH, respectively. Several studies also recognized chromosomal bin 8.05 as a hotspot for flowering time QTL and genes (Balint-Kurti et al., 2008; Buckler et al., 2009; Van Inghelandt et al., 2012). Interestingly, two qualitative resistance genes, Ht2 and Htn1, were also detected on the same chromosomal bin 8.05 (Galiano-Carneiro and Miedaner, 2017; Hurni et al., 2015). The genetic mechanisms underlying flowering time in this study were largely characterized by additive gene action. These results agree with the findings of Buckler et al. (2009) who reported that variations in days to flowering are due to the joint effect of many minor QTLs with additive effect.
Intriguingly, some of the QTLs associated with flowering time overlapped with the NCLB and GLS resistance QTL. For instance, qAD1_60 for flowering time shared the same flanking markers as qGLS1_54 (Table 2; Supplementary Table S4), and the two SNPs (S1_192041854, S1_253381765) for GLS DS and two SNPs (S1_194762510, S1_2800826386) for NCLB DS detected through association mapping are also positioned in this region. Another QTL qGLS9_129 also had the same flanking markers as qAD9_130, and one SNP from association mapping (S9_130213878) was also detected in the same region for GLS DS. The NCLB QTL qNCLB1_230 overlapped with qAD1_227 on the maize chromosomal bin 1.07 (Table 2; Supplementary Table S4). The QTLs qN_AUDPC2_188 and qPH2_176 overlapped on chromosomal bin 2.06, sharing the flanking markers. This was further supported by the positive correlation between PH and NCLB AUDPC (Figure 2). On the other hand, Galiano-Carneiro et al. (2021) reported a negative correlation between PH and NCLB DS. There were no common QTL regions identified for PH and EH that spanned the same chromosomal regions as GLS DS and AUDPC. This is supported by the observed negative correlation between the two traits (Figure 3).
4.5 Genomic prediction of disease and agronomic traits
Compared to the association panel, the high-prediction correlations in the DH population for GLS and NCLB could be attributed to higher similarity or relatedness of individuals between the training set and the prediction set (Figure 4; Lorenz and Smith, 2015). GLS DS and GLS AUDPC exhibited slightly higher prediction accuracies compared to NCLB DS and other agronomic traits. Agronomic traits, such as AD, SD, PH, and EH, are characterized by more complex genetic networks, under the control of numerous QTLs, and affected by the influence of the environment (Wallace et al., 2014). This presents a challenge in improving them through phenotypic selection (Du et al., 2021). Kibe et al. (2020a) reported low-to-moderate prediction correlations within populations and high values when different related populations were combined and used in prediction. Similarly, Galiano-Carneiro et al. (2021) reported prediction accuracies of moderate levels (0.55) for prediction within families. Technow et al. (2013) reported prediction accuracies of 0.58 and 0.55 when using a small population size of 75 individuals. It has been reported that there is no difference among hybrids advanced through the genomic selection or phenotypic selection in their response to NCLB and GLS, with the genomic selection being relatively cheaper than the phenotypic selection (Beyene et al., 2019; 2021). Overall, the use of genomic selection has potential to improve the resistance to GLS and NCLB in breeding populations and could lead to the development of multiple disease-resistant lines and hybrids.
5 Conclusion
GLS and NCLB are the major biotic stresses that hinder maize production in high-yielding maize-growing areas in East Africa, such as western Kenya. The use of genomic tools can provide useful information to fast track the development of disease-resistant varieties. In this study, we aimed to identify and validate genomic regions associated with GLS and NCLB resistance in biparental and association mapping populations evaluated in multiple locations in western Kenya. We identified 10 and 11 QTLs for GLS resistance and 18 and 16 QTLs for NCLB resistance in the DH population and association mapping population, respectively. We detected a major QTL for GLS resistance, qGLS1_186, which explained 15.2% phenotypic variance and qNCLB3_50 for NCLB resistance, explaining 8.8% of the phenotypic variance. Several common QTL regions between linkage mapping and association mapping and between NCLB and GLS AUDPC traits were detected. A negative correlation between flowering time and severity of the two diseases was reported. Several QTLs identified in the present study were also co-localized with the QTL previously mapped for GLS and NCLB resistance. Our study highlights that the combined use of linkage mapping and genomic selection is an effective strategy for the improvement of resistance. Genomic prediction sheds light on new ways to improve breeding for disease resistance with optimum allocation of resources and lays the foundation for a new era of resistance breeding.
Data availability statement
The datasets presented in this study can be found in online repositories: data.cimmyt.org/dataset.xhtml?persistentId=hdl:11529/10548956 and zenodo.org/records/10046213.
Author contributions
DO: conceptualization, data curation, formal analysis, validation, and writing–original draft. MD: conceptualization, funding acquisition, project administration, resources, supervision, and writing–review and editing. DB: conceptualization, methodology, resources, supervision, and writing–review and editing. YB: funding acquisition, investigation, project administration, supervision, and writing–review and editing. DN: conceptualization, formal analysis, methodology, and writing–review and editing. CJ: data curation, formal analysis, methodology, and writing–review and editing. SM: investigation and writing–review and editing. MG: data curation, formal analysis, methodology, software, visualization, writing–original draft, and writing–review and editing.
Funding
The authors declare financial support was received for the research, authorship, and/or publication of this article. This study was supported by the Kenya–South Africa joint science and technology research collaboration. The grants received from the National Research Fund, Kenya, and the National Research Foundation (NRF), South Africa (grant # 105806), toward this research are hereby acknowledged. This study was also supported by CIMMYT-Nairobi. CIMMYT received support from the United States Agency for International Development, Foundation for Food and Agriculture Research (FFAR), and the Bill and Melinda Gates Foundation (BMGF) under AG2MW (Accelerating Genetic Gains in Maize and Wheat for Improved Livelihoods, B&MGF Investment ID INV-003439) project, the CGIAR Research Program on MAIZE.
Acknowledgments
The authors thank the CIMMYT field and laboratory technicians for phenotypic evaluations and sample preparation for genotyping. They are also grateful to the Buckler Lab at Cornell University, United States, for genotyping the maize populations and providing the marker information and Diversity Arrays Technology (DArT), Canberra, Australia for genotyping DH population. Part of the data in this manuscript was from the thesis work conducted by DO.
Conflict of interest
Authors DO and CJ were employed by Crop Science Division Bayer East Africa Limited.
The remaining authors declare that the research was conducted in the absence of any commercial or financial relationships that could be construed as a potential conflict of interest.
The authors declare that they were editorial board members of Frontiers, at the time of submission. This had no impact on the peer review process and the final decision.
Publisher’s note
All claims expressed in this article are solely those of the authors and do not necessarily represent those of their affiliated organizations, or those of the publisher, the editors, and the reviewers. Any product that may be evaluated in this article, or claim that may be made by its manufacturer, is not guaranteed or endorsed by the publisher.
Supplementary material
The Supplementary Material for this article can be found online at: https://www.frontiersin.org/articles/10.3389/fgene.2023.1282673/full#supplementary-material
References
Alvarado, G., López, M., Vargas, M., Pacheco, A., Rodríguez, F., Burgueño, J., et al. (2015). META-R (multi environment trail analysis with R for windows) version 5.0 - CIMMYT research software dataverse - CIMMYT dataverse network. Available at: https://data.cimmyt.org/dataset.xhtml?persistentId=hdl:11529/10201 (Accessed April 15, 2021).
Asea, G., Vivek, B. S., Bigirwa, G., Lipps, P. E., and Pratt, R. C. (2009). Validation of consensus quantitative trait loci associated with resistance to multiple foliar pathogens of maize. Phytopathology 99 (5), 540–547. doi:10.1094/phyto-99-5-0540
Ashburner, M., Ball, C. A., Blake, J. A., Botstein, D., Butler, H., Cherry, J. M., et al. (2000). Gene ontology: tool for the unification of biology. The Gene Ontology Consortium. Nat. Genet. 25 (1), 25–29. doi:10.1038/75556
Balint-Kurti, P. J., Wisser, R. J., and Zwonitzer, J. C. (2008). Use of an advanced intercross line population for precise mapping of quantitative trait loci for gray leaf spot resistance in maize. Crop Sci. 48, 1696–1704. doi:10.2135/cropsci2007.12.0679
Bateman, A., Coin, L., Durbin, R., Finn, R. D., Hollich, V., Griffiths-Jones, S., et al. (2004). The Pfam protein families database. Nucleic Acids Res. 32, D138–D141. Database issue). doi:10.1093/nar/gkh121
Benjamini, Y., and Hochberg, Y. (1995). Controlling the false discovery rate: a practical and powerful approach to multiple testing. J. R. Stat. Soc. Ser. B Stat. Methodol. 57, 289–300. doi:10.1111/j.2517-6161.1995.tb02031.x
Benson, J. M., Poland, J. A., Benson, B. M., Stromberg, E. L., and Nelson, R. J. (2015). Resistance to gray leaf spot of maize: genetic architecture and mechanisms elucidated through nested association mapping and near-isogenic line analysis. PLoS Genet. 11 (3), e1005045. doi:10.1371/journal.pgen.1005045
Berger, D. K., Carstens, M., Korsman, J. N., Middleton, F., Kloppers, F. J., Tongoona, P., et al. (2014). Mapping QTL conferring resistance in maize to gray leaf spot disease caused by Cercospora zeina. BMC Genet. 15, 60. doi:10.1186/1471-2156-15-60
Berger, D. K., Mokgobu, T., de Ridder, K., Christie, N., and Aveling Theresa, A. S. (2020). Benefits of maize resistance breeding and chemical control against northern leaf blight in smallholder farms in South Africa. South Afr. J. Sci. 116 (11-12), 113–119. doi:10.17159/sajs.2020/8286
Beyene, Y., Gowda, M., Olsen, M., Robbins, K. R., Pérez-Rodríguez, P., Alvarado, G., et al. (2019). Empirical comparison of tropical maize hybrids selected through genomic and phenotypic selections. Front. Plant Sci. 10, 1502. doi:10.3389/fpls.2019.01502
Beyene, Y., Gowda, M., Pérez-Rodríguez, P., Olsen, M., Robbins, K. R., Burgueño, J., et al. (2021). Application of genomic selection at the early stage of breeding pipeline in tropical maize. Front. Plant Sci. 12, 685488. doi:10.3389/fpls.2021.685488
Beyene, Y., and Prasanna, B. M. (2020). Accelerating genetic gains in maize and wheat: genetic gains in CIMMYT maize breeding program in Africa. Available at https://excellenceinbreeding.org/sites/default/files/u1025/CIMMYT%20Maize%20Genetic%20Gains%20in%20Africa%20%28AGG-EiB%20Workshop%3B%20Nov%2018%202020%29.pdf (Accessed August 20, 2021).
Borchardt, D. S., Welz, H. G., and Geiger, H. H. (1998). Genetic structure of Setosphaeria turcica populations in tropical and temperate climates. Phytopathology 88 4, 322–329. doi:10.1094/phyto.1998.88.4.322
Bradbury, J. P., Zhang, Z., Kroon, D. E., Casstevens, T. M., Ramdoss, Y., and Buckler, E. S. (2007). TASSEL: software for association mapping of complex traits in diverse samples. Bioinformatics 23 (19), 2633–2635. doi:10.1093/bioinformatics/btm308
Bubeck, D. M., Goodman, M. M., Beavis, W. D., and Grant, D. (1993). Quantitative trait loci controlling resistance to gray leaf spot in maize. Crop Sci. 33 (4), 838–847. doi:10.2135/cropsci1993.0011183x003300040041x
Buckler, E. S., Holland, J. B., Bradbury, P. J., Acharya, C. B., Brown, P. J., Browne, C., et al. (2009). The genetic architecture of maize flowering time. Science 325 (5941), 714–718. doi:10.1126/science.1174276
Challa, S., and Neelapu, N. R. R. (2018). “Chapter 9 - genome-wide association studies (GWAS) for abiotic stress tolerance in plants,” in Biochemical, physiological and molecular avenues for combating abiotic stress tolerance in plants. Editor S. H. Wani (Academic Press), 135–150. doi:10.1016/b978-0-12-813066-7.00009-7
Chen, G., Wang, X., Long, S., Jaqueth, J., Li, B., Yan, J., et al. (2015). An update on inflammation in the acute phase of intracerebral hemorrhage. Mol. Breed. 36 (1), 4–8. doi:10.1007/s12975-014-0384-4
Chung, C. L., Longfellow, J. M., Walsh, E. K., Kerdieh, Z., Van Esbroeck, G., Balint-Kurti, P., et al. (2010b). Resistance loci affecting distinct stages of fungal pathogenesis: use of introgression lines for QTL mapping and characterization in the maize--Setosphaeria turcica pathosystem. BMC Plant Biol. 10, 103. doi:10.1186/1471-2229-10-103
Clements, M. J., Dudley, J. W., and White, D. G. (2000). Quantitative trait Loci associated with resistance to gray leaf spot of corn. Phytopathology 90 (9), 1018–1025. doi:10.1094/phyto.2000.90.9.1018
Crossa, J., Pérez-Rodríguez, P., Cuevas, J., Montesinos-López, O., Jarquín, D., de los Campos, G., et al. (2017). Genomic selection in plant breeding: methods, models, and perspectives. Trends Plant Sci. 22 (11), 961–975. doi:10.1016/j.tplants.2017.08.011
Crous, P. W., Groenewald, J. Z., Groenewald, M., Caldwell, P., Braun, U., and Harrington, T. C. (2006). Species of Cercospora associated with grey leaf spot of maize. Stud. Mycol. 55, 189–197. doi:10.3114/sim.55.1.189
Decreux, A., Thomas, A., Spies, B., Brasseur, R., Van Cutsem, P., and Messiaen, J. (2006). In vitro characterization of the homogalacturonan-binding domain of the wall-associated kinase WAK1 using site-directed mutagenesis. Phytochemistry 67 (11), 1068–1079. doi:10.1016/j.phytochem.2006.03.009
Dekkers, J. C. (2007). Prediction of response to marker-assisted and genomic selection using selection index theory. J. Anim. Breed. Genet. 124 (6), 331–341. doi:10.1111/j.1439-0388.2007.00701.x
Ding, J., Ali, F., Chen, G., Li, H., Mahuku, G., Yang, N., et al. (2015). Genome-wide association mapping reveals novel sources of resistance to northern corn leaf blight in maize. BMC Plant Biol. 15, 206. doi:10.1186/s12870-015-0589-z
Du, L., Zhang, H., Xin, W., Ma, K., Du, D., Yu, C., et al. (2021). Dissecting the genetic basis of flowering time and height related-traits using two doubled haploid populations in maize. Plants (Basel) 10 (8), 1585. doi:10.3390/plants10081585
Elshire, R. J., Glaubitz, J. C., Sun, Q., Poland, J. A., Kawamoto, K., Buckler, E. S., et al. (2011). A robust, simple genotyping-by-sequencing (GBS) approach for high diversity species. PloS One 6, e19379. doi:10.1371/journal.pone.0019379
Freymark, P. J., Lee, M., Woodman, W. L., and Martinson, C. A. (1993). Quantitative and qualitative trait loci affecting host-plant response to Exserohilum turcicum in maize (Zea mays L.). Theor. Appl. Genet. 87 (5), 537–544. doi:10.1007/bf00221876
Galiano-Carneiro, A. L., Kessel, B., Presterl, T., and Miedaner, T. (2021). Intercontinental trials reveal stable QTL for Northern corn leaf blight resistance in Europe and in Brazil. Theor. Appl. Genet. 134 (1), 63–79. doi:10.1007/s00122-020-03682-1
Galiano-Carneiro, A. L., and Miedaner, T. (2017). Genetics of resistance and pathogenicity in the maize/Setosphaeria turcica pathosystem and implications for breeding. Front. Plant Sci. 8, 1490. doi:10.3389/fpls.2017.01490
Glaubitz, J. C., Casstevens, T. M., Lu, F., Harriman, J., Elshire, R. J., Sun, Q., et al. (2014). TASSEL-GBS: a high-capacity genotyping by sequencing analysis pipeline. PLOS ONE 9 (2), e90346. doi:10.1371/journal.pone.0090346
Goodstein, D. M., Shu, S., Howson, R., Neupane, R., Hayes, R. D., Fazo, J., et al. (2012). Phytozome: a comparative platform for green plant genomics. Nucleic Acids Res. 40, D1178–D1186. doi:10.1093/nar/gkr944
He, W., Yang, L., Leng, Y., Zhang, B., Yang, J., Li, L., et al. (2018). QTL mapping for resistance of maize to grey leaf spot. J. Phytopathology 166 (3), 167–176. doi:10.1111/jph.12673
Human, M. P., Berger, D. K., and Crampton, B. G. (2020). Time-course RNAseq reveals Exserohilum turcicum effectors and pathogenicity determinants. Front. Microbiol. 11, 360. doi:10.3389/fmicb.2020.00360
Hurni, S., Scheuermann, D., Krattinger, S. G., Kessel, B., Wicker, T., Herren, G., et al. (2015). The maize disease resistance gene Htn1 against northern corn leaf blight encodes a wall-associated receptor-like kinase. Proc. Natl. Acad. Sci. U. S. A. 112 (28), 8780–8785. doi:10.1073/pnas.1502522112
Jaccoud, D., Peng, K., Feinstein, D., and Kilian, A. (2001). Diversity arrays: a solid state technology for sequence information independent genotyping. Nucleic Acids Res. 29 (4), E25. doi:10.1093/nar/29.4.e25
Jamann, T. M., Balint-Kurti, P. J., and Holland, J. B. (2015). QTL mapping using high-throughput sequencing. Methods Mol. Biol. 1284, 257–285. doi:10.1007/978-1-4939-2444-8_13
Kanehisa, M., and Goto, S. (2000). KEGG: kyoto encyclopedia of genes and genomes. Nucleic Acids Res. 28 (1), 27–30. doi:10.1093/nar/28.1.27
Khan, S. U., Saeed, S., Khan, M. H. U., Fan, C., Ahmar, S., Arriagada, O., et al. (2021). Advances and challenges for QTL analysis and GWAS in the plant-breeding of high-yielding: a focus on rapeseed. Biomolecules 11 (10), 1516. doi:10.3390/biom11101516
Kibe, M., Nair, S. K., Das, B., Bright, J. M., Makumbi, D., Kinyua, J., et al. (2020a). Genetic dissection of resistance to gray leaf spot by combining genome-wide association, linkage mapping, and genomic prediction in tropical maize germplasm. Front. Plant Sci. 11, 572027. doi:10.3389/fpls.2020.572027
Kibe, M., Nyaga, C., Nair, S. K., Beyene, Y., Das, B., Suresh, L. M., et al. (2020b). Combination of linkage mapping, GWAS, and GP to dissect the genetic basis of common rust resistance in tropical maize germplasm. Int. J. Mol. Sci. 21 (18), 6518. doi:10.3390/ijms21186518
Kilian, A., Wenzl, P., Huttner, E., Carling, J., Xia, L., Blois, H., et al. (2012). Diversity arrays technology: a generic genome profiling technology on open platforms. Methods Mol. Biol. 888, 67–89. doi:10.1007/978-1-61779-870-2_5
Kinyua, Z. M., Smith, J. J., Kibata, G. N., Simons, S. A., and Langat, B. C. (2010). Status of grey leaf spot disease in Kenyan maize production ecosystems. Afr. Crop Sci. J. 18 (4), 183–194. doi:10.4314/acsj.v18i4.68647
Knapp, S. J., Stroup, W. W., and Ross, W. M. (1985). Exact confidence intervals for heritability on a progeny mean basis. Crop Sci. 25 (1), 192–194. doi:10.2135/cropsci1985.0011183x002500010046x
Kolkman, J. M., Strable, J., Harline, K., Kroon, D. E., Wiesner-Hanks, T., Bradbury, P. J., et al. (2020). Maize introgression library provides evidence for the involvement of liguleless1 in resistance to northern leaf blight. G3 (Bethesda) 10 (10), 3611–3622. doi:10.1534/g3.120.401500
Koonin, E. V. (1993). Escherichia coli dinG gene encodes a putative DNA helicase related to a group of eukaryotic helicases including Rad3 protein. Nucleic Acids Res. 21 (6), 1497. doi:10.1093/nar/21.6.1497
Korsman, J., Meisel, B., Kloppers, F. J., Crampton, B. G., and Berger, D. K. (2012). Quantitative phenotyping of grey leaf spot disease in maize using real-time PCR. Eur. J. Plant Pathology 133 (2), 461–471. doi:10.1007/s10658-011-9920-1
Kotze, R. G., van der Merwe, C. F., Crampton, B. G., and Kritzinger, Q. (2019). A histological assessment of the infection strategy of Exserohilum turcicum in maize. Plant Pathol. 68 (3), 504–512. doi:10.1111/ppa.12961
Kump, K. L., Bradbury, P. J., Wisser, R. J., Buckler, E. S., Belcher, A. R., Oropeza-Rosas, M. A., et al. (2011). Genome-wide association study of quantitative resistance to southern leaf blight in the maize nested association mapping population. Nat. Genet. 43 (2), 163–168. doi:10.1038/ng.747
Landi, P., Giuliani, S., Salvi, S., Ferri, M., Tuberosa, R., and Sanguineti, M. C. (2010). Characterization of root-yield-1.06, a major constitutive QTL for root and agronomic traits in maize across water regimes. J. Exp. Bot. 61 (13), 3553–3562. doi:10.1093/jxb/erq192
Lehmensiek, A., Esterhuizen, A. M., van Staden, D., Nelson, S. W., and Retief, A. E. (2001). Genetic mapping of gray leaf spot (GLS) resistance genes in maize. Theor. Appl. Genet. 103 (5), 797–803. doi:10.1007/s001220100599
Lehti-Shiu, M. D., and Shiu, S. H. (2012). Diversity, classification and function of the plant protein kinase superfamily. Philos. Trans. R. Soc. Lond B Biol. Sci. 367 (1602), 2619–2639. doi:10.1098/rstb.2012.0003
Lennon, J. R., Krakowsky, M., Goodman, M., Flint-Garcia, S., and Balint-Kurti, P. J. (2017). Identification of teosinte alleles for resistance to southern leaf blight in near isogenic maize lines. Crop Sci. 57 (4), 1973–1983. doi:10.2135/cropsci2016.12.0979
Leonard, K. J., and Suggs, E. G. (1974). Setosphaeria prolata, the Ascigerous state of Exserohilum prolatum. Mycologia 66 (2), 281–297. doi:10.1080/00275514.1974.12019603
Lipka, A. E., Tian, F., Wang, Q., Peiffer, J., Li, M., Bradbury, P. J., et al. (2012). GAPIT: genome association and prediction integrated tool. Bioinformatics 28 (18), 2397–2399. doi:10.1093/bioinformatics/bts444
Littell, R. C., Milliken, G., Stroup, W. W., Wolfinger, R., and Schabenberger, O. (2007). SAS for mixed models, 61. Cary, NC, USA: SAS Institute.
Liu, L., Zhang, Y. D., Li, H. Y., Bi, Y. Q., Yu, L. J., Fan, X. M., et al. (2016). QTL mapping for gray leaf spot resistance in a tropical maize population. Plant Dis. 100 (2), 304–312. doi:10.1094/pdis-08-14-0825-re
Lopez-Zuniga, L. O., Wolters, P., Davis, S., Weldekidan, T., Kolkman, J. M., Nelson, R., et al. (2019). Using maize chromosome segment substitution line populations for the identification of loci associated with multiple disease resistance. G3 (Bethesda) 9 (1), 189–201. doi:10.1534/g3.118.200866
Lorenz, A. J., and Smith, K. P. (2015). Adding genetically distant individuals to training populations reduces genomic prediction accuracy in barley. Crop Sci. 55 (6), 2657–2667. doi:10.2135/cropsci2014.12.0827
Mammadov, J., Sun, X., Gao, Y., Ochsenfeld, C., Bakker, E., Ren, R., et al. (2015). Combining powers of linkage and association mapping for precise dissection of QTL controlling resistance to gray leaf spot disease in maize (Zea mays L.). BMC Genomics 16, 916. doi:10.1186/s12864-015-2171-3
Martins, L. B., Rucker, E., Thomason, W., Wisser, R. J., Holland, J. B., and Balint-Kurti, P. (2019). Validation and characterization of maize multiple disease resistance QTL. G3 (Bethesda) 9 (9), 2905–2912. doi:10.1534/g3.119.400195
McDonald, B. A., and Linde, C. (2002). Pathogen population genetics, evolutionary potential, and durable resistance. Annu. Rev. Phytopathol. 40, 349–379. doi:10.1146/annurev.phyto.40.120501.101443
Meng, L., Li, H., Zhang, L., and Wang, J. (2015). QTL IciMapping: integrated software for genetic linkage map construction and quantitative trait locus mapping in biparental populations. Crop J. 3 (3), 269–283. doi:10.1016/j.cj.2015.01.001
Miedaner, T., Boeven, A. L. G., Gaikpa, D. S., Kistner, M. B., and Grote, C. P. (2020). Genomics-assisted breeding for quantitative disease resistances in small-grain cereals and maize. Int. J. Mol. Sci. 21 (24), 9717. doi:10.3390/ijms21249717
Munialo, S., Dahlin, S., Onyango, C., Kosura, W., Marstorp, H., and Oborn, I. (2019). Soil and management-related factors contributing to maize yield gaps in western Kenya. Food Energy Secur. 9. doi:10.1002/fes3.189
Murithi, A., Olsen, M. S., Kwemoi, D. B., Veronica, O., Ertiro, B. T., Suresh, L. M., et al. (2021). Discovery and validation of a recessively inherited major-effect QTL conferring resistance to maize lethal necrosis (MLN) disease. Front. Genet. 12, 767883. doi:10.3389/fgene.2021.767883
Ng, A., and Xavier, R. J. (2011). Leucine-rich repeat (LRR) proteins: integrators of pattern recognition and signaling in immunity. Autophagy 7 (9), 1082–1084. doi:10.4161/auto.7.9.16464
Nsibo, D. L., Barnes, I., Kunene, N. T., and Berger, D. K. (2019). Influence of farming practices on the population genetics of the maize pathogen Cercospora zeina in South Africa. Fungal Genet. Biol. 125, 36–44. doi:10.1016/j.fgb.2019.01.005
Nsibo, D. L., Barnes, I., Omondi, D. O., Dida, M. M., and Berger, D. K. (2021). Population genetic structure and migration patterns of the maize pathogenic fungus, Cercospora zeina in East and Southern Africa. Fungal Genet. Biol. 149, 103527. doi:10.1016/j.fgb.2021.103527
Nyanapah, J. O., Ayiecho, P. O., Nyabundi, J. O., Otieno, W., and Ojiambo, P. S. (2020). Field characterization of partial resistance to gray leaf spot in elite maize germplasm. Phytopathology 110 (10), 1668–1679. doi:10.1094/phyto-12-19-0446-r
Peng, Y. L., Shirano, Y., Ohta, H., Hibino, T., Tanaka, K., and Shibata, D. (1994). A novel lipoxygenase from rice. Primary structure and specific expression upon incompatible infection with rice blast fungus. J. Biol. Chem. 269 (5), 3755–3761. doi:10.1016/s0021-9258(17)41924-7
Poland, J. A., Bradbury, P. J., Buckler, E. S., and Nelson, R. J. (2011). Genome-wide nested association mapping of quantitative resistance to northern leaf blight in maize. Proc. Natl. Acad. Sci. U. S. A. 108 (17), 6893–6898. doi:10.1073/pnas.1010894108
Prasanna, B. M., Cairns, J. E., Zaidi, P. H., Beyene, Y., Makumbi, D., Gowda, M., et al. (2021). Beat the stress: breeding for climate resilience in maize for the tropical rainfed environments. Theor. Appl. Genet. 134 (6), 1729–1752. doi:10.1007/s00122-021-03773-7
Price, A. L., Patterson, N. J., Plenge, R. M., Weinblatt, M. E., Shadick, N. A., and Reich, D. (2006). Principal components analysis corrects for stratification in genome-wide association studies. Nat. Genet. 38 (8), 904–909. doi:10.1038/ng1847
Qi, H., Zhu, X., Shen, W., and Zhang, Z. (2023). A novel wall-associated kinase TaWAK-5D600 positively participates in defense against sharp eyespot and fusarium crown rot in wheat. Int. J. Mol. Sci. 24 (5), 5060. doi:10.3390/ijms24055060
Rashid, Z., Sofi, M., Harlapur, S. I., Kachapur, R. M., Dar, Z. A., Singh, P. K., et al. (2020). Genome-wide association studies in tropical maize germplasm reveal novel and known genomic regions for resistance to Northern corn leaf blight. Sci. Rep. 10 (1), 21949. doi:10.1038/s41598-020-78928-5
Ribaut, J. M., Hoisington, D. A., Deutsch, J. A., Jiang, C., and Gonzalez-de-Leon, D. (1996). Identification of quantitative trait loci under drought conditions in tropical maize. 1. Flowering parameters and the anthesis-silking interval. Theor. Appl. Genet. 92 (7), 905–914. doi:10.1007/bf00221905
Saito, B. C., Silva, L., Andrade, J., and Goodman, M. (2018). Adaptability and stability of corn inbred lines regarding resistance to gray leaf spot and northern leaf blight. Crop Breed. Appl. Biotec 18, 148–154. doi:10.1590/1984-70332018v18n2a21
Sanchez, D. L., Liu, S., Ibrahim, R., Blanco, M., and Lübberstedt, T. (2018). Genome-wide association studies of doubled haploid exotic introgression lines for root system architecture traits in maize (Zea mays L.). Plant Sci. 268, 30–38. doi:10.1016/j.plantsci.2017.12.004
Sánchez-Sevilla, J. F., Horvath, A., Botella, M. A., Gaston, A., Folta, K., Kilian, A., et al. (2015). Diversity arrays technology (DArT) marker platforms for diversity analysis and linkage mapping in a complex crop, the octoploid cultivated strawberry (Fragaria × ananassa). PLoS One 10 (12), e0144960. doi:10.1371/journal.pone.0144960
Sansaloni, C., Franco, J., Santos, B., Percival-Alwyn, L., Singh, S., Petroli, C., et al. (2020). Diversity analysis of 80,000 wheat accessions reveals consequences and opportunities of selection footprints. Nat. Commun. 11 (1), 4572. doi:10.1038/s41467-020-18404-w
Shaner, G. E. (1977). The effect of nitrogen fertilization on the expression of slow-mildewing resistance in knox wheat. Phytopathology 77, 1051. doi:10.1094/phyto-67-1051
Shi, L.-y., Li, X.-h., Hao, Z.-f., Xie, C.-x., Ji, H.-l., Lü, X.-l., et al. (2007). Comparative QTL mapping of resistance to gray leaf spot in maize based on bioinformatics. Agric. Sci. China 6 (12), 1411–1419. doi:10.1016/S1671-2927(08)60002-4
Sserumaga, J. P., Makumbi, D., Assanga, S. O., Mageto, E. K., Njeri, S. G., Jumbo, B. M., et al. (2020). Identification and diversity of tropical maize inbred lines with resistance to common rust (Puccinia sorghi Schwein). Crop Sci. 60 (6), 2971–2989. doi:10.1002/csc2.20345
Sun, H., Zhai, L., Teng, F., Li, Z., and Zhang, Z. (2021). qRgls1. 06, a major QTL conferring. resistance to gray leaf spot disease in maize. Crop J. 9, 342–350. doi:10.1016/j.cj.2020.08.001
Swart, V., Crampton, B. G., Ridenour, J. B., Bluhm, B. H., Olivier, N. A., Meyer, J. M., et al. (2017). Complementation of CTB7 in the maize pathogen Cercospora zeina overcomes the lack of in vitro cercosporin production. Mol. Plant Microbe Interact. 30, 710–724. doi:10.1094/MPMI-03-17-0054-R
Tang, Y., Liu, X., Wang, J., Li, M., Wang, Q., Tian, F., et al. (2016). Gapit version 2: an enhanced integrated tool for genomic association and prediction. Plant Genome 9, 2. doi:10.3835/plantgenome2015.11.0120
Technow, F., Bürger, A., and Melchinger, A. E. (2013). Genomic prediction of northern corn leaf blight resistance in maize with combined or separated training sets for heterotic groups. G3 (Bethesda) 3 (2), 197–203. doi:10.1534/g3.112.004630
Tuberosa, R., Salvi, S., Sanguineti, M. C., Landi, P., Maccaferri, M., and Conti, S. (2002). Mapping QTLs regulating morpho-physiological traits and yield: case studies, shortcomings and perspectives in drought-stressed maize. Ann. Bot. 89 (7), 941–963. doi:10.1093/aob/mcf134
Van Inghelandt, D., Melchinger, A. E., Martinant, J. P., and Stich, B. (2012). Genome-wide association mapping of flowering time and northern corn leaf blight (Setosphaeria turcica) resistance in a vast commercial maize germplasm set. BMC Plant Biol. 12, 56. doi:10.1186/1471-2229-12-56
Vivek, B., Kasango, J., Chisoro, S., and Magorokosho, C. (2007). Fieldbook: software for managing a maize breeding program: a cookbook for handling field experiments, data, stocks and pedigree information. Mexico, DF: CIMMYT.
Wallace, J. G., Bradbury, P. J., Zhang, N., Gibon, Y., Stitt, M., and Buckler, E. S. (2014). Association mapping across numerous traits reveals patterns of functional variation in maize. PLoS Genet. 10 (12), e1004845. doi:10.1371/journal.pgen.1004845
Wang, N., Yuan, Y., Wang, H., Yu, D., Liu, Y., Zhang, A., et al. (2020). Applications of genotyping-by-sequencing (GBS) in maize genetics and breeding. Sci. Rep. 10, 16308. doi:10.1038/s41598-020-73321-8
Welz, G., and Geiger, H. (2000). Genes for resistance to northern corn leaf blight in diverse maize populations. Plant Breed. 119, 1–14. doi:10.1046/j.1439-0523.2000.00462.x
Wenzl, P., Carling, J., Kudrna, D., Jaccoud, D., Huttner, E., Kleinhofs, A., et al. (2004). Diversity arrays technology (DArT) for whole-genome profiling of barley. Proc. Natl. Acad. Sci. U. S. A. 101 (26), 9915–9920. doi:10.1073/pnas.0401076101
Wisser, R. J., Balint-Kurti, P. J., and Nelson, R. J. (2006). The genetic architecture of disease resistance in maize: a synthesis of published studies. Phytopathology 96 (2), 120–129. doi:10.1094/phyto-96-0120
Wisser, R. J., Kolkman, J. M., Patzoldt, M. E., Holland, J. B., Yu, J., Krakowsky, M., et al. (2011). Multivariate analysis of maize disease resistances suggests a pleiotropic genetic basis and implicates a GST gene. Proc. Natl. Acad. Sci. U. S. A. 108 (18), 7339–7344. doi:10.1073/pnas.1011739108
Xiao, Y., Liu, H., Wu, L., Warburton, M., and Yan, J. (2017). Genome-wide association studies in maize: praise and stargaze. Mol. Plant 10 (3), 359–374. doi:10.1016/j.molp.2016.12.008
Zhang, H., Jing, W., Zheng, J., Jin, Y., Wu, D., Cao, C., et al. (2020). The ATP-binding cassette transporter OsPDR1 regulates plant growth and pathogen resistance by affecting jasmonates biosynthesis in rice. Plant Sci. 298, 110582. doi:10.1016/j.plantsci.2020.110582
Zhang, Y., Xu, L., Fan, X., Tan, J., Chen, W., and Xu, M. (2012). QTL mapping of resistance to gray leaf spot in maize. Theor. Appl. Genet. 125 (8), 1797–1808. doi:10.1007/s00122-012-1954-z
Zhao, Y., Gowda, M., Liu, W., Würschum, T., Maurer, H. P., Longin, F. H., et al. (2012). Accuracy of genomic selection in European maize elite breeding populations. Theor. Appl. Genet. 124 (4), 769–776. doi:10.1007/s00122-011-1745-y
Zwonitzer, J. C., Coles, N. D., Krakowsky, M. D., Arellano, C., Holland, J. B., McMullen, M. D., et al. (2010). Mapping resistance quantitative trait loci for three foliar diseases in a maize recombinant inbred line population-evidence for multiple disease resistance? Phytopathology 100 (1), 72–79. doi:10.1094/phyto-100-1-0072
Keywords: maize, gray leaf spot, northern corn leaf blight, quantitative trait loci, association mapping, genome-wide association study
Citation: Omondi DO, Dida MM, Berger DK, Beyene Y, Nsibo DL, Juma C, Mahabaleswara SL and Gowda M (2023) Combination of linkage and association mapping with genomic prediction to infer QTL regions associated with gray leaf spot and northern corn leaf blight resistance in tropical maize. Front. Genet. 14:1282673. doi: 10.3389/fgene.2023.1282673
Received: 24 August 2023; Accepted: 18 October 2023;
Published: 07 November 2023.
Edited by:
Krishnanand P. Kulkarni, Delaware State University, United StatesReviewed by:
Qin Yang, Northwest A&F University, ChinaZhenhua Wang, Northeast Agricultural University, China
Copyright © 2023 Omondi, Dida, Berger, Beyene, Nsibo, Juma, Mahabaleswara and Gowda. This is an open-access article distributed under the terms of the Creative Commons Attribution License (CC BY). The use, distribution or reproduction in other forums is permitted, provided the original author(s) and the copyright owner(s) are credited and that the original publication in this journal is cited, in accordance with accepted academic practice. No use, distribution or reproduction is permitted which does not comply with these terms.
*Correspondence: Mathews M. Dida, mitodida@yahoo.com; Manje Gowda, m.gowda@cgiar.org