 Maulana M. Naji1
 Yifan Jiang2
 Yuri T. Utsunomiya3
 Benjamin D. Rosen4
 Johann Sölkner1Chuduan Wang2Li Jiang2
 Qin Zhang2
 Yi Zhang2
 Xiangdong Ding2*Gábor Mészáros1*
- 1University of Natural Resources and Life Sciences, Vienna, Austria
- 2China Agricultural University, Beijing, China
- 3Department of Production and Animal Health, School of Veterinary Medicine, São Paulo State University (Unesp), Araçatuba, Brazil
- 4Animal Genomics and Improvement Laboratory, USDA‐ARS, Beltsville, MD, United States
Cattle have been essential for the development of human civilization since their first domestication few thousand years ago. Since then, they have spread across vast geographic areas following human activities. Throughout generations, the cattle genome has been shaped with detectable signals induced by various evolutionary processes, such as natural and human selection processes and demographic events. Identifying such signals, called selection signatures, is one of the primary goals of population genetics. Previous studies used various selection signature methods and normalized the outputs score using specific windows, in kbp or based on the number of SNPs, to identify the candidate regions. The recent method of iSAFE claimed for high accuracy in pinpointing the candidate SNPs. In this study, we analyzed whole-genome resequencing (WGS) data of ten individuals from Austrian Fleckvieh (Bos taurus) and fifty individuals from 14 Chinese indigenous breeds (Bos taurus, Bos taurus indicus, and admixed). Individual WGS reads were aligned to the cattle reference genome of ARS. UCD1.2 and subsequently undergone single nucleotide variants (SNVs) calling pipeline using GATK. Using these SNVs, we examined the population structure using principal component and admixture analysis. Then we refined selection signature candidates using the iSAFE program and compared it with the classical iHS approach. Additionally, we run Fst population differentiation from these two cattle groups. We found gradual changes of taurine in north China to admixed and indicine to the south. Based on the population structure and the number of individuals, we grouped samples to Fleckvieh, three Chinese taurines (Kazakh, Mongolian, Yanbian), admixed individuals (CHBI_Med), indicine individuals (CHBI_Low), and a combination of admixed and indicine (CHBI) for performing iSAFE and iHS tests. There were more significant SNVs identified using iSAFE than the iHS for the candidate of positive selection and more detectable signals in taurine than in indicine individuals. However, combining admixed and indicine individuals decreased the iSAFE signals. From both within-population tests, significant SNVs are linked to the olfactory receptors, production, reproduction, and temperament traits in taurine cattle, while heat and parasites tolerance in the admixed individuals. Fst test suggests similar patterns of population differentiation between Fleckvieh and three Chinese taurine breeds against CHBI. Nevertheless, there are genes shared only among the Chinese taurine, such as PAX5, affecting coat color, which might drive the differences between these yellowish coated breeds, and those in the greater Far East region.
Introduction
Cattle are vital livestock for humans providing meat and milk for consumption, leather for protection, and power for plowing and transportation (FAO, 2015; Xu et al., 2015). Using available genetic evidence, there were two primary independent events postulated for the initial domestication of cattle, i.e., between 10,000 and 8,000 years ago for Bos taurus (B. taurus) in the Fertile Crescent and 8,000–6,000 years ago for Bos taurus indicus (B. indicus) in the Indus valley (Loftus et al., 1994). Since then, following human migration and trade, cattle have spread across the globe and undergone further evolutionary events for adaptation to local environments due to natural or selective breeding shaping each breed’s morphology, physiology, and behavior from its initial attributes (FAO, 2015; Xu et al., 2015; Wu et al., 2018). Currently, there are more than a thousand distinctive cattle breeds recognized worldwide (FAO, 2015).
The study of footprints in genes or genomics regions of livestock species due to the continuous evolutionary process is one of the main interests of population genetics (de Simoni Gouveia et al., 2014; Randhawa et al., 2016). With the development of genomics, these signals can be identified using single nucleotide polymorphisms (SNPs) arrays and whole-genome resequencing (WGS) data (Flori et al., 2009; Utsunomiya et al., 2013; Qanbari et al., 2014; Randhawa et al., 2014). These signals are inferred as they deviate from the neutral expectations in the patterns of genomic variations despite possible recombination events (Utsunomiya et al., 2013; de Simoni Gouveia et al., 2014). There are various proposed methods to detect these signals. Based on its approaches, they can be grouped into methods using local genetic diversity depression within a population, changes in allele frequency spectrum within and cross-populations, population allele differentiation across-populations, and haplotype homozygosity within and cross-populations (Utsunomiya et al., 2013; Randhawa et al., 2016).
Estimated for the first importation of B. taurus from West Asia around 3,900 years ago, there are ∼90 million cattle of various breeds in China, of which fifty-three of it are indigenous (Chen et al., 2018; National Bureau of Statistics, 2018). A previous study reported gradual transitions in cattle breed composition found across the country. B. taurus is predominantly found in the northern part, gradually admixed of B. taurus and B. indicus population in the central part, and pure B. indicus breeds to the southern part of the country (Chen et al., 2018). Another study (Zhang et al., 2020) using copy number variations (CNVs) supported that most Chinese breeds were hybrids of B. taurus and B. indicus.
Fleckvieh is a prominent dual-purpose breed in Austria with a population of around 1.5 million heads, corresponding to 76% of the total cattle population in the country (Kalcher et al., 2018). Also internationally known as Simmental, Fleckvieh genome was reported as one of the most studied B. taurus cattle after Frisian-Holstein (Randhawa et al., 2016). A previous study (Qanbari et al., 2014) utilized sequencing data of German Fleckvieh for selection signatures analysis. They employed ∼15 million autosomal SNPs inferred from the sequence data and found 106 candidates of selection regions linked to genes with the functionality of neuro-behavioral, sensory perception, and coat coloring patterns.
Most of the previous studies were limited in pinpointing exact locations of selection signatures, as they proposed large chunks of genomic regions in the size of a few kilobases to megabases as the candidates, containing many genes and thousands of polymorphisms (Randhawa et al., 2014; Xu et al., 2015; Bhati et al., 2020). They considered the region within linkage disequilibrium proximate as the candidate regions and reducing spurious effects of many SNPs signals as the reasons for using large scanning windows.
Recently developed methods of integrated Selection of Allele Favoured by Evolution - iSAFE are suggested to pinpoint the best candidate SNPs in selection signature regions (Akbari et al., 2018). iSAFE is designed to exploit signals from ongoing selective sweeps as it scores are based on the rank-order of the mutation in SNP candidates. Using phased genotype, this tool assigns intermediate score for each mutation based on the number of times it appears in different haplotypes weighted by total of all mutations found in the haplotype and its frequency. Then, overlapped scanning window is applied on these intermediate-scores of all mutations to find the best candidate SNP driving the selection, see Methods for details. iSAFE outperformed other tools, such as integrated Haplotype Score—iHS (Voight et al., 2006), in detecting favorable SNPs within large loci of 5 Mb without knowledge of demography, phenotype under selection, or functional annotations (Akbari et al., 2018). Thus, in this study, we aim to examine the candidate SNPs that drive the selection identified by iSAFE in genome-wide level, with no prior knowledge of candidate regions in selection, compared to the classical approach of integrated Haplotype Score—iHS (Voight et al., 2006; Szpiech and Hernandez, 2014) using sequence data of several Chinese breeds and Austrian Fleckvieh.
Materials and methods
Ethics statement
For this study, DNA was previously extracted from commercial AI bull semen straws. Thus, no ethical statement was further required.
Alignment, variant calling, and phasing genotypes
In this study, we utilized whole genome re-sequencing of sixty individuals from fourteen Chinese and one Austrian cattle breeds, namely: Dabieshan (n = 2), Dehong (n = 2), Dengchuan (n = 2), Fujian (n = 2), Guanling (n = 2), Kazakh (n = 6), Liping (n = 2), Luxi (n = 2), Mongolian (n = 12), Nanyang (n = 2), Qinchuan (n = 2), Wenling (n = 2), Tibetan (n = 2), Yanbian (n = 10), and Fleckvieh (n = 10). In the analysis, we applied the alignment to SNV calling pipeline in China Agricultural University computational cluster for all Chinese breeds and Vienna Scientific Cluster for Austrian Fleckvieh.
BWA-mem v.0.7.17 (Li and Durbin, 2010) aligned paired-end reads of FASTQ against cattle reference genome ARS_UCD1.2 (Rosen et al., 2020), resulting in a sequence alignment map (SAM) file. Subsequently, samtools v.1.10 (Li et al., 2009) sorted SAM file by chromosomes and converted to binary alignment map (BAM). Picard (https://broadinstitute.github.io/picard/) functions of MarkDuplicates flagged duplicate reads in BAM files and function of AddOrReplaceReadGroups modified read groups information accordingly. For subsequent steps, GATK v.4.1 (McKenna et al., 2010) was used. GATK functions of BaseRecalibrator and ApplyBQSR detected and corrected base quality scores of mapped reads nearby known variants. GATK HaplotypeCaller with–ERC GVCF option called individual genotype for each BAM file.
Individual GVCFs files were combined using the GenomicsDB function of GATK, allowing combinations of GVCFs called using different versions of GATK. The joint cohort of GenotypeGVCFs called the final VCF file using parameter–allow-old-rms-mapping-quality-annotation-data since individual GVCFs were called using a different version of GATK in two different computational clusters. Subsequently, we retained single nucleotide variants using GATK SplitVcfs function and filter variants with the following parameters “QD < 2.0, QUAL <30, SOR >3, FS > 60, MQ < 40, MQRankSum <12.5, ReadPosRankSUm < -8.0” following general GATK’s recommendation.
We added ancestral alleles (Naji et al., 2021a) in the info column of the vcf file separately for each autosome using–fill-aa script of VCFTools v.0.1.15 (Danecek et al., 2011). Subsequently, Bcftools v.1.7 (Li et al., 2009) retained the biallelic SNPs in the VCF. Then, genotypes in the VCF file were phased using Beagle v.5.1 (Browning et al., 2018) and indexed using tabix v.1.7-2 (Li et al., 2009) resulting final phased data for the analysis.
Principal component and admixture analysis
Before phasing steps, the multi-sample VCF file containing all autosomes was converted to binary plink format using VCFtools (Danecek et al., 2011). Plink1.9 (Chang et al., 2015) merged the dataset with additional individuals of Angus, Brahman, Gir, Holstein, Indian Zebu, Jersey, Kenana, Mangshi, Nelore, and Simmental breeds from the publicly available SRA NCBI database used in the previous study (Naji et al., 2021b). We filtered out variants with missing call rates exceeding 0.2. We used the–pca function with five eigenvectors for PCA on ∼4.5 million variants that were shared by all individuals. Admixture v.1.3 (Alexander et al., 2009) assessed population structures using the same input file as the PCA with K numbers of three to five. Outputs of PCA and admixture analysis were plotted using R (R Core Team, 2020).
Scanning for SNVs driving positive selection
The iSAFE test ranks all SNVs within linkage-disequilibrium (LD) regions with selective sweep signals based on their contribution to the selection signal. The program (Akbari et al., 2018) scans for signals up to 5 Mb using statistics derived solely from haplotypes and ancestral allele information. Under the hood, iSAFE used two steps; first, it searched for the best candidate mutations using selection of allele favored by evolution (SAFE) and then combined those signals for the final iSAFE score for the maximum region spanning 5 Mb.
In the first step, haplotype allele frequency (HAF) is used to distinguish haplotypes based on the sum of derived allele counts. Haplotypes are considered ‘distinct’ once they have different HAF scores and ‘carries a mutation e' if they have derived allele at site e with f mutation frequency. When a particular haplotype is a putative carrier of a favored allele, its HAF score increases due to carrying more derived alleles.
Based on these calculations, SAFE-score is defined as
Theoretically, selective sweeps will reduce the
As the k score reduces its power to pinpoint favored mutation due to most haplotypes becoming unique in larger windows, thus it applies a set of half-overlapped windows
We used the built-in program to pinpoint favored mutations for a non-overlapped window of 4 Mb in autosomes for each pool of individuals. Then, we concatenated iSAFE scores for all SNPs of all autosomes and applied the normal distribution’s right-tail probability density function (PDF) to infer the p-values as provided in R (R Core Team, 2020).
The iHS test was first proposed in 2006 and used for many studies to identify positive selections in livestock populations (Qanbari et al., 2014; Randhawa et al., 2016; Vatsiou et al., 2016). We used selscan (Szpiech and Hernandez, 2014) to perform the iHS test using phased data for each chromosome of individual pools. In the notation below, for each queried SNV
The unstandardized iHS score was calculated as
We used–weir-fst-pop in vcftools (Danecek et al., 2011) based on Fst estimation (Weir and Cockerham, 1984) to analyze selection signature between the population of each taurine breeds (Fleckvieh, Kazakh, Mongolian, and Yanbian) against a combination of all indicine and admixed Chinese individuals. Fst values were averaged with 10 Kb non-overlapping windows. The probability density function of normal distribution inferred the p-values considering the right tail only. Genome-wide significance -log10(p) of 7.301 was set as the threshold. For all the analysis, manhattan plots were built using the qqman R-package (Turner, 2018).
Functional annotation and gene expression
SnpEff (Cingolani et al., 2012) annotated SNVs and windows positions above the threshold using Ensembl version of ARS_UCD1.2 annotation file. For functions of individual genes, we referred to the one listed in https://www.genecards.org/and https://www.ncbi.nlm.nih.gov/gene/. We further considered only genes indicated by SNVs within coding regions. We used pantherdb.org to classify the functionality of associate genes listed by different statistical methods to its gene ontology (GO) terms. We annotated significant genes indicated by the tests for their expression level using cattle gene atlas (Fang et al., 2020). We retained the information of maximum expression level in fragments per kilo base per million mapped reads (FPKM) and its corresponding tissue where the maximum FPKM is found for each indicated gene. In this repository, the mean and standard deviation for FPKM across 91 tissues and 447 individuals are 26.79 and 730.56, respectively.
Results
Whole-genome sequence data of 60 individuals from 14 breeds of Chinese cattle and Austrian Fleckvieh were aligned against the ARS_UCD1.2 reference genome. On average, there were ∼316 million paired reads per individual FASTQ, with length varies from 90 to 148 bases per read. In total, ∼60 million SNVs passed the set of hard filtration for all autosomes with an average depth of ∼9 × Table 1 indicated alignments summary for each breed with details provided in Supplementary Table S1. Figure 1 depicted the origin of Chinese cattle and Austrian Fleckvieh on the world map.
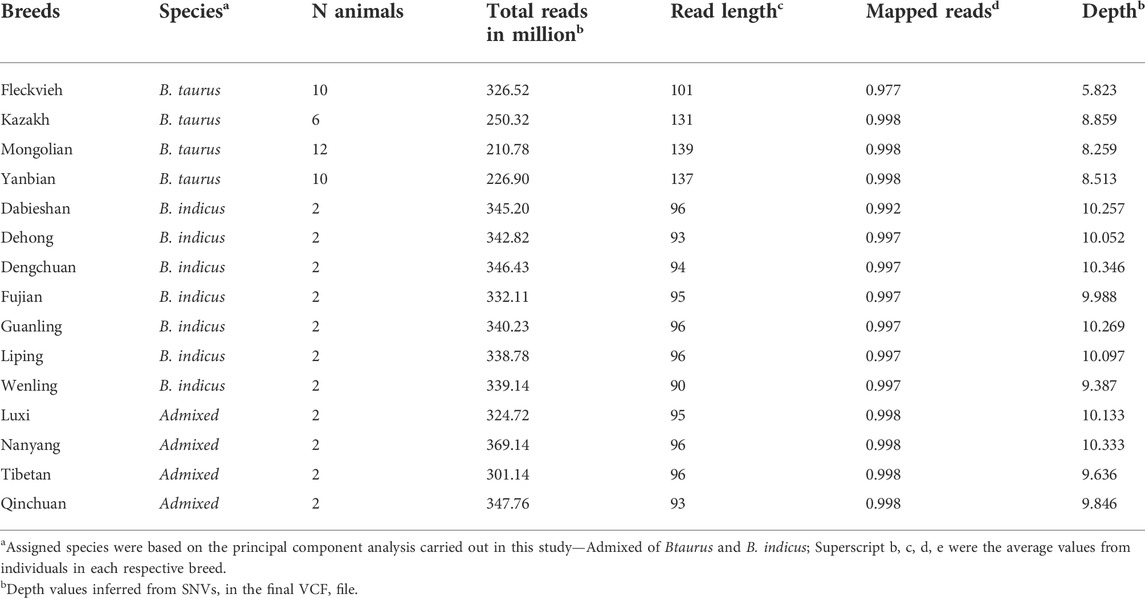
TABLE 1. Alignment summary of the dataset.
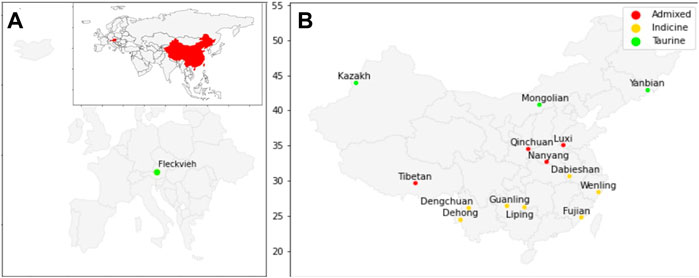
FIGURE 1. Map of origin for cattle used in this study; (A) Austrian Fleckvieh origin on European map with an inset of China and Austria in the world map; (B) Position of Chinese cattle breeds on the maps.
Principal component and admixture analysis
We inferred the population structure using PCA from ∼4.5 million SNVs shared by all individuals in the dataset. The PCA explains 47.37, 10.20, 6.68, 6.52, and 5.89 percent of variance for components one to five, respectively. Figure 2 depicted the clustering of all individuals based on the first and second components. We observed a clear separation between the taurine and indicine cattle by the first component regardless of its origin. The three Chinese breeds, Kazakh, Mongolian, and Yanbian, were clustered together with Austrian Fleckvieh and other renowned B. taurus breeds, such as Angus, Holstein, and Jersey. Nanyang, Luxi, Qinchuan, and Tibetan were admixed as they were between clusters of B. taurus and B. indicus. While Dabieshan, Dehong, Dengchuan, Fujian, Guanling, Liping, and Wenling were clustered together with other B. indicus breeds such as Brahman, Nelore, and Gir.
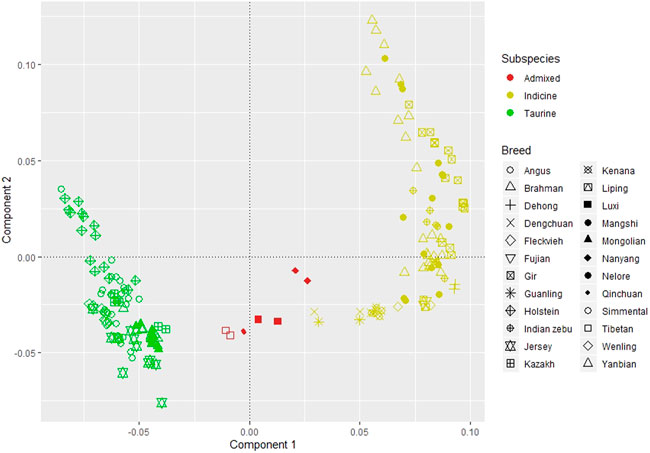
FIGURE 2. Principal component analysis; component 1 explains 47.37 percent of variants and component 2 for 10.20 percent.
Admixture analysis for those breeds using K from two to five supported the results of PCA, see Figure 3. Thus, based on these results and considering the number of individuals in each breed, we pooled individuals into separate groups for further selection signature analysis, i.e. Fleckvieh, Kazakh, Mongolian, Yanbian, CHBI_Low (seven Chinese B. indicus breeds), CHBI_Med (four Chinese admixed breeds), and CHBI(combination of CHBI_Low and CHBI_Med).
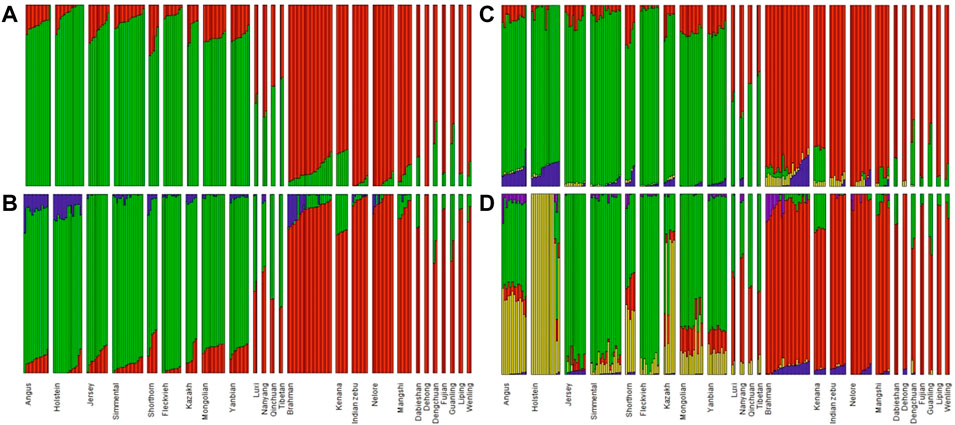
FIGURE 3. Admixture analysis using (A) K = 22; (B) K = 3; (C) K = 4; and (D) K = 5.
The PCA and admixture results matched the geographical origin of individuals as in Figure 1. Kazakh, Mongolian, and Yanbian were sampled from the northern part of Chinese. CHBI_Med individuals were from the middle latitude of the country. While the CHBI_Low individuals were originated from the southern part of the country. Coincidentally, Austrian Fleckvieh originated from a region with latitude around 48°, while three Chinese taurine breeds were also coming from a similar temperate climate of 42° latitudes.
Comparison of methods in scanning for positive selection
We identified candidate SNVs for positive selection using two within-population tests of iSAFE and iHS. Additionally, we performed one cross-population test of Fst between taurine breeds against CHBI individuals. Phased vcf files were separated for each pool of individuals and underwent both tests, respectively. Table 2 indicated the descriptive statistics of significant SNVs of respective tests and individual pools. Figure 4 and Figure 5 depicted the manhattan plots of B. taurus and other CHBI groups, respectively.
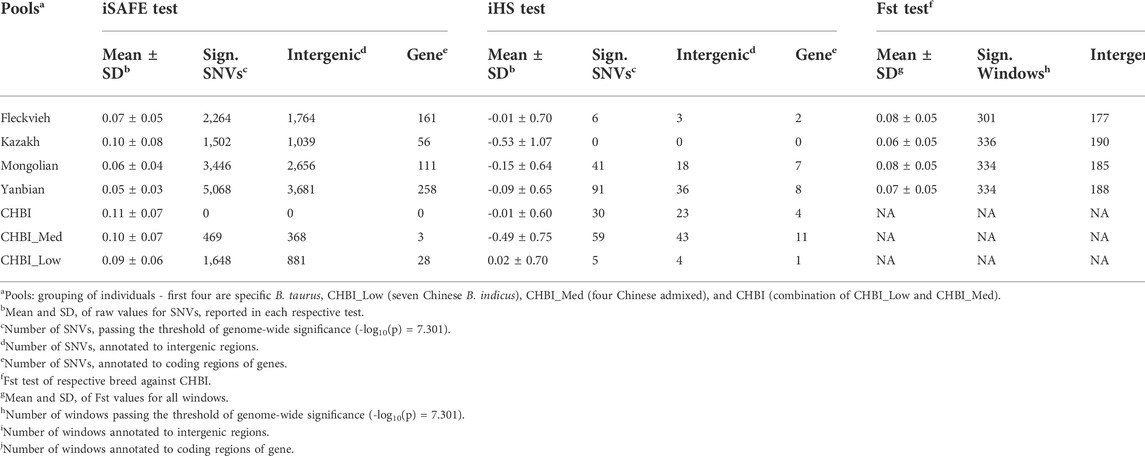
TABLE 2. Summary of output scores of SNVs and windows from iHS, iSAFE, and Fst tests.
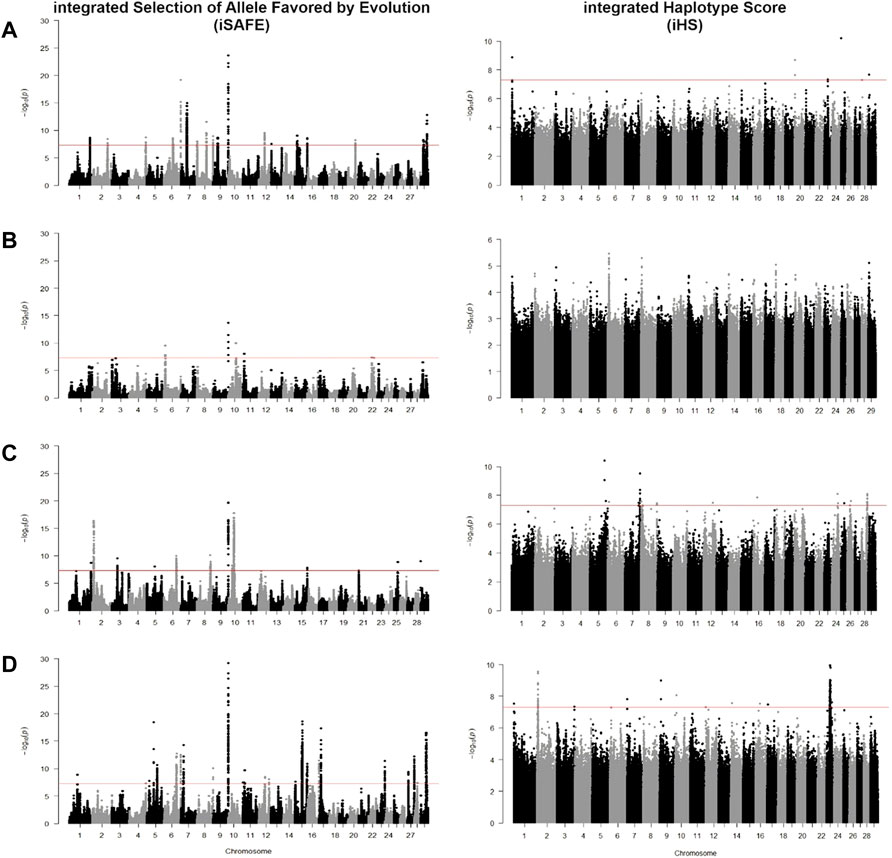
FIGURE 4. Manhattan plot for iSAFE and iHS tests for (A) Fleckvieh; (B) Kazakh; (C) Mongolian; and (D) Yanbian.
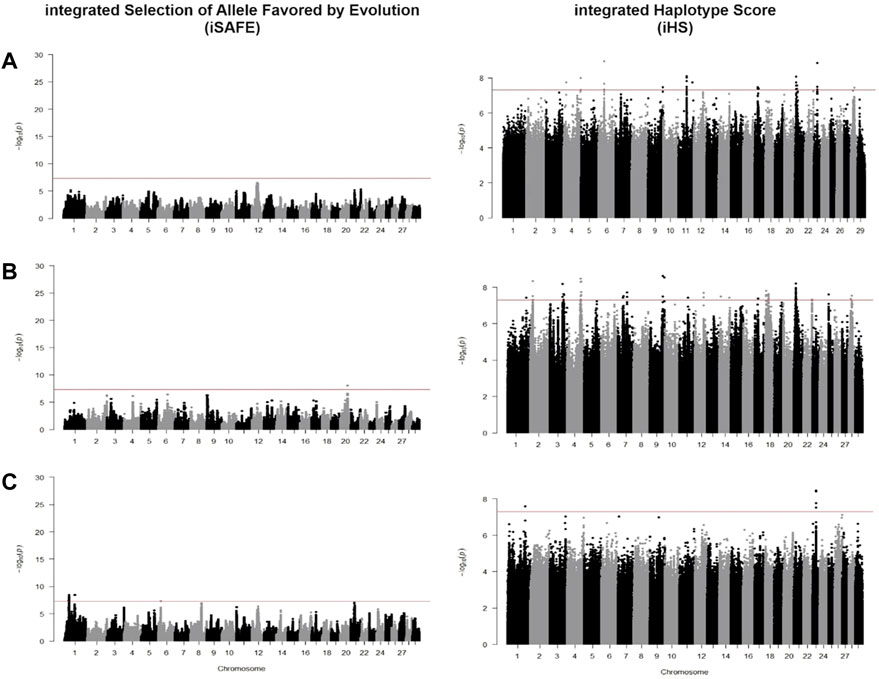
FIGURE 5. Manhattan plot for iSAFE and iHS tests for (A) CHBI; (B) CHBI_Med; and (C) CHBI_Low.
Using iSAFE, we found several peaks of SNVs for B. taurus breeds. For all B. taurus, the strongest signals come from chromosome nine around 104.4 Mb. CHBI_Med and CHBI_Low had independently signals on chromosome 20 and 1, respectively. We did not find significant SNVs for CHBI. Around 71 percent of SNVs indicated as significant in the iSAFE test were annotated to intergenic regions, as stated in Table 2. A list of significant genes indicated by iSAFE, iHS, and Fst is provided in Supplementary Tables S2-S4.
In Fleckvieh, Kazakh, Mongolian, and Yanbian, two genes of ENSBTAG00000045624 and ENSBTAG00000047934, known also as OR10D1M, were genes indicated by the most significant iSAFE score. The later gene belongs to the olfactory receptor family, which interacts with odorant molecules in the nose, initiating the neuronal response that starts a sense of smell. This gene was neither found in significant regions of CHBI_Low nor CHBI_Med. ENSBTAG00000053225 (OR8B60) and ENSBTAG00000050546 (OR8AR1) were olfactory receptor genes indicated in Fleckvieh, Kazakh, and Yanbian. All these top indicated genes are located at chr 9, around 104.3 Mb. Within 100 Kb vicinity of these olfactory genes, we found FAM120B, DLL1, PSMB1, and PDCD2. FAM120B has several associations of twinning rate in mammals, fat deposition in chicken and inflects pig sperm maturation during spermatogenesis due to its function in adipogenesis regulation of PPARG (Vinet et al., 2012; Moreira et al., 2015; Gòdia et al., 2020). In human, DLL1 plays role in Notch signaling pathway regulating cell differentiation and proliferation in embryonic development and maintenance of adult stem cells (Jaleco et al., 2001). In cattle, activation of Notch pathway by miRNA targeting DLL1 leads to restrain adipose differentiation which might lead to different subcutaneous adipose tissue between Wagyu and Holstein (Guo et al., 2017). While in embryo development, in vitro expression of PSMB1 is significantly reduced after bovine oocyte maturation (Adona et al., 2011). Similarly, PDCD2 plays also role in embryo development as indicated of its activation during bovine 16-cell stage (Graf et al., 2014).
Overlapped genes found in Fleckvieh and Yanbian were ACP1, ALKAL2, ENSBTAG00000045328, ENSBTAG00000045624, ENSBTAG00000047934, ENSBTAG00000050546, ENSBTAG00000051204, ENSBTAG00000053225, POLN, SH3YL1 and U6. ALKAL2 is associated with reproduction function and upregulated in granulosa cell of bacteria-infected uterus in Holstein heifers (Horlock et al., 2020) while POLN was reported to influence mature body size in US sheep population (Posbergh and Huson, 2021). For CHBI_Med, CDH12 is associated with longevity and desaturation of milk fatty acids as reported in few dairy cattle (Mészáros et al., 2014; Cecchinato et al., 2019). For CHBI_Low, CYP2U1 is linked to milk fat secretion in Sahiwal cattle in India (Illa et al., 2021).
Using iHS, we did not find significant SNVs for Kazakh. In contrary, Yanbian had 91 significant SNVs. These SNVs were observed as a peak in chromosome 23. Significant SNV at chr23:26, 067, 413 was detected both in Yanbian and Fleckvieh. For Mongolian, we observed several peaks on chromosomes five and 7. A total of 30, 59, and five SNVs were above the threshold for CHBI, CHBI_Med, and CHBI_Low, respectively, with no overlaps among them. For all groups, the mean iHS score was generally in a negative value except for the CHBI_Low. 58 percent of significant SNVs in iHS were annotated to intergenic regions, as indicated in Table 2.
For Fleckvieh, SNVs with significant iHS at chromosome 20 around 3.8 Mb overlapped to STK10 gene, which is significantly associated with slaughter weight and carcass quality in several beef cattle breeds (Karisa et al., 2013; Hay and Roberts, 2018). For Mongolian, SNVs with significant iHS scores were overlapped with the novel gene of ENSBTAG00000050324, PTPRM, GRID1, CACNA1C, SORCS3, NRG3, and TXNDC2. PTPRM has extended function in regulating cellular growth, differentiation, mitotic cycle, and is associated with scrotal circumference in Nellore and Brahman cattle (Melo et al., 2019). GRID1 is known for its function in the central nervous system and is down-regulated in fetuses carrying deletion variants in PEG3 domain leading to stillbirth (Flisikowski et al., 2012). CACNA1C is linked to immune defense and was hyper-methylated in Angus during stress of high-temperature high-humidity period (Del Corvo et al., 2021). SORCS3 was highly associated with temperament trait and average daily gain (Xu et al., 2019; Shen et al., 2022). NRG3 is associated with fat yield component in sheep production (García-Gámez et al., 2012). While TXNDC2 is linked to average daily gain and age at puberty in Korean cattle (Edea et al., 2020).
For Yanbian, the top genes indicated by significant iHS score were ENSBTAG00000026163, ENSBTAG00000007075, C2H2orf88, TBCA, HIBCH, TMEM71, SMYD3, ARFIP1, and HDAC4, which all these genes play a role in cellular proliferation and transcription factors. TBCA is associated with sire conception rate in the US Jersey cattle (Rezende et al., 2018). HIBCH is one of candidate genes in association study of calving performance in Charolais population (Purfield et al., 2015). While ARFIP1 is associated with milk production traits in Holstein (Lee et al., 2016).
For CHBI, significant SNVs were in novel genes of ENSBTAG00000026163, ENSBTAG00000053922, PBLD, and AFDN, which encodes a multi-domain protein involved in signaling and organization of cell junctions during embryogenesis. For CHBI_Med, ENSBTAG00000020723, PDE10A, AKAP13, KLHL25, ENSBTAG00000054043, FAM234A, PODXL, RUVBL1, and ABHD1 were indicated. AKAP13 and KLHL25 were also reported as selection candidates in North African cattle (Ben-Jemaa et al., 2020). RUVBL1 is associated with tolerance of African cattle towards heat and parasites stress (Taye et al., 2017a; Yougbaré et al., 2021). While in CHBI_Low, ENSBTAG00000026163 is a gene indicated by significant SNV.
Using Fst test, we found a similar pattern among the B. taurus cattle as shown in Figure 6. There were 224 similar significant windows in Fleckvieh Kazakh, 181 in Fleckvieh-Mongolian, 208 in Fleckvieh-Yanbian, 185 in Kazakh-Mongolian, 217 in Kazakh-Yanbian and 222 in Mongolian-Yanbian. Among these, 132 windows were significant in all of Fleckvieh, Kazakh, Mongolian, and Yanbian. Out of 132, 73 windows were annotated to intergenic regions and the rest to 60 genes. Within these genes, LCT was reported as selection candidates in several Italian cattle and its mutations in humans, irrespective of location and mutation type, are linked to congenital lactase deficiency (Torniainen et al., 2009; Sorbolini et al., 2016). DHRS3 is known for its importance in retinoic acid metabolism and is essential in regulating body axis formation during embryonic development (Kam et al., 2013). PRKCZ, where young calves are exposed to hypoxia, leads to anti-replication activity of cells related to this gene in pulmonary artery adventitia (Das et al., 2008).
FIGURE 6. Manhattan plot for Fst test for (A) Fleckvieh; (B) Kazakh; (C) Mongolian; and (D) Yanbian against CHBI.
Several genes indicated by Fst were found exclusively in three Chinese taurine breeds and not in Fleckvieh. These genes might be related to the adaptation process to the local habitat. For example, ANXA10 was detected as a selection candidate in Kholmogory cattle and deletion-type CNV of 34 kb identified in this gene was linked to embryonic mortality in Japanese Black cattle (Sasaki et al., 2016; Yurchenko et al., 2018). C14H8orf34 is associated with claims on epinephrine hormone excretion in the urinary due to many pathways of metabolism acceleration under stress situations (de Camargo et al., 2015). CACNA2D3 plays role in active calcium ion transport and was highly expressed in Longissimus Lumborom than Psoas Major muscles after postmortem in Chinese Jinjiang cattle (Yu et al., 2019). PAX5 is associated with the proportion of black color in Holstein (Hayes et al., 2010). PLAG1 is a known gene with pleiotropic effects on body weight and fertility traits (Fortes et al., 2013; de Camargo et al., 2015; Yurchenko et al., 2018). TAC3 was associated with reproduction process as highly expressed in non-pregnant heifers compared to heifers that later became pregnant (Dickinson et al., 2018).
Go classification and expression level
GO classification for genes indicated by iHS, iSAFE, and Fst tests is provided in Supplementary Table S5. Cellular process (GO:0009987) was the top GO term indicated by significant genes irrespective of the test and individuals pool. Metabolic process (GO:0008152) was the second top GO term for iSAFE test in Fleckvieh and Mongolian, while for Kazakh and Yanbian, the second top was biological regulation (GO:0065007). There were 10, 5, 2, and 13 genes for developmental process (GO:0032502) indicated by iSAFE test for Fleckvieh, Kazakh, Mongolian, and Yanbian, respectively. In general, Yanbian had more coverage to broader GO terms like reproduction (GO:0000003), reproductive process (GO:0022414), multi-organism process (GO:0051704), growth (GO:0040007) perhaps due to the higher number of genes detected by iSAFE compared to Fleckvieh, Kazakh, and Mongolian.
We annotated significant genes indicated by iHS and iSAFE toward their maximum expression level (FPKM) and the corresponding tissue as listed in the repository of cattle gene atlas (Fang et al., 2020). Rectangular bar in Figure 7 depicted the average FPKM of significant genes for the corresponding test and individual pool. In general, the mean FPKM values by both tests were higher than the mean of FPKM records of the full repository (26.79). iSAFE indicated higher mean of FPKM than the iHS except for CHBI_Med and CHBI where no SNVs were significant in iSAFE tests. Supplementary Figures S1, S2 depicted cloud plots for the associated tissues with the FPKM for iSAFE and iHS tests. Genes indicated by iHS were mostly highly expressed in the ileum tissue as indicated in Fleckvieh, Yanbian, CHBI, and CHBI_Low. For iSAFE, the significant genes for all individual pools were all highly expressed in the sperm, see Supplementary Figure S1.
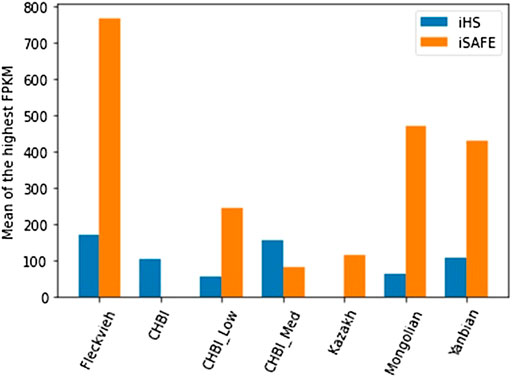
FIGURE 7. Mean of the highest FPKM for all significant genes indicated by iHS and iSAFE tests in each respective individual pool.
For Fleckvieh, TFF1 was the gene listed by iSAFE with the highest FPKM (10,413) in abomasum tissue. TFF1 was reported to be associated with mammary development and secretion of minerals to the bovine milk (Stella et al., 2010; Gao et al., 2017). Ten modifiers and one low impact were estimated for the SNVs indicated within TFF1 in Fleckvieh. For Kazakh, the highest expressed gene was ALDH1A2 with 250 FPKM from stalk median eminence tissue and is associated with carcass weight in beef cattle (Willing et al., 2012). Functional modifiers’ impact were annotated for all 13 SNVs in ALDH1A2. For Mongolian cattle, ALDOA was the highest expressed gene with 12,960 FPKM in chorid plexus tissue in the brain. ALDOA is primarily related to glycolytic and energy metabolism (Wærp et al., 2019). TNNT2 identified in Yanbian was highly expressed in heart tissue with 5006 FPKM. Seven SNVs with modifier impact were associated with this gene, which is related to the striated muscle contraction due to intracellular calcium ion concentration and found in a previous study as selection candidates in Holstein cattle (Taye et al., 2017b).
Discussion
This study indicated a gradual shifting of taurine cattle in northern China to admixed and pure indicine cattle towards the southern part of China, similar to the report from the previous studies (Chen et al., 2018; Zhang et al., 2020). Zhang et Al (2020) indicated that Mongolian and Kazakh, two Chinese taurine in our study, were well adapted to cold winters. They suggested that the admixture and introgression of taurine and indicine from north to south can be affiliated to loci in the genome, which might help individuals adapt to the local environment (Wu et al., 2018). A previous study (Gao et al., 2017) suggested that Chinese taurine cattle in the north shared the same genetic ancestry to several Central Asia, Russian-Yakutstk, Korean and Japanese cattle (Turano-Mongolian) in the greater region due to past activities of nomads and the Mongolian empire.
Previous studies used various selection signature methods and normalized the outputs score using specific windows, in basepairs or based on the number of SNPs, to identify the candidate regions (Qanbari et al., 2014; Xu et al., 2015; Yurchenko et al., 2018; Bhati et al., 2020). We applied a similar approach for the Fst test using non-overlapping 10 Kb windows. However, for within-population tests of iHS and iSAFE, we did an experimental analysis to point out the causal SNV mutations in coding regions that significantly drive selective sweeps in genome-wide level. We found that iHS indicated fewer signals passing the genome-wide significant threshold than iSAFE in any breed. This is in line with simulations in the original paper where iSAFE could detect almost double the signals for favoured mutations than iHS (Akbari et al., 2018). Both methods were associated with declining performance in detecting mutations in regions that are closed to fixation, yet we found no overlapped genes indicated by these two tests.
Generally, our study suggested higher selection signals for taurine than indicine cattle in both iSAFE and iHS tests. For example, in the iHS test, Yanbian had 91 significant SNVs while CHBI_Med had only 59. Similarly, in the iSAFE test, Yanbian had around five thousand significant SNVs while CHBI_Med had a far less, around 469 SNVs. Our finding is similar to previous study where indicine cattle of Gyr and Nelore had substantially fewer regions proposed as selection evidence compared to taurine cattle of Brown Swiss and Angus (Utsunomiya et al., 2013). Moreover, pools of indicine cattle in our study were a combination of several breeds due to limited number of individuals to a suggested minimum of six individuals for better population genetic analysis (Willing et al., 2012). Thus as the results, we observed decayed of the iSAFE signal in CHBI as the combination of CHBI_Low and CHBI_Med, compared to the scenario when both groups were tested independently. We assumed that the signals for each indicine breed would be more significant and apparent if the sample size were equal to the taurine breed. However, due to the circumstances, we could not do it for the current study.
As indicated in the results section, more than half of the signals fall under intergenic regions. We did not consider SNVs found in those regions and retained only SNPs in the coding regions. Within these SNVs, several were without official gene ID names. For example, 15 SNVs creating a peak in iHS test chromosome 23 of Yanbian were in an active transcription of ENSBTAG00000007075 gene. According to https://bgee.org/?page=gene&gene_id=ENSBTAG00000007075, this gene was described as a major histocompatibility complex, class I, A-like precursor and has paralogs to BOLA-A and JSP.1 genes. And has an association with feeding efficiency in Norwegian Red heifers where it is upregulated during diet changes from low-protein-high-energy to low-protein-low-energy feed (Wærp et al., 2019). Yet, for GO classification, we considered only genes with official ID names overlooking functions of genes with prefix ENBST names.
KIT was indicated as one of selection candidate genes affecting coat colors (Flori et al., 2009; Stella et al., 2010; Xu et al., 2015). In chromosome six around 70 Mb, where KIT is located, there were 236 SNPs in the phased genotypes. Yet, we did not find any significant SNVs passing the genome-wide threshold, though the maximum iSAFE scores ranges from 0.04 to 0.20 among the B. taurus, see Supplementary Figure S3. Apparently, the threshold for iSAFE on genome-wide level has biased the findings to SNVs within highly-scores segments. Meanwhile each genome segment may have different significance level for assigning SNV as the best candidate of selection. This was demonstrated in the original manuscript where a SNV with score of 0.10 was the best candidate in HBB while score of 0.61 was the best candidate for EDAR (Akbari et al., 2018). However, genes indicated by genome-wide threshold of iSAFE might act as the driver of selection within the LD segments as they had the highest scores. Though the functionality of these genes were quite spurious, generally they had higher expression in tissues, particularly in sperm, compared to ones indicated by iHS.
In the Fst test, we found PAX5 as a candidate gene in three Chinese taurine breeds, not shared with Fleckvieh, which function is associated with black color patterns (Hayes et al., 2010). In general, Chinese indigenous cattle, including these three breeds, are considered as ‘yellow’ cattle, thought the they are actually in different level of brownish colors. A specific PAX5 might affect the color pattern of these breeds, separating them from other Turano-Mongolian cattle, such as the Mongolian and Korean cattle, which still retain their original dark-brown coat color pattern (Gao et al., 2017).
Our findings suggested that three Chinese taurine cattle breeds shared a considerable amount of candidate regions with Fleckvieh. Though we can confirm that there was no recorded genetic material exchange between Austria and China, it was reported that there were programs for improving the productivity of local breeds by crossing to European breeds in the last decades (Gao et al., 2017). As those European breeds might have similar characteristics as Fleckvieh, thus we cannot attribute similarity between Austrian Fleckvieh and Chinese taurine solely due to independent co-selection of nature, but also possibly due to recent crossing with other European breeds.
Conclusion
Our study confirmed a gradient of taurine and indicine admixed cattle from north to south of China. More significant SNVs were identified using iSAFE than the iHS for the candidate of positive selection and more detectable signals in taurine than in indicine individuals. However, combining individuals of different breeds decaying the iSAFE signals. From both tests, significant SNVs are linked to the olfactory receptors, production, reproduction, and temperament traits in taurine cattle, while heat and parasites tolerance in the admixed individuals. Fst test suggests similar patterns of population differentiation between Fleckvieh and three Chinese taurine breeds against Chinese indicine breeds. However, there are genes shared only among the Chinese taurine, such as PAX5, affecting black coat color, which might underlying differences of these breeds to other Turano-Mongolian cattle.
Data availability statement
The datasets presented in this article are not readily available because the animals and subsequently their genomic data are property of respective breeding organizations. Requests to access these datasets should be directed to GM (gabor.meszaros@boku.ac.at) for the data set from Austria or to XD (xiangdongding@hotmail.com) for the data sets from China.
Author contributions
XD and GM conceived and designed the study. YJ collected the samples. MMN and YJ ran the analysis. MMN drafted the manuscript. YTU, BDR, JS, CW, LJ, QZ, YZ, XD, and GM interpreted the analysis results and critically revised the manuscript. All authors reviewed and approved the final manuscript.
Funding
Collaborative project of University of Natural Resources and Life Sciences, Vienna and Chinese Agricultural University, Beijing is supported by the National Key Research and Development Project (2019YFE0106800) and WTZ project. MMN is supported by the Ernst Mach Grant, ASEA UNINET (OeAD Austria).
Acknowledgments
Computations were carried out in Chinese Agricultural University HPC and Vienna Scientific Cluster (VSC3)
Conflict of interest
The authors declare that the research was conducted in the absence of any commercial or financial relationships that could be construed as a potential conflict of interest.
Publisher’s note
All claims expressed in this article are solely those of the authors and do not necessarily represent those of their affiliated organizations, or those of the publisher, the editors and the reviewers. Any product that may be evaluated in this article, or claim that may be made by its manufacturer, is not guaranteed or endorsed by the publisher.
Supplementary material
The Supplementary Material for this article can be found online at: https://www.frontiersin.org/articles/10.3389/fgene.2022.974787/full#supplementary-material
References
Adona, P., de Bem, T., Mesquita, L., Rochetti, R., and Leal, C. (2011). Embryonic development and gene expression in oocytes cultured in vitro in supplemented pre-maturation and maturation media. Reproduction Domest. Animals 46, e31–e38. doi:10.1111/j.1439-0531.2010.01618.x
Akbari, A., Vitti, J. J., Iranmehr, A., Bakhtiari, M., Sabeti, P. C., Mirarab, S., et al. (2018). Identifying the favored mutation in a positive selective sweep. Nat. Methods 15, 279–282. doi:10.1038/nmeth.4606
Alexander, D. H., Novembre, J., and Lange, K. (2009). Fast model-based estimation of ancestry in unrelated individuals. Genome Res. 19, 1655–1664. doi:10.1101/gr.094052.109
Ben-Jemaa, S., Mastrangelo, S., Lee, S.-H., Lee, J. H., and Boussaha, M. (2020). Genome-wide scan for selection signatures reveals novel insights into the adaptive capacity in local North African cattle. Sci. Rep. 10, 19466. doi:10.1038/s41598-020-76576-3
Bhati, M., Kadri, N. K., Crysnanto, D., and Pausch, H. (2020). Assessing genomic diversity and signatures of selection in Original Braunvieh cattle using whole-genome sequencing data. BMC Genomics 21, 27. doi:10.1186/s12864-020-6446-y
Browning, B. L., Zhou, Y., and Browning, S. R. (2018). A one-penny imputed genome from next-generation reference panels. Am. J. Hum. Genet. 103, 338–348. doi:10.1016/j.ajhg.2018.07.015
Cecchinato, A., Macciotta, N. P. P., Mele, M., Tagliapietra, F., Schiavon, S., Bittante, G., et al. (2019). Genetic and genomic analyses of latent variables related to the milk fatty acid profile, milk composition, and udder health in dairy cattle. J. Dairy Sci. 102, 5254–5265. doi:10.3168/jds.2018-15867
Chang, C. C., Chow, C. C., Tellier, L. C., Vattikuti, S., Purcell, S. M., and Lee, J. J. (2015). Second-generation PLINK: Rising to the challenge of larger and richer datasets. GigaScience 4, 7. doi:10.1186/s13742-015-0047-8
Chen, N., Cai, Y., Chen, Q., Li, R., Wang, K., Huang, Y., et al. (2018). Whole-genome resequencing reveals world-wide ancestry and adaptive introgression events of domesticated cattle in East Asia. Nat. Commun. 9, 2337. doi:10.1038/s41467-018-04737-0
Cingolani, P., Platts, A., Wang, L. L., Coon, M., Nguyen, T., Wang, L., et al. (2012). A program for annotating and predicting the effects of single nucleotide polymorphisms, SnpEff: SNPs in the genome of Drosophila melanogaster strain w1118; iso-2; iso-3. Fly. (Austin) 6, 80–92. doi:10.4161/fly.19695
Danecek, P., Auton, A., Abecasis, G., Albers, C. A., Banks, E., DePristo, M. A., Handsaker, R. E., Lunter, G., Marth, G. T., Sherry, S. T., McVean, G., Durbin, R., et al. 1000 Genomes, and Project Analysis Group (2011). The variant call format and VCFtools. Bioinformatics 27, 2156–2158. doi:10.1093/bioinformatics/btr330
Das, M., Burns, N., Wilson, S. J., Zawada, W. M., and Stenmark, K. R. (2008). Hypoxia exposure induces the emergence of fibroblasts lacking replication repressor signals of PKCzeta in the pulmonary artery adventitia. Cardiovasc. Res. 78, 440–448. doi:10.1093/cvr/cvn014
de Camargo, G., Aspilcueta-Borquis, R., Fortes, M., Porto-Neto, R., Cardoso, D., Santos, D., et al. (2015). Prospecting major genes in dairy buffaloes. BMC Genomics 16, 872. doi:10.1186/s12864-015-1986-2
de Simoni Gouveia, J. J., da Silva, M. V. G. B., Paiva, S. R., and de Oliveira, S. M. P. (2014). Identification of selection signatures in livestock species. Genet. Mol. Biol. 37, 330–342. doi:10.1590/s1415-47572014000300004
Del Corvo, M., Lazzari, B., Capra, E., Zavarez, L., Milanesi, M., Utsunomiya, Y. T., et al. (2021). Methylome patterns of cattle adaptation to heat stress. Front. Genet. 12, 633132. doi:10.3389/fgene.2021.633132
Dickinson, S. E., Griffin, B. A., Elmore, M. F., Kriese-Anderson, L., Elmore, J. B., Dyce, P. W., et al. (2018). Transcriptome profiles in peripheral white blood cells at the time of artificial insemination discriminate beef heifers with different fertility potential. BMC Genomics 19, 129. doi:10.1186/s12864-018-4505-4
Edea, Z., Jung, K. S., Shin, S.-S., Yoo, S.-W., Choi, J. W., and Kim, K.-S. (2020). Signatures of positive selection underlying beef production traits in Korean cattle breeds. J. Anim. Sci. Technol. 62, 293–305. doi:10.5187/jast.2020.62.3.293
Fang, L., Cai, W., Liu, S., Canela-Xandri, O., Gao, Y., Jiang, J., et al. (2020). Comprehensive analyses of 723 transcriptomes enhance genetic and biological interpretations for complex traits in cattle. Genome Res. 30, 790–801. doi:10.1101/gr.250704.119
FAO (2015). The second report on the state of the world’s animal genetic resources for food and agriculture. Rome, Italy: Food and Agriculture Organization.
Flisikowski, K., Venhoranta, H., Bauersachs, S., Hänninen, R., Fürst, R. W., Saalfrank, A., et al. (2012). Truncation of MIMT1 gene in the PEG3 domain leads to major changes in placental gene expression and stillbirth in cattle. Biol. Reprod. 87, 140. doi:10.1095/biolreprod.112.104240
Flori, L., Fritz, S., Jaffrézic, F., Boussaha, M., Gut, I., Heath, S., et al. (2009). The genome response to artificial selection: A case study in dairy cattle. PLoS One 4, e6595. doi:10.1371/journal.pone.0006595
Fortes, M. R. S., Reverter, A., Kelly, M., McCulloch, R., and Lehnert, S. A. (2013). Genome-wide association study for inhibin, luteinizing hormone, insulin-like growth factor 1, testicular size and semen traits in bovine species. Andrology 1, 644–650. doi:10.1111/j.2047-2927.2013.00101.x
Gao, Y., Gautier, M., Ding, X., Zhang, H., Wang, Y., Wang, X., et al. (2017). Species composition and environmental adaptation of indigenous Chinese cattle. Sci. Rep. 7, 16196. doi:10.1038/s41598-017-16438-7
García-Gámez, E., Gutiérrez-Gil, B., Sahana, G., Sánchez, J.-P., Bayón, Y., and Arranz, J.-J. (2012). GWA analysis for milk production traits in dairy sheep and genetic support for a QTN influencing milk protein percentage in the LALBA gene. PLOS ONE 7, e47782. doi:10.1371/journal.pone.0047782
Gòdia, M., Casellas, J., Ruiz-Herrera, A., Rodríguez-Gil, J. E., Castelló, A., Sánchez, A., et al. (2020). Whole genome sequencing identifies allelic ratio distortion in sperm involving genes related to spermatogenesis in a swine model. DNA Res. 27, dsaa019. doi:10.1093/dnares/dsaa019
Graf, A., Krebs, S., Heininen-Brown, M., Zakhartchenko, V., Blum, H., and Wolf, E. (2014). Genome activation in bovine embryos: Review of the literature and new insights from RNA sequencing experiments. Anim. Reprod. Sci. 149, 46–58. doi:10.1016/j.anireprosci.2014.05.016
Guo, Y., Zhang, X., Huang, W., and Miao, X. (2017). Identification and characterization of differentially expressed miRNAs in subcutaneous adipose between Wagyu and Holstein cattle. Sci. Rep. 7, 44026. doi:10.1038/srep44026
Hay, E. H., and Roberts, A. (2018). Genome-wide association study for carcass traits in a composite beef cattle breed. Livest. Sci. 213, 35–43. doi:10.1016/j.livsci.2018.04.018
Hayes, B. J., Pryce, J., Chamberlain, A. J., Bowman, P. J., and Goddard, M. E. (2010). Genetic architecture of complex traits and accuracy of genomic prediction: Coat colour, milk-fat percentage, and type in Holstein cattle as contrasting model traits. PLoS Genet. 6, e1001139. doi:10.1371/journal.pgen.1001139
Horlock, A. D., Piersanti, R. L., Ramirez-Hernandez, R., Yu, F., Ma, Z., Jeong, K. C., et al. (2020). Uterine infection alters the transcriptome of the bovine reproductive tract three months later. Reproduction 160, 93–107. doi:10.1530/REP-19-0564
Illa, S. K., Mukherjee, S., Nath, S., and Mukherjee, A. (2021). Genome-wide scanning for signatures of selection revealed the putative genomic regions and candidate genes controlling milk composition and coat color traits in sahiwal cattle. Front. Genet. 12, 699422. doi:10.3389/fgene.2021.699422
Jaleco, A. C., Neves, H., Hooijberg, E., Gameiro, P., Clode, N., Haury, M., et al. (2001). Differential effects of Notch ligands Delta-1 and Jagged-1 in human lymphoid differentiation. J. Exp. Med. 194, 991–1002. doi:10.1084/jem.194.7.991
Kam, R. K. T., Shi, W., Chan, S. O., Chen, Y., Xu, G., Lau, C. B.-S., et al. (2013). Dhrs3 protein attenuates retinoic acid signaling and is required for early embryonic patterning. J. Biol. Chem. 288, 31477–31487. doi:10.1074/jbc.M113.514984
Karisa, B. K., Thomson, J., Wang, Z., Bruce, H. L., Plastow, G. S., and Moore, S. S. (2013). Candidate genes and biological pathways associated with carcass quality traits in beef cattle. Can. J. Anim. Sci. 93, 295–306. doi:10.4141/cjas2012-136
Lee, Y.-S., Shin, D., Lee, W., Taye, M., Cho, K., Park, K.-D., et al. (2016). The prediction of the expected current selection coefficient of single nucleotide polymorphism associated with Holstein milk yield, fat and protein contents. Asian-Australas. J. Anim. Sci. 29, 36–42. doi:10.5713/ajas.15.0476
Li, H., and Durbin, R. (2010). Fast and accurate long-read alignment with Burrows-Wheeler transform. Bioinformatics 26, 589–595. doi:10.1093/bioinformatics/btp698
Li, H., Handsaker, B., Wysoker, A., Fennell, T., Ruan, J., Homer, N., et al. (2009). The sequence alignment/map format and SAMtools. Bioinformatics 25, 2078–2079. doi:10.1093/bioinformatics/btp352
Loftus, R. T., MacHugh, D. E., Bradley, D. G., Sharp, P. M., and Cunningham, P. (1994). Evidence for two independent domestications of cattle. Proc. Natl. Acad. Sci. U. S. A. 91, 2757–2761. doi:10.1073/pnas.91.7.2757
McKenna, A., Hanna, M., Banks, E., Sivachenko, A., Cibulskis, K., Kernytsky, A., et al. (2010). The genome analysis toolkit: A MapReduce framework for analyzing next-generation DNA sequencing data. Genome Res. 20, 1297–1303. doi:10.1101/gr.107524.110
Melo, T. P., Fortes, M. R. S., Fernandes Junior, G. A., Albuquerque, L. G., and Carvalheiro, R. (2019). Rapid communication: Multi-breed validation study unraveled genomic regions associated with puberty traits segregating across tropically adapted breeds. J. Anim. Sci. 97, 3027–3033. doi:10.1093/jas/skz121
Mészáros, G., Eaglen, S., Waldmann, P., and Solkner, J. (2014). A genome wide association study for longevity in cattle. Open J. Genet. 04, 46–55. doi:10.4236/ojgen.2014.41007
Moreira, G. C. M., Godoy, T. F., Boschiero, C., Gheyas, A., Gasparin, G., Andrade, S. C. S., et al. (2015). Variant discovery in a QTL region on chromosome 3 associated with fatness in chickens. Anim. Genet. 46, 141–147. doi:10.1111/age.12263
Naji, M. M., Utsunomiya, Y. T., Sölkner, J., Rosen, B. D., and Mészáros, G. (2021b). Assessing Bos taurus introgression in the UOA Bos indicus assembly. Genet. Sel. Evol. 53, 96. doi:10.1186/s12711-021-00688-1
Naji, M., Utsunomiya, Y., Sölkner, J., Rosen, B., and Mészáros, G. (2021a). Investigation of ancestral alleles in the Bovinae subfamily. BMC Genomics 22, 108. doi:10.1186/s12864-021-07412-9
National Bureau of Statistics (2018). China statistical yearbook 2018. Xicheng District, Beijing: National Bureau of Statistics of China.
Posbergh, C. J., and Huson, H. J. (2021). All sheeps and sizes: A genetic investigation of mature body size across sheep breeds reveals a polygenic nature. Anim. Genet. 52, 99–107. doi:10.1111/age.13016
Purfield, D. C., Bradley, D. G., Evans, R. D., Kearney, F. J., and Berry, D. P. (2015). Genome-wide association study for calving performance using high-density genotypes in dairy and beef cattle. Genet. Sel. Evol. 47, 47. doi:10.1186/s12711-015-0126-4
Qanbari, S., Pausch, H., Jansen, S., Somel, M., Strom, T. M., Fries, R., et al. (2014). Classic selective sweeps revealed by massive sequencing in cattle. PLoS Genet. 10, e1004148. doi:10.1371/journal.pgen.1004148
Randhawa, I. A. S., Khatkar, M. S., Thomson, P. C., and Raadsma, H. W. (2016). A meta-assembly of selection signatures in cattle. PLoS One 11, e0153013. doi:10.1371/journal.pone.0153013
Randhawa, I. A. S., Khatkar, M. S., Thomson, P. C., and Raadsma, H. W. (2014). Composite selection signals can localize the trait specific genomic regions in multi-breed populations of cattle and sheep. BMC Genet. 15, 34. doi:10.1186/1471-2156-15-34
Rezende, F. M., Dietsch, G. O., and Peñagaricano, F. (2018). Genetic dissection of bull fertility in US Jersey dairy cattle. Anim. Genet. 49, 393–402. doi:10.1111/age.12710
Rosen, B. D., Bickhart, D. M., Schnabel, R. D., Koren, S., Elsik, C. G., Tseng, E., et al. (2020). De novo assembly of the cattle reference genome with single-molecule sequencing. GigaScience 9, giaa021. doi:10.1093/gigascience/giaa021
Sabeti, P. C., Reich, D. E., Higgins, J. M., Levine, H. Z. P., Richter, D. J., Schaffner, S. F., et al. (2002). Detecting recent positive selection in the human genome from haplotype structure. Nature 419, 832–837. doi:10.1038/nature01140
Sasaki, S., Ibi, T., Akiyama, T., Fukushima, M., and Sugimoto, Y. (2016). Loss of maternal ANNEXIN A10 via a 34-kb deleted-type copy number variation is associated with embryonic mortality in Japanese Black cattle. BMC Genomics 17, 968. doi:10.1186/s12864-016-3312-z
Shen, J. F., Chen, Q. M., Zhang, F. W., Hanif, Q., Huang, B. Z., Chen, N. B., et al. (2022). Genome-wide association study identifies quantitative trait loci affecting cattle temperament. Zool Res. 43 (1), 14–25. doi:10.24272/j.issn.2095-8137.2021.176
Sorbolini, S., Gaspa, G., Steri, R., Dimauro, C., Cellesi, M., Stella, A., et al. (2016). Use of canonical discriminant analysis to study signatures of selection in cattle. Genet. Sel. Evol. 48, 58. doi:10.1186/s12711-016-0236-7
Stella, A., Ajmone-Marsan, P., Lazzari, B., and Boettcher, P. (2010). Identification of selection signatures in cattle breeds selected for dairy production. Genetics 185, 1451–1461. doi:10.1534/genetics.110.116111
Szpiech, Z. A., and Hernandez, R. D. (2014). selscan: an efficient multithreaded program to perform EHH-based scans for positive selection. Mol. Biol. Evol. 31, 2824–2827. doi:10.1093/molbev/msu211
Taye, M., Lee, W., Caetano-Anolles, K., Dessie, T., Hanotte, O., Mwai, O. A., et al. (2017a). Whole genome detection of signature of positive selection in African cattle reveals selection for thermotolerance. Animal Sci. J. 88, 1889–1901. doi:10.1111/asj.12851
Taye, M., Lee, W., Jeon, S., Yoon, J., Dessie, T., Hanotte, O., et al. (2017b). Exploring evidence of positive selection signatures in cattle breeds selected for different traits. Mamm. Genome 28, 528–541. doi:10.1007/s00335-017-9715-6
Torniainen, S., Freddara, R., Routi, T., Gijsbers, C., Catassi, C., Höglund, P., et al. (2009). Four novel mutations in the lactase gene (LCT) underlying congenital lactase deficiency (CLD). BMC Gastroenterol. 9, 8. doi:10.1186/1471-230X-9-8
Turner, S. (2018). qqman: an R package for visualizing GWAS results using Q-Q and manhattan plots. J. Open Source Softw. 3 (25), 731. doi:10.21105/joss.00731
Utsunomiya, Y. T., Pérez O’Brien, A. M., Sonstegard, T. S., Van Tassell, C. P., do Carmo, A. S., Mészáros, G., et al. (2013). Detecting loci under recent positive selection in dairy and beef cattle by combining different genome-wide scan methods. PLOS ONE 8, e64280. doi:10.1371/journal.pone.0064280
Vatsiou, A. I., Bazin, E., and Gaggiotti, O. E. (2016). Detection of selective sweeps in structured populations: A comparison of recent methods. Mol. Ecol. 25, 89–103. doi:10.1111/mec.13360
Vinet, A., Drouilhet, L., Bodin, L., Mulsant, P., Fabre, S., and Phocas, F. (2012). Genetic control of multiple births in low ovulating mammalian species. Mamm. Genome 23, 727–740. doi:10.1007/s00335-012-9412-4
Voight, B. F., Kudaravalli, S., Wen, X., and Pritchard, J. K. (2006). A map of recent positive selection in the human genome. PLoS Biol. 4, e72. doi:10.1371/journal.pbio.0040072
Wærp, H. K. L., Waters, S. M., McCabe, M. S., Cormican, P., and Salte, R. (2019). Long-term effects of prior diets, dietary transition and pregnancy on adipose gene expression in dairy heifers. PLOS ONE 14, e0218723. doi:10.1371/journal.pone.0218723
Weir, B. S., and Cockerham, C. C. (1984). Estimating F-statistics for the analysis of population structure. Evolution 38 (6), 1358–1370. doi:10.1111/j.1558-5646.1984.tb05657.x
Willing, E.-M., Dreyer, C., and van Oosterhout, C. (2012). Estimates of genetic differentiation measured by FST do not necessarily require large sample sizes when using many SNP markers. PLOS ONE 7, e42649. doi:10.1371/journal.pone.0042649
Wu, D.-D., Ding, X.-D., Wang, S., Wójcik, J. M., Zhang, Y., Tokarska, M., et al. (2018). Pervasive introgression facilitated domestication and adaptation in the Bos species complex. Nat. Ecol. Evol. 2, 1139–1145. doi:10.1038/s41559-018-0562-y
Xu, L., Bickhart, D. M., Cole, J. B., Schroeder, S. G., Song, J., Tassell, C. P. V., et al. (2015). Genomic signatures reveal new evidences for selection of important traits in domestic cattle. Mol. Biol. Evol. 32, 711–725. doi:10.1093/molbev/msu333
Xu, L., Yang, L., Wang, L., Zhu, B., Chen, Y., Gao, H., et al. (2019). Probe-based association analysis identifies several deletions associated with average daily gain in beef cattle. BMC Genomics 20, 31. doi:10.1186/s12864-018-5403-5
Yougbaré, B., Soudré, A., Ouédraogo, D., Zoma, B. L., Tapsoba, A. S. R., Sanou, M., et al. (2021). Genome-wide association study of trypanosome prevalence and morphometric traits in purebred and crossbred Baoulé cattle of Burkina Faso. PLOS ONE 16, e0255089. doi:10.1371/journal.pone.0255089
Yu, Q., Tian, X., Sun, C., Shao, L., Li, X., and Dai, R. (2019). Comparative transcriptomics to reveal muscle-specific molecular differences in the early postmortem of Chinese Jinjiang yellow cattle. Food Chem. 301, 125262. doi:10.1016/j.foodchem.2019.125262
Yurchenko, A. A., Daetwyler, H. D., Yudin, N., Schnabel, R. D., Vander Jagt, C. J., Soloshenko, V., et al. (2018). Scans for signatures of selection in Russian cattle breed genomes reveal new candidate genes for environmental adaptation and acclimation. Sci. Rep. 8, 12984. doi:10.1038/s41598-018-31304-w
Keywords: cattle, whole-genome sequence (WGS), selection signature, Bos taurus, bos indicus, iSAFE, IHS, fst
Citation: Naji MM, Jiang Y, Utsunomiya YT, Rosen BD, Sölkner J, Wang C, Jiang L, Zhang Q, Zhang Y, Ding X and Mészáros G (2022) Favored single nucleotide variants identified using whole genome Re-sequencing of Austrian and Chinese cattle breeds. Front. Genet. 13:974787. doi: 10.3389/fgene.2022.974787
Received: 21 June 2022; Accepted: 29 August 2022;
Published: 27 September 2022.
Edited by:
Anupama Mukherjee, Indian Council of Agricultural Research (ICAR), IndiaCopyright © 2022 Naji, Jiang, Utsunomiya, Rosen, Sölkner, Wang, Jiang, Zhang, Zhang, Ding and Mészáros. This is an open-access article distributed under the terms of the Creative Commons Attribution License (CC BY). The use, distribution or reproduction in other forums is permitted, provided the original author(s) and the copyright owner(s) are credited and that the original publication in this journal is cited, in accordance with accepted academic practice. No use, distribution or reproduction is permitted which does not comply with these terms.
*Correspondence: Xiangdong Ding, xiangdongding@hotmail.com; Gábor Mészáros, gabor.meszaros@boku.ac.at