 Can Lu
 Xiaopeng Zhang
 Yang Luo5†
 Jingang Huang
 Minhao Yu
- 1Faculty of Medicine, Ludwig-Maximilians University, Munich, Germany
- 2Department of Colorectal Surgery, The Second Affiliated Hospital of Zhejiang University School of Medicine, Hangzhou, China
- 3School of Medicine, Technical University of Munich, Munich, Germany
- 4Gastrointestinal Cancer Center, Key Laboratory of Carcinogenesis and Translational Research (Ministry of Education), Peking University Cancer Hospital and Institute, Beijing, China
- 5Department of Gastrointestinal Surgery, Renji Hospital, School of Medicine, Shanghai Jiaotong University, Shanghai, China
- 6Guangdong Provincial Key Laboratory of Malignant Tumor Epigenetics and Gene Regulation, Guangdong-Hong Kong Joint Laboratory for RNA Medicine, Sun Yat-Sen Memorial Hospital, Sun Yat-Sen University, Guangzhou, China
- 7Medical Research Center, Sun Yat-Sen Memorial Hospital, Sun Yat-Sen University, Guangzhou, China
Background: Ulcerative colitis (UC) is a well-known risk factor for developing colitis-associated colorectal cancer (CAC). However, the molecular mechanism of the pathogenesis of CAC remains unclear. This study aimed to explore candidate genes involved in the tumorigenesis of CAC.
Methods: GSE75214 and the Cancer Genome Atlas Program (TCGA) dataset were used to analyze the differentially expressed genes (DEGs) in UC and colorectal cancer (CRC), respectively. Survival-hub genes were identified from these DEGs by sequentially constructing a protein–protein interaction network, selecting hub genes, and conducting survival analysis. Regulatory signatures were also predicted on these genes through the online database. Apcmin/+ and UC mice models were used to validate the expression of the above-predicted molecules. Gene set enrichment analysis and CIBERSORT were performed to explore the enriched molecular pathways and associated tissue-infiltrating immune cells of genes.
Results: Here, 376 common DEGs were identified from the GSE75214 and TCGA datasets. Through survival-hub gene selection and in vivo experiments, we confirmed that CXCL10 and CXCL11 were significantly upregulated in UC and CRC. We also proved that miR-34a-5p and miR-203a-5p were potential regulators of CXCL10 and CXCL11. Meanwhile, CXCL10 and CXCL11 may activate the JAK–STAT signaling pathway via the interaction with cytokine receptors in UC. Furthermore, CXCL10 and CXCL11 were positively associated with the tissue infiltration of proinflammatory M1 macrophages in UC and CRC.
Conclusion: CXCL10 and CXCL11 may act as the candidate genes involved in the tumorigenesis of CAC and potential therapeutic targets to prevent the development of CAC from UC.
Introduction
Ulcerative colitis (UC) is a chronic inflammatory bowel disorder characterized by relapsing and remitting mucosal inflammation that starts in the rectum and generally extends proximally through the colon in a continuous manner (Ungaro et al., 2017). Although UC incidence has stabilized in western countries since 1990, the worldwide incidence and prevalence of this disease are greatly increasing as emerging industrialized societies have adopted a more westernized lifestyle (Ng et al., 2017). The highest prevalence rates of UC have been reported in Europe (505 per 100,000 in Norway) and North America (286 per 100,000 in the United States) (Ng et al., 2017). So far, the precise pathogenesis of UC remains unclear, but genetic susceptibility, dysregulated immune system, microbial dysbiosis, and environmental exposure are all potential pathogenic factors (Du and Ha, 2020). The peak age of UC onset is between the third and fourth decades of life without sex predominance (Cosnes et al., 2011), which tremendously affects patients’ productivity and imposes an immersive financial burden on health systems.
UC is a critical risk factor for colorectal cancer (CRC) development. Although the overall risk of CRC in patients with UC is not different from that of the general population, at least in the first decade after diagnosis, those with long-duration extensive colitis or those diagnosed with UC at a young age remain at a significantly increased risk of CRC development (Jess et al., 2012b). A meta-analysis also revealed that the cumulative risk of CRC could reach 13.9% in patients with a 30-year duration of UC onset (Bopanna et al., 2017). Although colitis-associated CRC (CAC) originating from UC patients only takes up approximately 1% of all CRC cases, one-sixth of all deaths in UC patients were caused by CAC (Gyde et al., 1982). Therefore, it is imperative to deepen our understanding of the cumulative detrimental effects of UC and to develop new agents to impede the occurrence of CAC. However, the molecular mechanism of CAC development remains unknown.
In UC, chronic inflammation is knowingly associated with the pathogenesis of CAC via the production of inflammatory mediators, oxidative stress, and alterations in immune receptor expression on epithelial cells (Kusunoki, 2015). To highlight the impact of the inflammation on intestine tissues, we only enrolled datasets containing UC patients with an active inflammation status. Meanwhile, the Cancer Genome Atlas Program (TCGA) projects provide the largest repository of expression matrices for CRC patients and paracancerous controls at the single-dataset level. We performed a series of bioinformatics analyses in the present study to identify survival-hub genes, including differential expression analysis, protein–protein interaction network, selection of hub genes, and survival analysis. Furthermore, we predicted the regulatory signatures on these genes using the online database. Moreover, we used in vivo experiments to validate the expression difference of survival-hub genes and regulatory signatures in both UC and CRC mice models. Our study demonstrated that CXCL10 and CXCL11 were candidate genes involved in the pathogenesis of CAC, indicating that targeting CXCL10/11 is a promising therapeutic strategy. To our knowledge, this is the first study to explore the underlying carcinogenic mechanism of CAC development using bioinformatics and animal models.
Materials and methods
Data collection and processing
The Gene Expression Omnibus database was thoroughly searched to find eligible UC datasets with the following inclusion criteria: 1) UC patients with an active inflammation status, 2) a UC group with more than 20 patients, and 3) gene expression profiles based on tissue samples. GSE75214 (Vancamelbeke et al., 2017) containing 74 UC patients with an active inflammation status and 11 healthy controls were enrolled for UC analysis. GEOquery (RRID: SCR 000146) R package was used to download the expression matrices of this dataset. The probes were annotated into gene symbols based on the GPL6244 annotation files. When multiple probes matched one gene, the median was calculated as its expression values. Gene expression profiles of 568 CRC patients and 51 healthy controls were downloaded from TCGA through the GDC data portal. Clinical follow-up data of these patients were acquired from the University of Santa Cruz Xena platform.
Differential expression analysis
Differential expression analysis in the GSE75214 and TCGA cohorts was conducted using the limma (RRID: SCR_010943) and DESeq2 (RRID: SCR_015687) R packages, respectively. Any gene with adjusted p values of <0.01 and |log2(Foldchange)| of >1 was regarded as differentially expressed genes (DEGs). DEGs consistently changed in the above two datasets were identified as common DEGs.
Functional enrichment analysis
To determine the potential function of the identified common DEGs, we used the clusterProfiler (RRID: SCR_016884) R package to carry out gene ontology (GO) and Kyoto Encyclopedia of Genes and Genomes (KEGG) pathway analyses. GO analysis was divided into three categories: biological process (BP), molecular function (MF), and cellular components (CC). The cutoff criteria of p values <0.05 and false discovery rate <0.05 were regarded as statistically significant differences for all analyses.
Protein–protein interaction networks
The online database Search Tool for the Retrieval of Interacting Genes (STRING, version 11.0, RRID: SCR_005223) (Szklarczyk et al., 2019) was used to evaluate the interactive relationships among common DEGs. Just the interaction pairs with a combined score of >0.7 were selected. Then, Cytoscape software (version 3.8.2, RRID: SCR_003032) was used to construct and visualize a protein–protein interaction (PPI) network of DEGs (Shannon et al., 2003). The cytoHubba (RRID: SCR_017677) plugin was applied to define the top 10 hub genes of the network using the maximal clique centrality method of topological analysis.
Survival analysis
We applied the Kaplan–Meier plot to analyze the overall survival (OS) and progression-free interval (PFI) probability of different groups using two R packages, namely, survival (RRID: SCR_021137) and survminer (RRID: SCR_021094). OS represented the interval from the diagnosis date until the date of death from any cause, and PFI referred to the interval from the diagnosis date until the date of the first occurrence of a new tumor event, including the progression of the disease, locoregional recurrence, distant metastasis, new primary tumor, or death with tumor (Liu et al., 2018).
Identification of regulatory signatures interacted with genes
Transcription factor–gene and miRNA–gene interactions were analyzed to identify transcription factors (TFs) and miRNAs that regulate the expression of genes at the transcription and posttranscription levels, respectively. JASPAR (RRID: SCR_003030) is an open-access database of curated, nonredundant TF binding profiles stored as position frequency matrices and TF flexible models for TFs across multiple species in taxonomic groups (Stormo, 2013). Moreover, TarBase (version 8.0, RRID: SCR_000577) is one of the largest databases of miRNA–target interactions with experimental support (Karagkouni et al., 2018). NetworkAnalyst (version 3.0, RRID: SCR_016909) was applied to predict potential TFs and miRNAs of genes from the JASPAR and TarBase databases, respectively. Then, Cytoscape software was used to visualize the TF–gene and miRNA–gene interaction networks.
Mice
Apcmin/+ mice were purchased from Jackson Laboratory, and C57BL/6 (MGI Cat# 2159769, RRID: MGI:2159769) mice were obtained from SLAC Laboratory Animal Co., Ltd. (Shanghai, China). The mice were maintained in a pathogen-free animal facility, and all experiments were performed in mice aged 9–14 weeks. All animal experiments were performed according to the National Institute of Health Guidelines for the Care and Use of Laboratory Animals. Our study was approved by the Animal Care and Use Committee of Renji Hospital, School of Medicine, Shanghai Jiao Tong University. At the end of the experiment, under inhalation anesthesia with isoflurane, mice were sacrificed by strangulating their neck, and then, their intestine was harvested for further analysis.
Acute dextran sulfate sodium-induced colitis mouse model
Acute colitis was induced in C57BL/6J mice with the administration of 3% dextran sulfate sodium (DSS) with a molecular mass of 40 kDa (Sigma Aldrich, Darmstadt, Germany) in autoclaved drinking water. After acclimation, 8-week-old mice were randomly divided into two groups (n = 6 per group): 0 DSS (negative control) and 3% DSS-treated group. Mice were treated with 3% DSS for 6 days and plain water for 3 days right after the treatment. The severity of colitis was assessed daily by measuring weight loss and disease activity index (DAI). DAI was calculated based on the degree of diarrhea and visible fecal blood as Cooper et al. described (Cooper et al., 1993). Mice were euthanized on day 10. The intestine was removed and meshed for further analysis.
Western blot assay
The freshly removed intestines were meshed and lysed with RIPA lysis buffer (Thermo Fisher Scientific, Waltham, MA, United States) on ice. The protein concentrations were measured with Bradford assay (Bio-Rad, Hercules, CA, United States), and 20 µg of protein per sample was subjected to 10% SDS-acrylamide gels for electrophoresis. The proteins were separated by electrophoresis at 80–120 V in an electrophoresis unit (Invitrogen, Waltham, MA, United States) with NuPAGE™ MOPS SDS as a running buffer. The separated proteins were transferred onto Immobilon PVDF membranes (Invitrogen, Waltham, MA, United States) with NuPAGE™ Transfer buffer using the Invitrogen blotting system and a BIO-RAD power supply constantly held at 125 mA and a maximum voltage of 10 V. After blocking in 5% skimmed milk/TBS–Tween 20, the membrane was incubated with a primary antibody and then with horseradish-peroxidase (HRP)-conjugated secondary antibodies. Enhanced chemiluminescence (Thermo Fisher Scientific, Waltham, MA, United States) signals were recorded using a 440-CF imaging system (Kodak, Rochester, NY, United States). Primary antibodies included mouse antiactin antibody (Santa Cruz Biotechnology Cat# sc-8432, RRID: AB_626630) and rabbit anti-YY1 antibody (Abcam, Cambridge, Cat# ab245365).
RNA extraction and qRT-PCR
Total RNA was extracted from cells using the NucleoZOL reagent (MACHEREY-NAGEL, Düren, Germany) according to the manufacturer’s instructions. Here, 2 µg of total RNA was reverse-transcribed using SuperScript III First-Strand Synthesis SuperMix for qPCR (Thermo Fisher Scientific, Waltham, MA, United States). For the detection of miRNAs, a TaqMan MicroRNA Reverse Transcription Kit (Thermo Fisher Scientific, Waltham, MA, United States) was applied for the synthesis of cDNAs. Each cDNA sample was similarly diluted for subsequent PCR amplification with the 2× qPCR Master Mix (Sigma Aldrich, Darmstadt, Germany) with a StepOnePlus Real-Time PCR System (Thermo Fisher Scientific, Waltham, MA, United States). The expression of miRNAs was detected with a TaqMan MicroRNA Assay (Thermo Fisher Scientific, Waltham, MA, United States). The qPCR results were calculated using the 2−ΔΔCt method. Results were represented as fold induction of the disease condition compared with the control condition. All primers used in this study are presented in Supplementary Table S1.
Cytokine array
Intestines from all mice models were collected and cut into pieces. After overnight incubation in Hank’s Balanced Salt Solution (Thermo Fisher Scientific, Waltham, MA, United States), tissues were removed through a 350 g centrifuge, and the supernatant was subjected to the proteome profiler mouse XL cytokine array (R&D system, Minneapolis, MN, United States). Signals were visualized using an myECL imager or the iBright imaging system (Thermo Fisher Scientific, Waltham, MA, United States).
Gene set enrichment analysis
We applied gene set enrichment analysis (GSEA) (Subramanian et al., 2005) to predict the KEGG pathways related to CXCL10 and CXCL11 using the clusterProfiler R package with the following parameters: minGSSize = 10, maxGS-Size = 500, nPerm = 100, seed = 2020, and p-value corrected by Benjamini–Hochberg (BH). Significant enrichment terms were considered if the adjusted p-value was less than 0.05. The KEGG gene sets were downloaded from the MSigDB database (https://www.gsea-msigdb.org).
Evaluation of immune cell infiltration
The CIBERSORT algorithm (Chen et al., 2018) was used to estimate the proportions of 22 immune cells in UC and CRC samples. Spearman’s correlation was calculated between the proportions and gene expression. p < 0.05 was considered a significant correlation.
Statistical analysis
The log-rank test was used to evaluate the survival difference between different groups in the Kaplan–Meier plot. The statistical difference between the two groups was calculated using the Wilcoxon rank-sum test or t-test, and a p-value of <0.05 was regarded as the significant threshold. Statistical analyses were conducted using R software (version 4.0.5).
Results
Identification of overlapping differentially expressed genes across ulcerative colitis and colorectal cancer
The study flowchart is illustrated in Figure 1. In the GSE75214 dataset, we identified 926 DEGs in UC samples compared to healthy controls, including 597 upregulated genes and 329 downregulated genes. Meanwhile, 5120 DEGs were obtained from the differential expression analysis between CRC samples and noncancerous tissues in the TCGA cohort. The top 100 DEGs in the UC and CRC groups are displayed in Figures 2A,B. To dissect the underlying mechanisms involved in the malignant transformation of UC, we used the Venn diagram to intersect the consistent DEGs between the GSE75214 and TCGA cohorts. In total, there were 376 common DEGs consisting of 156 upregulated DEGs and 220 downregulated DEGs (Figures 2C,D).
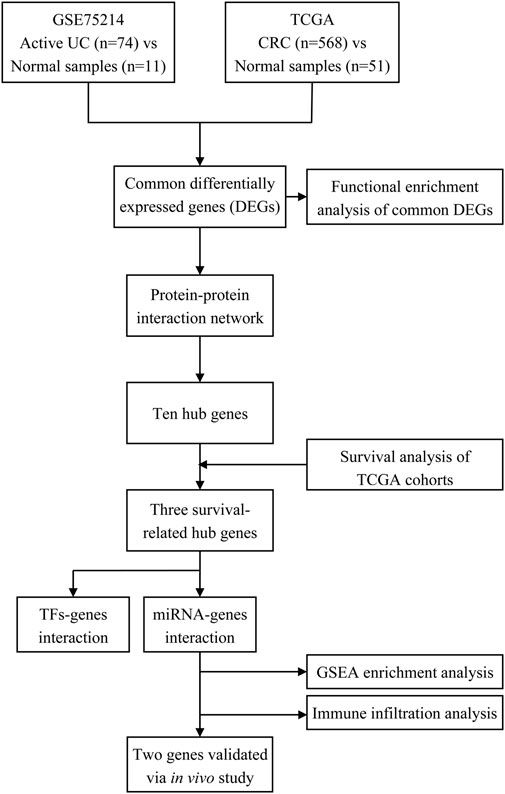
FIGURE 1. Workflow of processing the datasets. Abbreviation: UC, ulcerative colitis; TCGA, The Cancer Genome Atlas; CRC, colorectal cancer; TFs, transcription factors; miRNA, microRNA.
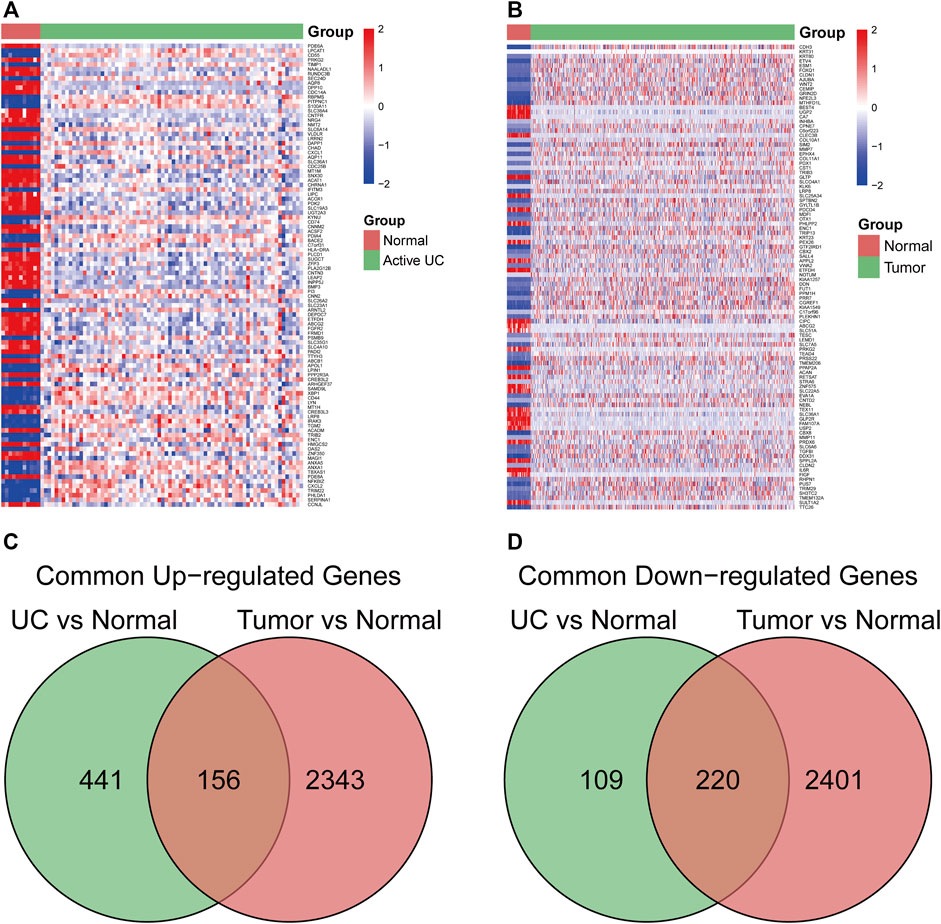
FIGURE 2. The common differentially expressed genes (DEGs) between ulcerative colitis (UC) and colorectal cancer (CRC). (A) heatmap of the top 100 DEGs in the UC dataset. (B) heatmap of top 100 DEGs in the CRC dataset. (C) common upregulated DEGs in UC and CRC. (D) common downregulated DEGs in UC and CRC. Abbreviation: DEGs, Differentially expressed genes; UC, ulcerative colitis; CRC, colorectal cancer.
Functional enrichment analysis and protein–protein interaction network of common differentially expressed genes
We performed GO and KEGG enrichment analyses to explore the biological functions of the shared DEGs between UC and CRC. These DEGs were mainly involved in transporting organic substances and leukocyte chemotaxis in three subtypes of GO terms (Figure 3A). Likewise, protein digestion and absorption and cytokine–cytokine receptor interaction were the principally enriched KEGG pathways of common DEGs (Figure 3B). Detailed results of the functional enrichment analysis are shown in Supplementary Table S2.
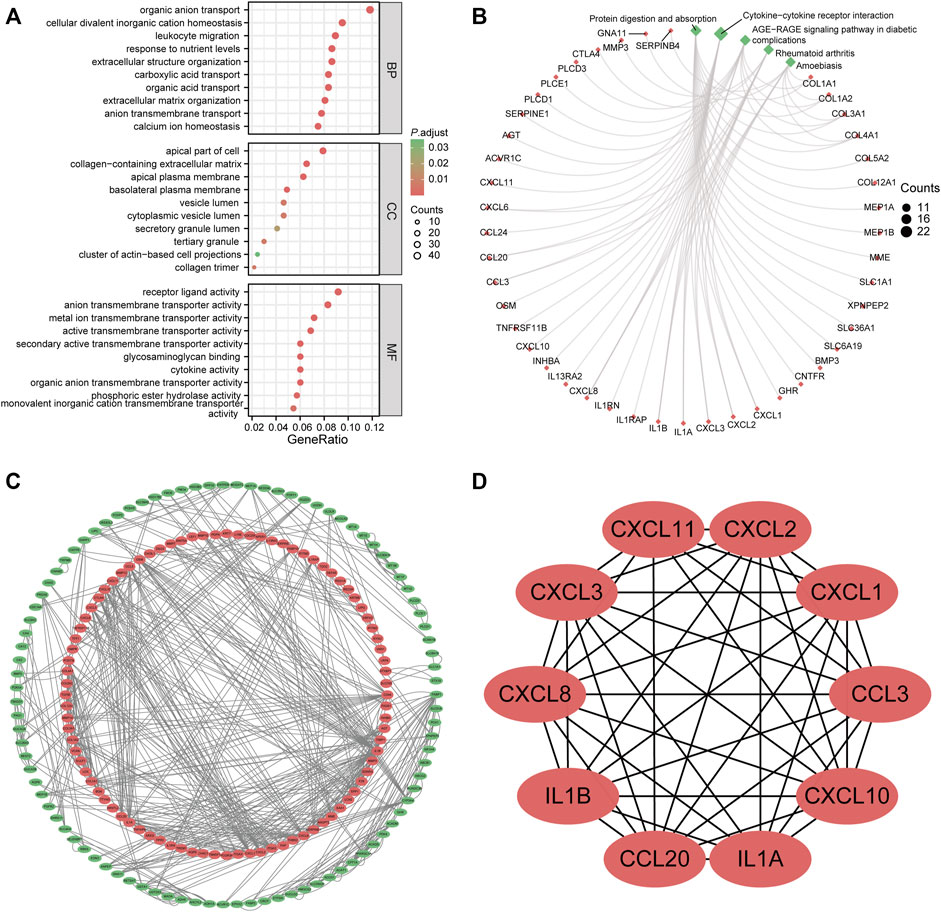
FIGURE 3. Functional enrichment analysis and protein–protein interaction (PPI) network of common differentially expressed genes (DEGs). (A) gene ontology enrichment analysis of common DEGs. (B) Kyoto Encyclopedia of Genes and Genomes enrichment analysis of common DEGs. (C) PPI network of common DEGs. The red node represented upregulated genes; the green node stands for downregulated genes. (D) hub genes identified from the PPI network. Abbreviation: DEGs, differentially expressed genes; BP, biological process; CC, cellular components; MF, molecular function; PPI, protein–protein interaction.
To identify the potential interactions of 376 DEGs, we constructed the PPI network based on the STRING database with the threshold of minimum required interaction score of >0.7. A total of 183 nodes and 590 edges were incorporated into this network, as shown in Figure 3C. Each node represented one gene, and the edges indicated the predicted interaction relationships. Furthermore, we used the cytoHubba plugin of Cytoscape software to identify hub genes from the whole PPI network. The top 10 genes are shown in Figure 3D, namely, CXCL1, CXCL2, CXCL3, CXCL8, CXCL10, CXCL11, CCL3, CCL20, IL1B, and IL1A.
Survival analysis of hub genes in the Cancer Genome Atlas Program cohorts
To refine the clinical significance of hub genes, we used TCGA cohorts to analyze their expression difference stratified by tumor stage. As shown in Figure 4A, except for CXCL8 and CCL20, all hub genes have significantly lower expression in advanced tumor stages. Then, we further explored the prognostic effects of these hub genes in CRC patients. Just CXCL11 was associated with the OS in the TCGA cohort (Figure 4B). Meanwhile, three genes have a significant association with PFI (Figures 4C–E). In total, we only have three survival-related hub genes in this study, namely, CXCL10, CXCL11, and IL1A. Furthermore, survival analysis of other hub genes is shown in Supplementary Figure S1. The characteristics of the CRC patients are displayed in Supplementary Table S3.
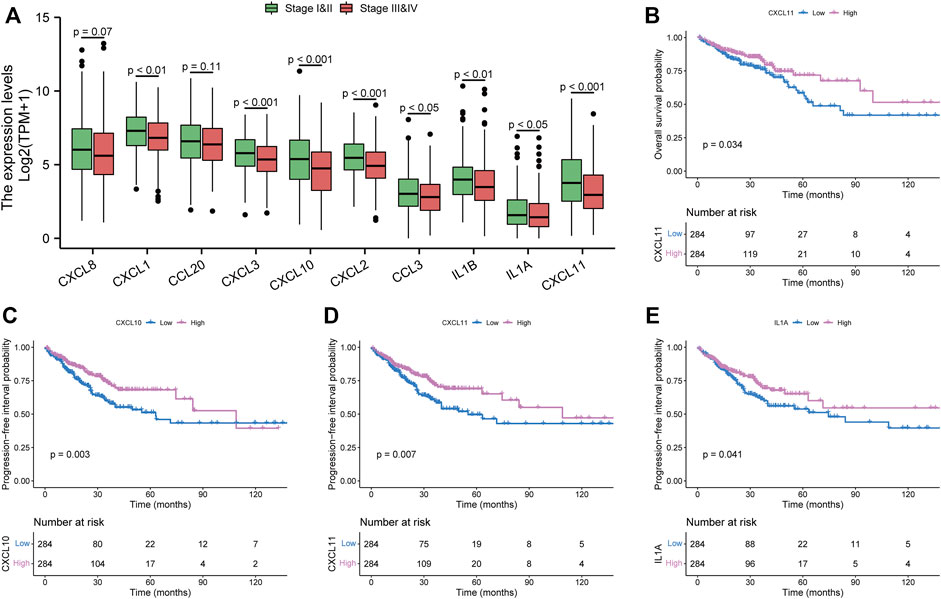
FIGURE 4. Clinical significance of hub genes in the Cancer Genome Atlas Program cohorts. (A) expression analysis of hub genes in different tumor stages. (B) overall survival analysis of CXCL11. (C–E) progression-free interval analysis of CXCL10, CXCL11, and IL1A, respectively.
Regulatory signatures of survival-associated hub genes
Furthermore, we used the online database to predict TFs and miRNAs that might interact with survival-associated hub genes at the transcription and posttranscription levels. The medium degree cutoff was applied to reduce redundant nodes of the interaction networks. As shown in Figure 5A, the miRNAs-hub genes interaction network contained 17 miRNAs and 38 edges. Meanwhile, there were five TFs and 10 edges in the TF-hub gene network (Figure 5B).
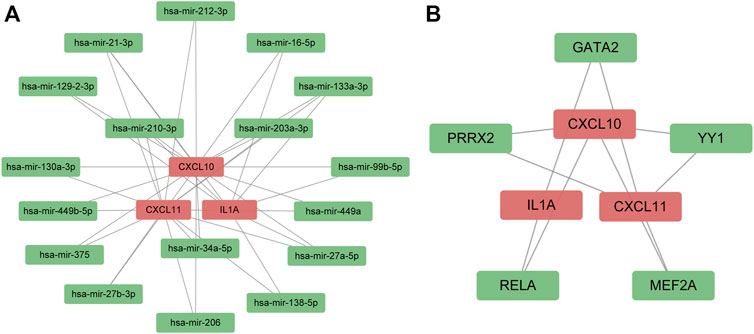
FIGURE 5. Regulatory signatures of survival-associated hub genes. (A) miRNA–gene interaction network; (B) transcription factors–gene interaction network. The red node represented survival-related hub genes. The green node indicated miRNAs and transcription factors.
Validation of the expression of survival-hub genes and related regulatory signatures using the in vivo experiments
To validate the upregulated expression of three survival-hub genes in UC and CRC samples, we performed cytokine array studies to detect the expression levels of these genes in UC and CRC mice models. We found that CXCL10 and CXCL11 were consistently upregulated in UC and CRC compared with the corresponding controls (Figures 6A,B), whereas there was no difference in IL1A expression (Figures 6C,D). Thus, CXCL10 and CXCL11 were regarded as the candidate genes involved in the pathogenesis of CAC. We selected three miRNAs possibly regulating CXCL10 and CXCL11 from the miRNA–gene network to examine the potential regulatory miRNAs further. Our results showed that miR-34a-5p and miR-203a-5p have significantly lower expression in UC and CRC than in controls (Figures 6E,F). However, miR-210-3p has a similar expression between the disease group and the controls (Figures 6G,H). Also, we detected the potential TFs of CXCL10 and CXCL11 in UC and CRC mice models. Several studies have reported that YY1 could promote the tumor progression of CRC (Fang et al., 2019; Tang et al., 2019; Yu et al., 2020). Our results indicated that YY1 was only upregulated in the CRC model (Figure 6I).
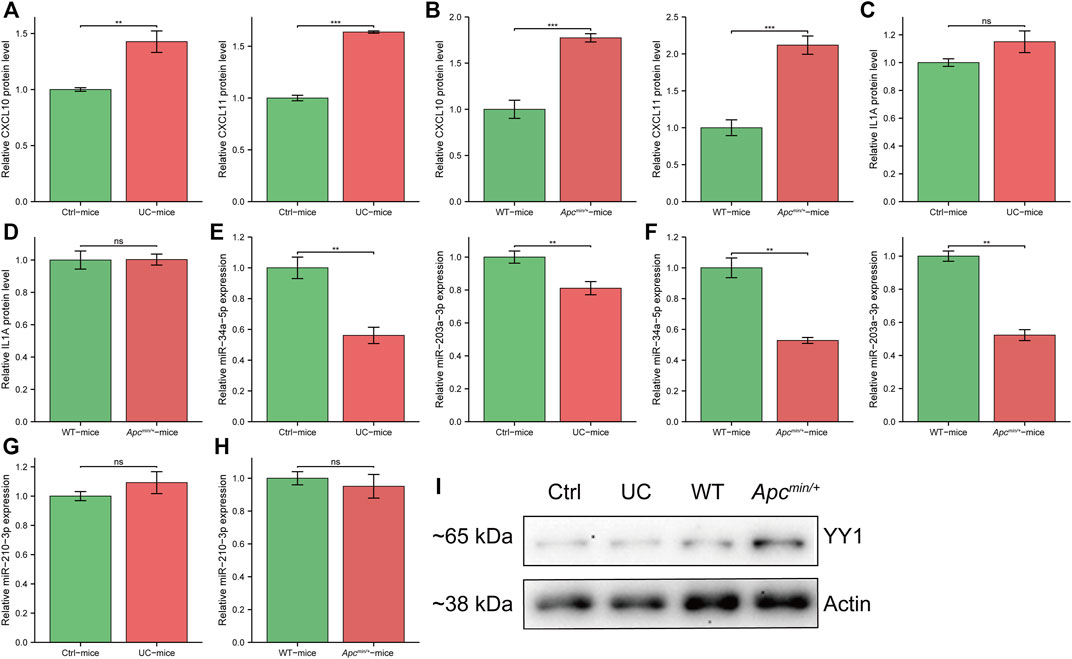
FIGURE 6. The expression of survival-hub genes and interacted regulatory signatures in vivo. (A) cytokine array to detect CXCL10 and CXCL11 in ulcerative colitis (UC) mice and controls (n = 3, per group), respectively. (B) cytokine array to detect CXCL10 and CXCL11 in APCmin/+ mice and wild type (WT) (n = 3, per group), respectively. (C) cytokine array to detect IL1A in UC mice and controls (n = 3, per group). (D) cytokine array to detect IL1A in APCmin/+ mice and WT (n = 3, per group). (E) qRT-PCR for miR-34a-5p and miR-203a-3p in UC mice and controls (n = 6, per group), respectively. (F) qRT-PCR for miR-34a-5p and miR-203a-3p in APCmin/+ mice and WT (n = 6, per group), respectively. (G) qRT-PCR for miR-210-3p in UC mice and controls (n = 6, per group). (H) qRT-PCR for miR-210-3p in APCmin/+ mice and WT (n = 6, per group). (I) Western blot for YY1 expression in different groups. Ctrl, control mice for UC model. WT, wild type mice. *, p < 0.05; **, p < 0.01, ***, p < 0.001. Abbreviation: Ctrl, control; UC, ulcerative colitis; WT, wild type.
These results indicated that miR-34a-5p and miR-203a-5p might inhibit the tumorigenesis of the UC mucosa by mediating the downregulation of CXCL10 and CXCL11. Moreover, YY1 may not affect the development of CAC.
Immune cell infiltration and gene set enrichment analysis of survival-hub genes
The CIBERSORT algorithm was used to estimate the proportion of 22 immune cells in CRC and UC patients. To explore the correlation between CXCL10/11 and immune infiltration, we further calculated the correlation coefficient of each gene with immune cells. p-value < 0.05 was applied to filter significantly correlated immune cells. Figures 7A,B illustrate that CXCL10 and CXCL11 significantly correlated with the infiltration of macrophage M1, neutrophils, CD4+ activated memory T cell, and macrophage M0 in CRC and UC cohorts. Moreover, CXCL11 was negatively associated with Tregs infiltration. Moreover, we performed a KEGG pathway analysis of GSEA on CXCL10 and CXCL11 to elucidate the molecular mechanism underlying these two genes. Figures 7C,D consistently show that CXCL10 and CXCL11 might promote the tumorigenesis of CAC through three possible pathways, namely, cytokine–cytokine receptor interaction, chemokine signaling pathway, and JAK–STAT signaling pathway.
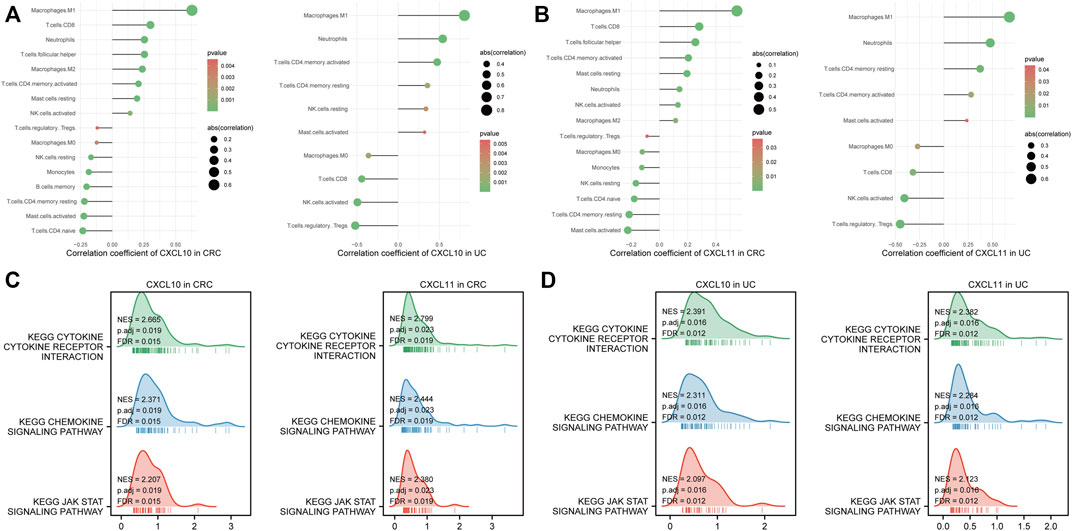
FIGURE 7. Immune infiltration and gene set enrichment analysis (GSEA) of survival-hub genes. (A) correlation analysis between CXCL10 and immune cell infiltration in the Cancer Genome Atlas Program (TCGA) and GSE75214 datasets, respectively. (B) correlation analysis between CXCL11 and immune cell infiltration in the TCGA and GSE75214 datasets, respectively. (C) GSEA of CXCL10 and CXCL11 in TCGA cohorts. (D) GSEA of CXCL10 and CXCL11 in the GSE75214 dataset. Abbreviation: CRC, colorectal cancer; UC, ulcerative colitis; KEGG, Kyoto Encyclopedia of Genes and Genomes; NK, natural killer.
Discussion
Despite advances in therapeutic drugs and cancer screening, UC patients still have a 2.4-fold higher risk of CRC compared with the general population (Jess et al., 2012a). To reduce the incidence of CAC, the shared molecular mechanism between UC and CRC may provide novel insight and targeted molecules to hinder the dysplasia–carcinoma progression for patients with UC. Our results indicated that CXCL10 and CXCL11 might contribute to the tumorigenesis of CAC.
Through bioinformatics analysis and in vivo experimentation, we confirmed that CXCL10 and CXCL11 were consistently upregulated in both UC and CRC. Moreover, high expression levels of CXCL10 and CXCL11 were associated with better PFI and early tumor stage in patients with CRC. CXCL10 and CXCL11 were predominantly synthesized and produced by monocytes, endothelial cells, fibroblasts, and cancer cells under the induction of IFN-γ and TNFα (Ohmori et al., 1993; Ohmori et al., 1997). These two cytokines belong to the CXC (C-X-C motif) chemokine family, a group of small secreted proteins attracting and activating immune and nonimmune cells (Réaux-Le Goazigo et al., 2013). CXCR3 is the commonly shared receptor for the activity of CXCL10 and CXCL11. The chronic inflammation underlying UC contributes to the accumulation of inflammatory mediators and immune cells in the intestine, which leads to the increased turnover of epithelial cells, inducing the formation of dysplasia (Rogler, 2014). CXCL10, also known as the interferon γ-induced protein-10 (IP-10), has a decisive role in the integrin activation and migration of immune cells (Kuhne et al., 2007). Uguccioni et al. proved that UC patients have significantly higher expression of CXCL10 compared with healthy control in colonic tissues (Uguccioni et al., 1999). Furthermore, the recruitment of the proinflammatory cells mediated by CXCL10 stimulation is responsible for inflammation and tissue damage (Kabashima et al., 2002). Several in vivo studies indicated that anti-CXCL10 antibodies could inhibit epithelial ulceration in a UC murine model (Sasaki et al., 2002), attenuate inflammation in IL10−/− mice (Singh et al., 2003), and reduce colitis by compromising T helper type 1 (Th1) induction and recruitment (Hyun et al., 2005). A phase II, randomized, multicenter clinical study has demonstrated the efficacy of monoclonal anti-CXCL10 antibody in moderate-to-severe UC patients who achieved high serum concentrations (Mayer et al., 2014). CXCL11, referred to as interferon-inducible T-cell alpha chemoattractant (I-TAC), could drive Th1 cells to secrete proinflammatory cytokine IL-6 in the inflammatory bowel disease (Liu et al., 2011). One recent study reported that UC patients have significantly higher serum levels of CXCL11 than healthy subjects (Singh et al., 2016). However, there are no reports on the expression levels of CXCL11 in colorectal tissues. Jennifer et al. reported that CXCL11 could also promote tumor progression by activating CXCR7 of tumor cells (Burns et al., 2006). In addition, accumulating evidence has suggested that the CXCL10 and CXCL11/CXCR3 axis could impose antitumor effects by recruiting Th1 cells, cytotoxic T cells, natural killer cells, and natural killer T cells to tumor sites (Hensbergen et al., 2005) and it has protumor effects on cancer cells expressing CXCR3 (Cambien et al., 2009). Taken together, we believe that CXCL10 and CXCL11 may probably involve the malignant transformation of the intestine in patients with UC. Until now, there have been no reported studies on these two genes in the carcinoma pathogenesis of CAC.
MicroRNAs are endogenous noncoding RNAs that could inhibit the expression of genes by specifically binding to the complementary sequences in the 3′-UTR segments of the target mRNAs. After constructing a miRNA–gene interaction network using an online database, we conducted an in vivo test to validate the expression difference of three miRNAs in two mouse models. Our results showed that miR-34a-5p and miR-203a-5p were significantly downregulated in both UC and CRC, negatively correlated with CXCL10 and CXCL11. Moreover, Hart et al. discovered that miR-34a-5p could directly inhibit the expression of CXCL10 and CXCL11 by binding to their 3′-UTRs in M1 macrophages (Hart et al., 2020). Thus, low expression of miR-34a-5p may exacerbate the intestine inflammation influenced by UC. Meanwhile, a previous study has suggested that miR-203a-5p acted as a tumor suppressor in CRC (Qian et al., 2019). As a whole, miR-34a-5p and miR-203a-5p have great potential to involve the regulation of CXCL10 and CXCL11 in the tumorigenesis of CAC.
To explore the downstream molecular mechanism mediated by CXCL10 and CXCL11, we used the GSEA method to predict the significantly enriched pathways in the GSE75214 and TCGA datasets, respectively. Our results suggested that CXCL10 and CXCL11 might activate the JAK–STAT signaling pathway via the interaction with cytokine receptors in UC. Most immune regulatory processes are mediated by JAK–STAT signaling, including tumor cell recognition and tumor immune evasion (Owen et al., 2019). Accumulating studies also suggested that the JAK–STAT signaling pathway is critical in promoting chronic inflammation in inflammatory bowel diseases (Egwuagu, 2009). Therefore, CXCL10 and CXCL11 may mediate the tumorigenesis of CAC by activating the JAK–STAT signaling pathway of stromal cells and epithelial cells in the colorectum mucosa.
Immune cells are indispensable components of inflammation in UC and CRC. To elucidate the relationship between CXCL10/11 and immune infiltration, we applied the CIBERSORT algorithm to estimate the proportions of 22 immune cells in the GSE75214 and TCGA datasets. Our results showed that CXCL10 and CXCL11 were positively associated with the infiltration of M1 macrophages in both UC and CRC. Although the M1 macrophage has an antitumorigenic function, in chronic inflammation, it could induce more severe inflammation by secreting proinflammatory cytokines and reactive oxygen species (Chen et al., 2021).
The primary limitation of this study is the lack of available datasets consisting of matched CAC, UC, and corresponding normal groups, which may comprise the validity of our predicted genes. However, Zhao et al. reported that CAC and non-UC-associated CRC patients have a high degree of similarity in gene expression (Zhao et al., 2013). On the other hand, our study conducted comprehensive bioinformatics analysis and in vivo experiments to predict and validate potential genes involved in the tumorigenesis of CAC.
Conclusion
Our study demonstrated that CXCL10 and CXCL11 might participate in the tumorigenesis of CAC by mediating the chronic inflammation in UC. Targeting CXCL10 and CXCL11 could be a promising therapeutic strategy to prevent CAC development in patients with UC.
Data availability statement
The original contributions presented in the study are included in the article/Supplementary Material. Further inquiries can be directed to the corresponding author.
Ethics statement
The animal study was reviewed and approved by the Animal Care and Use Committee of Renji Hospital, School of Medicine, Shanghai Jiao Tong University.
Author contributions
CL and MY contributed to the conception and design of the study. CL and XZ performed the data analysis of this study. YL conducted all in vivo experiments. CL and XZ wrote the manuscript, which was assessed and revised by JH and MY. All authors read and approved the final manuscript.
Funding
This study was financially supported by the National Natural Science Foundation of China (No. 81802308). CL was financially supported by the China Scholarship Council (201906230312) for his doctoral study.
Conflict of interest
The authors declare that the research was conducted in the absence of any commercial or financial relationships that could be construed as a potential conflict of interest.
Publisher’s note
All claims expressed in this article are solely those of the authors and do not necessarily represent those of their affiliated organizations, or those of the publisher, the editors, and the reviewers. Any product that may be evaluated in this article, or claim that may be made by its manufacturer, is not guaranteed or endorsed by the publisher.
Supplementary material
The supplementary material for this article can be found online at: https://www.frontiersin.org/articles/10.3389/fgene.2022.945414/full#supplementary-material
Supplementary Table S1 | Sequences of primers used in the experiment.
Supplementary Table S2 | Gene ontology and Kyoto Encyclopedia of Genes and Genomes enrichment analyses of common DEGs.
Supplementary Table S3 | Characteristics of patients with colorectal cancer in the Cancer Genome Atlas Program cohorts.
References
Bopanna, S., Ananthakrishnan, A. N., Kedia, S., Yajnik, V., and Ahuja, V. (2017). Risk of colorectal cancer in asian patients with ulcerative colitis: a systematic review and meta-analysis. Lancet. Gastroenterol. Hepatol. 2 (4), 269–276. doi:10.1016/s2468-1253(17)30004-3
Burns, J. M., Summers, B. C., Wang, Y., Melikian, A., Berahovich, R., Miao, Z., et al. (2006). A novel chemokine receptor for SDF-1 and I-TAC involved in cell survival, cell adhesion, and tumor development. J. Exp. Med. 203 (9), 2201–2213. doi:10.1084/jem.20052144
Cambien, B., Karimdjee, B. F., Richard-Fiardo, P., Bziouech, H., Barthel, R., Millet, M. A., et al. (2009). Organ-specific inhibition of metastatic colon carcinoma by CXCR3 antagonism. Br. J. Cancer 100 (11), 1755–1764. doi:10.1038/sj.bjc.6605078
Chen, B., Khodadoust, M. S., Liu, C. L., Newman, A. M., and Alizadeh, A. A. (2018). Profiling tumor infiltrating immune cells with CIBERSORT. Methods Mol. Biol. 1711, 243–259. doi:10.1007/978-1-4939-7493-1_12
Chen, Y., Wang, B., Yuan, X., Lu, Y., Hu, J., Gao, J., et al. (2021). Vitexin prevents colitis-associated carcinogenesis in mice through regulating macrophage polarization. Phytomedicine. 83, 153489. doi:10.1016/j.phymed.2021.153489
Cooper, H. S., Murthy, S. N., Shah, R. S., and Sedergran, D. J. (1993). Clinicopathologic study of dextran sulfate sodium experimental murine colitis. Lab. Invest. 69 (2), 238–249.
Cosnes, J., Gower-Rousseau, C., Seksik, P., and Cortot, A. (2011). Epidemiology and natural history of inflammatory bowel diseases. Gastroenterology 140 (6), 1785–1794. doi:10.1053/j.gastro.2011.01.055
Du, L., and Ha, C. (2020). Epidemiology and pathogenesis of ulcerative colitis. Gastroenterol. Clin. North Am. 49 (4), 643–654. doi:10.1016/j.gtc.2020.07.005
Egwuagu, C. E. (2009). STAT3 in CD4+ T helper cell differentiation and inflammatory diseases. Cytokine 47 (3), 149–156. doi:10.1016/j.cyto.2009.07.003
Fang, Z., Yang, H., Chen, D., Shi, X., Wang, Q., Gong, C., et al. (2019). YY1 promotes colorectal cancer proliferation through the miR-526b-3p/E2F1 axis. Am. J. Cancer Res. 9 (12), 2679–2692.
Gyde, S., Prior, P., Dew, M. J., Saunders, V., Waterhouse, J. A., Allan, R. N., et al. (1982). Mortality in ulcerative colitis. Gastroenterology 83 (1 Pt 1), 36–43. doi:10.1016/s0016-5085(82)80281-3
Hart, M., Nickl, L., Walch-Rueckheim, B., Krammes, L., Rheinheimer, S., Diener, C., et al. (2020). Wrinkle in the plan: miR-34a-5p impacts chemokine signaling by modulating CXCL10/CXCL11/CXCR3-axis in CD4(+), CD8(+) T cells, and M1 macrophages. J. Immunother. Cancer 8 (2), e001617. doi:10.1136/jitc-2020-001617
Hensbergen, P. J., Wijnands, P. G., Schreurs, M. W., Scheper, R. J., Willemze, R., Tensen, C. P., et al. (2005). The CXCR3 targeting chemokine CXCL11 has potent antitumor activity in vivo involving attraction of CD8+ T lymphocytes but not inhibition of angiogenesis. J. Immunother. 28 (4), 343–351. doi:10.1097/01.cji.0000165355.26795.27
Hyun, J. G., Lee, G., Brown, J. B., Grimm, G. R., Tang, Y., Mittal, N., et al. (2005). Anti-interferon-inducible chemokine, CXCL10, reduces colitis by impairing T helper-1 induction and recruitment in mice. Inflamm. Bowel Dis. 11 (9), 799–805. doi:10.1097/01.mib.0000178263.34099.89
Jess, T., Rungoe, C., and Peyrin–Biroulet, L. (2012a). Risk of colorectal cancer in patients with ulcerative colitis: a meta-analysis of population-based cohort studies. Clin. Gastroenterol. Hepatol. 10 (6), 639–645. doi:10.1016/j.cgh.2012.01.010
Jess, T., Simonsen, J., Jørgensen, K. T., Pedersen, B. V., Nielsen, N. M., Frisch, M., et al. (2012b). Decreasing risk of colorectal cancer in patients with inflammatory bowel disease over 30 years. Gastroenterology 143 (2), 375. doi:10.1053/j.gastro.2012.04.016
Kabashima, H., Yoneda, M., Nagata, K., Hirofuji, T., and Maeda, K. (2002). The presence of chemokine (MCP-1, MIP-1alpha, MIP-1beta, IP-10, RANTES)-positive cells and chemokine receptor (CCR5, CXCR3)-positive cells in inflamed human gingival tissues. Cytokine 20 (2), 70–77. doi:10.1006/cyto.2002.1985
Karagkouni, D., Paraskevopoulou, M. D., Chatzopoulos, S., Vlachos, I. S., Tastsoglou, S., Kanellos, I., et al. (2018). DIANA-TarBase v8: a decade-long collection of experimentally supported miRNA-gene interactions. Nucleic Acids Res. 46 (D1), D239–D245. doi:10.1093/nar/gkx1141
Kuhne, M., Preston, B., Wallace, S., Chen, S., Vasudevan, G., Witte, A., et al. (2007). MDX-1100, a fully human anti-CXCL10 (IP-10) antibody, is a high affinity, neutralizing antibody that has entered Phase I clinical trials for the treatment of Ulcerative Colitis (UC) 131.20). Am. Assoc. Immnol. 178 (Suppl. 1), S241. http://www.jimmunol.org/content/178/1_Supplement/S241.3.abstract.
Liu, J., Lichtenberg, T., Hoadley, K. A., Poisson, L. M., Lazar, A. J., Cherniack, A. D., et al. (2018). An integrated TCGA pan-cancer clinical data resource to drive high-quality survival outcome analytics. Cell 173 (2), 400. doi:10.1016/j.cell.2018.02.052
Liu, Z., Chen, X., Wang, X., Chen, X., Song, C. H., Du, Y., et al. (2011). Chemokine CXCL11 links microbial stimuli to intestinal inflammation. Clin. Exp. Immunol. 164 (3), 396–406. doi:10.1111/j.1365-2249.2011.04382.x
Mayer, L., Sandborn, W. J., Stepanov, Y., Geboes, K., Hardi, R., Yellin, M., et al. (2014). Anti-IP-10 antibody (BMS-936557) for ulcerative colitis: a phase II randomised study. Gut 63 (3), 442–450. doi:10.1136/gutjnl-2012-303424
Ng, S. C., Shi, H. Y., Hamidi, N., Underwood, F. E., Tang, W., Benchimol, E. I., et al. (2017). Worldwide incidence and prevalence of inflammatory bowel disease in the 21st century: a systematic review of population-based studies. Lancet 390 (10114), 2769–2778. doi:10.1016/S0140-6736(17)32448-0
Ohmori, Y., Schreiber, R. D., and Hamilton, T. A. (1997). Synergy between interferon-gamma and tumor necrosis factor-alpha in transcriptional activation is mediated by cooperation between signal transducer and activator of transcription 1 and nuclear factor kappaB. J. Biol. Chem. 272 (23), 14899–14907. doi:10.1074/jbc.272.23.14899
Ohmori, Y., Wyner, L., Narumi, S., Armstrong, D., Stoler, M., Hamilton, T. A., et al. (1993). Tumor necrosis factor-alpha induces cell type and tissue-specific expression of chemoattractant cytokines in vivo. Am. J. Pathol. 142 (3), 861–870.
Owen, K. L., Brockwell, N. K., and Parker, B. S. (2019). JAK-STAT signaling: a double-edged sword of immune regulation and cancer progression. Cancers (Basel) 11 (12), E2002. doi:10.3390/cancers11122002
Qian, Z., Gong, L., Mou, Y., Han, Y., and Zheng, S. (2019). MicroRNA-203a-3p is a candidate tumor suppressor that targets thrombospondin 2 in colorectal carcinoma. Oncol. Rep. 42 (5), 1825–1832. doi:10.3892/or.2019.7310
Réaux-Le Goazigo, A., Van Steenwinckel, J., Rostène, W., and Mélik Parsadaniantz, S. (2013). Current status of chemokines in the adult CNS. Prog. Neurobiol. 104, 67–92. doi:10.1016/j.pneurobio.2013.02.001
Rogler, G. (2014). Chronic ulcerative colitis and colorectal cancer. Cancer Lett. 345 (2), 235–241. doi:10.1016/j.canlet.2013.07.032
Sasaki, S., Yoneyama, H., Suzuki, K., Suriki, H., Aiba, T., Watanabe, S., et al. (2002). Blockade of CXCL10 protects mice from acute colitis and enhances crypt cell survival. Eur. J. Immunol. 32 (11), 3197–3205. doi:10.1002/1521-4141(200211)32:11<3197::AID-IMMU3197>3.0.CO;2-1
Shannon, P., Markiel, A., Ozier, O., Baliga, N. S., Wang, J. T., Ramage, D., et al. (2003). Cytoscape: a software environment for integrated models of biomolecular interaction networks. Genome Res. 13 (11), 2498–2504. doi:10.1101/gr.1239303
Singh, U. P., Singh, N. P., Murphy, E. A., Price, R. L., Fayad, R., Nagarkatti, M., et al. (2016). Chemokine and cytokine levels in inflammatory bowel disease patients. Cytokine 77, 44–49. doi:10.1016/j.cyto.2015.10.008
Singh, U. P., Singh, S., Taub, D. D., and Lillard, J. W. (2003). Inhibition of IFN-gamma-inducible protein-10 abrogates colitis in IL-10-/- mice. J. Immunol. 171 (3), 1401–1406. doi:10.4049/jimmunol.171.3.1401
Stormo, G. D. (2013). Modeling the specificity of protein-DNA interactions. Quant. Biol. 1 (2), 115–130. doi:10.1007/s40484-013-0012-4
Subramanian, A., Tamayo, P., Mootha, V. K., Mukherjee, S., Ebert, B. L., Gillette, M. A., et al. (2005). Gene set enrichment analysis: a knowledge-based approach for interpreting genome-wide expression profiles. Proc. Natl. Acad. Sci. U. S. A. 102 (43), 15545–15550. doi:10.1073/pnas.0506580102
Szklarczyk, D., Gable, A. L., Lyon, D., Junge, A., Wyder, S., Huerta-Cepas, J., et al. (2019). STRING v11: protein-protein association networks with increased coverage, supporting functional discovery in genome-wide experimental datasets. Nucleic Acids Res. 47 (D1), D607–D613. doi:10.1093/nar/gky1131
Tang, W., Zhou, W., Xiang, L., Wu, X., Zhang, P., Wang, J., et al. (2019). The p300/YY1/miR-500a-5p/HDAC2 signalling axis regulates cell proliferation in human colorectal cancer. Nat. Commun. 10 (1), 663. doi:10.1038/s41467-018-08225-3
Uguccioni, M., Gionchetti, P., Robbiani, D. F., Rizzello, F., Peruzzo, S., Campieri, M., et al. (1999). Increased expression of IP-10, IL-8, MCP-1, and MCP-3 in ulcerative colitis. Am. J. Pathol. 155 (2), 331–336. doi:10.1016/s0002-9440(10)65128-0
Ungaro, R., Mehandru, S., Allen, P. B., Peyrin-Biroulet, L., and Colombel, J.-F. (2017). Ulcerative colitis. Lancet (London, Engl. 389 (10080), 1756–1770. doi:10.1016/S0140-6736(16)32126-2
Vancamelbeke, M., Vanuytsel, T., Farré, R., Verstockt, S., Ferrante, M., Van Assche, G., et al. (2017). Genetic and transcriptomic bases of intestinal epithelial barrier dysfunction in inflammatory bowel disease. Inflamm. Bowel Dis. 23 (10), 1718–1729. doi:10.1097/mib.0000000000001246
Yu, J., Wang, F., Zhang, J., Li, J., Chen, X., Han, G., et al. (2020). LINC00667/miR-449b-5p/YY1 axis promotes cell proliferation and migration in colorectal cancer. Cancer Cell Int. 20, 322. doi:10.1186/s12935-020-01377-7
Keywords: ulcerative colitis, colorectal cancer, colitis-associated colorectal cancer, differentially expressed genes, TCGA
Citation: Lu C, Zhang X, Luo Y, Huang J and Yu M (2022) Identification of CXCL10 and CXCL11 as the candidate genes involving the development of colitis-associated colorectal cancer. Front. Genet. 13:945414. doi: 10.3389/fgene.2022.945414
Received: 16 May 2022; Accepted: 01 July 2022;
Published: 08 August 2022.
Edited by:
Fu Wang, Xi’an Jiaotong University, ChinaCopyright © 2022 Lu, Zhang, Luo, Huang and Yu. This is an open-access article distributed under the terms of the Creative Commons Attribution License (CC BY). The use, distribution or reproduction in other forums is permitted, provided the original author(s) and the copyright owner(s) are credited and that the original publication in this journal is cited, in accordance with accepted academic practice. No use, distribution or reproduction is permitted which does not comply with these terms.
*Correspondence: Minhao Yu, fishmeangood@163.com
†These authors have contributed equally to this work and share first authorship