 Xinwei Li1†
 Yongfei Fan2†
 Yue Zhang1Yanyan Wang1Menglin Zhao1Mingyue Tang1Huiyuan Li1Jiaqi Mi1Zhijun Geng3Zishu Wang1*Fang Su1*
- 1Department of Medical Oncology, First Affiliated Hospital of Bengbu Medical College, Bengbu, China
- 2Department of Thoracic Surgery, The Affiliated Changzhou No. 2 People’s Hospital of Nanjing Medical University, Changzhou, China
- 3Department of Central Laboratory, First Affiliated Hospital of Bengbu Medical College, Bengbu, China
Background: Chondroitin sulphate synthase 3 (CHSY3) is an important enzyme that regulates glycosylation, but it has not been reported in tumours. This study explored for the first time the oncological features of CHSY3 in stomach adenocarcinoma (STAD).
Methods: We analysed CHSY3 expression in STAD through the Cancer Genome Atlas (TCGA) database and verified our findings by immunohistochemical staining and Western blot experiments. The prognostic value of CHSY3 in STAD was analysed through the biological aspects of CHSY3 in STAD, such as communal clinical follow-up survival data, methylation sites, tumour immune microenvironment (TIME) and immune cell surface checkpoints. Finally, the immune-evasion potential of CHSY3 in STAD was assessed on the Tumor Immune Dysfunction and Exclusion (TIDE) website and immunohistochemical staining experiment.
Results: CHSY3 overexpression in STAD was associated with a poor prognosis based on immunohistochemical staining and Western blot experiments. Multivariate Cox analysis suggested that CHSY3 could be an independent prognostic risk factor. Pathway enrichment and TIME analysis demonstrated that CHSY3 up-regulated mesenchymal activation and immune activation signals in STAD, while TIDE assessment revealed that the risk of immune evasion was significantly higher in the high CHSY3 expression group than in the low CHSY3 expression group. Risk model scores based on CHSY3-associated immune cell surface checkpoints also presented poor prognosis, and immune evasion was significantly higher in the high-risk group than in the low-risk group.
Conclusions: This study analysed CHSY3 from multiple biological perspectives and revealed that CHSY3 can be a biomarker of poor prognosis and mediates the TIME immune-evasion status in STAD.
Introduction
Stomach cancer is the fifth most common cancer worldwide and has the third-highest mortality rate of all cancers (Smyth et al., 2020). More than one million cases of stomach cancer are diagnosed worldwide annually, and approximately 780,000 people die from it (Bray et al., 2018). Currently, gastric cancer is mainly diagnosed histopathologically after endoscopic biopsy, and clinical staging is determined by computed tomography, positron emission tomography-computed tomography and other methods (Ajani et al., 2016). Since the early symptoms of gastric cancer are not noticeable, most cases are already in advanced stages at the time of diagnosis; thus, the prognosis of gastric cancer is still very poor (Thrift and El-Serag, 2020). At present, molecular targeted therapy, tumour immunotherapy and gene therapy are continuously applied in the diagnosis and treatment of gastric cancer and showed promising results (Joshi and Badgwell, 2021). Therefore, further search for highly specific molecular biomarkers or targets for drug therapy is important.
Chondroitin sulphate synthase 3 (CHSY3) is a glycosyltransferase with glucuronosyltransferase and N-acetylgalactosaminyltransferase activities (Yada et al., 2003). Glycosylation of proteins is one of the most common post-translational modifications of proteins (Schjoldager et al., 2020). It is the process of transferring sugars to proteins and specific amino acid residues on proteins to form glycosidic bonds under the action of glycosyltransferases (Schjoldager et al., 2020). Cell carcinogenesis is often accompanied by structural changes in the glycoconjugate chain, such as the appearance of repetitive N-acetylamino galactose structures at the branch ends of the glycoconjugate chain and an increase in the levels of sialic acid and fucose (Stowell et al., 2015; Oliveira-Ferrer et al., 2017), which are commonly used as tumour markers in clinical practice (Wang et al., 2019; Luo et al., 2021). Glycosyltransferases are indirectly related to the development of malignant tumours and the prognosis of patients with cancer by altering the sugar chain (Silsirivanit, 2019). In addition, abnormal alterations in tumour cell surface glycosylation also lead to tumour immune microenvironment (TIME) immune evasion, thus providing a new immune checkpoint (IC) for immunotherapy (RodrÍguez et al., 2018; Bartish et al., 2020).
According to the pathological staging of gastric cancer, stomach adenocarcinoma (STAD) accounts for 95% of all gastric cancer cases (Ferlay et al., 2010). In this study, we explored the prognostic value of CHSY3 in STAD and determined whether it can be used as a biomarker of STAD prognosis. We also analysed the effect of CHSY3 on the TIME of STAD and explored its implications for STAD immunotherapy.
Materials and Methods
Acquisition of CHSY3 Expression Profiles
We selected the fragments per kilobase of transcript per million mapped read format of pan-cancer from The Cancer Genome Atlas (TCGA) database (https://www.cancer.gov/) (tumour, n = 10363; normal, n = 730) using the Sento Academic website (https://www.xiantao.love/) to analyse the differential expression of CHSY3 in pan-cancer (p-value < 0.05; Wilcoxon rank-sum test). Then, STAD expression matrix files (tumour, n = 375; normal, n = 32) were downloaded from TCGA database for paired and unpaired difference analyses by using the “limma” R package (p-value < 0.05; t-test). Table 1 exhibits the clinical information of high and low CHSY3 expression groups in STAD in TGCA database.
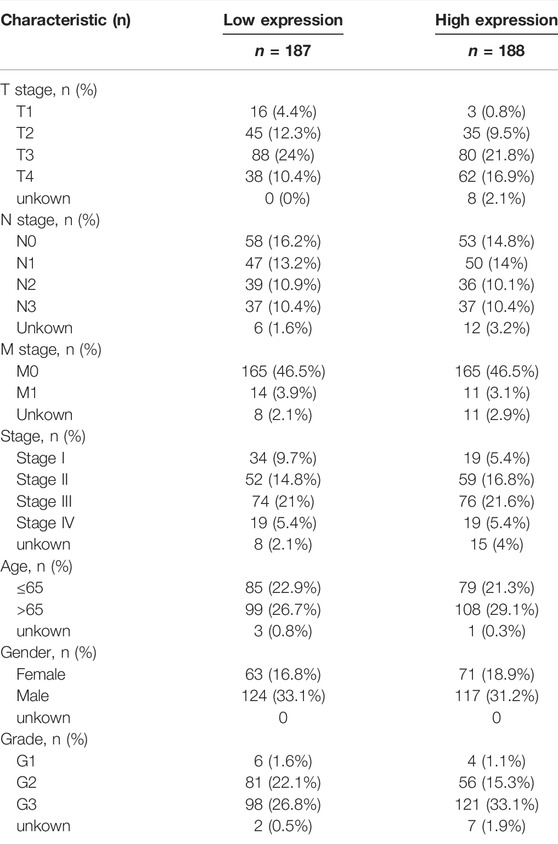
TABLE 1. Clinical information of CHSY3 high and low expression groups in the TCGA database.
Collection of Clinical Samples
Samples were collected from patients who underwent gastric cancer surgery in the Department of Gastroenterology, The First Affiliated Hospital of Bengbu Medical College, from January 2017 to December 2018. A total of eight gastric cancer tissue samples and their paraneoplastic tissues were collected for Western blot experiments and 197 gastric cancer tissue samples and 30 normal paraneoplastic tissues for immunohistochemical staining. No patients had received chemotherapy, radiotherapy or biological treatment before surgery and were diagnosed with gastric cancer before and after surgery. The collected tissue samples were stored in a −80°C refrigerator immediately after surgery until protein extraction.
Experimental Antibodies
Rabbit anti-human antibody CHSY3 (100 μg) was obtained from OriGene China. The primary antibody to β-actin and CD3+/CD4+/CD8+ T cells alpha rabbit monoclonal antibody were provided by Cell Signaling Technology, Inc. (Danvers, MA, United States). Horseradish peroxidase (HRP)-conjugated anti-rabbit antibody was provided by Jackson ImmunoResearch Inc. (West Grove, PA, United States). Bovine serum albumin was obtained from Sigma-Aldrich (St. Louis, MO, United States). Skimmed milk and Tween-20 were purchased from Sangon Biotech Co., Ltd. (Shanghai, China).
Immunohistochemical Staining
All samples were fixed in 4% paraformaldehyde, embedded in paraffin, sectioned to 4 μm and adhered to slides. After de-affinity under different density gradients of xylene, the slides were rehydrated, and antigens were retrieved with citric acid buffer (pH 7.8, 0.1 M) at approximately 82°C for 24 min. The sections were evenly covered with endogenous peroxidase blocking solution for 15 min at room temperature to block the activity of endogenous peroxidase. After incubation with gene primary antibody or overnight at 4°C, the slides were washed gently with phosphate-buffered saline and incubated with biotin-conjugated secondary antibody for 10 min at room temperature and incubated with streptavidin peroxidase for 5 min. All sections were stained with hematoxylin and then cleaned. After sections were dried and cleared, immunohistochemical evaluation was performed.
Western Blot
Fresh gastric cancer tissue was obtained, and total protein was extracted. PowerPac HV high-voltage power supply (Bio-Rad Laboratories, Inc., CA, United States) was used for protein electrophoresis. Total protein was electrophoretically transferred to polyvinylidene fluoride membrane after sodium dodecyl sulphate polyacrylamide gel electrophoresis. After closure with fresh 5% skimmed milk, the membranes were incubated overnight at 4°C with CHSY3 primary antibody diluted at 1:800 and β-actin diluted at 1:3000. After washing with TBST, the membranes were incubated with horseradish peroxidase-coupled anti-rabbit immunoglobulin G diluted at 1:3000 for 2 h at room temperature. Finally, specific protein bands were detected for visualisation using the Bio-Rad Chemical XRS Imaging System (Bio-Rad Laboratories).
To quantify the differential expression of CHSY3 in STAD and normal tissues, we extracted parameters from the results of Western blot experiments by ImageJ (version: 1.8.0) software and visualized them by GraphPad Prism (version: 9) software for bar chart.
Prognostic Analysis of CHSY3 in Stomach Adenocarcinoma
Correlation between CHSY3 expression (Affymetrix ID: 242100_at) and overall survival (OS; n = 881), first progression (FP) (n = 645) and post-progression survival (PPS) (n = 503) were analysed in the Kaplan–Meier Plotter website (https://kmplot.com/analysis/) by selecting the ‘Gastric Cancer’ module. Database samples were divided into high and low expression groups based on the mean value of CHSY3 expression (OS: cut-off value = 124, high = 234, low = 397; FP: cut-off value = 100, high = 258, low = 264; PPS: cut-off value = 125, high = 138, low = 246). The log-rank test was used to compare the survival differences between the two groups. We also used TCGA database to combine CHSY3 with clinical factors (gender, age, grade, T, N, M and stage) in the univariate and multivariate Cox analyses to look for independent indicators of STAD prognosis. Finally, we used the “rms” R package to construct a nomogram survival prediction system to integrate CHSY3 expression with clinical factors in each patient with STAD to predict 1-, 3- and 5-year survival rates. This system uses scoring criteria based on the magnitude of the regression coefficients of all independent variables and gives each independent variable a score for each value considered. A total score can be calculated for each patient. Subsequently, the probability of outcome occurrence for each patient was calculated using a conversion function between the scores and probability of outcome occurrence (Iasonos et al., 2008; Balachandran et al., 2015). In addition, the accuracy of the nomogram prediction system in predicting 1-, 3- and 5-year survival rates was assessed using calibration curves. If the model prediction curve matched, located above or found below the reference line, the predicted value was considered equal, greater or lower than the actual value, respectively.
Methylation Analysis of CHSY3 in Stomach Adenocarcinoma
CHSY3 expression-associated methylation sites were analysed using MEXPRESS (https://mexpress.be) by selecting the “STAD” section (p-value < 0.05). Then, SurvivalMeth (http://bio-bigdata.hrbmu. edu.cn/survivalmeth/) was used to analyse survival differences between the CHSY3 expression-related methylation site and STAD prognosis (log-rank test, p-value < 0.05).
Gene Set Enrichment Analysis
To further explore the oncogenic correlation between CHSY3 and STAD, we used GSEA for oncogenic pathway enrichment. GSEA ranks genes according to the degree of differential expression in the two types of samples using a predefined set of genes, usually from functional annotations or results of previous experiments, and then tests whether the predefined set of genes is enriched at the top or bottom of this ranking table (Subramanian et al., 2005). Gene sets under pathways with |normalised enrichment score |>1, nominal p-value < 0.05 and false discovery rate q-value < 0.25 are generally considered significant.
Analysis of the Role of CHSY3 in the TIME of Stomach Adenocarcinoma
The Hallmark consensus pathway gene set downloaded from the Molecular Signatures Database (http://www.gsea-msigdb.org/gsea/login.jsp) was subjected to gene set variation analysis (GSVA) using the “GSVA” R language package to assess the enrichment of the Hallmark pathway in the high and low CHSY3 expression groups (p-value < 0.05). GSVA is a non-parametric, unsupervised algorithm that assesses the enrichment of different metabolic pathways between samples by converting the sample-to-sample gene expression matrix into a sample-to-sample genomic expression matrix (Hänzelmann et al., 2013). Single-sample GSEA (ssGSEA) enrichment analysis was also performed using the “GSVA” R language package to assess the differences in immune cells and functions between the high and low CHSY3 expression groups (p-value < 0.05).
The estimation of stromal and immune cells in malignant tumour tissues using expression data (ESTIMATE) algorithm was used to assess the immune cell score, stromal score and tumour purity score of the high and low CHSY3 expression groups in the TIME of STAD. ESTIMATE analysis was performed using transcriptional profiles of cancer samples to evaluate the number of tumour cells, infiltrating immune cells and stromal cells, and the “estimateScore” function was used to calculate tumour purity, immune cell score and stromal cell score of all samples (p-value < 0.05).
Construction of CHSY3-Related Immune Signatures
The “limma” R language package was used to analyse CHSY3-related marker genes in high and low CHSY3 expression groups (p-value < 0.05). Sixty-six immune cell surface marker genes in STAD were analysed by the “reshape2” R package to determine correlation with CHSY3 expression (p-value < 0.05). The prognosis of CHSY3-related marker genes in STAD was further analysed using prognosis-related genes for the stepwise multivariate Cox proportional hazard regression analysis to obtain the optimal candidates and construct an immune-related risk model. The formula for calculating the risk score was as follows:
The “coefi” and “Xi” represent the coefficient and expression level of each CHSY3 prognosis-related marker gene, respectively. According to the risk score of the model, TCGA samples can be divided into the high- and low-risk groups. The log-rank test was used to compare the survival differences between the two groups (p-value < 0.05). The “survivalROC” package was used to performreceiver operating characteristic (ROC) curve, and the Area Under Curve (AUC) values were obtained to evaluate the prognostic model’s reliability. To further analyse the prognostic risk of model scores, we performed univariate and multivariate Cox analyses by combining model scores with clinical factors (sex, age, grade, T, N, M, and stages) to assess whether model scores could be used as independent prognostic factors. Finally, the Tumor Immune Dysfunction and Exclusion (TIDE) (http://tide.dfci.harvard.edu/login/) was used to evaluate the risk of immune evasion and the effect of immunotherapy between the high- and low-risk groups of the model.
Statistical Analysis
Statistical analyses were performed using the R software version 4.1.1 (R Foundation for Statistical Computing, Vienna, Austria). For quantitative data in the article data analysis, the significance of normally distributed variables was estimated using Student’s t-test, and non-normally distributed variables were analysed using the Wilcoxon rank-sum test. The log-rank test was used to compare data between two groups, and the Kruskal–Wallis test was performed to compare data between more than two groups. A p-value < 0.05 was considered significant.
Results
Expression Analysis of CHSY3 in Stomach Adenocarcinoma
Pan-cancer differential expression analysis revealed that CHSY3 was significantly differentially expressed in various cancers, with significant down-regulation in glioblastoma multiforme, lung adenocarcinoma, lung squamous carcinoma, etc., and significant up-regulation in STAD, breast-invasive carcinoma, kidney renal clear cell carcinoma, etc. (p-value < 0.05, Figure 1A). Paired difference analysis demonstrated significantly higher CHSY3 expression in STAD tissues than in paracancerous tissues (p-value < 0.05, Figure 1B) and exhibited consistent results in the unpaired difference analysis (p-value < 0.05, Figure 1C). At the tissue level, CHSY3 expression was higher in STAD tissues than in paraneoplastic tissues by immunohistochemical staining analysis (Figure 1D). This result was also observed at the protein level by Western blot experiments (Figure 1E). In addition, quantitative analysis of Western blot experiments demonstrated that CHSY3 expression was significantly higher in tumour tissues than in normal tissues in 7 out of 8 pairs of tissues (Figure 1F). Altogether, CHSY3 expression was significantly higher in STAD than in normal tissues.
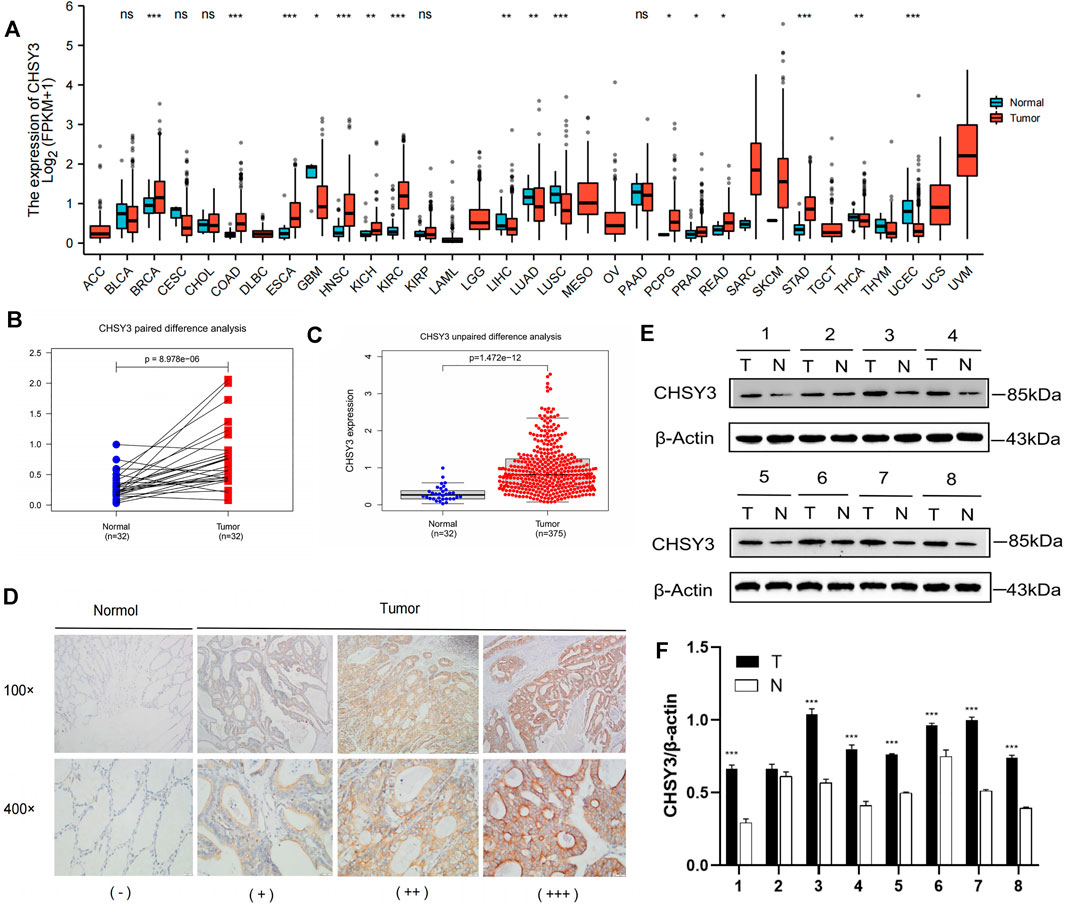
FIGURE 1. CHSY3 expression levels in tumours. (A) Differntial expression of CHSY3 in tumour tissues and normal tissues in pan-cancer. CHSY3 expression was significantly higher in STAD than in normal tissue in TCGA database (p-value<0.05). (B) Paired and (C) unpaired differentail analyses. (D) Immunohistochemical staining analysis showing higher expression in STAD than in normal adjacent tissue. (E) Western blot experiment comparing CHSY3 expression in tumour and normal tissues. (F) Quantitative difference analysis between tumour tissue and normal tissue for western blot experiment results. *p-value<0.05; **p-value<0.01; ***p-value<0.001.
Prognostic Analysis and Assessment of the Practical Clinical Utility of CHSY3 in Stomach Adenocarcinoma
The survival analysis revealed that the high CHSY3 expression group had poorer OS (Figure 2A), FP (Figure 2B) and PPS (Figure 2C) than the low CHSY3 expression group in the Kaplan–Meier Plotter database (p-value < 0.05). In addition, the univariate Cox analysis presented that T3, T4, N1, N3, M1, stage III, stage IV, age >65 years and CHSY3 expression were all risk factors significantly associated with prognosis (p-value < 0.05). The multivariate Cox analysis indicated that age and CHSY3 could be used as risk factors for STAD independent of the clinical factors in Table 2 (p-value < 0.05). This implies that CHSY3 can be used as an indicator of STAD prognosis.
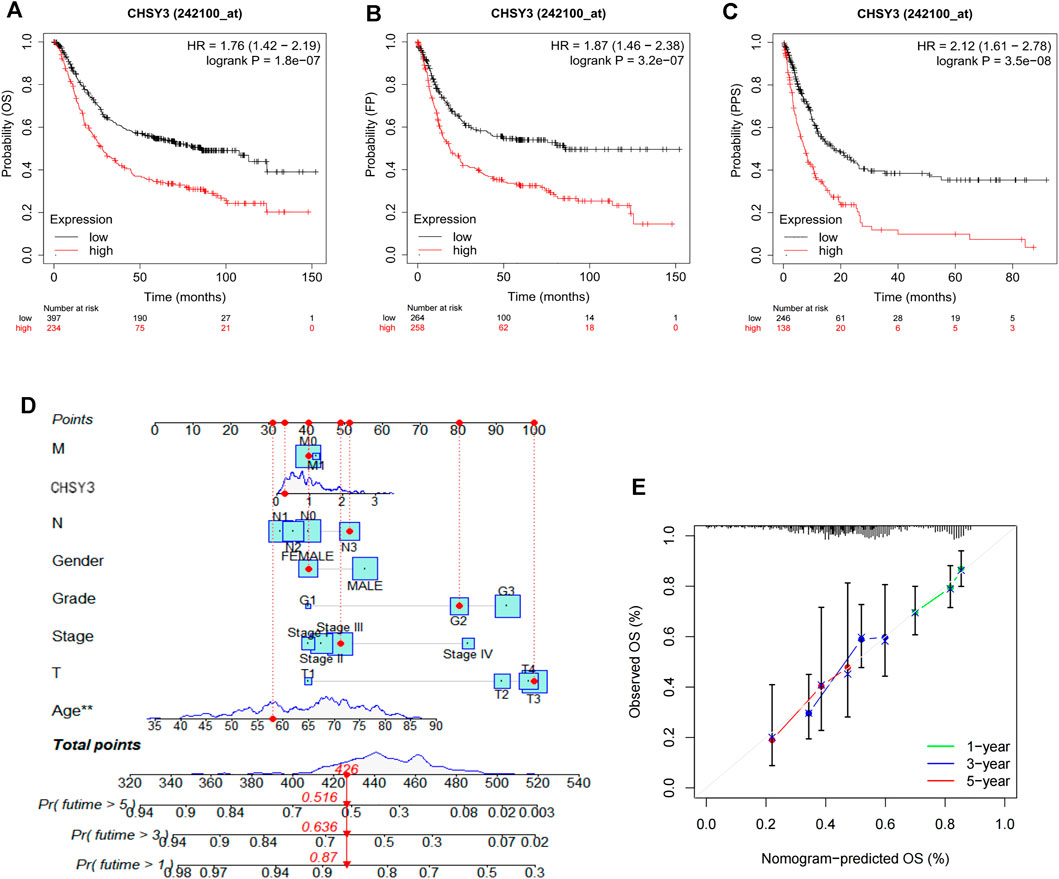
FIGURE 2. Prognostic analysis of CHSY3 in STAD in the Kaplan-Meier Plotter database. In STAD, the survival of the low CHSY3 expression group was significantly better than that of the high CHSY3 expression group (p-value<0.05). A low CHSY3 expression was associated with better overall survival (A), first progession (B) and post-progession survival (C). (D) Integration of CHSY3 expression and clinical factors to construct nomogram survival predictions. Each factor in the prediction system corresponds to a score, and th sum of the scores for all clinical factors corresponds to the total patient score, thus predicting 1-3, and 5-year survival rates. (E) Calibration curves for 1-3- and 5 year survival predictions in the nomogram prediction system.
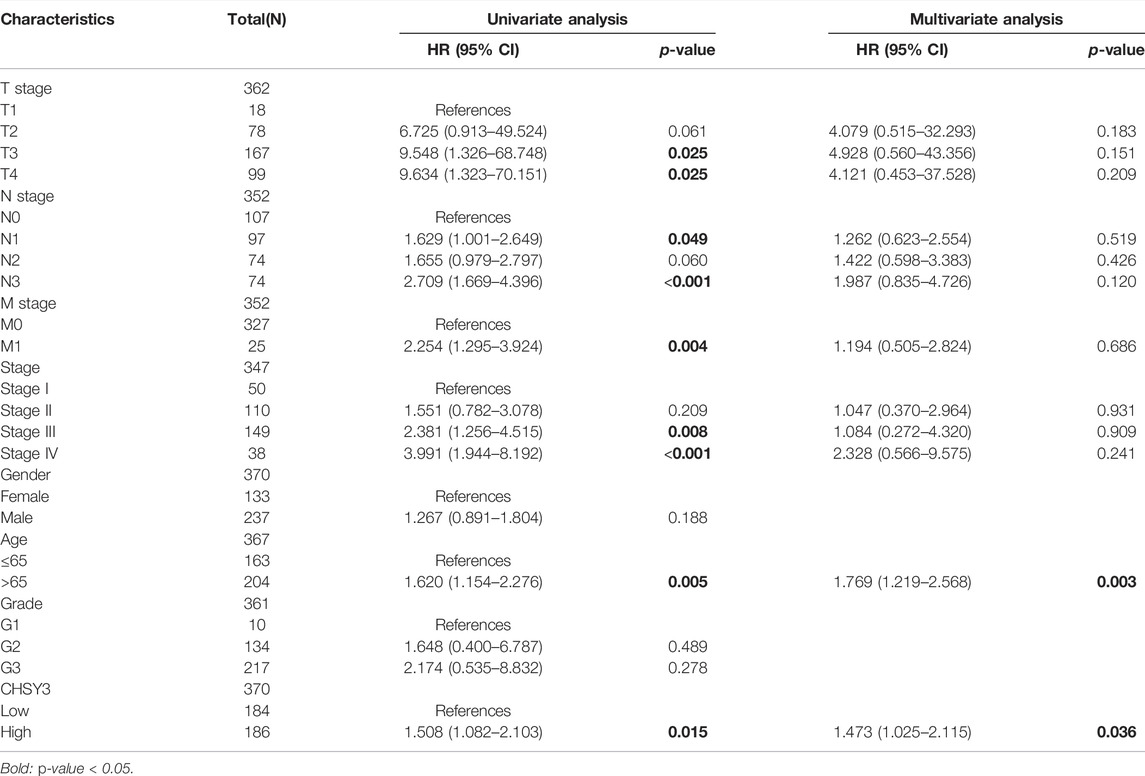
TABLE 2. Univariate and multivariate COX analysis of CHSY3 and clinical factors in the TCGA database.
To further evaluate the practical benefits of CHSY3 in clinical applications, we integrated CHSY3 expression data in STAD with clinical factors to construct a nomogram to predict patient survival at 1, 3 and 5 years (Figure 2D). The nomogram system survival prediction curves have a high coincidence with the calibration curve, which indicates the high accuracy of our nomogram (Figure 2E). Therefore, the proposed nomogram survival prediction system has a good clinical utility value.
Analysis of CHSY3-Related Methylation Sites and Their Prognosis
MEXPRESS identified a total of 12 methylation sites associated with CHSY3 expression in STAD. Among these CHSY3 expression-associated methylation sites, cg10678749, cg11572844, cg02589568, and cg06610705 presented a significant positive correlation with CHSY3 expression (r > 0, p-value < 0.05), while cg04729562, cg18829263, cg02458929, cg26226142, cg09608073, cg24642372, cg20694933, and cg02571738 (r < 0, p-value < 0.05) had a significant negative correlation with CHSY3 expression (Figure 3A). SurvivalMeth revealed that seven CHSY3 expression-associated methylation sites had significant survival value. Cg06610705 and cg11572844 were positively correlated with CHSY3 expression, and high CHSY3 expression groups of these sites had a poorer prognosis than the low CHSY3 expression groups (Figure 3B, p-value < 0.05). Cg24642372, cg20694933, cg09608073, cg02571738 and cg26226142 were negatively correlated with CHSY3 expression, of which the low CHSY3 expression groups had a poorer prognosis than the high CHSY3 expression groups (Figure 3C, p-value < 0.05). Consistent with previous findings, the group with high CHSY3 expression-associated methylation sites had a poor prognosis of STAD.
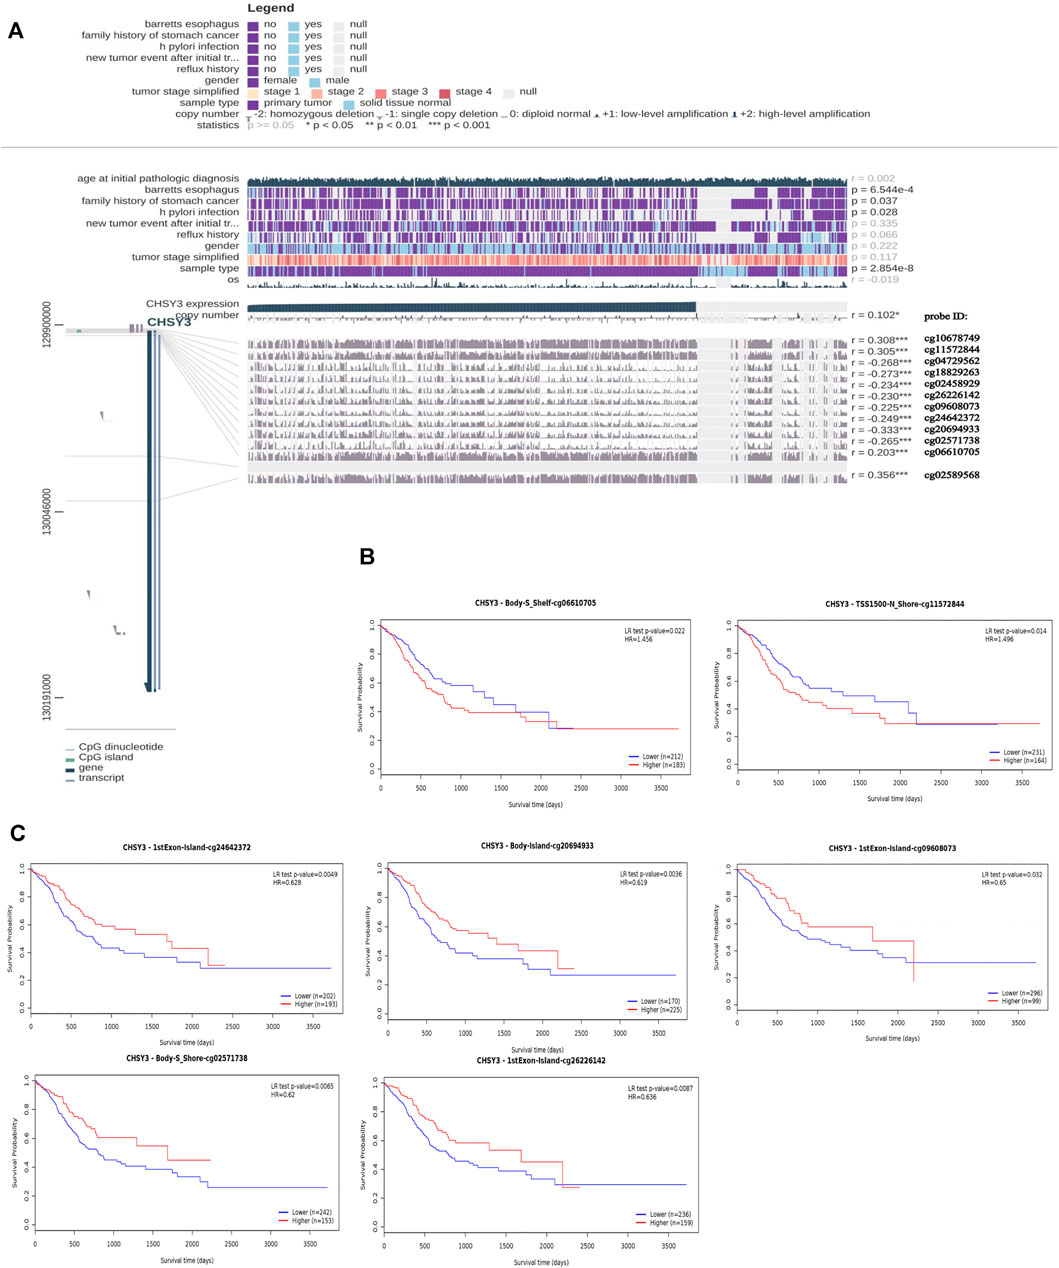
FIGURE 3. Correlation and prognostic analysis of CHSY3 methylation sites in STAD. (A) Methylation sites associated with CHSY3 expression inSTAD. r: correlation; probe ID: methylation site; *p-value<0.05; **p-value<0.01; ***p-value<0.001. (B) The survival of the high expression group was significantly poorer than that of the low expression group at the CHSY3 positively correlated methylation sites. (C) The survival of the low expression group was significantly poorer than that of the low expression group at the CHSY3 negatively associated methylation sites.
GSEA Oncogenic Pathway Enrichment
GSEA showed that CHSY3 is involved in multiple signalling pathways in STAD. Table 3 exhibits the top 10 up-regulated signalling pathways associated with CHSY3 according to the GSEA score in STAD. We found that the transforming growth factor-beta (TGF-β), Wnt and Hedgehog signalling pathways were associated with the tumour mesenchymal pathway. The chemokine, Toll-like receptor and NOD-like receptor signalling pathways are involved in immune and inflammatory activation (Figure 4). Interestingly, high expression of CHSY3 in STAD did not perform a better prognosis.

TABLE 3. CHSY3 oncogenic pathway parameters in GSEA enrichment analysis.
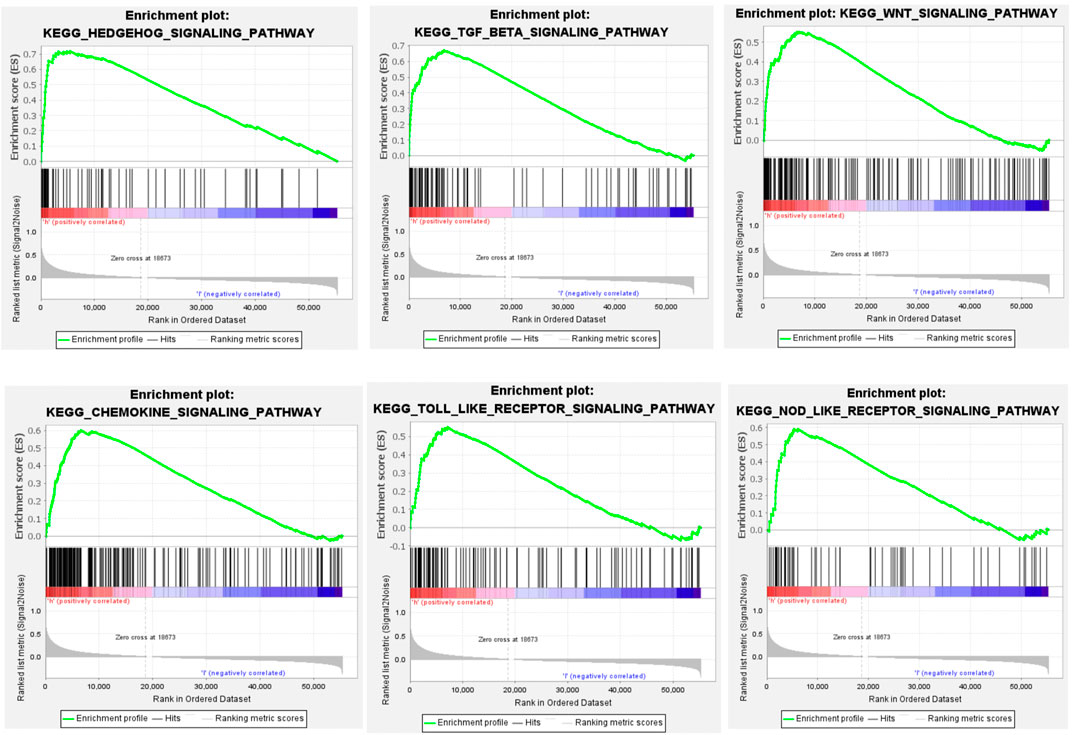
FIGURE 4. GSEA of the oncogenic pathway up-regulated by CHSY3 in STAD.
Effect of CHSY3 Expression on the TIME of Stomach Adenocarcinoma
To explore the effect of CHSY3 expression on the TIME in STAD, the Hallmark pathway gene set was enriched in the high and low CHSY3 expression groups using GSVA enrichment analysis. The results presented that the high CHSY3 expression group was up-regulated in immune activation and inflammatory signalling pathways, such as the TNFA signalling via NF-KB, allograft rejection, complement, IL6–JAK–STAT3 signalling, IL2–STAT5 signalling and inflammatory response. Moreover, the high CHSY3 expression group was up-regulated in epithelial–mesenchymal transition (EMT), TGF-β signalling, angiogenesis, Wnt/beta-catenin signalling, Notch signalling and other mesenchymal signalling pathways, while the low CHSY3 expression group demonstrated the opposite phenomenon (Figure 5A). The heatmap and differential analysis of immune cells and functions in STAD using the ssGSEA method demonstrated higher enrichment in the high CHSY3 expression group than in the low CHSY3 expression group (Figures 5A,B). The ESTIMATE assessment of the TIME in STAD also revealed that the immune cell score (Figures 5A,C) and tumour stroma score (Figures 5A,D) were significantly higher in the high CHSY3 expression group than in the low CHSY3 expression group, while the tumour purity score (Figures 5A,E) demonstrated the opposite phenomenon. These analyses consistently revealed that the high CHSY3 expression group was associated with severe immune cell infiltration. However, this immune advantage did not exhibit a survival advantage, which became the focus of our attention. Studies have demonstrated that the immune-exclusive tumour phenotype is characterised by numerous immune cells that are retained in the stroma surrounding the nest of tumour cells without penetrating these cells (Chen and Mellman, 2017). Immune-evading tumours are generally characterised by high TGF-β expression, myeloid inflammation and tumour neovascularisation as microenvironmental features (Fukumura et al., 2018; Metelli et al., 2018; Hegde and Chen, 2020). Figure 5F displays that signalling pathways such as EMT, angiogenesis, TGF-β and Wnt were significantly higher in the high CHSY3 expression group than in the low CHSY3 expression group. Therefore, a high CHSY3 expression mediates TIME immune evasion in STAD.
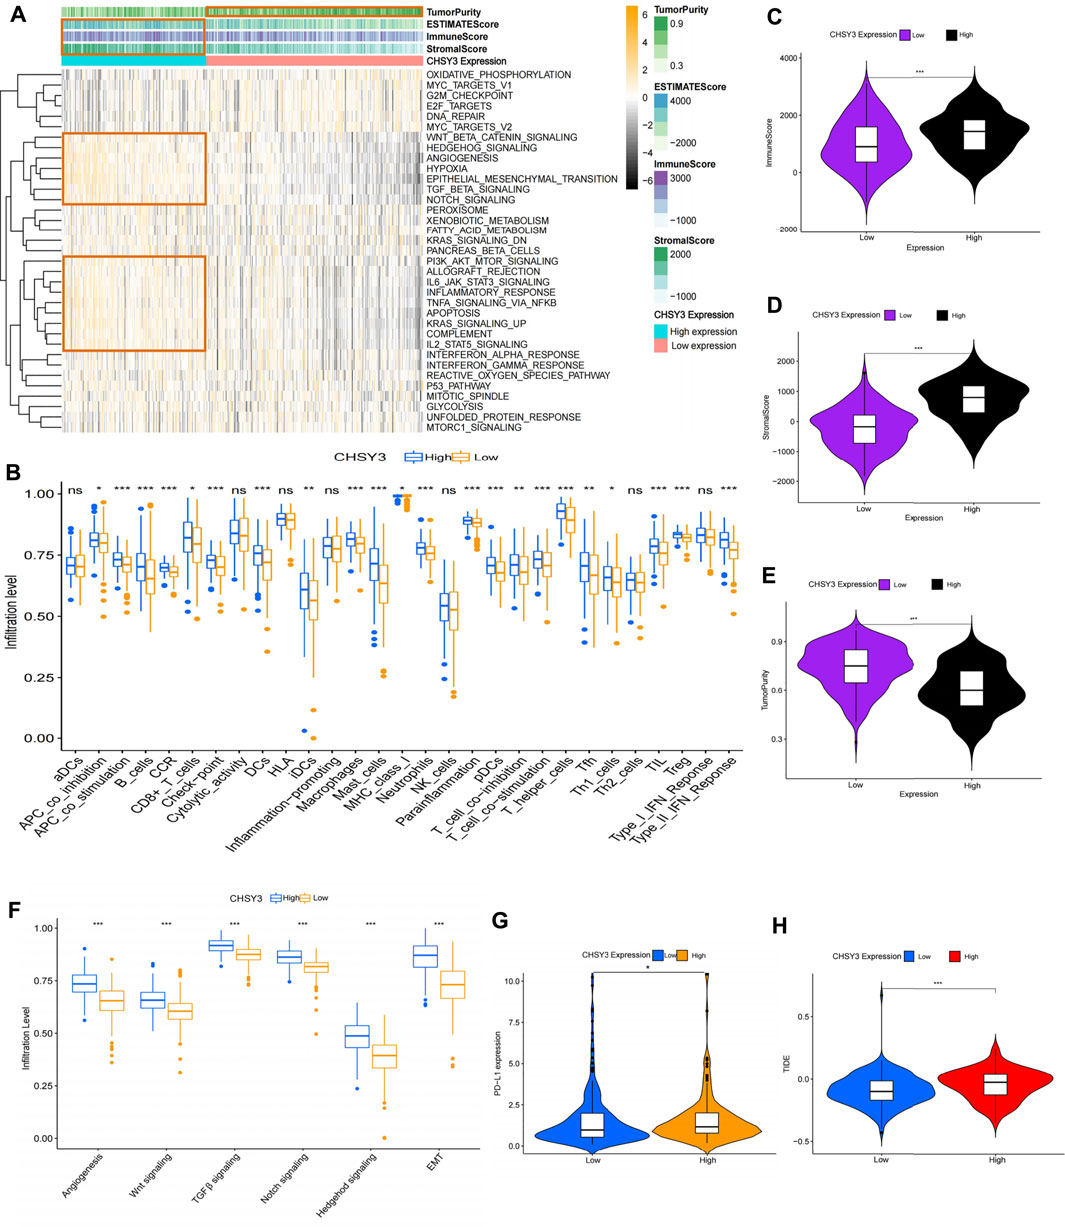
FIGURE 5. Analysis of the immune microenvironment of CHSY3 in STAD. (A) Enrichment of high and low CHSY3 expression groups in STAD in the Hallmark pathway gene sets. Yellow black represent samples with high and low expressions, respectively. (B) Differential analysis of high and low CHSY3 expression groups in STAD regrading immune cells and functions. Red and blue represent samples with high and low expressions, respectively. The ESTIMATE algorithm assesses the immune cell score (C), stromal score (D) and tumour purity (E) score in the high and low CHSY3 expression groups in STAD. (F) DIfferential analysis of high and low CHSY3 expression groups in STAD stromal signalling pathway. (G), (H) Assessment of immune evasion and immunotherapy efficacy in high and low CHSY3 expression groups. *p-value<0.05; **p-value<0.01; ***p-value<0.001.
Currently, programmed death-ligand 1 (PD-L1) is a remarkable discovery in immunotherapy, and its expression level is an important predictor of the response to anti-PD-1/L1 therapy (Fukumura et al., 2018). We further selected PD-L1 to assess the effect of immunotherapy, and the results revealed that PD-L1 expression was higher in the high CHSY3 expression group than in the low CHSY3 expression group, implying that the high CHSY3 expression group may have immune-evasion ability and better immunotherapy effects (Figure 5G). Studies have also reported that the newly discovered TIDE score is an effective predictor of anti-PD1 and anti-CTLA4 therapy among all efficacy characteristics of ICI suppression therapy (Jiang et al., 2018). The predictive function of the TIDE score for efficacy was stable regardless of the degree of tumour-infiltrating cytotoxic T-cells (Jiang et al., 2018). The TIDE score analysis indicated that the high CHSY3 expression group had significantly higher score than the low CHSY3 expression group; this finding also demonstrated that high CHSY3 expression mediates the immune-evasion status of the TIME in STAD (Figure 5H).
Immunoprognostic Analysis of CHSY3 in Stomach Adenocarcinoma
Using the PubMed database, we retrieved 66 marker genes localised on the surface of immune cells. Proteins encoded by these genes, also known as immunomodulators, are classified as immunostimulators and immunoinhibitors, and studies have demonstrated that immunomodulators have significant effects on prognosis (Hadden, 1993; Hengge et al., 2001). In the correlation analysis, 46 of 66 immunomodulators in STAD were associated with CHSY3 expression (Table 4). In the differential expression analysis, 41 of 46 CHSY3-related immunomodulators were significantly different between the high and low CHSY3 expression groups (Figure 6A, p-value < 0.05). In the Cox survival analyses, CHSY3 expression-related genes, namely, CSF1R, TGFB1, CXCR4, and TNFSF18, were prognosis-related risk factors, while CTLA4 was a prognosis-related favourable factor (Figure 6B, p-value < 0.05). Moreover, we constructed a CSHY3-related immune risk model based on prognostic immunomodulators. The model risk scoring formula is as follows: risk core = (coefficient × CXCR4 expression) + (coefficient × CTLA4 expression) (Figure 6C). The immune risk model was constructed to classify TCGA samples according to risk and prognosis (Figure 6D). According to the model, the survival of the high-risk group was significantly worse than that of the low-risk group (Figure 6E). The accuracy assessment of the ROC curve for the risk model revealed that the risk scoring of the model (AUC = 0.706) and the model risk scoring combined with clinical factors (AUC = 0.738) had a high accuracy. In addition, the univariate Cox analysis bared that age, stage, T, N and risk score were prognostically relevant risk factors (Figure 6G), and the multivariate Cox analysis revealed that age and risk score could be used as independent prognostic risk factors (Figure 6H). These analyses suggest that the CHSY3-mediated TIME of STAD is associated with a poor prognosis. The TIDE score indicated that the high-risk group demonstrated a significantly higher risk of immune evasion than the low-risk group (Figure 6I). This is consistent with the previous conclusion that CHSY3 mediates the immune-evasion status in the TIME of STAD.
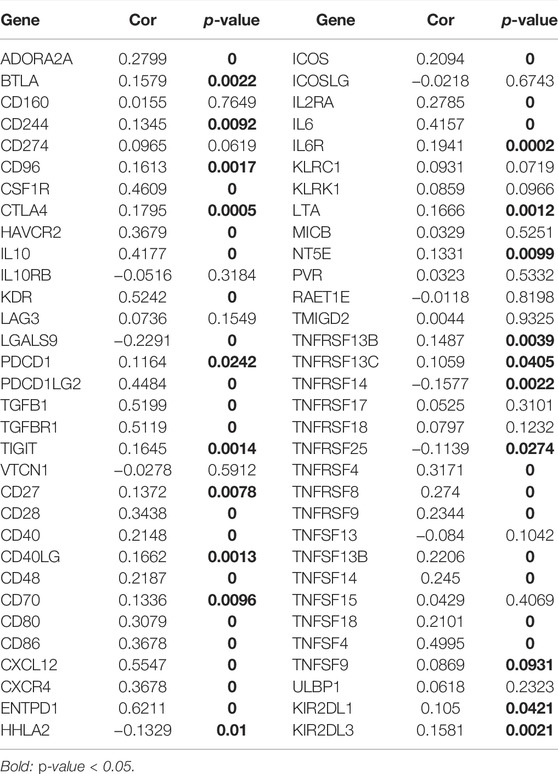
TABLE 4. Immune checkpoints associated with CHSY3 in STAD.
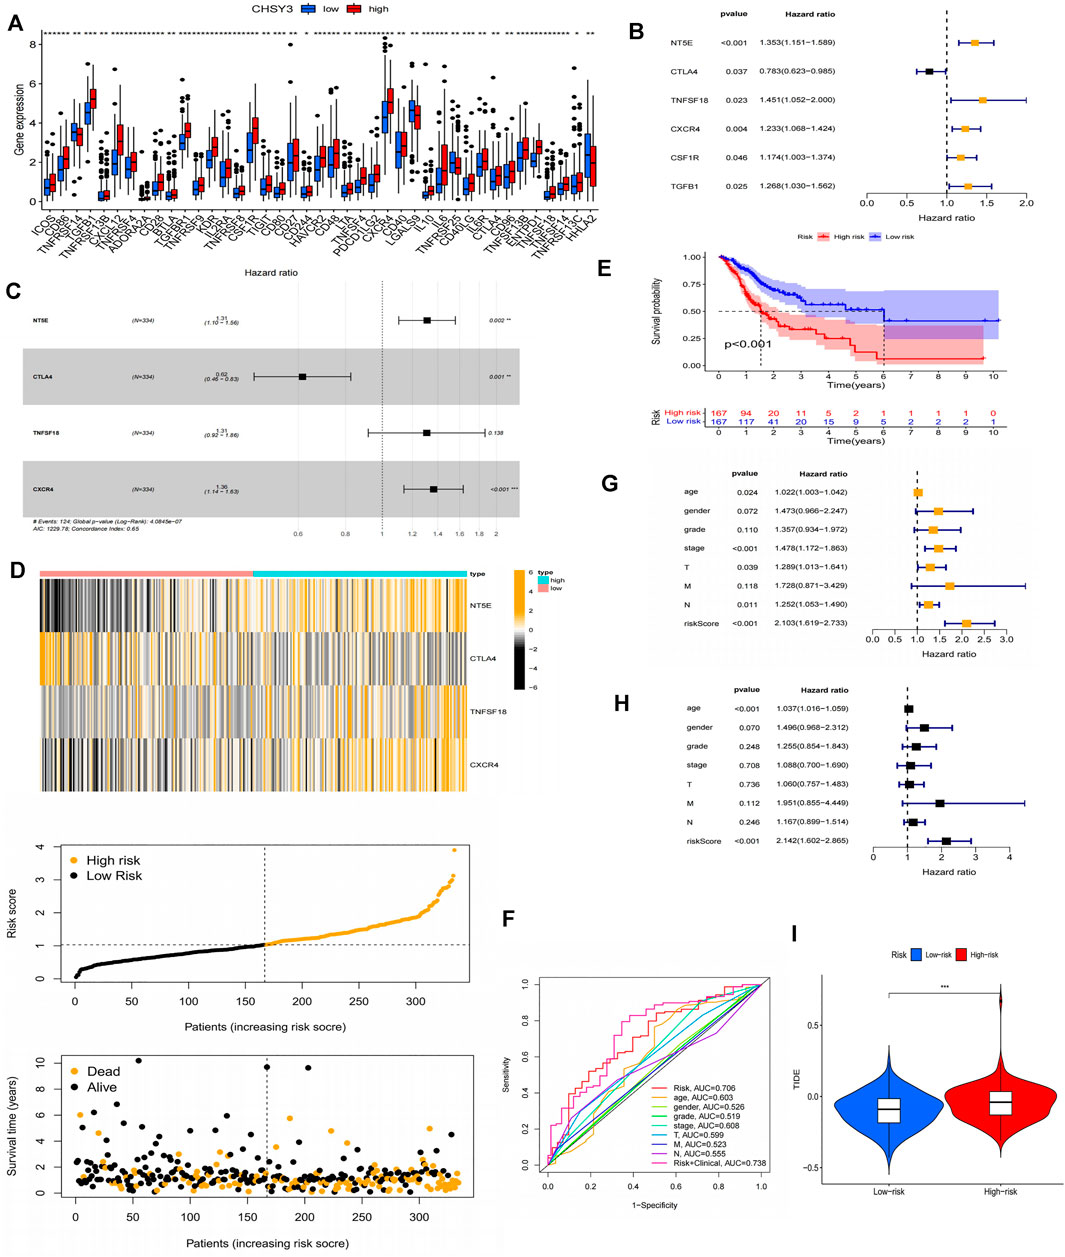
FIGURE 6. Construction of a CHSY3 immunomodulator risk model in STAD. (A) Diffenential analysis of high and low CHSY3 expression groups in immunomodulator. (B) prognostic immunomodulators associated with CHSY3 in STAD. (C), (D) Construction of a cox risk proportional regression model for CHSY3 associated with immunomodulators in STAD. (E) The prognosis for the high-risk group divided according to the risk model is significantly poorer than that for the low risk group. (F) Assesing the accuracy of Cox model risk predictions using ROC curves. Model risk scores combined with clinical factors for (G) univariate and (H) multivariate COX analysis. (I) assesment of immune evasion and immunotherapy efficacy in high-risk and low-risk groups. *p-value<0.05; **p-value<0.01; ***p-value<0.001.
Immune Cell Infiltration in CHSY3 High and Low Expression Groups
To further verify that CHSY3 mediates TIME immune evasion in STAD, we selected tissue samples expressing “+” and “+++” of CHSY3 in STAD in Figure 1D for immunohistochemical staining analysis. The purpose of staining was to observe the infiltration of CD3+ T cells, CD4+ T cells and CD8+ T cells in STAD tumour tissues and surrounding tissues to determine whether the high expression of CHSY3 in TIME is consistent with the characteristics of immune evasion. The results showed that CD3+ T cells, CD4+ T cells and CD8+ T cells in CHSY3 expressing “+++” tissues were mainly clustered in the tumour peripheral stroma, with few immune cells penetrating the stroma into the tumor parenchyma (Figure 7A). In contrast, in CHSY3 expressing “+”, tumour peripheral CD3+ T cells, CD4+ T cells and CD8+ T cells clustered less and more immune cells penetrated the stroma into the tumour parenchyma (Figure 7B). In summary, this phenomenon further confirms that the CHSY3 high expression group mediates immune evasion in the TIME of STAD.
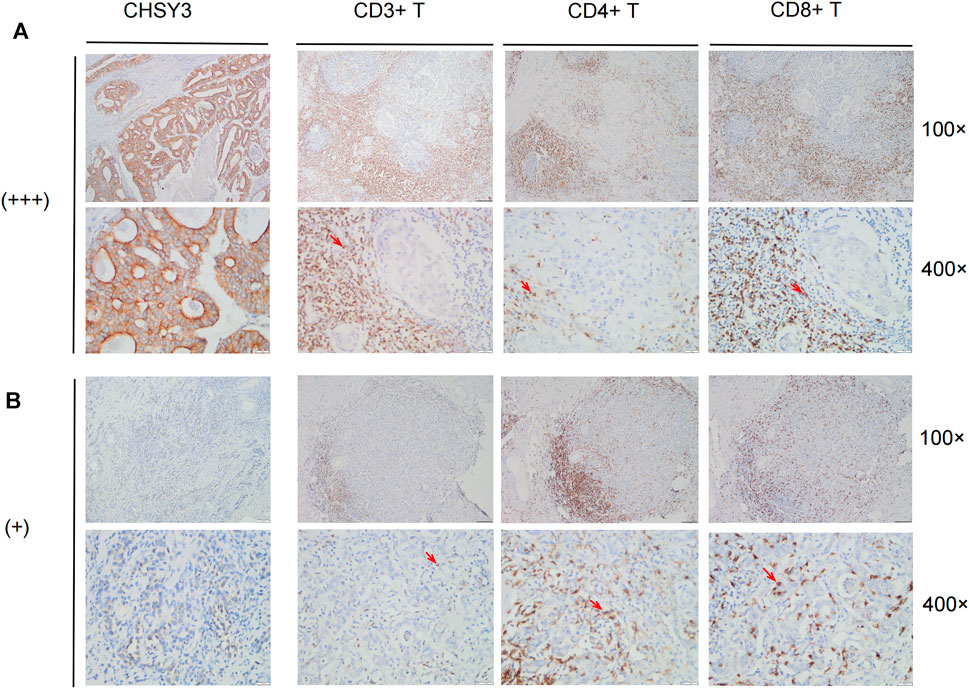
FIGURE 7. Immune cell infiltration in CHSY3 high and low expression groups. (A) Infiltation CD3+ T cells, CD4+ T cells and CD8+ T cells in CHSY3 high expression group (+++). (B) Infiltration of CD3+ T cells, CD4+ T cells and CD8+ T cells in CHSY3 low expression goup (+). Red arrow: immune cells location.
Discussion
Glycosylation is an important feature of tumours, and the occurrence and development of malignant tumours are often associated with abnormal glycosylation (Stowell et al., 2015). The chondroitin sulphate synthase family, an important enzyme-regulating glycosylation, is closely involved in cancer development (Pinho and Reis, 2015). CHSY1 overexpression in hepatocellular carcinoma promotes cancer cell growth, migration, invasion and EMT through the hedgehog signalling pathway (Liu et al., 2017). Tumorigenesis and choriocarcinoma metastasis were significantly inhibited by CHSY2 knockdown in choriocarcinoma (Zhang et al., 2021). However, only a few studies have focused on CHSY3 in cancer. To the best of our knowledge, we demonstrated for the first time that CHSY3 is overexpressed in STAD through TCGA database and immunohistochemical staining and Western blot experiments. The survival analysis indicated that a high CHSY3 expression was associated with a poor prognosis, and the multivariate Cox analysis indicated that CHSY3 could be an independent prognostic risk factor for STAD. The survival analysis of CHSY3-associated methylation sites in STAD also consistently demonstrated a poor prognosis. These findings suggest that CHSY3 can be used as a biomarker of poor prognosis in STAD.
Studies have demonstrated that altered glycosylation can modulate the inflammatory response, promote cancer cell metastasis, regulate apoptosis and contribute to tumour immune escape (RodrÍguez et al., 2018; Läubli and Borsig, 2019; Reily et al., 2019). Compared with normal cells, tumour cells have a different “glycosylation coating” (RodrÍguez et al., 2018). Since immune cells express different glycosylation-dependent lectin receptors, they can sense changes in glycosylation markers in their environment and respond accordingly, which may lead to immunosuppression (RodrÍguez et al., 2018). In this study, CHSY3 was found to up-regulate immune activation and mesenchymal signalling pathways in STAD, and our findings were further supported by analysis of the Hallmark pathway gene set and TIME evaluation using the ESTIMATE algorithm. The immune-evasion phenotype is generally characterised by the activation of mesenchymal signalling pathways, such as high TGF-β expression, myeloid inflammation and tumour neovascularisation (Fukumura et al., 2018; Metelli et al., 2018; Hegde and Chen, 2020). A high TGF-β expression suppresses the activity of CD8+ T-cells, dendritic cells, natural killer cells and other key immune cells in anti-tumour immunity in the TIME, while promoting the action of regulatory T-cells, thus making the entire TIME suppressive (Batlle and Massagué, 2019; Liu et al., 2020; Derynck et al., 2021). Therefore, given the high CHSY3 expression, the activation of the tumour mesenchyme inhibit numerous T-cells to infiltrate the tumour through the mesenchyme, resulting in an immune-evasion state. This is consistent with the poor prognostic results of our analysis. In addition, PD-L1 and TIDE immune assessment demonstrated that a high CHSY3 expression was associated with a significantly higher risk of immune evasion than low CHSY3 expression. Finally, we performed immunohistochemical staining of CD3+ T cells, CD4+ T cells, and CD8+ T cells in STAD tissue samples. We demonstrated that the tumour stroma in the high CHSY3 expression group had a large concentration of immune cells and few immune cells scattered in the parenchyma, while the tumour stroma in the low CHSY3 expression group had less concentration of immune cells and more infiltration of immune cells in the parenchyma. Overall, our study demonstrates that high CHSY3 expression mediates the immune-evasion status of the TIME in STAD.
ICs are divided into two main categories, namely, inhibitors and activators. ICI therapy represented by PD-1 and CTLA-4 inhibitors has undoubtedly caused a breakthrough in anti-tumour therapy (Topalian et al., 2016; Darvin et al., 2018; Kalbasi and Ribas, 2020). PD-1/CTLA4 are immune cell surface marker proteins, and tumour cells cause immune evasion by altering the functions of these proteins (Pardoll, 2012; Sun et al., 2018). In this study, we analysed immune cell surface marker proteins associated with CHSY3 expression and constructed Cox proportional regression models using prognosis-related marker genes. Accordingly, the survival of the high-risk group was significantly lower than that of the low-risk group, and the model risk score could be used as an independent prognostic risk score factor. TIDE scores also showed that the high-risk group had significantly higher immune-evasion ability than the low-risk group. This also demonstrated that CHSY3 affects the TIME of STAD leading to a poor prognosis.
In conclusion, CHSY3 can be used as a biomarker of poor STAD prognosis and mediates immune-evasion status in STAD.
Data Availability Statement
The original contributions presented in the study are included in the article/Supplementary Material, further inquiries can be directed to the corresponding authors.
Ethics Statement
The studies involving human participants were reviewed and approved by the Ethics Committee of the First Affiliated Hospital of Bengbu Medical College. The patients/participants provided their written informed consent to participate in this study.
Author Contributions
XL and YF designed and wrote the manuscript. XL and YZ completed the experiments. YW and MZ analysed the collected data. MT, HL, JM, and ZG were responsible for the literature search to improve the work and revise the manuscript. All authors reviewed the manuscript and approved its publication.
Funding
This study was supported by 512 Talent Cultivation Plan of Bengbu Medical College (grant numbers by 51201319, by 51201107) and Research and Innovation Team of Bengbu Medical College (grant no. BYKC201908, grant no. BYKC201909).
Conflict of Interest
The authors declare that the research was conducted in the absence of any commercial or financial relationships that could be construed as a potential conflict of interest.
Publisher’s Note
All claims expressed in this article are solely those of the authors and do not necessarily represent those of their affiliated organizations, or those of the publisher, the editors and the reviewers. Any product that may be evaluated in this article, or claim that may be made by its manufacturer, is not guaranteed or endorsed by the publisher.
Acknowledgments
We would like to express our sincere appreciation for the platforms and datasets from the open databases of TCGA, Sento Academic, Kaplan–Meier Plotter, MEXPRESS, SurvivalMeth, MSigDB and TIDE.
Abbreviations
EMT, epithelial–mesenchymal transition; ESTIMATE, Estimation of STromal and Immune cells in MAlignant Tumour tissues using Expression data; FP, first progression; GSEA, Gene Set Enrichment Analysis; GSVA, gene set variation analysis; OS, overall survival; PET-CT, positron emission computed tomography-computed tomography; PPS, post-progression survival; ssGSEA, single-sample gene set enrichment analysis; STAD, stomach adenocarcinoma; TCGA, The Cancer Genome Atlas; TGF-β, TGF-beta; TIDE, Tumor Immune Dysfunction and Exclusion; TIME, tumour immune microenvironment; AUC, Area Under Curve; ROC, receiver operating characteristic.
References
Ajani, J. A., D'Amico, T. A., Almhanna, K., Bentrem, D. J., Chao, J., Das, P., et al. (2016). Gastric Cancer, Version 3.2016, NCCN Clinical Practice Guidelines in Oncology. J. Natl. Compr. Canc Netw. 14 (10), 1286–1312. doi:10.6004/jnccn.2016.0137
Balachandran, V. P., Gonen, M., Smith, J. J., and DeMatteo, R. P. (2015). Nomograms in Oncology: More Than Meets the Eye. Lancet Oncol. 16 (4), e173–e180. doi:10.1016/s1470-2045(14)71116-7
Bartish, M., del Rincón, S. V., Rudd, C. E., and Saragovi, H. U. (2020). Aiming for the Sweet Spot: Glyco-Immune Checkpoints and γδ T Cells in Targeted Immunotherapy. Front. Immunol. 11, 564499. doi:10.3389/fimmu.2020.564499
Batlle, E., and Massagué, J. (2019). Transforming Growth Factor-β Signaling in Immunity and Cancer. Immunity 50 (4), 924–940. doi:10.1016/j.immuni.2019.03.024
Bray, F., Ferlay, J., Soerjomataram, I., Siegel, R. L., Torre, L. A., and Jemal, A. (2018). Global Cancer Statistics 2018: GLOBOCAN Estimates of Incidence and Mortality Worldwide for 36 Cancers in 185 Countries. CA: A Cancer J. Clinicians 68 (6), 394–424. doi:10.3322/caac.21492
Chen, D. S., and Mellman, I. (2017). Elements of Cancer Immunity and the Cancer-Immune Set point. Nature 541 (7637), 321–330. doi:10.1038/nature21349
Darvin, P., Toor, S. M., Sasidharan Nair, V., and Elkord, E. (2018). Immune Checkpoint Inhibitors: Recent Progress and Potential Biomarkers. Exp. Mol. Med. 50 (12), 1–11. doi:10.1038/s12276-018-0191-1
Derynck, R., Turley, S. J., and Akhurst, R. J. (2021). TGFβ Biology in Cancer Progression and Immunotherapy. Nat. Rev. Clin. Oncol. 18 (1), 9–34. doi:10.1038/s41571-020-0403-1
Ferlay, J., Shin, H.-R., Bray, F., Forman, D., Mathers, C., and Parkin, D. M. (2010). Estimates of Worldwide burden of Cancer in 2008: GLOBOCAN 2008. Int. J. Cancer 127 (12), 2893–2917. doi:10.1002/ijc.25516
Fukumura, D., Kloepper, J., Amoozgar, Z., Duda, D. G., and Jain, R. K. (2018). Enhancing Cancer Immunotherapy Using Antiangiogenics: Opportunities and Challenges. Nat. Rev. Clin. Oncol. 15 (5), 325–340. doi:10.1038/nrclinonc.2018.29
Hadden, J. W. (1993). Immunostimulants. Trends Pharmacol. Sci. 14 (5), 169–174. doi:10.1016/0165-6147(93)90203-v
Hänzelmann, S., Castelo, R., and Guinney, J. (2013). GSVA: Gene Set Variation Analysis for Microarray and RNA-Seq Data. BMC Bioinformatics 14, 7. doi:10.1186/1471-2105-14-7
Hegde, P. S., and Chen, D. S. (2020). Top 10 Challenges in Cancer Immunotherapy. Immunity 52 (1), 17–35. doi:10.1016/j.immuni.2019.12.011
Hengge, U., Benninghoff, B., Ruzicka, T., and Goos, M. (2001). Topical Immunomodulators-Progress towards Treating Inflammation, Infection, and Cancer. Lancet Infect. Dis. 1 (3), 189–198. doi:10.1016/s1473-3099(01)00095-0
Iasonos, A., Schrag, D., Raj, G. V., and Panageas, K. S. (2008). How to Build and Interpret a Nomogram for Cancer Prognosis. J. Clin. Oncol. 26 (8), 1364–1370. doi:10.1200/jco.2007.12.9791
Jiang, P., Gu, S., Pan, D., Fu, J., Sahu, A., Hu, X., et al. (2018). Signatures of T Cell Dysfunction and Exclusion Predict Cancer Immunotherapy Response. Nat. Med. 24 (10), 1550–1558. doi:10.1038/s41591-018-0136-1
Joshi, S. S., and Badgwell, B. D. (2021). Current Treatment and Recent Progress in Gastric Cancer. CA A. Cancer J. Clin. 71 (3), 264–279. doi:10.3322/caac.21657
Kalbasi, A., and Ribas, A. (2020). Tumour-intrinsic Resistance to Immune Checkpoint Blockade. Nat. Rev. Immunol. 20 (1), 25–39. doi:10.1038/s41577-019-0218-4
Läubli, H., and Borsig, L. (2019). Altered Cell Adhesion and Glycosylation Promote Cancer Immune Suppression and Metastasis. Front. Immunol. 10, 2120. doi:10.3389/fimmu.2019.02120
Liu, C.-H., Lan, C.-T., Chou, J.-F., Tseng, T.-J., and Liao, W.-C. (2017). CHSY1 Promotes Aggressive Phenotypes of Hepatocellular Carcinoma Cells via Activation of the Hedgehog Signaling Pathway. Cancer Lett. 403, 280–288. doi:10.1016/j.canlet.2017.06.023
Liu, M., Kuo, F., Capistrano, K. J., Kang, D., Nixon, B. G., Shi, W., et al. (2020). TGF-β Suppresses Type 2 Immunity to Cancer. Nature 587 (7832), 115–120. doi:10.1038/s41586-020-2836-1
Luo, G., Jin, K., Deng, S., Cheng, H., Fan, Z., Gong, Y., et al. (2021). Roles of CA19-9 in Pancreatic Cancer: Biomarker, Predictor and Promoter. Biochim. Biophys. Acta (Bba) - Rev. Cancer 1875 (2), 188409. doi:10.1016/j.bbcan.2020.188409
Metelli, A., Salem, M., Wallace, C. H., Wu, B. X., Li, A., Li, X., et al. (2018). Immunoregulatory Functions and the Therapeutic Implications of GARP-TGF-β in Inflammation and Cancer. J. Hematol. Oncol. 11 (1), 24. doi:10.1186/s13045-018-0570-z
Oliveira-Ferrer, L., Legler, K., and Milde-Langosch, K. (2017). Role of Protein Glycosylation in Cancer Metastasis. Semin. Cancer Biol. 44, 141–152. doi:10.1016/j.semcancer.2017.03.002
Pardoll, D. M. (2012). The Blockade of Immune Checkpoints in Cancer Immunotherapy. Nat. Rev. Cancer 12 (4), 252–264. doi:10.1038/nrc3239
Pinho, S. S., and Reis, C. A. (2015). Glycosylation in Cancer: Mechanisms and Clinical Implications. Nat. Rev. Cancer 15 (9), 540–555. doi:10.1038/nrc3982
Reily, C., Stewart, T. J., Renfrow, M. B., and Novak, J. (2019). Glycosylation in Health and Disease. Nat. Rev. Nephrol. 15 (6), 346–366. doi:10.1038/s41581-019-0129-4
RodrÍguez, E., Schetters, S. T. T., and van Kooyk, Y. (2018). The Tumour Glyco-Code as a Novel Immune Checkpoint for Immunotherapy. Nat. Rev. Immunol. 18 (3), 204–211. doi:10.1038/nri.2018.3
Schjoldager, K. T., Narimatsu, Y., Joshi, H. J., and Clausen, H. (2020). Global View of Human Protein Glycosylation Pathways and Functions. Nat. Rev. Mol. Cel Biol 21 (12), 729–749. doi:10.1038/s41580-020-00294-x
Silsirivanit, A. (2019). Glycosylation Markers in Cancer. Adv. Clin. Chem. 89, 189–213. doi:10.1016/bs.acc.2018.12.005
Smyth, E. C., Nilsson, M., Grabsch, H. I., van Grieken, N. C., and Lordick, F. (2020). Gastric Cancer. The Lancet 396 (10251), 635–648. doi:10.1016/s0140-6736(20)31288-5
Stowell, S. R., Ju, T., and Cummings, R. D. (2015). Protein Glycosylation in Cancer. Annu. Rev. Pathol. Mech. Dis. 10, 473–510. doi:10.1146/annurev-pathol-012414-040438
Subramanian, A., Tamayo, P., Mootha, V. K., Mukherjee, S., Ebert, B. L., Gillette, M. A., et al. (2005). Gene Set Enrichment Analysis: a Knowledge-Based Approach for Interpreting Genome-wide Expression Profiles. Proc. Natl. Acad. Sci. U.S.A. 102 (43), 15545–15550. doi:10.1073/pnas.0506580102
Sun, C., Mezzadra, R., and Schumacher, T. N. (2018). Regulation and Function of the PD-L1 Checkpoint. Immunity 48 (3), 434–452. doi:10.1016/j.immuni.2018.03.014
Thrift, A. P., and El-Serag, H. B. (2020). Burden of Gastric Cancer. Clin. Gastroenterol. Hepatol. 18 (3), 534–542. doi:10.1016/j.cgh.2019.07.045
Topalian, S. L., Taube, J. M., Anders, R. A., and Pardoll, D. M. (2016). Mechanism-driven Biomarkers to Guide Immune Checkpoint Blockade in Cancer Therapy. Nat. Rev. Cancer 16 (5), 275–287. doi:10.1038/nrc.2016.36
Wang, M., Zhu, J., Lubman, D. M., and Gao, C. (2019). Aberrant Glycosylation and Cancer Biomarker Discovery: a Promising and Thorny Journey. Clin. Chem. Lab. Med. 57 (4), 407–416. doi:10.1515/cclm-2018-0379
Yada, T., Sato, T., Kaseyama, H., Gotoh, M., Iwasaki, H., Kikuchi, N., et al. (2003). Chondroitin Sulfate Synthase-3. J. Biol. Chem. 278 (41), 39711–39725. doi:10.1074/jbc.m304421200
Keywords: CHSY3, biomarker, immune evasion, prognosis, immunotherapy, stomach adenocarcinoma
Citation: Li X, Fan Y, Zhang Y, Wang Y, Zhao M, Tang M, Li H, Mi J, Geng Z, Wang Z and Su F (2022) CHSY3 can be a Poor Prognostic Biomarker and Mediates Immune Evasion in Stomach Adenocarcinoma. Front. Genet. 13:876588. doi: 10.3389/fgene.2022.876588
Received: 15 February 2022; Accepted: 12 April 2022;
Published: 27 April 2022.
Edited by:
Chuan Lu, Aberystwyth University, United KingdomReviewed by:
Bashir Lawal, Taipei Medical University, TaiwanBaoguang Hu, Binzhou Medical University Hospital, China
Copyright © 2022 Li, Fan, Zhang, Wang, Zhao, Tang, Li, Mi, Geng, Wang and Su. This is an open-access article distributed under the terms of the Creative Commons Attribution License (CC BY). The use, distribution or reproduction in other forums is permitted, provided the original author(s) and the copyright owner(s) are credited and that the original publication in this journal is cited, in accordance with accepted academic practice. No use, distribution or reproduction is permitted which does not comply with these terms.
*Correspondence: Fang Su, sufang@bbmc.edu.cn; Zishu Wang, wangzishu@bbmc.edu.cn
†These authors have contributed equally to this work and share first authorship