 Bazgha Zia1
 Ainong Shi1*
 Dotun Olaoye1
 Haizheng Xiong1Waltram Ravelombola2
 Paul Gepts3Howard F. Schwartz4
 Mark A. Brick5Kristen Otto4Barry Ogg5
 Senyu Chen6*
- 1Department of Horticulture, University of Arkansas, Fayetteville, AR, United States
- 2Organic & Specialty Crop Breeding, Texas A&M AgriLife Research, Vernon, TX, United States
- 3Department of Plant Sciences/MS1, University of California, Davis, Davis, CA, United States
- 4Department of Agricultural Biology, Colorado State University, Fort Collins, CO, United States
- 5Department of Soil and Crop Sciences, Colorado State University, Fort Collins, CO, United States
- 6Department of Plant Pathology, University of Minnesota, Minneapolis, MN, United States
Common bean (Phaseolus vulgaris) is one of the major legume crops cultivated worldwide. Bacterial wilt (BW) of common bean (Curtobacterium flaccumfaciens pv. flaccumfaciens), being a seed-borne disease, has been a challenge in common bean producing regions. A genome-wide association study (GWAS) was conducted to identify SNP markers associated with BW resistance in the USDA common bean core collection. A total of 168 accessions were evaluated for resistance against three different isolates of BW. Our study identified a total of 14 single nucleotide polymorphism (SNP) markers associated with the resistance to BW isolates 528, 557, and 597 using mixed linear models (MLMs) in BLINK, FarmCPU, GAPIT, and TASSEL 5. These SNPs were located on chromosomes Phaseolus vulgaris [Pv]02, Pv04, Pv08, and Pv09 for isolate 528; Pv07, Pv10, and Pv11 for isolate 557; and Pv04, Pv08, and Pv10 for isolate 597. The genomic prediction accuracy was assessed by utilizing seven GP models with 1) all the 4,568 SNPs and 2) the 14 SNP markers. The overall prediction accuracy (PA) ranged from 0.30 to 0.56 for resistance against the three BW isolates. A total of 14 candidate genes were discovered for BW resistance located on chromosomes Pv02, Pv04, Pv07, Pv08, and Pv09. This study revealed vital information for developing genetic resistance against the BW pathogen in common bean. Accordingly, the identified SNP markers and candidate genes can be utilized in common bean molecular breeding programs to develop novel resistant cultivars.
Introduction
Common bean (Phaseolus vulgaris L.) is an important legume crop known for its edible seeds and pods worldwide (Allen 2013). It is an important source of protein for humans and livestock. Among legume crops, common bean is considered an outstanding source of nutrition and value in comparison to lentils (Ganesan and Xu 2017), fava beans (Juncus 1998), and chickpeas (Allen 2013). It is called the perfect food due to its content in protein (Guzmán-Maldonado et al., 2000), fiber (Hughes and Swanson 1989), and carbohydrates (Celmeli et al., 2018). It is mostly consumed as dry bean and green bean or snap bean in different parts of the world. On average, nearly 1.5 to 1.7 million acres of common bean is produced annually in the United States of America USDA-NASS Dry Beans (2022).
Common bean production has been affected by several seed-borne diseases (Sendi et al., 2020). Bacterial wilt (will be abbreviated as BW) of common bean caused by Curtobacterium flaccumfaciens pv. flaccumfaciens (Cff), affects production of common bean in a major way due to its seed-borne nature and is caused by various isolates of Cff (González et al., 2005). The pathogen is known to primarily cause disease in legume crops such as cowpea (Vigna unguiculata), common bean (Phaseolus vulgaris), mung bean (Vigna radiata), pea (Pisum sativum), and soybean (Glycine max) (Osdaghi et al., 2020). BW was first reported in South Dakota in 1926 (Hedges, 1926) and was later discovered in Mexico (Yerkes and Crispin, 1956), Canada (Hsieh et al., 2003), and in several other parts of the world. Due to its virulent nature and economic impact on legume crops, it is considered a high-risk pathogen that is subjected to quarantine regulations in Europe (CABI and Eppo, 1996).
The disease is transmitted via infected seeds (Hsieh et al., 2006). The Cff pathogen has five different isolates based on different color variants, that is, orange, yellow, purple, red, and pink (González et al., 2005). The infected seeds specifically turn to the color variant 3: making them yellow, orange, or purple as the infection proceeds. The disease symptoms include chlorotic areas on leaves with necrosis leading to a yellow halo progressing to irreversible plant wilt (Harveson et al., 2011). The leaf wilting is accompanied by hindrance of the normal water movement within the plant vascular system (Huang et al., 2009). The symptoms are worsened to tearing and shredding of leaves under unfavorable weather conditions. Young seedlings and plants are more susceptible to disease and prone to early mortality than mature plants (Hsieh et al., 2006; Osdaghi et al., 2020). The disease occurrence is primarily attributed to seed discoloration as a common symptom of BW in common bean (Hsieh et al., 2006). Mature seeds of infected plants are discolored and show yellow, orange, or purple seed coats (Harveson et al., 2011).
BW causes economic losses due to a substantial decrease in crop yield and marketability of the grain produced due to the visual appearance, size, shape, and color of the infected seeds (Huang et al., 2009). Crop rotation coupled with the use of pathogen-free seeds has been used to control the disease (Harveson et al., 2011). However, a cost-effective and reliable measure for disease management is to explore genetic resources to develop resistant cultivars (Assefa et al., 2019). Limited research has been conducted for BW management in common bean (Assefa et al., 2019). Early studies, based on a segregating population resulting from a cross between a resistant and susceptible genotype, identified the susceptibility to BW to be governed by two complimentary dominant genes. However the inheritance pattern for resistance was not clearly determined (Coyne et al., 1965). A more recent study identified a genotype showing some degree of resistance through inoculation tests, but it required substantial level of backcrossing to be acceptable for open cultivation in farmer’s fields (Urrea and Harveson 2014).
More recently, resistant cultivars such as the great northern bean “Resolute,” pinto bean “Agrinto,” pink bean “Early Rose” (Mündel et al., 2005), and an advanced black bean line L02F132 have been identified in Canada, which are resistant to three isolates of Cff (Mündel et al., 2005). The bean breeding program at Alberta has also evaluated the identified resistant lines for resistance against different diseases of common bean (Zienkiewicz., 2016). Limited research has been conducted in the United States, resulting in the development of a tolerant variety, namely, great northern cv. “Emerson” (Coyne et al., 1971) as the first cultivar, tolerant to three isolates of the BW pathogen, which was derived by pedigree selection between a BW resistant genotype and the great northern bean type. However, under hot dry field conditions, the symptoms of BW were again observed at early stages of plant growth for this tolerant cultivar (Coyne et al., 1971). Moreover, the resurgence of BW, specifically in Nebraska, suggests there is a need to conduct comprehensive studies to identify genetic resistance to this pathogen (Huang et al., 2009).
Evaluating the existing bean germplasm for the identification of resistance to BW is vital and a cost-efficient method of disease management. BW resistant bean cultivars can be a useful resource in worldwide common bean breeding programs. The identified new sources of resistance to Cff will enable breeders to develop reliably resistant cultivars for the future. The source of genetic resistance identified in common bean commercial cultivars can also be transferred to susceptible, elite cultivars through conventional breeding to enhance sources of resistance.
Molecular breeding in plants has played a vital role for crop improvement by expediting crop breeding through the use of molecular tools (Mammadov et al., 2012; Id, Id, and Mayer 2018). Major genes and alleles have been tagged to facilitate marker-assisted selection (MAS) (Heffner et al., 2009; Assefa et al., 2019; Larkin et al., 2019). Recently, genomic selection (GS) has emerged as a valuable tool for crop improvement through predictive breeding (Visscher et al., 2012; Chung et al., 2017; Keller et al., 2020). GS employs the use of genomic estimated breeding value (GEBV) to select individuals based on their performance and has been successfully employed in the breeding programs for crops such as soybean (Jarquin et al., 2016; Qin et al., 2019; Ravelombola et al., 2019; Wen et al., 2019), maize (Liu et al., 2019; Cui et al., 2020), rice (Spindel et al., 2015; Wang et al., 2020), and wheat (Larkin et al., 2019) targeting disease resistance (Heffner et al., 2009; Vallejo et al., 2017; Carpenter et al., 2018) and other important agronomic traits (Chung et al., 2017). Similarly, GS and GWAS have been deployed to study environmental stresses affecting important agronomic traits in common bean (López-Hernández and Cortés, 2019; Keller et al., 2020; Delfini et al., 2021). However, no published GWAS studies have been reported in common bean that specifically address resistance to BW.
Historically, SNP genetic maps have been constructed in common bean using 6K SNP BeadChips (Santos et al., 2003). The availability of several genome assemblies of common bean (e.g., Schmutz et al., 2014; Vlasova et al., 2016; Rendón-Anaya et al., 2017) has helped breeders conduct SNP studies for different traits allowing identification of candidate genes for important agronomic traits such as drought tolerance (Villordo-Pineda et al., 2015; Valdisser et al., 2020).
Hence, GWAS and GS serve as valuable tools for genetic improvement of important traits in crop species (Chung et al., 2017). The reduced cost of genotyping and improved methods of statistical analysis have increased the availability of valuable genetic information in large populations for complex traits (Visscher et al., 2012). Accordingly, this study primarily focuses on the evaluation of BW resistance in a publicly available USDA common bean core collection (Kuzay et al., 2020; Shi et al., 2021), using association mapping to identify SNP markers associated with BW resistance and conduct GS with the associated SNPs followed by candidate gene discovery.
Materials and Methods
Plant Materials
A subset of 168 accessions from the USDA common bean core collection was used in this study. Around 50% (85 accessions) of the total accessions were collected from Mexico. The remaining 83 accessions were collected from Guatemala (20), Colombia (18), Costa Rica (10), Nicaragua (10), Ecuador (9), El Salvador (5), Honduras (4), and Peru (7) (Supplementary Table S1).
Bacterial Wilt Isolates
Three isolates of BW were used to study resistance to the Cff pathogen in this study. The yellow (BW_528), orange (BW_557), and purple (BW_597) isolates of the BW pathogen were previously recovered and maintained from infected common beans in Nebraska (Harveson et al., 2011) or Colorado. The purple isolate was obtained from the collection of R. Harveson at the University of Nebraska (Harveson et al., 2011), and the other two isolates were obtained from the collection of H. Schwartz (Schwartz et al., 2009) at Colorado State University.
Phenotyping for Bacterial Wilt Resistance
The 168 common bean accessions were tested for the three isolates of BW. The experiment was conducted using the cotyledonary node inoculation method (Hsieh et al., 2003) by Howard F. Schwartz at Colorado State University and Mark A. Brick, Kristen Otto, and Barry Ogg at Colorado State University (Schwartz et al., 2010). The data set with disease scores is already published and available for public at the USDA GRIN website (https://www.ars-grin.gov/Pages/Collections).
In brief, 7–8 seeds were sown at a depth of 2.5 cm using 15 cm plastic pots with a standard potting mix. The seedlings were thinned to five plants upon emergence. The 7- to 10-day-old seedlings were inoculated with the respective isolate using a sterile needle. The inoculated seedlings were then incubated at a daily temperature of 28°C/22°C for 16 h per day and 8 h per night photoperiod in a greenhouse. A total of 9–12 plants per accession were used for evaluation for each isolate. In addition, ten plants for the resistant and susceptible controls were included for each BW isolate. The symptoms were evaluated 4 weeks post inoculations. Data were recorded as average severity for the replicated plants for each isolate. A 2-month cycle was used to evaluate the germplasm for each isolate individually.
A standard rating scale from 1 to 4 was used to evaluate the plants, with 1 as highly resistant demonstrating no wilt or discoloration, 2 being moderately resistant with wilt or discoloration at one of the unifoliolate leaves, 3 showing wilt or discoloration on both unifoliolate leaves but asymptomatic on the 1st trifoliolate leaf, and 4 as highly susceptible with wilt or discoloration on the 1st trifoliolate leaf (Schwartz et al., 2009).
Genotyping
The common bean core set was genotyped (Kuzay et al., 2020) using BARCBean6K_3 Infinium BeadChips (Song et al., 2013). A total of 4,568 SNPs were obtained from the BARCBean6K_3 Infinium BeadChips (https://datadryad.org/stash/dataset/doi:10.25338/B8KP45) for genotyping. SNP filtering was conducted with removal of SNPs; data missing rate >20%, heterogeneous >10%, and MAF (minor allele frequency) <5%.
Phenotypic Data Analysis and Estimation of Plant Distribution for Bacterial Wilt Isolates
The phenotypic data for the three BW isolates resistance was analyzed using ANOVA and GLM functions in JMP Genomics 7 (Cary 2008). The mean (X), variance (V), standard deviation (SD), and standard error (SE) were estimated using the “Tabulate” function in JMP Genomics 7 followed by the “Distribution” function to graphically present the phenotypic data for each of the BW isolates.
Estimation of Population Structure and Genetic Diversity
The principal component analysis (PCA) and genetic diversity were analyzed using GAPIT 3 (genomic association and prediction integrated tool version 3) by setting PCA = 2 to 10 and NJ tree = 2 to 10, and phylogenetic trees were drawn using the neighbor-joining (NJ) method (Lipka et al., 2012; Wang et al., 2021; https://github.com/jiabowang/GAPIT3).
Association Analysis
The phenotypic and genotypic data obtained for the 168 common bean core collection was subjected to genome-wide association mapping using the mixed linear model (MLM) methods in TASSEL 5 (Bradbury et al., 2007). The compressed mixed linear modeling (cMLM) in GAPIT (Lipka et al., 2012), FarmCPU (Liu et al., 2016), and Bayesian-information and Linkage-disequilibrium Iteratively Nested Keyway (BLINK) (Huang et al., 2019) were performed using the GAPIT 3 tool (Lipka et al., 2012; Wang et al., 2021; https://zzlab.net/GAPIT/index.html; https://github.com/jiabowang/GAPIT3). A threshold LOD [log10(p)] value >3.0 was used to select significant SNP markers associated with resistance to the BW_528, BW_557, and BW_597 isolates. Squared correlation coefficient (R2) was used to calculate the linkage disequilibrium (LD) between the markers.
Candidate Gene Prediction
The SNP regions were subjected to candidate gene discovery analysis for the identification of candidate genes spanning the 50 kb (50 kb on each side of SNP) regions around the significant SNPs. The Andean whole-genome reference sequence Pvulgaris 442_v2.1 available on the Phytozome website (https://phytozome.jgi.doe.gov/pz/portal.html) was used to retrieve the candidate genes from the reference annotation of the common bean genome.
Genomic Prediction for Genomic Selection of Bacterial Wilt Resistance
In addition to the identification of SNPs associated with BW resistance, the effect of these SNPs markers was also evaluated by using seven genomic prediction (GP) models. The ridge regression (RR); best linear unbiased prediction (BLUP) rrBLUP analysis; Bayesian models: Bayes A, Bayes B, Bayes ridge regression (BRR), and Bayes LASSO (BL); random forest (RF); and support vector machines (SVM) were deployed to assess GP (Table 3).
GP were carried out using the unbiased prediction in the rrBLUP (Wang J. et al., 2018) package to predict for GS utilizing the GEBV (Vallejo et al., 2017) with the R software version 3.5.0 (https://www.r-project.org). The Pearson correlation coefficient (r) was used to estimate the prediction accuracy (PA) using the GEBVs and observed values (Waldmann 2019) for the resistance to each of the three BW isolates. In addition, Bayesian models: Bayes A, Bayes B (Barili et al., 2018), Bayes ridge regression (BRR), and Bayes LASSO (BL) (Legarra et al., 2011); random forest (RF) (Ogutu et al., 2011); and support vector machines (SVM) (Maenhout et al., 2007) were deployed to assess the GP. Each combination of GP was run hundred times to estimate the GP statistical parameters, including variance (V), mean (X), standard deviation (SD), standard error (SE), and (r) values. Two approaches were used in combination with the seven prediction models 1) using all the 4,568 SNPs and 2) using the 14 selected SNP markers. The distribution plots were drawn using the R package ggplot2 and Microsoft Excel 2016.
Results
Phenotypic Data Analysis and Plant Distribution for Bacterial Wilt Isolates
The common bean core collection assessed for resistance to the three BW isolates showed a distribution of accessions from BW score 1 to 4 (where 1 is highest resistance and 4 is highest susceptible) skewed to resistance (Supplementary Table S1; Figure 1) to each of the three tested BW isolates, suggesting that BW resistant common bean accessions existed. Among the 168 common bean accessions inoculated with isolate BW_528, 31 accessions were resistant with a score of 1, while 9 accessions were susceptible with a score of 4. The distribution accessions for resistance to isolate BW_528 had a mean value (x) of 2.29, variance (V) of 1.027, standard deviation (SD) of 1.013, standard error (SE) of 0.078, and a coefficient of variance (CV) of 44.2% (Supplementary Table S2).
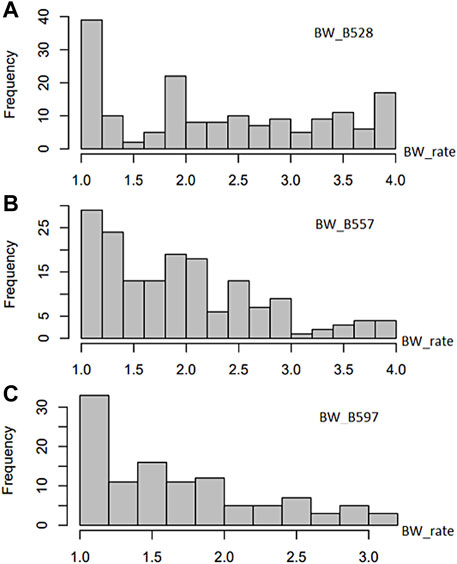
FIGURE 1. Distribution of bacterial wilt (BW) disease scale (0–4 rate) in 168 USDA common bean germplasm accessions.
The distribution of resistance scores after inoculation of 165 accessions with the BW_557 isolate was skewed toward the left side with score 1 of BW resistance (Figure 1). Seven accessions were rated as highly resistant to BW_557 with a score of 1, while three accessions were scored as 4. The ANOVA analysis indicated a mean of 1.94 and an SD of 0.756 (Supplementary Table S2). Similarly, the graph for BW_597 was also skewed toward the left side. Among the 111 tested common bean accessions, nine accessions were rated 1 for resistance and one common bean accession imparted the highest susceptibility with a score of 3.17 (Supplementary Table S1; Figure 1). Overall, the distribution had a mean of 1.70, a median of 1.58, and an SD of 0.6 (Supplementary Table S2).
Based on the phenotypic analysis, PI203958 may be a good candidate for resistance to all three BW isolates. PI310611 was resistant to two BW isolates (BW_528 and BW_557) (Supplementary Table S1). Similarly, PI207336, PI313429, PI313531, PI325685, and PI451889 were potential candidates for resistance to the BW_528 and BW_597 isolates (Supplementary Table S1).
Genetic Diversity and Population Structure
The three subpopulations (Q1, Q2, and Q3) were well-differentiated with red, green, and blue colors (Figure 2; Supplementary Figure S1) in 168 common bean accessions based on 4,568 high-quality SNPs analyzed by GAPIT 3. From a total of 121 genotypes 72% of the total population was accountable for the cluster 1 (Q1); 13% of the total genotypes comprises 22 genotypes that made up the second cluster (Q2), and the remaining 22 genotypes makes up 13% of the total population and the third cluster (Q3) (Figure 2; Supplementary Figure S1).
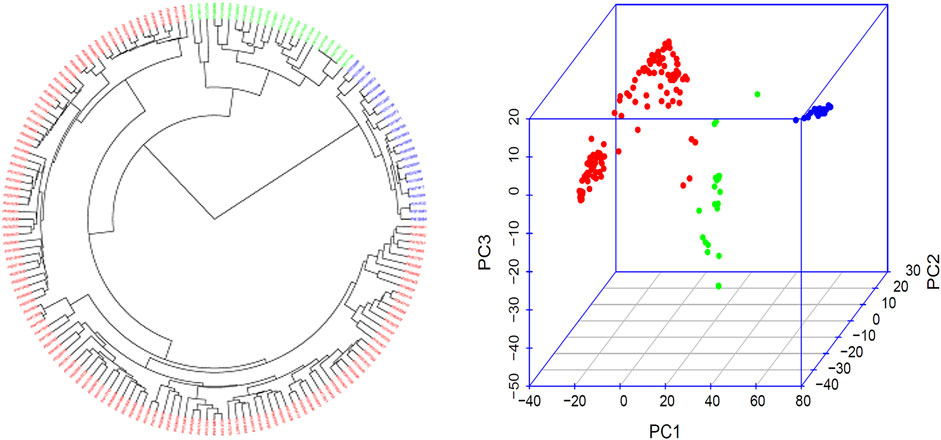
FIGURE 2. Population genetic diversity analysis in the association panel consisted of 168 USDA common bean germplasm accessions. Phylogenetic trees drawn by using the neighbor-joining (NJ) method in three subpopulation (left) and 3D graphical plot of the principal component analysis (PCA) (right) drawn by using GAPIT 3. A large phylogenetic tree of the three subpopulation for each of the 168 common bean accessions is shown in Supplementary Table S1.
Genetic Diversity of Bacterial Wilt Resistant Lines
Our analysis identified a total of 21 R-lines (Table 1). The identified R-lines for all the three BW type were assigned to Q1 and Q2 clusters. Among the 21 R lines, 17 R-lines originated from Mexico, two from Colombia, one from Costa Rica, and one from Guatemala (Table 1). Here again, PI203958 from the Q1 subpopulation proved to be a good candidate with resistance to all the three BW isolates (Table 1). Furthermore, the phylogenetic tree also depicted a similar trend (Figure 3).
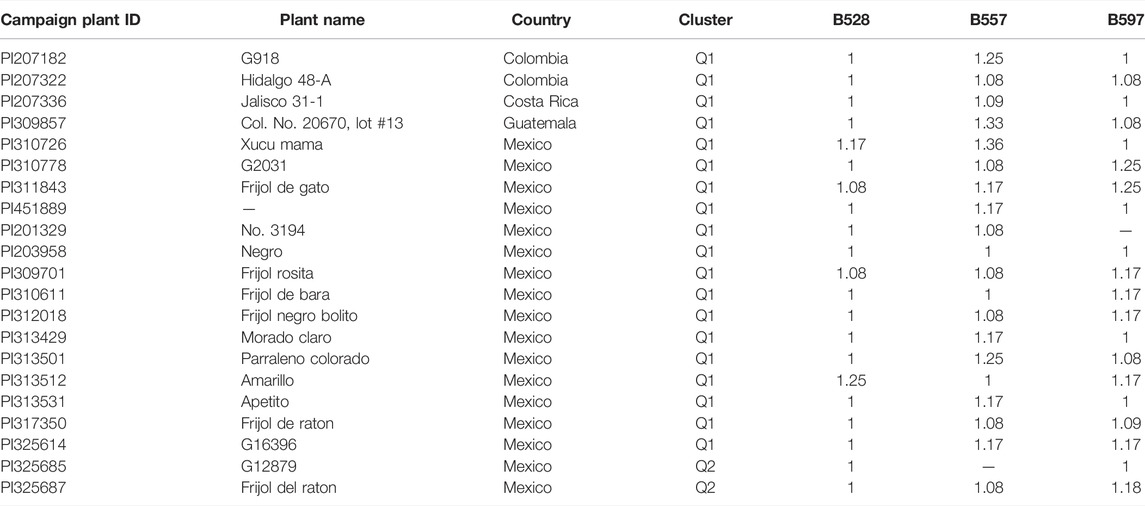
TABLE 1. List of 21 common bean accessions with resistance to three bacterial wilt (BW) isolates, B528, B557, and B597.
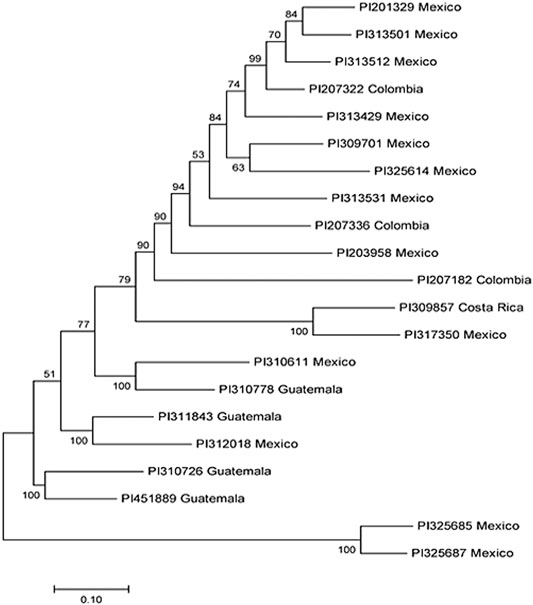
FIGURE 3. Phylogenetic tree among 21 common bean accessions of bacterial wilt resistance drawn using Mega 7. In the tree, the taxon name consists of the accession ID and the accession original country.
GWAS and SNP Marker Identification
Collectively, 14 SNPs were associated with resistance to BW_528, BW_557, and BW_597, respectively, based on the four MLM models in TASSEL 5, FarmCPU, GAPIT, and BLINK using the 4,568 SNPs (Table 2). The identified SNPs were associated with only single isolate, respectively, and not a SNP marker was simultaneously associated with all three isolates with an LOD value >3.0 for one or more of the four MLM models for resistance to all three isolates (Table 2). A total of 4,568 SNPs were used to conduct LD analysis. The LD decay started at around 137 kb (Supplementary Figure S2).
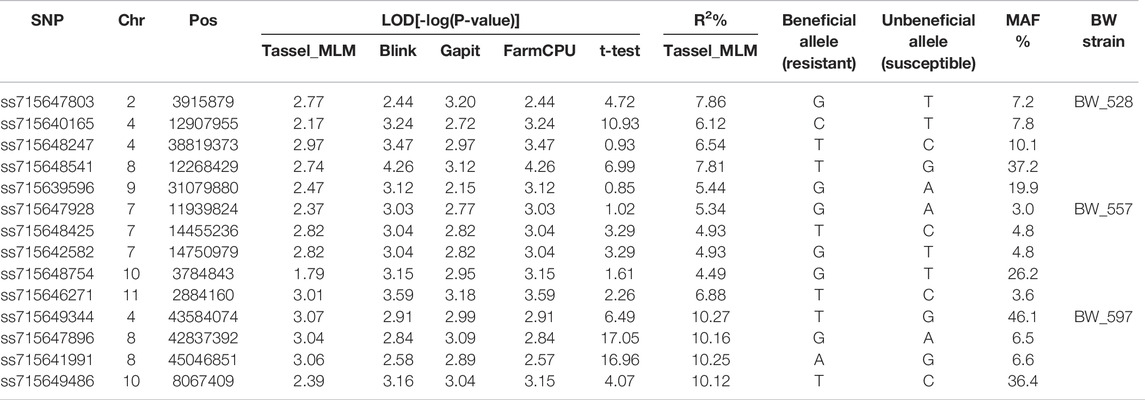
TABLE 2. List of the selected SNP markers associated with resistance to three bacterial wilt (BW) isolates B528, B557, and B598 in common bean core collection obtained from four MLM models in Tassel 5, BLINK, GAPIT, and FarmCPU and a t-test.
The t-tests for the 14 SNP markers are listed in Table 2, showing their allelic association with the phenotypes in each of the three BW isolates. Except ss715648247, ss715639596, and ss715647928, 11 markers had a LOD value >1.6, showing significant differences between two alleles of the 11 SNPs at a p-value at the 0.05 level (Table 2). Highly significant difference with a LOD >4.0 were observed at the three SNPs, ss715647803, ss715640165, and ss715648541, for BW_528 resistance and at the four SNPs, ss715649344, ss715647896, ss715641991, and ss715649486, for BW_597 resistance (Table 2), suggesting that the presence of beneficial alleles associated with BW resistance.
GWAS for Bacterial Wilt_528 Isolate Resistance
The GWAS panel for BW_528 was subjected to four MLM analyses in TASSEL 5; a QQ-plot distribution was obtained for the observed vs. expected LOD values. Based on MLM, the distribution of QQ-plot between the observed vs. expected LOD value showed divergence from the expected distribution (Supplementary Figure S3). A similar trend was observed for the MLM QQ-plot with GAPIT, FarmCPU, and BLINK (Supplementary Figure S3). The QQ-plots obtained from GAPIT, BLINK, and FarmCPU showed the beginning of divergence between the observed vs. expected values starting at LOD >2 (Supplementary Figure S3).
These findings indicate the presence of SNPs at LOD scores greater than two to be associated with resistance to the BW_528 isolates (Supplementary Figure S3).
The TASSEL analysis showed a Manhattan plot for the MLM model with only one significant SNP (ss715648247 on chromosome Pv (04) had LOD close to 3 (actual value of 2.97) and other four SNPs with LOD >2.0 on Pv02, Pv04, Pv08, and Pv09, respectively, indicating a weak association for resistance to the BW_528 (Supplementary Figure S3). On the other hand, the cMLM model in GAPIT showed a Manhattan plot with significant SNPs (LOD values >3) for resistance on Pv02 and Pv08 (Supplementary Figure S3). The Manhattan plot from BLINK also showed a similar trend with associated SNPs (LOD values >3) located on chromosomes Pv04, Pv08, and Pv09 (Supplementary Figure S3). Likewise, the Manhattan plot obtained from FarmCPU also showed similar results as BLINK with the associated SNPs located on chromosomes Pv02, Pv04, Pv08, and Pv09 (Table 2; Supplementary Figure S3).
The combined results from all the four models of MLM in GAPIT, MLM in FarmCPU, BLINK, and TASSEL showed a total of five SNPs associated with resistance to the BW_528 isolate (Table 2). The two SNPs, ss715640165 and ss715648247, were positioned at 12,907,955 and 38,819,373 bp, respectively, on Pv0 4 (Table 2), while another SNP, ss715647803, located on Pv02 was positioned at 3,915,879 bp. The SNP markers, ss715639596 and ss715648541, were positioned at 31,079,880 bp on Pv09 and 12,268,429 bp on Pv08, respectively (Table 2).
GWAS for Bacterial Wilt_557 Isolate Resistance
Based on MLM in TASSEL 5, the distribution of QQ-plot between the observed vs. expected LOD values showed divergence from the expected distribution. A similar trend was observed for the MLM QQ-plot obtained from the cMLM analysis from GAPIT and the MLM analysis from FarmCPU, and BLINK. The QQ-plots obtained from GAPIT, BLINK, and FarmCPU showed a larger divergence between the observed vs. expected values at LOD >2.5 (Supplementary Figure S4). This indicates the presence of SNPs at LOD >2.5 to be associated with resistance to the BW isolate 557 (Supplementary Figure S4).
The TASSEL analysis showed the Manhattan plot for the MLM model with SNPs associated with BW_550 resistance, being indicated as dots with LOD value greater than 3 to be located on chromosome Pv11 (Supplementary Figure S4). On the other hand, the MLM model resulted in a Manhattan plot with significant SNPs (LOD values >3) for resistance on Pv11 and Pv10 (Supplementary Figure S4). The Manhattan plot from BLINK also showed a similar trend with associated SNPs (LOD value >3) on Pv07, Pv10, and Pv11 (Supplementary Figure S4). The Manhattan plot obtained from FarmCPU showed similar results with the associated SNPs on Pv7, Pv10, and Pv11. However, no SNP was found to be associated with a LOD higher than 5.5 (Supplementary Figure S4).
The combined results from all the four models of MLM in GAPIT, FarmCPU, BLINK, and TASSEL showed a total of five SNPs associated with resistance to the BW_557 isolate. Three SNPs, ss715647928, ss715648425, and ss715642582, were located on chromosome Pv07 with the latter two located closely together on positions 14,455,236 and 14,750,979 bp, respectively (Table 2). The other two SNPs were located at position 3,784,843 bp on Pv10 and position 2,884,160 on Pv11, respectively (Table 2).
GWAS for Bacterial Wilt_597 Isolate Resistance
The MLM QQ-plot distribution between the observed vs. expected LOD, obtained using the MLM in TASSEL 5, showed divergence from the expected distribution. A similar trend was observed for the MLM QQ-plot obtained from the cMLM analysis in GAPIT, and the MLM analysis in FarmCPU and BLINK (Supplementary Figure S5). The QQ-plots obtained from GAPIT, BLINK, and FarmCPU showed the beginning of divergence between the observed vs. expected values at LOD >2 (Supplementary Figure S5). This indicates the presence of SNPs at LOD >2 associated with resistance to the BW_597 isolate (Supplementary Figure S5).
The TASSEL analysis showed the Manhattan plot for the MLM model with only one SNP associated with resistance to the BW_597 isolate (LOD >3) located on chromosomes Pv04 and Pv08 (Supplementary Figure S5). The MLM model showed the Manhattan plot indicating associated SNPs (LOD values >3) for resistance on Pv04, Pv08, and Pv10 (Supplementary Figure S5). The Manhattan plot obtained from BLINK showed associated SNPs with a LOD >3 located on Pv02 and Pv10 (Supplementary Figure S5). The Manhattan plot obtained from FarmCPU showed associated SNPs located on Pv04, Pv08, and Pv10 (Supplementary Figure S5).
The combined results from all the four models of MLM in GAPIT, FarmCPU, BLINK, and TASSEL showed a total of four SNPs associated with resistance in common bean for the BW_597 isolate (Table 2). The two SNPs, ss715647896 and ss715641991, were closely positioned at 42,837,392 and 45,046,851 on chromosome Pv08, respectively (Table 2), while other SNPs, ss715649344 and ss715649486, were located at position 43,584,074 on Pv04 and position 8,067,409 on Pv10, respectively (Table 2).
Candidate Genes for Bacterial Wilt Resistance
The candidate gene discovery was carried out for 50 kb genomic regions upstream and downstream of the identified significant SNPs for each isolate. A total of 14 gene models were discovered 50 kb upstream and downstream of the identified SNP region on chromosomes Pv02, Pv04, Pv07, Pv08, and Pv09 (Supplementary Table S3). A total of six genes (Phvul.002G041600, Phvul.004G076900, Phvul.004G119800, Phvul.008G107000, Phvul.009G210400, and Phvul.002G041000) were identified as candidate genes for resistance to the BW_528 isolate. Out of these six genes, five genes (Phvul.002G041600, Phvul.004G076900, Phvul.004G119800, Phvul.008G107000 and Phvul.009G210400) were located within the 50 kb region of the associated SNP (ss715647803, ss715640165, ss715648247, ss715648541, and ss715639596) region, while one gene model (Phvul.002G041000) included the SNP itself (Supplementary Table S3). These genes encoded the NAC domain–containing protein 87, XB3 ortholog 3, and duplicated homeodomain-like superfamily protein in Arabidopsis thaliana, while other identified gene models were unclassified (Supplementary Table S3).
Similarly, a total of four gene models, Phvul.007G104800, Phvul.007G112100, Phvul.007G112900, and Phvul.007G104500, were identified as candidate genes for resistance to the BW_557 isolate. Among these four gene models, three (Phvul.007G104800, Phvul.007G112100, and Phvul.007G112900) were located within the 50 kb distance of the identified SNPs (ss715647928, ss715648425, and ss715642582, respectively), while one gene model, Phvul.007G104500 include the identified SNP (ss715647928). The Phvul.007G112100 encoded a disease-associated Leucine-rich repeat protein kinase family protein positioned at 14,476,334 to 14,479,522 bp on chromosome Pv07 (Supplementary Table S3), while the other two gene models, Phvul.007G104800 and Phvul.007G104500, encoded a cytochrome P450, family 77, subfamily A, polypeptide 4, and chlorophyllase, respectively.
A total of four gene models, Phvul.004G154500, Phvul.008G166000, Phvul.004G154100, and Phvul.008G172000, were presumed candidate genes for BW_597 resistance (Supplementary Table S3). These genes encoded a protein kinase superfamily protein, flavonol synthase 1, nuclease-related domain (NERD), and thioesterase superfamily protein, respectively. Phvul.004G154500 and Phvul.004G154100 were located on chromosome Pv04 and included the ss715649344 SNP. The other two genes (Phvul.008G166000 and Phvul.008G172000) were located on chromosome Pv08, within the 50 kb region of ss715647896 and ss71564199 SNPs, respectively (Supplementary Table S3).
Genomic Prediction for Resistance to Bacterial Wilt Isolates
The use of all the seven models with aforementioned two approaches predicted the overall GA between the observed values and GEBV for the BW_528 isolate to fluctuate between 0.51 and 0.58 when 1) all the 4,568 SNPs were used and between 0.40 and 0.53 when 2) using the 14 selected SNPs. Similarly, the seven models resulted in a range of 0.37–0.46 when 1) all 4,568 SNPs were used for BW_557 in comparison to the reduced range of 0.30–0.44 when 2) using the selected 14 SNPs. A slightly higher range of average “r” value from 0.41 to 0.47 and 0.43 to 0.52 were observed for BW_597 when 1) all the 4,568 SNPs and 2) the 14 selected SNPs were used, respectively, in combination with the seven GP models (Table 3; Supplementary Figures S6, S7). The results were also verified to be similar through cross-validation across the seven GP models (Supplementary Figures S6, S7).
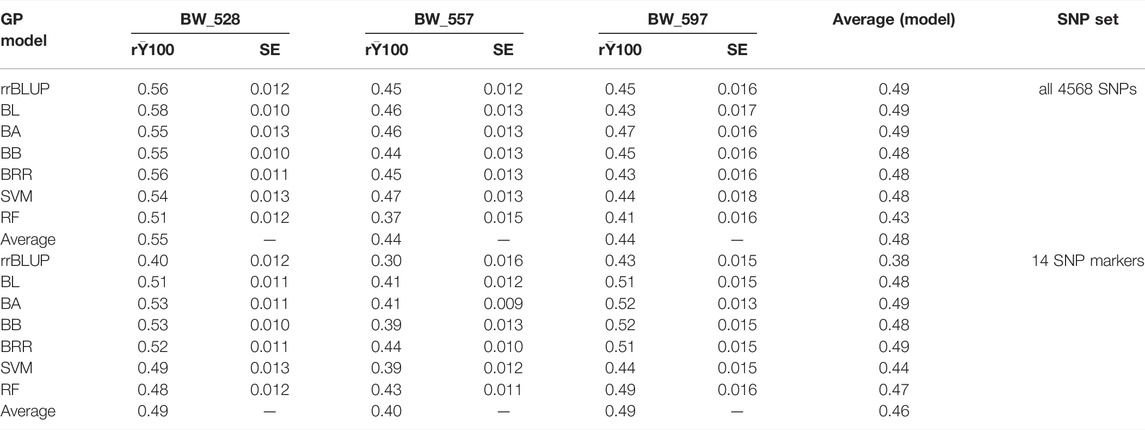
TABLE 3. Genomic prediction of seven models for resistance to three bacterial wilt (BW) isolates in two SNP sets: 1) all 4,568 SNPs and 2) 14 SNP markers.
The general trend of PA was higher when a greater number of SNPs (4,568 SNPs) was utilized in combination with the seven models in comparison to the use of 14 selected SNPs for BW_528 and BW_557. However, observing the PA for individual models, the RF model indicated slightly higher PA when 14 SNPs set was used for BW_557 resistance. Conversely, the PA followed a general trend of higher range for the average values of (r) and for each of the individual models when using a lower number of SNPs (14 selected SNPs) (Table 3).
Discussion
Genetic Diversity and Population Structure for the Common Bean Germplasm
The population structure and genetic diversity analyses in this study indicated the presence of three subpopulations (Q1, Q2, and Q3) among the tested germplasm as examined by the tool GAPIT 3 (Figure 2; Supplementary Table S1). Historically, Andean and Mesoamerican pools are reported as two centers for common bean origin (Bitocchi et al., 2013; Gepts et al., 1986; Kwak and Gepts 2009; Mamidi et al., 2013). Our study also confirmed the existence of two gene pools by consistent appearance of accessions from Mexico, Guatemala, Nicaragua, El Salvador, Costa Rica, Honduras, Colombia, Ecuador, and Peru in our two subpopulation clusters, Q1 and G2 (Supplementary Table S1, Figure 2). Hence, we can conclude that our tested germplasm is composed of diverse accessions and belong to the original two gene pools.
Genome Wide Association Study and SNP Marker Identification for Bacterial Wilt Resistance
The current study was focused on identifying SNP markers associated with resistance to the three isolates of BW in common beans. The phenotypic and genotypic data from the 168 accessions of the common bean core collection was subjected to the four MLM models in GAPIT, BLINK, FarmCPU, and TASSEL 5 to carry out GWAS analysis for each of the BW isolates. A total of 14 SNP markers were associated with resistance to the three different BW isolates, including five SNP markers for BW isolate 528, five SNP markers for BW isolate 557, and four SNP markers for BW isolate 597 (Table 2). These SNP markers were scattered on chromosomes Pv02, Pv04, Pv07, Pv08, Pv09, Pv10, and Pv11.
Genetic studies in BW studies have been primarily limited to other crops, such as extensive use of SSR (simple sequence repeat), AFLP (amplified fragment length polymorphism), and SCAR (sequence characterized amplified region) markers to map QTLs for BW resistance (Thoquet et al., 1996; Ashrafi et al., 2009; Wang et al., 2013) and generate a high-density genetic maps of inbred lines for BW resistance in tomato. The major QTLs were located on chromosomes 6 and 12 (Shin et al., 2020). Similarly, BW resistance has been explored using GWAS in peanut (Arachis hypogaea L.) with identification of four QTLs on chromosome 4 (Wang L. et al., 2018).
However, in common bean, studies have been limited to the use of genetic analysis for other diseases such as SCN. Jain et al. (2019) identified SCN resistance factors in common bean on chromosomes Pv04, Pv07, Pv09, and Pv11 based on the Pvulgaris v1.0_218 reference genome sequence (from Andean accession G19833) for various races (Jain et al., 2019). Likewise, our study also revealed that the resistance for BW for the three isolates is scattered on multiple chromosomes with the identification of SNPs on chromosomes Pv02, Pv04, Pv07, Pv08, Pv09, Pv010, and Pv011 (Table 2; Supplementary Figures S3–S5). Thus, our study is the first to report specifically the identification of SNPs associated with resistance to the BW isolates in common bean.
Similarly, a recent study was conducted to phenotype 467 accessions consisting of the NPGS core collection, 8 local, and 31 experimental lines from University of Nebraska for the orange BW isolate (Urrea and Harveson 2014). The results led to the identification of only one cultivar resistant to the tested BW isolate (Urrea and Harveson 2014). Likewise, our study has successfully led to the identification of potential SNPs for resistance to the BW isolates were identified, which can now be employed in marker-assisted selection to develop resistant cultivars. The identified SNPs for each BW isolate can be pyramided to develop a single cultivar with enhanced resistance to multiple isolates of BW.
Candidate Genes
Our results indicate the presence of a putative chlorophyllase encoded as the gene model Phvul.007G104500 in the SNP ss715647928 region (Supplementary Table S3). The ortholog of the chlorophyllase gene in Arabidopsis encoded by AtCLH1 is found to be induced following tissue damage by a bacterial necrotrophic pathogen (Kariola et al., 2005). The downregulation of AtCLH1 is linked to enhanced susceptibility to the necrotrophic pathogen, which showed its role as modulator of defense to various pathogens (Kariola et al., 2005). Our findings also suggest that the identified chlorophyllase gene can be a good candidate for resistance to BW_528. However, the Phvul.007G104800 gene model encoding the cytochrome P450, family 77, subfamily A, and polypeptide 4 protein was found to be located 50 kb upstream and downstream of SNP ss715647928 associated with resistance to the BW_557 isolate (Supplementary Table S3). The two genes near the ss715647928 SNP are suitable candidates for BW_528 resistance.
Similarly, the upstream and downstream regions of SNPs ss715648425 and ss715642582 also comprised gene models Phvul.007G112100 putatively encoding the leucine-rich repeat protein kinase family protein and an unclassified gene Phvul.007G112900, respectively (Supplementary Table S3).
Interestingly, the LRR domains have been explored as vital modulators of immunity in plant–pathogen interaction responses (Marone et al., 2013; Song et al., 2019). Song et al. (2019) reported a total of 348 NBS-LRR proteins and studied the loss of function characteristic of an LRR domain resulting in increased susceptibility to the BW pathogen in peanut (Arachis hypogea) (Song et al., 2019). Thus, the identified gene Phvul.007G112100 for BW_557 isolate in our study can also be explored further as a source of resistance to the Cff pathogen in common bean.
Moreover, our study identified two additional genes, Phvul.002G041000 and Phvul.004G154100, on chromosome Pv02 for BW_528 resistance associated with SNPs ss715647803 and ss715649344. The Phvul.002G041000 gene encodes a nuclease-related domain (NERD), associated with BW resistance to BW isolate 597 in common bean. Other reported genes (Supplementary Table S3) include the Arabidopsis NAC domain–containing protein 87, XB3 ortholog 3 in Arabidopsis, and duplicated homeodomain-like superfamily protein near the SNP regions for BW_528. The NAC genes play a vital role in plant immune responses by acting as regulators modulating the hypersensitive response and receptors of pathogen effectors in host plants. The identified SNP with the candidate gene Phvul.004G076900 encoding the Arabidopsis NAC gene can be studied further to develop a deeper understanding of the respective gene as a potential modulator of immunity for the BW pathogen in common bean.
However, the genes associated with resistance to BW_597 encoded putative protein kinase superfamily protein cytochrome P450, flavonol synthase 1, and thioesterase superfamily protein. These genes are associated with the mechanism of wilting in several plants. Reportedly, the cytochrome P450 is a major component of the underlying resistance molecular mechanism for verticillium wilt in cotton. The flavanol synthase 1 gene has been reported to be a constituent of the flavonoid pathway, which are important regulators of biotic and abiotic stresses as an integral component of hormone signaling pathways, such as in Arabidopsis (Owens et al., 2008). However, its role as a modulator of plant–pathogen interaction is not clear yet. On the other hand, the thioesterase superfamily protein has been studied as an enhancer of drought tolerance in tobacco (Zhang et al., 2012), which makes it a suitable candidate as the modulator of abiotic stress tolerance. However, our study reported a SNP encoding the thioesterase superfamily protein. Based on our results, more studies should be conducted to ascertain the putative role of the respective genes for the common bean–Cff interaction.
So far, no other studies have been reported for candidate gene discovery for BW resistance in common bean. Our study, on the other hand, has successfully identified the presence of putative candidate genes associated with the BW resistance in common bean.
Genomic Prediction for Genomic Selection
In this study, GP was conducted using two approaches: 1) by using all 4,568 SNPs and 2) by using the 14 selected SNPs, in combination with seven GP models 1) rrBLUP, 2) Bayes A, 3) Bayes B, 4) BL, 4) BRR, 5) RF, 6) SVM, and 7) BL for each of the three BW isolates.
The average (r) calculated for all the SNPs and the 14 SNPs (Table 3) indicated an overall lower value when the selected 14 SNPs were used (Table 3; Supplementary Figures S6, S7). However, exploring PA further using the entire seven models predicted slightly different trends for BW_557 and BW_597 in each of the two approaches. The BW_528 followed the similar trend of average (r) as obtained for the general PA. The BW_557 depicted slightly higher values of PA for the 14 SNPs set with the RF model (Table 3; Supplementary Figures S6, S7), deviating from the general trend previously obtained. In addition, the PA has been reported to be low with use of less number of SNPs (Ali et al., 2020). Using a SNP set of 2000 or more reportedly shows an r value of 0.85 in comparison to the r value of 0.80 when less SNPs (1000 SNPS) were used for a population for soybean accessions (Zhang et al., 2016). Likewise, our study also showed a similar trend for BW_528 and BW_557, suggesting that the use of a higher number of SNPs is more reliable for GP. On the other hand, BW_597 had a very different trend with a higher PA for the 14 selected SNPs set with the five models (Bayes A, Bayes B, BL, BRR, and RF) and with lower PA for the respective SNPs set for the rrBLUP and similar PA for the SVM model (Table 3; Supplementary Figures S6, S7). The different trends suggest that it might be more beneficial to perform GP using the 14 SNPs selected from the GWAS analysis for BW_597 rather than deploying the generic 4,568 SNPs, to estimate GP more accurately with the seven models for BW_597. Evidently, Qin et al. (2019) reported that the r values deviate from a higher range of 0.64–0.74 when GWAS-selected SNPs were deployed to carry out GP rather than using the randomly selected SNPs (Qin et al., 2019). Qin et al. (2019) also reported the average correlation coefficient (r) among the 15 amino acids to range from 0.18 to 0.61 when all the 23,279 SNPs were used for GP and 0.45 to 0.68 upon using 231 SNP markers, using the rrBLUP model (Qin et al., 2019). Accordingly, the trend for BW_597 in our study is justified and supports the use of 14 GWAS-derived SNPs in combination with the seven GP models to be more beneficial for genomic prediction rather than use of all the generic 4,568 SNPs (Table 3; Supplementary Figures S6, S7). The results confirmed the accuracy of using the predicted models accordingly, with similar results.
Moreover, GS, based on the estimation of PA through use of Pearson’s correlation coefficient (r) between the observed values and GEBV, has been employed to assess 481 common bean elite lines for resistance to environmental stress with reported prediction abilities between 0.6 and 0.8 for various traits (Keller et al., 2020). Several other studies have been reported for various biotic and abiotic stresses in common beans with genomic prediction (Barili et al., 2018; Jain et al., 2019; Shi et al., 2021), but no study has been reported to date for BW resistance in common bean utilizing genomic prediction. Significantly, here we report the use of genomic prediction for BW resistance in common bean, deploying seven prediction models under two SNP scenarios. The changes in the values of genomic prediction accuracies in our study indicate that the PA was affected by the SNP population size for our set of tested germplasm. Thus, our results indicate that the GS prediction can be effectively used in combination with MAS to breed for BW resistance in common bean.
Conclusion
Our study successfully tested 168 common bean accessions from the USDA NPGS based on public phenotypic resistance data for genome-wide association study (GWAS) and genomic prediction (GP). A total of 14 SNPs, on chromosome Pv02, Pv04, Pv07, Pv08, Pv09, Pv010, and Pv011 with 14 candidate genes, and 21 lines with potential resistance to the BW_528, BW_557, and BW_597 types were identified as a result of this study. The different SNPs and candidate genes identified for each isolate can be pyramided to enhance resistance to multiple isolates of BW. Moreover, the identified SNPs and candidate genes can be further explored and employed using genome editing and breeding techniques to develop common bean cultivars with enhanced resistance to the three BW isolates.
Data Availability Statement
The original contributions presented in the study are included in the article/Supplementary Material, further inquiries can be directed to the corresponding authors.
Author Contributions
SC, PG, and AS are the principal investigators (PI) for the study on common bean. BZ wrote the draft of the manuscript. HS, MB, KO, and BO performed phenotyping of BW resistance in common bean accessions. AS performed data analysis. PG performed genotypic data collection using the SNP chip. DO, WR, and HX assisted in the study. All authors have edited, reviewed, and approved the manuscript.
Funding
This research was supported by the USDA Germplasm Evaluation grant with Agreement Number/FAIN: 58-2090-8-053 and Project No. 2090-21000-032-11S; Accession No. 43498 and USDA NIFA Hatch project ARK0VG2018 and ARK02440.
Conflict of Interest
The authors declare that the research was conducted in the absence of any commercial or financial relationships that could be construed as a potential conflict of interest.
Publisher’s Note
All claims expressed in this article are solely those of the authors and do not necessarily represent those of their affiliated organizations, or those of the publisher, the editors, and the reviewers. Any product that may be evaluated in this article, or claim that may be made by its manufacturer, is not guaranteed or endorsed by the publisher.
Supplementary Material
The Supplementary Material for this article can be found online at: https://www.frontiersin.org/articles/10.3389/fgene.2022.853114/full#supplementary-material
Data Sheet 1 | Supplementary Figures
Data Sheet 2 | Supplementary Tables
References
Ali, M., Zhang, Y., Rasheed, A., Wang, J., and Zhang, L. (2020). Genomic Prediction for Grain Yield and Yield-Related Traits in Chinese winter Wheat. Int. J. Mol. Sci. 21 (4), 1342. doi:10.3390/ijms21041342
Allen, L. H. (2013). “Legumes,” in Caballero BBT-E of HN. Third E (Waltham: Academic Press), 74–79. doi:10.1016/B978-0-12-375083-9.00170-7
Ashrafi, H., Kinkade, M., and Foolad, M. R. (2009). A New Genetic Linkage Map of Tomato Based on aSolanum Lycopersicum ×S. pimpinellifoliumRIL Population Displaying Locations of Candidate Pathogen Response Genes. Genome 52 (11), 935–956. doi:10.1139/G09-065
Assefa, T., Assibi Mahama, A., Brown, A. V., Cannon, E. K. S., Rubyogo, J. C., Rao, I. M., et al. (2019). A Review of Breeding Objectives, Genomic Resources, and Marker-Assisted Methods in Common Bean (Phaseolus vulgaris L.). Mol. Breed. 39 (2). doi:10.1007/s11032-018-0920-0
Barili, L. D., Vale, N. M. d., Silva, F. F. e., Carneiro, J. E. d. S., Oliveira, H. R. d., Vianello, R. P., et al. (2018). Genome Prediction Accuracy of Common Bean via Bayesian Models. Cienc. Rural 48 (8), 1–6. doi:10.1590/0103-8478cr20170497
Bitocchi, E., Bellucci, E., Giardini, A., Rau, D., Rodriguez, M., Biagetti, E., et al. (2013). Molecular Analysis of the Parallel Domestication of the Common Bean (Phaseolus vulgaris) in Mesoamerica and the Andes. New Phytol. 197 (1), 300–313. doi:10.1111/j.1469-8137.2012.04377.x
Bradbury, P. J., Zhang, Z., Kroon, D. E., Casstevens, T. M., Ramdoss, Y., and Buckler, E. S. (2007). TASSEL: Software for Association Mapping of Complex Traits in Diverse Samples. Bioinformatics 23 (19), 2633–2635. doi:10.1093/bioinformatics/btm308
Carpenter, M. A., Goulden, D. S., Woods, C. J., Thomson, S. J., Kenel, F., Frew, T. J., et al. (2018). Genomic Selection for Ascochyta Blight Resistance in Pea. Front. Plant Sci. 9, 1878. doi:10.3389/fpls.2018.01878
Celmeli, T., Sari, H., Canci, H., Sari, D., Adak, A., Eker, T., et al. (2018). The Nutritional Content of Common Bean (Phaseolus Vulgaris l.) Landraces in Comparison to Modern Varieties. Agronomy 8 (9), 166. doi:10.3390/agronomy8090166
Chung, Y. S., Choi, S. C., Jun, T.-H., and Kim, C. (2017). Genotyping-by-sequencing: a Promising Tool for Plant Genetics Research and Breeding. Hortic. Environ. Biotechnol. 58 (5), 425–431. doi:10.1007/s13580-017-0297-8
Coyne, D. P., Schuster, M. L., and 'Emerson', (1971). The New Large-Seeded Great Northern Dry Bean Variety Tolerant to Bacterial Wilt Disease. Publ. Univ. Nebr. Agric. Exp. Station 516, 11.
Coyne, D. P., Schuster, M. L., and Young, J. O. (1965). A Genetic Study of Bacterial Wilt (Corynebacterium Flaccumfaciens Var. Aurantiacum) Tolerance in Phaseolus vulgaris Crosses in Field Beans. Proc. Am. Soc. Hortic. Sci. 87, 279–285.
Cui, Z., Dong, H., Zhang, A., Ruan, Y., He, Y., and Zhang, Z. (2020). Assessment of the Potential for Genomic Selection to Improve Husk Traits in maize. G3: Genes, Genomes, Genet. 10 (10), 3741–3749. doi:10.1534/g3.120.401600
Delfini, J., Moda-Cirino, V., dos Santos Neto, J., Ruas, P. M., Sant’Ana, G. C., Gepts, P., et al. (2021). Population Structure, Genetic Diversity and Genomic Selection Signatures Among a Brazilian Common Bean Germplasm. Sci. Rep. 11 (1), 1–12. doi:10.1038/s41598-021-82437-4
Ganesan, K., and Xu, B. (2017). Polyphenol-rich Lentils and Their Health Promoting Effects. Ijms 18 (11), 2390. doi:10.3390/ijms18112390
González, A. J., Tello, J. C., and Rodicio, M. R. (2005). Bacterial Wilt of Beans (Phaseolus vulgaris) Caused by Curtobacterium Flaccumfaciens in Southeastern Spain. Plant Dis. 89 (12), 1361. doi:10.1094/PD-89-1361C
Guzmán-Maldonado, S. H., Acosta-Gallegos, J., and Paredes-López, O. (2000). Protein and mineral Content of a Novel Collection of Wild and Weedy Common Bean (Phaseolus vulgaris L). J. Sci. Food Agric. 80 (13), 1874–1881. doi:10.1002/1097-0010
Harveson, R. M., Urrea, C. A., and Schwartz, H. F. (2011). Bacterial Wilt of Dry Beans in Western Nebraska. NebGuide. 9. 10.1094/PDIS-03-15-0299-FE
Hedges, F. (1926). Bacterial Wilt of Beans (Bacterium Flaccumfaciens Hedges), Including Comparisons with Bacterium Phaseoli. Phytopathology 16 (1), 1–22.
Heffner, E. L., Sorrells, M. E., and Jannink, J.-L. (2009). Genomic Selection for Crop Improvement. Crop Sci. 49 (1), 1–12. doi:10.2135/cropsci2008.08.0512
Hsieh, T., Huang, H., Mündel, H., Scott, R., Canada, A., and Box, P. O. (2003). A Rapid Indoor Technique for Screening Common Bean (Phaseolus vulgaris L.) for Resistance to Bacterial Wilt [Curtobacterium Flaccumfaciens Pv. Flaccumfaciens (Hedges) Collins and Jones]. Revista Mexicana de Fitopatología. 21 (3), 364–369.
Hsieh, T.-F., Huang, H. C., and Erickson, R. S. (2006). Bacterial Wilt of Common Bean: Effect of Seedborne Inoculum on Disease Incidence and Seedling Vigour. Seed Sci. Technol. 34 (1), 57–67. doi:10.15258/sst.2006.34.1.07
Huang, H. C., Erickson, R. S., Balasubramanian, P. M., Hsieh, T. F., and Conner, R. L. (2009). Resurgence of Bacterial Wilt of Common Bean in North America. Can. J. Plant Pathol. 31 (3), 290–300. doi:10.1080/07060660909507603
Huang, M., Liu, X., Zhou, Y., Summers, R. M., and Zhang, Z. (2019). BLINK: a Package for the Next Level of Genome-wide Association Studies with Both Individuals and Markers in the Millions. GigaScience 8 (2). doi:10.1093/gigascience/giy154
Hughes, J. S., and Swanson, B. G. (1989). Soluble and Insoluble Dietary Fiber in Cooked Common Bean (Phaseolus Vulgaris) Seeds. Food Microstructure 8 (1), 15–21.
Jain, S., Poromarto, S., Osorno, J. M., McClean, P. E., and Nelson, B. D. (2019). Genome Wide Association Study Discovers Genomic Regions Involved in Resistance to Soybean Cyst Nematode (Heterodera glycines) in Common Bean. PLoS ONE 14 (2), e0212140–17. doi:10.1371/journal.pone.0212140
Jarquin, D., Specht, J., and Lorenz, A. (2016). Prospects of Genomic Prediction in the USDA Soybean Germplasm Collection: Historical Data Creates Robust Models for Enhancing Selection of Accessions. G3: Genes, Genomes, Genet. 6 (8), 2329–2341. doi:10.1534/g3.116.031443
Kariola, T., Brader, G., Li, J., and Palva, E. T. (2005). Chlorophyllase 1, a Damage Control Enzyme, Affects the Balance between Defense Pathways in Plants. Plant Cell 17 (1), 282–294. doi:10.1105/tpc.104.025817
Keller, B., Ariza-Suarez, D., de la Hoz, J., Aparicio, J. S., Portilla-Benavides, A. E., Buendia, H. F., et al. (2020). Genomic Prediction of Agronomic Traits in Common Bean (Phaseolus vulgaris L.) under Environmental Stress. Front. Plant Sci. 11, 1–15. doi:10.3389/fpls.2020.01001
Kuzay, S., Hamilton-Conaty, P., Palkovic, A., and Gepts, P. (2020). Is the USDA Core Collection of Common Bean Representative of Genetic Diversity of the Species, as Assessed by SNP Diversity? Crop Sci. 60, 1398–1414. doi:10.1002/csc2.20032
Larkin, D. L., Lozada, D. N., and Mason, R. E. (2019). Genomic Selection-Considerations for Successful Implementation in Wheat Breeding Programs. Agronomy 9 (9), 479. doi:10.3390/agronomy9090479
Legarra, A., Robert-granié, C., Croiseau, P., Guillaume, F., and Fritz, S. (2011). Improved Lasso for Genomic Selection. Genet. Res. 93 (1), 77–87. doi:10.1017/S0016672310000534
Lipka, A. E., Tian, F., Wang, Q., Peiffer, J., Li, M., Bradbury, P. J., et al. (2012). GAPIT: Genome Association and Prediction Integrated Tool. Bioinformatics (Oxford, England) 28 (18), 2397–2399. doi:10.1093/bioinformatics/bts444
Liu, X., Huang, M., Fan, B., Buckler, E. S., and Zhang, Z. (2016). Iterative Usage of Fixed and Random Effect Models for Powerful and Efficient Genome-wide Association Studies. Plos Genet. 12 (2), e1005767. doi:10.1371/journal.pgen.1005767
Liu, X., Wang, H., Hu, X., Li, K., Liu, Z., Wu, Y., et al. (2019). Improving Genomic Selection with Quantitative Trait Loci and Nonadditive Effects Revealed by Empirical Evidence in maize. Front. Plant Sci. 10 (10), 1129. doi:10.3389/fpls.2019.01129
López-Hernández, F., and Cortés, A. J. (2019). Last-Generation Genome-Environment Associations Reveal the Genetic Basis of Heat Tolerance in Common Bean (Phaseolus vulgaris L). Front. Genet. 10, 954. doi:10.3389/fgene.2019.00954
Maenhout, S., De Baets, B., Haesaert, G., and Van Bockstaele, E. (2007). Support Vector Machine Regression for the Prediction of maize Hybrid Performance. Theor. Appl. Genet. 115 (7), 1003–1013. doi:10.1007/s00122-007-0627-9
Mamidi, S., Rossi, M., Moghaddam, S. M., Annam, D., Lee, R., Papa, R., et al. (2013). Demographic Factors Shaped Diversity in the Two Gene Pools of Wild Common Bean Phaseolus vulgaris L. Heredity 110 (3), 267–276. doi:10.1038/hdy.2012.82
Mammadov, J., Aggarwal, R., Buyyarapu, R., and Kumpatla, S. (2012). SNP Markers and Their Impact on Plant Breeding. Int. J. Plant Genomics 2012, 1–11. doi:10.1155/2012/728398
Marone, D., Russo, M., Laidò, G., De Leonardis, A., and Mastrangelo, A. (2013). Plant Nucleotide Binding Site-Leucine-Rich Repeat (NBS-LRR) Genes: Active Guardians in Host Defense Responses. Ijms 14 (4), 7302–7326. doi:10.3390/ijms14047302
Messerer, M., Lang, D., and Mayer, K. (2018). Analysis of Stress Resistance Using Next Generation Techniques. Agronomy 8 (8), 130. doi:10.3390/agronomy8080130
Mündel, H.-H., Kiehn, F. A., Huang, H. C., Conner, R. L., and Saindon, G. (2005). Resolute Great Northern Bean. Can. J. Plant Sci. 85 (2), 393–395. doi:10.4141/P04-109
Ogutu, J. O., Piepho, H.-P., and Schulz-Streeck, T. (2011). A Comparison of Random Forests, Boosting and Support Vector Machines for Genomic Selection. BMC Proc. 5 (Suppl. 3), S11. doi:10.1186/1753-6561-5-S3-S11
Osdaghi, E., Young, A. J., and Harveson, R. M. (2020). Bacterial Wilt of Dry Beans Caused by Curtobacterium Flaccumfaciens Pv. Flaccumfaciens : A New Threat from an Old Enemy. Mol. Plant Pathol. 21 (5), 605–621. doi:10.1111/mpp.12926
Owens, D. K., Alerding, A. B., Crosby, K. C., Bandara, A. B., Westwood, J. H., and Winkel, B. S. J. (2008). Functional Analysis of a Predicted Flavonol Synthase Gene Family in Arabidopsis. Plant Physiol. 147 (3), 1046–1061. doi:10.1104/pp.108.117457
Qin, J., Shi, A., Song, Q., Li, S., Wang, F., Cao, Y., et al. (2019). Genome Wide Association Study and Genomic Selection of Amino Acid Concentrations in Soybean Seeds. Front. Plant Sci. 10, 1445. doi:10.3389/fpls.2019.01445
Ravelombola, W., Qin, J., Shi, A., Nice, L., Bao, Y., Lorenz, A., et al. (2019). Genome-Wide Association Study and Genomic Selection for Soybean Chlorophyll Content Associated With Soybean Cyst Nematode. BMC Genom. 20, 904. doi:10.1186/s12864-019-6275-z
Rendón-Anaya, M., Montero-Vargas, J. M., Saburido-Alvarez, S., Vlasova, A., Capella-Gutiérrez, S., Ordaz-Ortiz, J. J., et al. (2017) Genomic History of the Origin and Domestications of Common Bean in the Americas Unveils its Closest Sister Species. Genome Biol. 18, 60. doi:10.1186/s13059-017-1190-6
Rice, B., and Lipka, A. E. (2019). Evaluation of RR‐BLUP Genomic Selection Models that Incorporate Peak Genome‐Wide Association Study Signals in Maize and Sorghum. Plant Genome 12 (1), 180052. doi:10.3835/plantgenome2018.07.0052
Santos, A. S., Bressan-Smith, R. E., Pereira, M. G., Rodrigues, R., and Ferreira, C. F. (2003). Genetic Linkage Map of Phaseolus vulgaris and Identification of QTLs Responsible for Resistance to Xanthomonas Axonopodis Pv. Phaseoli. Fitopatol. Bras. 28 (1), 5–10. doi:10.1590/s0100-41582003000100001
Schmutz, J., McClean, P. E., Mamidi, S., Wu, G. A., Cannon, S. B., Grimwood, J., et al. (2014). A Reference Genome for Common Bean and Genome-wide Analysis of Dual Domestications. Nat. Genet. 46 (7), 707–713. doi:10.1038/ng.3008
Schwartz, H. F., Otto, K., Brick, M. A., and Ogg, J. B. (2009). Resistance to Bacterial Wilt in the Phaseolus Core Collection. Ann. Rept. Bean Improv. Coop. 52, 68–69.
Schwartz, H. F., Brick, M. A., Otto, K., and Ogg, J. B. (2010). Germplasm Evaluation for Resistance to Bacterial Wilt in Common Bean, 2008-2009. APS Plant Dis. Manage. Rep. 4V125, 2.
Sendi, Y., Pfeiffer, T., Koch, E., Mhadhbi, H., and Mrabet, M. (2020). Potential of Common Bean (Phaseolus vulgaris L.) Root Microbiome in the Biocontrol of Root Rot Disease and Traits of Performance. J. Plant Dis. Prot. 127 (4), 453–462. doi:10.1007/s41348-020-00338-6
Shi, A., Gepts, P., Song, Q., Xiong, H., Michaels, T.E., and Chen, S. (2021). Genome-Wide Association Study and Genomic Selection for Soybean Cyst Nematode Resistance in USDA Common Bean (Phaseolus vulgaris) Core Collection. Front. Plant Sci. doi:10.3389/fpls.2021.624156/full
Shin, I. S., Hsu, J.-C., Huang, S.-M., Chen, J.-R., Wang, J.-F., Hanson, P., et al. (2020). Construction of a Single Nucleotide Polymorphism Marker Based QTL Map and Validation of Resistance Loci to Bacterial Wilt Caused by Ralstonia Solanacearum Species Complex in Tomato. Euphytica 216 (3), 1–20. doi:10.1007/s10681-020-2576-1
Song, H., Guo, Z., Hu, X., Qian, L., Miao, F., Zhang, X., et al. (2019). Evolutionary Balance between LRR Domain Loss and Young NBS-LRR Genes Production Governs Disease Resistance in Arachis hypogaea Cv. Tifrunner. BMC Genomics 20 (1), 844. doi:10.1186/s12864-019-6212-1
Song, Q., Hyten, D. L., Jia, G., Quigley, C. V., Fickus, E. W., Nelson, R. L., et al. (2013). Development and Evaluation of SoySNP50K, a High-Density Genotyping Array for Soybean. PloS one 8 (1), e54985. doi:10.1371/journal.pone.0054985
Spindel, J., Begum, H., Akdemir, D., Virk, P., Collard, B., Redoña, E., et al. (2015). Genomic Selection and Association Mapping in Rice (Oryza Sativa): Effect of Trait Genetic Architecture, Training Population Composition, Marker Number and Statistical Model on Accuracy of Rice Genomic Selection in Elite, Tropical Rice Breeding Lines. Plos Genet. 11 (2), e1004982. doi:10.1371/journal.pgen.1004982
Thoquet, P., Sperisen, O. C., and Rogowsky, P. (1996). Polygenic Resistance of Tomato Plants to Bacterial Wilt in the French West Indies. Mpmi 9 (9), 837–842. doi:10.1094/mpmi-9-0837
Urrea, C. A., and Harveson, R. M. (2014). Identification of Sources of Bacterial Wilt Resistance in Common Bean (Phaseolus vulgaris). Plant Dis. 98 (7), 973–976. doi:10.1094/PDIS-04-13-0391-RE
USDA-NASS Dry Beans (2022). Planted Acreage by Year, US and Major States. Available at: https://www.nass.usda.gov/Charts_and_Maps/Dry_Beans,_Dry_Peas,_and_Lentils/dbinten.php (Accessed March 15, 2022).
Valdisser, P. A. M. R., Müller, B. S. F., de Almeida Filho, J. E., Morais Júnior, O. P., Guimarães, C. M., Borba, T. C. O., et al. (2020). Genome-Wide Association Studies Detect Multiple QTLs for Productivity in Mesoamerican Diversity Panel of Common Bean under Drought Stress. Front. Plant Sci. 11, 1563. doi:10.3389/fpls.2020.574674
Vallejo, R. L., Leeds, T. D., Gao, G., Parsons, J. E., Martin, K. E., Evenhuis, J. P., et al. (2017). Genomic Selection Models Double the Accuracy of Predicted Breeding Values for Bacterial Cold Water Disease Resistance Compared to a Traditional Pedigree-Based Model in Rainbow trout Aquaculture. Genet. Sel Evol. 49 (1), 17. doi:10.1186/s12711-017-0293-6
Villordo-Pineda, E., González-Chavira, M. M., Giraldo-Carbajo, P., Acosta-Gallegos, J. A., and Caballero-Pérez, J. (2015). Identification of Novel Drought-Tolerant-Associated SNPs in Common Bean (Phaseolus vulgaris). Front. Plant Sci. 6, 546. doi:10.3389/fpls.2015.00546
Visscher, P. M., Brown, M. A., McCarthy, M. I., and Yang, J. (2012). Five Years of GWAS Discovery. Am. J. Hum. Genet. 90 (1), 7–24. doi:10.1016/j.ajhg.2011.11.029
Vlasova, A., Capella-Gutierrez, S., Rendon-Anaya, M., Hernandez-Onate, M., Minoche, A. E., et al. (2016). Genome and Transcriptome Analysis of the Mesoamerican Common Bean and the Role of Gene Duplications in Establishing Tissue and Temporal Specialization of Genes. Genome Biol. 17, 32.
Waldmann, P. (2019). On the Use of the pearson Correlation Coefficient for Model Evaluation in Genome-wide Prediction. Front. Genet. 10 (SEP), 1–4. doi:10.3389/fgene.2019.00899
Wang, J.-F., Ho, F.-I., Truong, H. T. H., Huang, S.-M., Balatero, C. H., Dittapongpitch, V., et al. (2013). Identification of Major QTLs Associated with Stable Resistance of Tomato Cultivar 'Hawaii 7996' to Ralstonia Solanacearum. Euphytica 190 (2), 241–252. doi:10.1007/s10681-012-0830-x
Wang, J., Zhou, Z., Zhang, Z., Li, H., Liu, D., Zhang, Q., et al. (2018a). Expanding the BLUP Alphabet for Genomic Prediction Adaptable to the Genetic Architectures of Complex Traits. Heredity 121 (6), 648–662. doi:10.1038/s41437-018-0075-0
Wang, L., Zhou, X., Ren, X., Huang, L., Luo, H., Chen, Y., et al. (2018b). A Major and Stable QTL for Bacterial Wilt Resistance on Chromosome B02 Identified Using a High-Density SNP-Based Genetic Linkage Map in Cultivated Peanut Yuanza 9102 Derived Population. Front. Genet. 9, 1–13. doi:10.3389/fgene.2018.00652
Wang, S., Xu, Y., Qu, H., Cui, Y., Li, R., Chater, J. M., et al. (2020). Boosting Predictabilities of Agronomic Traits in rice Using Bivariate Genomic Selection. Brief. Bioinform. 22. doi:10.1093/bib/bbaa103
Wen, L., Chang, H.-X., Brown, P. J., Domier, L. L., and Hartman, G. L. (2019). Genome-wide Association and Genomic Prediction Identifies Soybean Cyst Nematode Resistance in Common Bean Including a Syntenic Region to Soybean Rhg1 Locus. Hortic. Res. 6 (1). doi:10.1038/s41438-018-0085-3
Yerkes, W. D., and Crispin, A. M. (1956). Bean Diseases of Importance in Mexico in 1955. Plant Dis. Reporter 40, 222–223.
Zhang, J., Song, Q., Cregan, P. B., and Jiang, G.-L. (2016). Genome-wide Association Study, Genomic Prediction and Marker-Assisted Selection for Seed Weight in Soybean (Glycine max). Theor. Appl. Genet. 129 (1), 117–130. doi:10.1007/s00122-015-2614-x
Zhang, L.-H., Jia, B., Zhuo, R.-Y., Liu, J.-L., Pan, H.-Y., Baldwin, T. C., et al. (2012). An Acyl-Acyl Carrier Protein Thioesterase Gene Isolated from Wintersweet (Chimonanthus Praecox), CpFATB, Enhances Drought Tolerance in Transgenic Tobacco (Nicotiana Tobaccum). Plant Mol. Biol. Rep. 30 (2), 433–442. doi:10.1007/s11105-011-0359-5
Zienkiewicz, M. (2016). Plant Breeding 101. Alberta Seed Guide. Available at: https://www.seed.ab.ca/plant-breeding-101/.
Keywords: common bean, bacterial wilt, genome-wide association study, genomic prediction, single nucleotide polymorphism, Phaseolus vulgaris, Curtobacterium flaccumfaciens pv. flaccumfaciens
Citation: Zia B, Shi A, Olaoye D, Xiong H, Ravelombola W, Gepts P, Schwartz HF, Brick MA, Otto K, Ogg B and Chen S (2022) Genome-Wide Association Study and Genomic Prediction for Bacterial Wilt Resistance in Common Bean (Phaseolus vulgaris) Core Collection. Front. Genet. 13:853114. doi: 10.3389/fgene.2022.853114
Received: 12 January 2022; Accepted: 14 April 2022;
Published: 31 May 2022.
Edited by:
Madhav P. Nepal, South Dakota State University, United StatesReviewed by:
Satinder Kaur, Punjab Agricultural University, IndiaTika Adhikari, North Carolina State University, United States
Copyright © 2022 Zia, Shi, Olaoye, Xiong, Ravelombola, Gepts, Schwartz, Brick, Otto, Ogg and Chen. This is an open-access article distributed under the terms of the Creative Commons Attribution License (CC BY). The use, distribution or reproduction in other forums is permitted, provided the original author(s) and the copyright owner(s) are credited and that the original publication in this journal is cited, in accordance with accepted academic practice. No use, distribution or reproduction is permitted which does not comply with these terms.
*Correspondence: Ainong Shi, ashi@uark.edu; Senyu Chen, chenx099@umn.edu