 Wan-Ping Lee1,2,3*†
 Albert A. Tucci4†
 Mitchell Conery5,6
 Yuk Yee Leung1,2,3
 Amanda B. Kuzma1
 Otto Valladares1
 Yi-Fan Chou1
 Wenbin Lu7Li-San Wang1,2,3Gerard D. Schellenberg1,3
 Jung-Ying Tzeng4,7*
- 1Penn Neurodegeneration Genomics Center, Department of Pathology and Laboratory Medicine, Perelman School of Medicine, University of Pennsylvania, Philadelphia, PA, United States
- 2Institute for Biomedical Informatics, Perelman School of Medicine, University of Pennsylvania, Philadelphia, PA, United States
- 3Department of Pathology and Laboratory Medicine, Perelman School of Medicine, University of Pennsylvania, Philadelphia, PA, United States
- 4Bioinformatics Research Center, North Carolina State University, Raleigh, NC, United States
- 5Division of Human Genetics, Children’s Hospital of Philadelphia, Philadelphia, PA, United States
- 6Graduate Group in Genomics and Computational Biology, Perelman School of Medicine, University of Pennsylvania, Philadelphia, PA, United States
- 7Department of Statistics, North Carolina State University, Raleigh, NC, United States
Alzheimer’s Disease (AD) is a progressive neurologic disease and the most common form of dementia. While the causes of AD are not completely understood, genetics plays a key role in the etiology of AD, and thus finding genetic factors holds the potential to uncover novel AD mechanisms. For this study, we focus on copy number variation (CNV) detection and burden analysis. Leveraging whole-genome sequence (WGS) data released by Alzheimer’s Disease Sequencing Project (ADSP), we developed a scalable bioinformatics pipeline to identify CNVs. This pipeline was applied to 1,737 AD cases and 2,063 cognitively normal controls. As a result, we observed 237,306 and 42,767 deletions and duplications, respectively, with an average of 2,255 deletions and 1,820 duplications per subject. The burden tests show that Non-Hispanic-White cases on average have 16 more duplications than controls do (p-value 2e-6), and Hispanic cases have larger deletions than controls do (p-value 6.8e-5).
Introduction
Alzheimer’s disorder (AD) is a devastating neurodegenerative disease and is the most common cause of dementia. Approximately 6.2 million Americans are living with AD in 2021, and it is projected to reach 12.7 million in 2050, which makes AD one of the most pressing public health issues (Alzheimer’s Association, 2020). Presently, there is no known effective prevention or disease modifying therapies, and the landscape of AD drug trials is gloomy. One possible reason is that AD is a heterogeneous disorder, but trials are designed treating it as a monolithic disease. Although lifestyle and environmental risk factors clearly affect AD, the primacy of genetic influences suggests that categorization by genetic basis should be prioritized in developing effective interventions.
AD heritability estimates range from 49–79%; however, <50% of this heritability can be explained by genome-wide association studies (GWAS) on single nucleotide variants (SNVs) (Ridge et al., 2013; Sims et al., 20202020). Taking copy number variation (CNV) into consideration may partially mitigate the problem of missing heritability and play an important role in human disease susceptibility (Cooper et al., 2011; Chung et al., 2014; McCarroll and Altshuler, 2007; Kakinuma and Sato, 2008; Cooper et al., 2011; Chung et al., 2014; McCarroll and Altshuler, 2007; Kakinuma and Sato, 2008). For neuropsychiatric disorders, such as intellectual ability, Autism Spectrum disorders, Schizophrenia, and Bipolar disorder, CNVs have given rise to a new understanding of disease etiology (Kakinuma and Sato, 2008; Malhotra and Sebat, 2012; Sullivan et al., 2012). Recently, multiple studies have highlighted the roles of CNVs in AD as well (Szigeti et al., 2013; Szigeti et al., 2014; Saykin et al., 2011; Heinzen et al., 2010; Lew et al., 2018; Zheng et al., 2015; Zhang, 2020; Heinzen et al., 2010; Saykin et al., 2011; Szigeti et al., 2013; Szigeti et al., 2014; Zheng et al., 2015; Lew et al., 2018; Zhang, 2020). For example, an intragenic CNV is found in the CR1 gene (Brouwers et al., 2012), and people with Down syndrome have a higher chance to develop neuropathology, consistent with the observation that AD may be caused by duplications in the APP gene in chromosome 21 (Goate, 2006; Lanoiselée et al., 2017). However, there is no comprehensive genome-wide CNV study using whole-genome sequence (WGS) to enhance the knowledge of AD etiology and risk.
Most of the previous CNV GWAS of AD were performed using genotyping array data. Although these arrays can quickly and cost efficiently genotype large numbers of samples, there are serious technological limitations in that only large CNVs spanning multiple pre-determined probes can be reliably detected. However, WGS data allows an unbiased investigation of CNVs of all types (i.e., small and large; common and rare; within coding and non-coding regions) and provides a unique opportunity to comprehensively study CNVs in diseases. To accelerate AD genetic discovery, the Alzheimer’s Disease Sequencing Project (ADSP) (Beecham et al., 2017), a strategic program funded by the National Institute on Aging (NIA), is committed to sequence AD cases, and cognitively normal elder controls from multi-ethnic populations, providing a valuable resource for genome-wide identification of CNVs.
This study utilizes the ADSP Umbrella R1 dataset (ng00067) released through the National Institute on Aging Genetics of Alzheimer’s Disease Data Storage Site (NIAGADS) Data Sharing Service (Kuzma et al., 2016). After quality and relatedness checks, we had 1,737 AD cases and 2,063 cognitively normal elder controls for this study. We employed three CNV calling algorithms, CNVnator (Abyzov et al., 2011), JAX-CNV (Lee et al., 2021), and Smoove (GitHub—brentp/smoove, 2021; Layer et al., 2014) that on average detected 2,378, 25, and 4,584 CNVs, respectively, for each sample. GraphTyper2 (Eggertsson et al., 2019) was then applied for joint genotyping to generate a single VCF for all 3,800 samples in the study, which increased the number of CNVs to 280,073 average/sample; however, most of those CNVs either overlap or are adjacent to each other. After merging CNVs of the same type (deletions or duplications) and removing conflict regions with different types of CNVs, there are on average 4,075 CNVs per sample. The CNVs we identified tended to be more abundant and longer in AD cases compared to cognitively normal, elder controls, though in most cases this trend was not statistically significant.
Materials and Methods
The analysis flow consists of two major steps; identification of CNVs from WGS from 3,800 subjects (CNV Identification on WGS Data), and CNV burden analysis (CNV Burden Analysis Using PLINK).
Figure 1 shows an overview of the flow of CNV identification on WGS data. The flow starts with alignment CRAM files and ends at the single-sample CNV list generation. The process began with a quality check (WGS Across-Chromosome Coverage Check) followed by sample-level CNV calling and project-level CNV joint genotyping (Sample-Level CNV Calling and Project-Level CNV Joint Genotyping). Finally, to meet the data format requirements of CNV burden analysis, the genotyped VCF was further split as a list in BED format per sample for region consolidation (for same-type CNVs overlapping) and removal (for different-type CNVs overlapping). Then, all BED files were merged and converted in PLINK format as the input of burden analysis (CNV List Assembling for PLINK Burden Analysis). The detailed scripts are given in supplementary material.
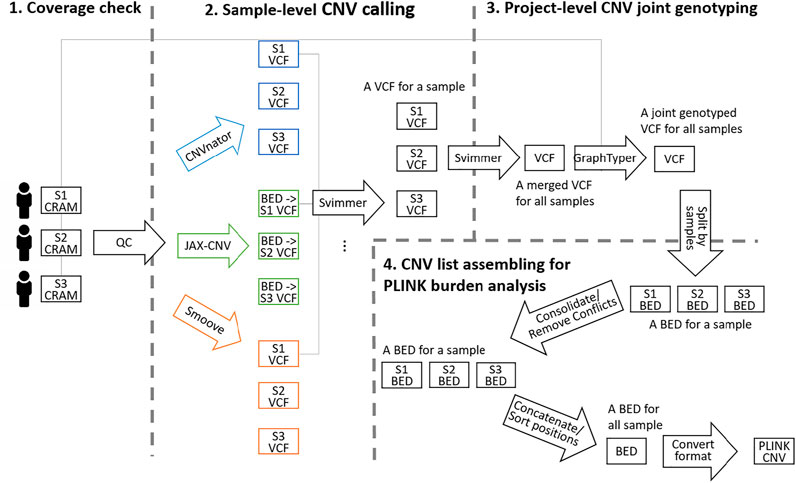
FIGURE 1. Overview of the CNV identification workflow from WGS data consisting of the four steps. 1) Alignment coverage check. 2) Sample-level CNV calling including calling by CNVnator, JAX-CNV and Smoove, and merging the three callsets by Svimmer. Since Svimmer takes the VCF format as input, results of JAX-CNV in the BED format were converted to the VCF format. 3) Project-level CNV re-genotyping. 4) CNV list assembling for PLINK burden analysis. The illustrated three samples in the figure are notated by S1, S2 and S3 while 3,800 samples were processed in the study.
CNV Identification on WGS Data
WGS Across-Chromosome Coverage Check
The quality of CNV calling on WGS data is sensitive to alignment coverages across all chromosomes of a sample. Uneven coverages of chromosomes may cause false positive CNVs. Thus, before calling CNVs, it is necessary to perform a quality check of alignment coverages. Samples with uneven coverage were removed from analysis.
We developed a method (implemented as part of JAX-CNV) to first estimate the coverage of each chromosome of a sample. The method seeks 20 repetitive-free regions in each chromosome, and then calculates an average coverage of these regions to present the coverage of the chromosome. A repetitive-free region is defined as a 20k bp long region with each 25-mer (k-mer) inside the region having a unique position in the entire reference genome.
Once coverage of each chromosome was obtained, we were able to identify outlier chromosomes with unexpected high or low coverages. For example, outliers could indicate trisomy, monosomy, and other gross chromosome number anomalies. An overall average coverage of a sample was then computed by using the coverages of all chromosomes excluding outliers. A standard deviation of chromosomes coverages was employed as the metric to identify problematic samples that were removed from downstream analyses. This method is fast and takes approximately 5 minutes for a 30X sequence sample.
Sample-Level CNV Calling
We employed CNVnator, JAX-CNV, and Smoove for CNV detection. CNVnator and JAX-CNV are Read-Depth-based (RD-based) algorithms while Smoove utilizes multiple signals of RD, Paired-End (PE), and Split-Read (SR). CNVnator is sensitive for CNVs sizes ranging from 1 to 50 kb; however, it may break larger CNVs into smaller pieces that introduce difficulties for downstream analyses. We included JAX-CNV in the analysis flow because it was developed to detect large (>50 kb) CNVs and resolves the issue of fine pieces from CNVnator. Smoove was recruited to strengthen small CNV (<1 kbp) identification. These three CNV calling algorithms are not only fast but also generating high-quality CNVs. Moreover, the combination of them allows us to cover the complete size spectrum of CNVs.
For each sample, we applied these three algorithms separately. Each algorithm could generate a BED (JAX-CNV) or VCF (CNVnator and Smoove) file to store a set of deletions/duplications with genomics coordinates and genotypes (homozygous or heterozygous, and copy numbers) of a sample. If a BED file was generated, we converted it to VCF format to facilitate the step of utilizing svimmer (GitHub—DecodeGenetics/svimmer, 2021) for callset merging. For variant types (deletions, duplications, inversions, and breakends) detected by Smoove, we only kept deletions and duplications. For each sample, we then applied svimmer to merge the three VCFs obtained from the three algorithms.
Project-Level CNV Joint Genotyping
Joint analysis is recommended for a dataset with multiple samples. Once variants of a sample were detected, a joint analysis step provides the ability to leverage population-wide information from multiple samples that allows us to refine low-quality genotypes and detect additional variants of a sample. For example, a joint genotyping step is suggested in the GATK best practice for SNV and INDEL detection.
Compared to SNV/INDEL joint genotyping, CNV joint genotyping is challenging since breakpoints of CNVs from short-read sequence data may be imprecise. By incorporating detected variants within the linear reference genome, the emerging methodology, Graph Genome, provides a good model for joint genotyping CNVs across multiple samples in a single step. We evaluated GraphTyper2 (Eggertsson et al., 2019), Paragraph (Chen et al., 2019), and VG (Hickey et al., 2020), and selected GraphTyper2 in the analysis flow due to its balance of required computational resource and quality of results.
As GraphTyper2 recommended, we employed svimmer (GitHub—DecodeGenetics/svimmer, 2021) to merge all sample-level VCFs and generate a single VCF that does not contain genotypes. GraphTyper2 was then applied on this merged VCF with all CRAM files for each 500kb region excluding the centromeres. GraphTyper2 generated a VCF of CNVs with genotypes of all samples. There are three models used for joint genotyping in GraphTyper2, Aggregated, Coverage, and Breakpoint, and we kept results from Aggregated model as GraphTyper2 suggests. We also applied PASS flag filter in the GraphTyper2 VCFs. Each 500kb chunk VCFs were consented using BCFtools (Danecek et al., 2021).
CNV Burden Analysis Using PLINK
CNV List Assembling for PLINK Burden Analysis
There remains a challenge in using GraphTyper2 VCF files for downstream burden analysis. Since multiple calling algorithms were applied for CNV identification, CNV lengths and breakpoints may vary. Although GraphTyper2 was applied to mitigate this situation, we still can find CNV segments overlapping each other that is not acceptable by downstream association analysis tools such as PLINK (Chang et al., 2015). To resolve overlapping segments, we first split CNVs (with PASS genotype tags) of a sample in BED format for each sample. The BED is in the format of chromosome, begin position, end position, and copy number status for each CNV. The copy number status recorded as 0, 1, 3 or 4 copies. Of note, the copy status 4 includes copy numbers equal or larger than 4. Then, we used BEDTools (Quinlan and Hall, 2010) to merge overlapping or adjacent segments. Segments were merged only if they are the same CNV type, deletions or duplications. For those regions having different CNV types, we filtered them out since the downstream association analysis would not take those regions into consideration. Once the CNV consolidation and removal were done for all samples, we then concatenated all BED files and sorted the merged BED file by CNV positions.
PLINK format, that is commonly accepted by other downstream association tools, is a tabular file format with CNV coordinates, family IDs, and sample IDs. Since there are no related samples in the dataset, we replicated sample IDs as family IDs. We then converted the BED file into a six-column with family ID, sample ID, chromosome, start position, end position, and copy number status, e.g. 0, 1, 3, or 4 copies.
Rare CNV Identification
Rare CNVs were obtained using PLINK to impose a 0.01 frequency threshold (i.e., --cnv-freq-exclude-above 38 and--cnv-overlap 0.5), which removed CNVs with >50% of its length spanning a region with >1% × 3,800 CNVs in the dataset. The same approach was applied on African American (AA) (--cnv-freq-exclude-above 9), Hispanic (--cnv-freq-exclude-above 12), and Non-Hispanic White (NHW) (--cnv-freq-exclude-above 15) samples. Then, we applied the pilot mask released by the 1,000 Genomes Project (The 1000 Genomes Project, 2010) on rare CNV lists. The pilot mask was done by looking at the amount of sequence data that aligned to any given location in the reference genome. Regions are defined inaccessible if their depth of coverages (summed across all samples in the 1,000 Genomes Project) were higher or lower than the average depth. The mask results in 5.3% of bases marked “N” (the base is an “N”), 1.4% marked “L” (coverage is low), 0.6% marked “H” (coverage is high) and 3.7% marked “Z” (many reads mapped here have zero quality). The remaining 89.0% of are marked “P” (regions are good and passed). All rare CNVs need to reside in “P” regions.
CNV Burden Analysis
We examined the burdens of all and rare CNVs in AD cases and controls using PLINK. PLINK burden analysis uses permutation tests to compute p-values. For our analysis, we applied 500,000 permutations. For each sample, we considered four CNV burden features: 1) number of CNV events; 2) proportion of samples with ≥1 CNV events; 3) total event length in kb; and 4) average event length in kb. The CNV events included deletions and duplications together (DelDup), deletions specific (Del), and duplications specific (Dup). We reported the CNV burdens for AA, Hispanic, and NHW separately as well as for all-combined samples (ALL), The Bonferroni threshold for multiple testing is p-value < 0.05/96 analyses = 0.000521, where the 96 analyses included the combinations from 2 sets of CNV analyses (all CNVs vs. rare CNVs), 4 burden features, 3 CNV events (DelDup, Del, and Dup) and 4 sample groups (ALL, AA, Hispanic, and NHW).
Results
Dataset—3,800 WGS Samples from NIAGADS R1 Release of ADSP 5k
We used the ADSP WGS data released by NIAGADS in 2018. NIAGADS not only collected and released genetics data, but also harmonized minimal phenotypes (sex, race/ethnicity, diagnosis, APOE genotype) from each collocating cohort. For data harmonization, NIAGADS followed the ADSP coding scheme based on the National Alzheimer’s Coordinating Center (NACC) Uniform Data Set (UDS) (Beekly et al., 2007) definitions. We used NIAGADS and did not redefine diagnosis or ethnicities in this study.
There are 4,749 subjects and 4,788 sequenced samples (three subjects sequenced nine times and another three sequenced six times) by Illumina HiSeq 2000/2,500 or X Ten at an average of 37X coverage (the range from 10.68X to 74.16X). For the six subjects with multiple sequence sets, we picked one sequence set per subject, and removed the other 39 sequences. For the 4,749 subjects, these were 2,192 AD cases, 2,073 controls, and others 484 with diagnosis unknowns. For this study, we focused on AD cases and controls, and excluded samples with inconclusive clinical statuses.
For the remaining 4,265 samples, we performed the across-chromosome alignment coverage check (WGS Across-Chromosome Coverage Check) since uneven coverage may affect the quality of CNV detection. Fifteen samples were removed since their standard deviation of chromosomes coverages are greater than 15% of the average coverages, as shown in Figure 2 where each line presents a sample, and each dot presents the alignment coverage of the sample in the chromosome on the x-axis.
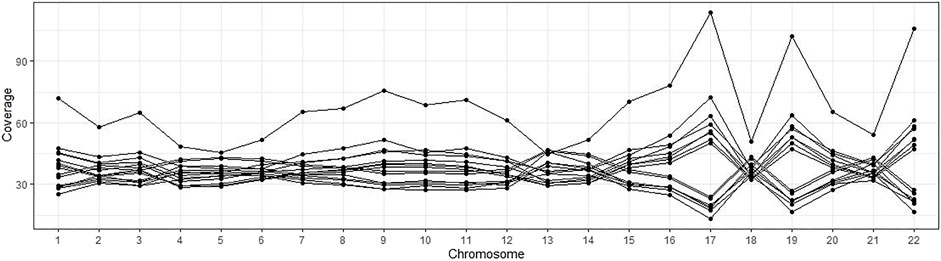
FIGURE 2. Alignment coverages of 15 samples with uneven sequence data. Each line is a sample, and each dot presents the alignment coverage for a chromosome.
Next, we removed 450 samples due to relatedness according to pedigree information provided by NIAGADS. Finally, we had 1,737 AD cases and 2,063 controls. The ethnicities/races are AA (n = 978), Hispanic (n = 1,247), NHW (n = 1,566), and others (n = 9), as shown in Table 1.
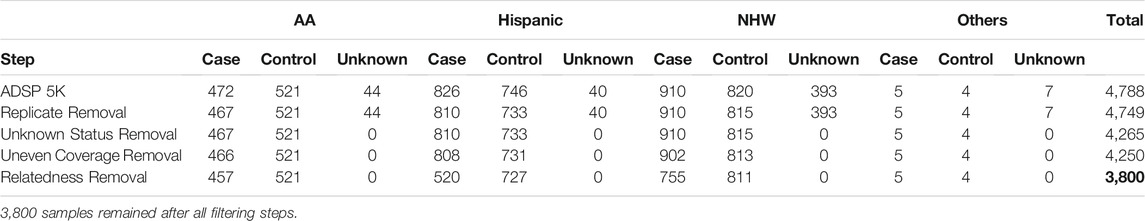
TABLE 1. Total column denotes the number of samples remaining after each quality filtering step.
CNV Callset
We first applied CNVnator, JAX-CNV and Smoove on each CRAM file of a sample for sample-level CNV calling. CNVnator, JAX-CNV and Smoove detected an average of 2,378 (1,967 deletions and 411 duplications), 25 (12 deletions and 13 duplications), and 4,584 (3,876 deletions and 708 duplications) CNVs, respectively. Compared to NHW, AA and Hispanic have 141 and 122 deletions more, but 180 and 9 fewer duplications. Only Smoove yielded fewer duplications for AA and Hispanic, as shown in Figure 3A.
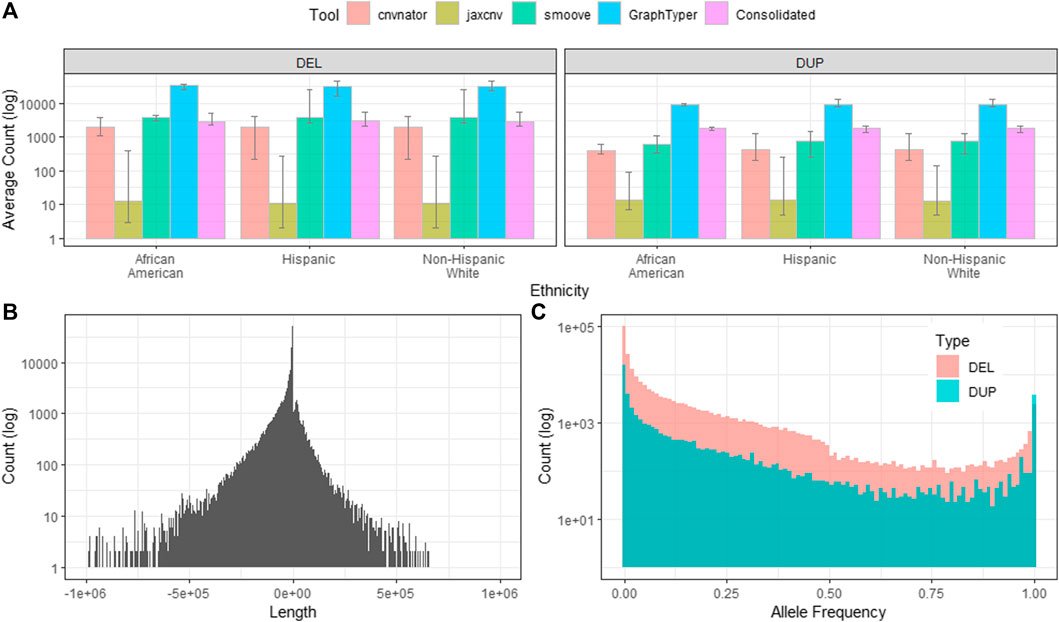
FIGURE 3. Characteristics of the project level CNV callset. Counts shown on the y-axes of the sub figures are in the log10 scale. (A). The average deletions and duplications detected by CNVnator, JAX-CNV, Smoove and GraphTyper2. Consolidated shows CNV counts after CNV merging and conflicts removing. (B). Length distribution of CNVs after applying GraphTyper2 and the PASS flag filter. Lengths of deletions were presented as negative values while lengths of duplications are positive values. (C). Allele frequency of CNVs of GraphTyper2.
For each sample, we employed svimmer to merge the callsets from the three callers as a single VCF. Next, svimmer was applied to VCFs for all 3,800 samples to generate a combined VCF which along with all CRAM files are inputs of GraphTyper2. As described in Project-Level CNV Joint Genotyping, we kept Aggregated notated variants and also applied the PASS flag filter in this aggregated callset. The result was a total of 237,306 deletions and 42,767 duplications as a project-level VCF. The length distribution and allele frequency of the project-level VCF are given in Figures 3B,C. Lengths of deletions were presented by using negative values that were shown on the left panel of Figure 3B, while lengths of duplication were shown on the right panel of Figure 3B.
CNV Concordant Check with Other Projects
We compared our project-level callset with the 1,000 Genomes Project Phase 3 (1KG_P3) (Sudmant et al., 2015), gnomAD (Collins et al., 2020), and Decipher (Firth et al., 2009) that were obtained from dbGaP (https://www.ncbi.nlm.nih.gov/dbvar/content/human_hub/). The 1KG_P3 and gnomAD have other types of variants (insertions, inversions, mobile element deletion, and mobile element insertions) in the lists that were not used in the comparison; only autosomal copy number variations were used for the comparison. All lists were converted into the BED format for performing cross-project concordant CNV checks by using BEDTools.
We examined the overlap between our data and other call sets using either a 1bp or 50% overlap. We performed each pair of comparisons twice treating both callsets as the primary in one of the comparisons. As demonstrated in Table 2, each pair of comparisons is asymmetric with different concordance percentages depending upon which callset was the primary (primary callset is the one in the column). 79.9 and 76.3% of our called CNVs were found in gnomAD and Decipher when using at least 1bp overlapping criterion. However, only 39.8% were recalled in the 1KG_P3 callset. GnomAD likewise has a low concordance rate, with only 41%, of CNVs overlapping with the 1KG_P3 callset. Our callset and gnomAD callset have higher similarity and more novel CNVs compared to the 1KG_P3 and Decipher callsets.
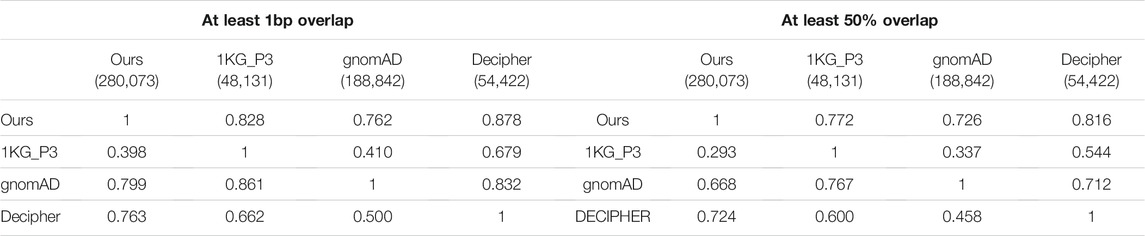
TABLE 2. CNV concordant checks with the 1,000 Genomes Project Phase 3 (1KG_P3), gnomAD, and Decipher callsets. Each column resents the percentages of CNVs in the callset overlapping with others listed in rows.
CNV List for PLINK Burden Analysis
Since PLINK does not allow overlapping CNVs within a sample, we 1) split the project-level VCF and generated a list of CNVs for a sample in BED format, and 2) consolidated CNVs or removed conflict CNVs by the method described in Section 2.1.4. After splitting the project-level VCF for each sample, we found increased numbers of CNVs per sample (32,402 deletions and 9,131duplications) since GraphTyper2 uses a combination of the three CNV calling algorithms and leverages variant knowledge from other samples. However, most of those CNVs overlap or are adjacent to each other. Next, we consolidated overlapping/adjacent CNVs if they are the same type or removed overlapping CNVs if they are different types. This CNV consolidation step significantly reduces CNVs/sample (2,966 deletions and 1,863 duplications), as shown in Figure 3A.
For rare CNV analysis, we first applied the pilot mask from the 1,000 Genomes Project that further filtered about 8.4% of CNVs and became 2,255 deletions and 1,820 duplications for each sample averagely. CNVs with an allele frequency <1% were retained for analysis. The number of rare CNVs/sample ranged from 0 to 1,546 with an average of 57/sample (46 deletions and 11 duplications; median value is 44 and standard deviation is 76.58843). Among 3,800 samples, three have zero rare CNVs while four have >1,000 rare CNVs. Those four samples are all Non-Hispanic Whites (two cases and two controls), and three of the four samples. According to the final review comment have higher detected numbers of CNVs (According to the final review comment 5,809, 5,945, and 5,992) compared to average (4075.06). The three were sequenced in the earlier stage of the project by Illumina HiSeq 2000/2,500 with PCR Amplified libraries.
Burdens of All and Rare CNVs
Table 3 are the PLINK burden tests. The four burden features were considered; 1) total event numbers, 2) Proportion of samples with ≥1 events, 3) total event length in kb, and 4) average event length in kb. Tests were done for all and rare CNVs as well as considering deletions and duplications (DelDup), deletions specific (Del) and duplications specific (Dup). The results suggested two significant all-CNV burden differences between cases and controls: 1) in NHW, on average cases have 16 more duplication events compared to controls do (p-value 2e-6); and 2) in Hispanic, the total deletion lengths in cases is larger than in controls on average (p-value 6.8e-5). There are no significant differences for rare CNV burden in all aspects examined. Of note, the p-values from PLINK burden analysis did not account for covariates and were merely examining if the observed burden measures of cases and controls were significantly different in a marginal fashion. Figure 4 shows the total event numbers per sample and the total event length in kb per sample.
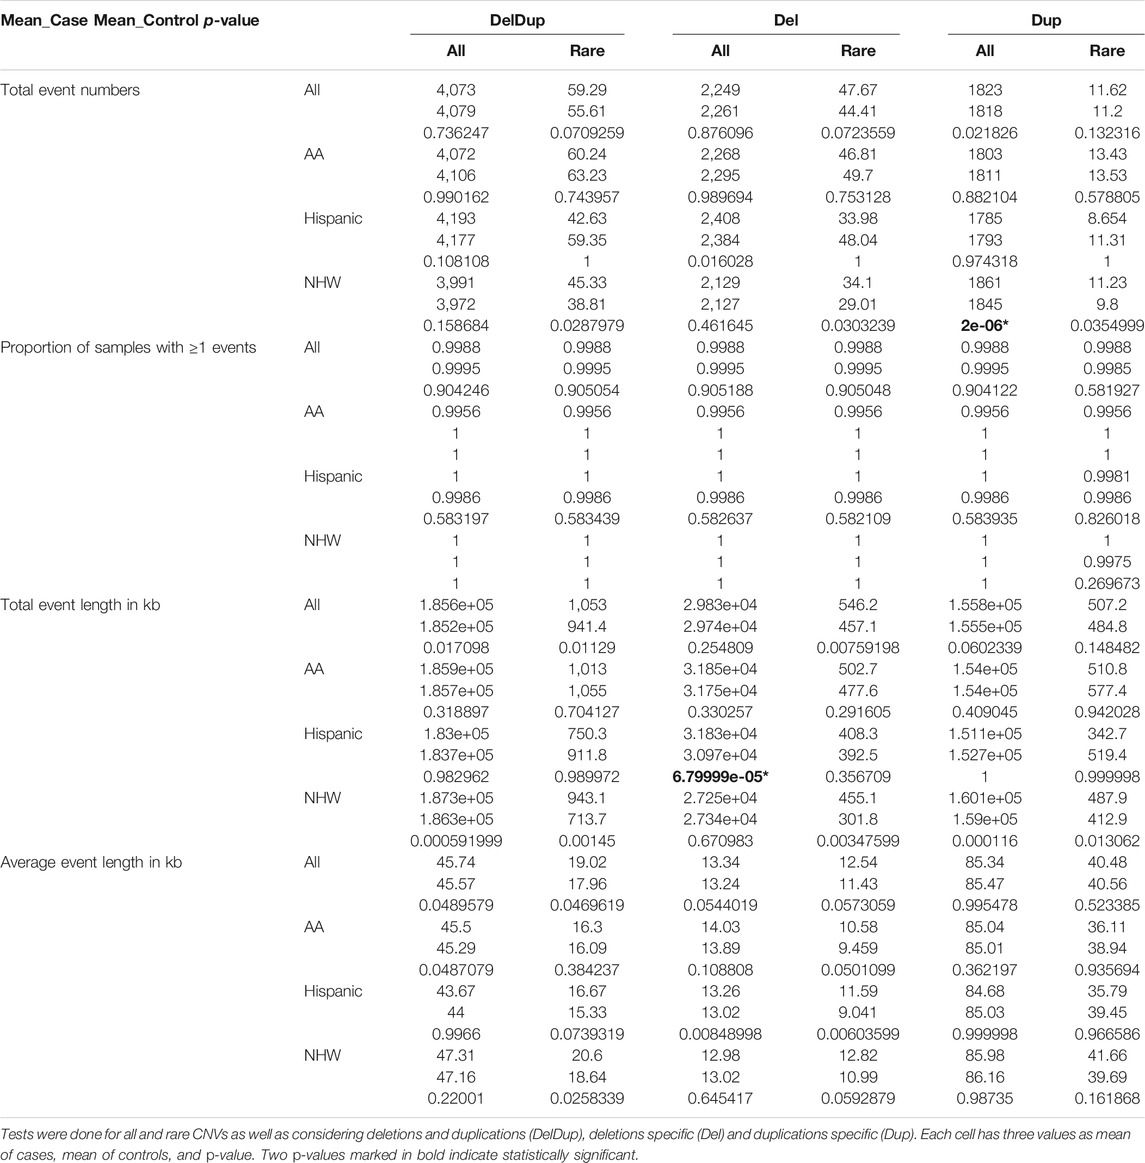
TABLE 3. The four burden features were considered; 1) total event numbers, 2) Proportion of samples with ≥1 events, 3) total event length in kb, and 4) average event length in kb.
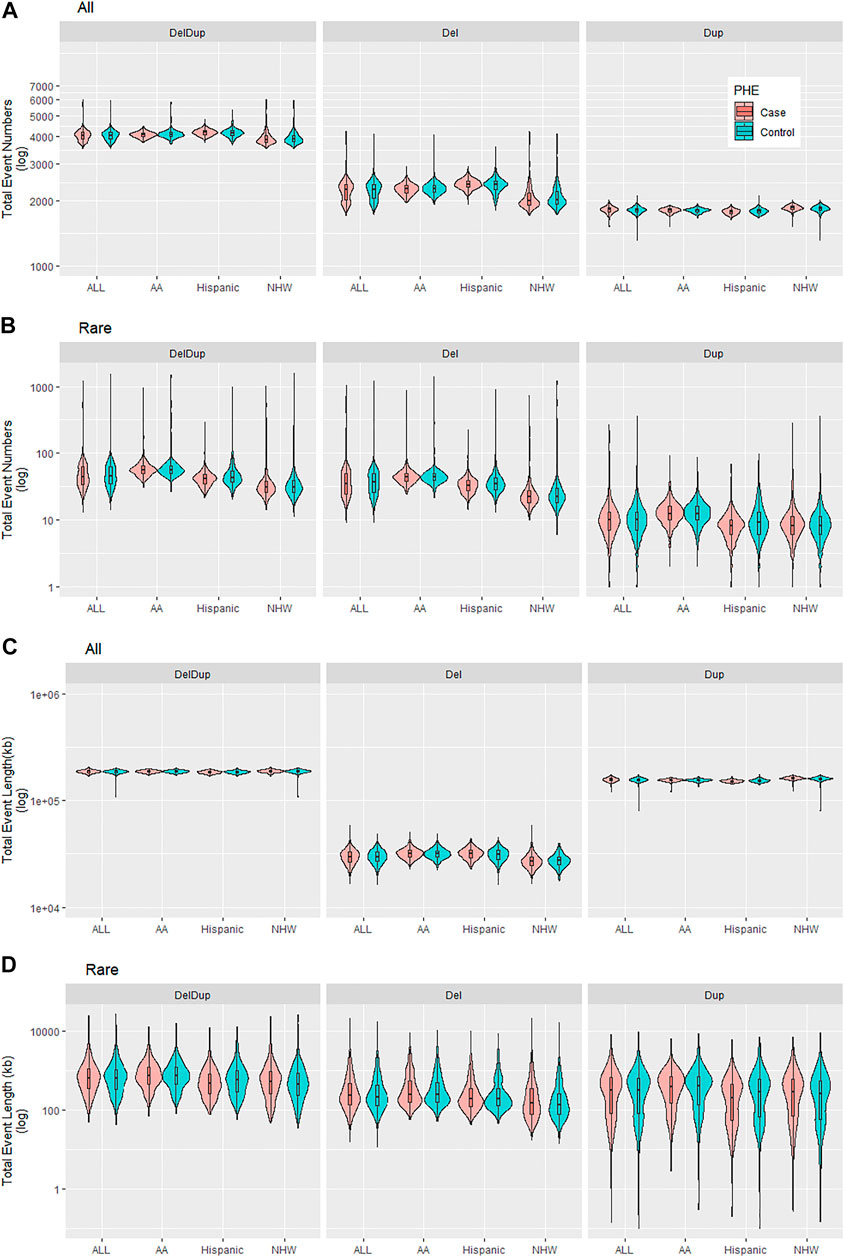
FIGURE 4. Summary of CNV burden results for all and rare CNVs by CNV events (DelDup, Del, or Dup) and by ethnicities (ALL, AA, Hispanic, NHW). (A). Total event numbers per sample. (B). Total rare event numbers per sample. (C). Total event length in kb per sample. (D). Total rare event length in kb per sample.
Discussion
We have composed a scalable bioinformatics pipeline to identify CNVs using WGS data and applied it to 1,737 AD cases and 2,063 cognitively normal controls from the ADSP. We observed 237,306 and 42,767 deletions and duplications, respectively with an average of 2,255 deletions and 1,820 duplications per subject. Although there were more and longer CNVs in AD case samples than controls, burden tests performed using all CNVs or rare CNVs (i.e., <1% in frequency) do not indicate a significant association with AD status.
The false discovery rate of detected CNVs remains uncertain despite the fact that CNVs were generated circumspectly and have been cross checked with other projects including the 1KG, gnomAD and Decipher. The callset of 1KG is smaller than ours and gnomAD’s, and it is therefore expected that 1KG recalls only ∼40% of ours and gnomAD’s callsets, while ours and gnomAD’s callsets capture 82.8 and 86.1% of 1KG’s CNVs respectively. We would also like to note that 1KG processed their data several years earlier than we and gnomAD did. Since the publishing of the 1KG Phase3 callset, CNV-calling tools have moved towards integration of multiple alignment signals (such as read-depth, pair-end, and split-read signals) for calling. This concept was well-accepted before the publishing of the gnomAD callset, and could make 1KG’s callset less similar to ours and gnomAD’s. While extensive experimental validation of each CNV is not currently feasible, validation of significant deletions and duplications may be necessary. Alternatively, our findings could be replicated with other datasets of Alzheimer’s Disease whole genome sequence data.
Joint genotyping provides the ability to leverage information from multiple samples so we could refine low-quality genotypes and detect additional variants for a sample. However, it also brings challenges when breakpoints of CNVs from different samples do not align well. The situation is even worse when using multiple calling algorithms. For this study, we employed GraphTyper2 for joint genotyping, which is a graph-genome based method and has shown an advantage for genotyping larger variants such as CNVs. However, GraphTyper2 does not provide a total solution; overlapping CNVs can still be found after joint genotyping. To address the issue, we split aggregated results to generate a CNV list for each sample and resolved overlapping CNV regions. A graph reference genome presents a variant, a CNV in our application, as a branch in the graph. For the overlapping CNV situation, the graph genome creates several similar branches in a region. The issues could be resolved in a more fundamental way by pruning unnecessary brunches of the graph genome. A slim graph genome will also improve running time and memory usage.
Data Availability Statement
The data analyzed in this study is subject to the following licenses/restrictions: Data is accessible from NIAGADS DSS via qualified access. Formal requests to access these datasets can be submitted to NIAGADS DSS: https://dss.niagads.org/.
Ethics Statement
The studies involving human participants were reviewed and approved by North Carolina State University Institutional Review Board for the use of human subjects in research. The patients/participants provided their written informed consent to participate in this study.
Author Contributions
W-PL: Conceptualization, Methodology, Software, Formal analysis, Investigation, Writing—Original Draft, Visualization, Supervision, Project administration; AT: Software, Formal analysis, Writing—Review and Editing; MC: Methodology, Software, Formal analysis, Writing—Review and Editing; YYL: Data Curation, Writing—Review and Editing, Resources; AK: Data Curation, Writing—Review and Editing, Resources; OV: Software, Data Curation; Y-FC: Software, Data Curation; WL: Conceptualization; L-SW: Conceptualization, Supervision, Writing—Review & Editing, Funding acquisition; GS: Conceptualization, Writing—Review and Editing, Funding acquisition; J-YT: Conceptualization, Methodology, Software, Formal analysis, Investigation, Writing—Original Draft, Supervision, Project administration.
Funding
This work has been partially supported by National Institutes of Health Grants RF1 AG074328, U54 AG052427, U24 AG041689, and P01 CA142538, and the University of Pennsylvania (Penn) Alzheimer’s Disease Research Center (ADRC) Development Projects.
Conflict of Interest
The authors declare that the research was conducted in the absence of any commercial or financial relationships that could be construed as a potential conflict of interest.
Publisher’s Note
All claims expressed in this article are solely those of the authors and do not necessarily represent those of their affiliated organizations, or those of the publisher, the editors and the reviewers. Any product that may be evaluated in this article, or claim that may be made by its manufacturer, is not guaranteed or endorsed by the publisher.
Acknowledgments
The Alzheimer’s Disease Sequencing Project (ADSP) is comprised of two Alzheimer’s Disease (AD) genetics consortia and three National Human Genome Research Institute (NHGRI) funded Large Scale Sequencing and Analysis Centers (LSAC). The two AD genetics consortia are the Alzheimer’s Disease Genetics Consortium (ADGC) funded by NIA (U01 AG032984), and the Cohorts for Heart and Aging Research in Genomic Epidemiology (CHARGE) funded by NIA (R01 AG033193), the National Heart, Lung, and Blood Institute (NHLBI), other National Institutes of Health (NIH) institutes and other foreign governmental and non-governmental organizations. The Discovery Phase analysis of sequence data is supported through UF1AG047133 (to Drs. Schellenberg, Farrer, Pericak-Vance, Mayeux, and Haines); U01AG049505 to Dr. Seshadri; U01AG049506 to Dr. Boerwinkle; U01AG049507 to Dr. Wijsman; and U01AG049508 to Dr. Goate and the Discovery Extension Phase analysis is supported through U01AG052411 to Dr. Goate, U01AG052410 to Dr. Pericak-Vance and U01 AG052409 to Drs. Seshadri and Fornage. Sequencing for the Follow Up Study (FUS) is supported through U01AG057659 (to Drs. PericakVance, Mayeux, and Vardarajan) and U01AG062943 (to Drs. Pericak-Vance and Mayeux). Data generation and harmonization in the Follow-up Phase is supported by U54AG052427 (to Drs. Schellenberg and Wang). The FUS Phase analysis of sequence data is supported through U01AG058589 (to Drs. Destefano, Boerwinkle, De Jager, Fornage, Seshadri, and Wijsman), U01AG058654 (to Drs. Haines, Bush, Farrer, Martin, and Pericak-Vance), U01AG058635 (to Dr. Goate), RF1AG058066 (to Drs. Haines, Pericak-Vance, and Scott), RF1AG057519 (to Drs. Farrer and Jun), R01AG048927 (to Dr. Farrer), and RF1AG054074 (to Drs. Pericak-Vance and Beecham). The ADGC cohorts include: Adult Changes in Thought (ACT) (UO1 AG006781, UO1 HG004610, UO1 HG006375, U01 HG008657), the Alzheimer’s Disease Centers (ADC) (P30 AG019610, P30 AG013846, P50 AG008702, P50 AG025688, P50 AG047266, P30 AG010133, P50 AG005146, P50 AG005134, P50 AG016574, P50 AG005138, P30 AG008051, P30 AG013854, P30 AG008017, P30 AG010161, P50 AG047366, P30 AG010129, P50 AG016573, P50 AG016570, P50 AG005131, P50 AG023501, P30 AG035982, P30 AG028383, P30 AG010124, P50 AG005133, P50 AG005142, P30 AG012300, P50 AG005136, P50 AG033514, P50 AG005681, and P50 AG047270), the Chicago Health and Aging Project (CHAP) (R01 AG11101, RC4 AG039085, K23 AG030944), Indianapolis Ibadan (R01 AG009956, P30 AG010133), the Memory and Aging Project (MAP) (R01 AG17917), Mayo Clinic (MAYO) (R01 AG032990, U01 AG046139, R01 NS080820, RF1 AG051504, P50 AG016574), Mayo Parkinson’s Disease controls (NS039764, NS071674, 5RC2HG005605), University of Miami (R01 AG027944, R01 AG028786, R01 AG019085, IIRG09133827, A2011048), the Multi-Institutional Research in Alzheimer’s Genetic Epidemiology Study (MIRAGE) (R01 AG09029, R01 AG025259), the National Cell Repository for Alzheimer’s Disease (NCRAD) (U24 AG21886), the National Institute on Aging Late Onset Alzheimer’s Disease Family Study (NIA- LOAD) (R01 AG041797), the Religious Orders Study (ROS) (P30 AG10161, R01 AG15819), the Texas Alzheimer’s Research and Care Consortium (TARCC) (funded by the Darrell K Royal Texas Alzheimer’s Initiative), Vanderbilt University/Case Western Reserve University (VAN/CWRU) (R01 AG019757, R01 AG021547, R01 AG027944, R01 AG028786, P01 NS026630, and Alzheimer’s Association), the Washington Heights-Inwood Columbia Aging Project (WHICAP) (RF1 AG054023), the University of Washington Families (VA Research Merit Grant, NIA: P50AG005136, R01AG041797, NINDS: R01NS069719), the Columbia University HispanicEstudio Familiar de Influencia Genetica de Alzheimer (EFIGA) (RF1 AG015473), the University of Toronto (UT) (funded by Wellcome Trust, Medical Research Council, Canadian Institutes of Health Research), and Genetic Differences (GD) (R01 AG007584). The CHARGE cohorts are supported in part by National Heart, Lung, and Blood Institute (NHLBI) infrastructure grant HL105756 (Psaty), RC2HL102419 (Boerwinkle) and the neurology working group is supported by the National Institute on Aging (NIA) R01 grant AG033193. The CHARGE cohorts participating in the ADSP include the following: Austrian Stroke Prevention Study (ASPS), ASPS-Family study, and the Prospective Dementia Registry-Austria (ASPS/PRODEM-Aus), the Atherosclerosis Risk in Communities (ARIC) Study, the Cardiovascular Health Study (CHS), the Erasmus Rucphen Family Study (ERF), the Framingham Heart Study (FHS), and the Rotterdam Study (RS). ASPS is funded by the Austrian Science Fond (FWF) grant number P20545-P05 and P13180 and the Medical University of Graz. The ASPS-Fam is funded by the Austrian Science Fund (FWF) project I904), the EU Joint Programme—Neurodegenerative Disease Research (JPND) in frame of the BRIDGET project (Austria, Ministry of Science) and the Medical University of Graz and the Steiermärkische Krankenanstalten Gesellschaft. PRODEM-Austria is supported by the Austrian Research Promotion agency (FFG) (Project No. 827462) and by the Austrian National Bank (Anniversary Fund, project 15435. ARIC research is carried out as a collaborative study supported by NHLBI contracts (HHSN268201100005C, HHSN268201100006C, HHSN268201100007C, HHSN268201100008C, HHSN268201100009C, HHSN268201100010C, HHSN268201100011C, and HHSN268201100012C). Neurocognitive data in ARIC is collected by U01 2U01HL096812, 2U01HL096814, 2U01HL096899, 2U01HL096902, 2U01HL096917 from the NIH (NHLBI, NINDS, NIA and NIDCD), and with previous brain MRI examinations funded by R01-HL70825 from the NHLBI. CHS research was supported by contracts HHSN268201200036C, HHSN268200800007C, N01HC55222, N01HC85079, N01HC85080, N01HC85081, N01HC85082, N01HC85083, N01HC85086, and grants U01HL080295 and U01HL130114 from the NHLBI with additional contribution from the National Institute of Neurological Disorders and Stroke (NINDS). Additional support was provided by R01AG023629, R01AG15928, and R01AG20098 from the NIA. FHS research is supported by NHLBI contracts N01-HC-25195 and HHSN268201500001I. This study was also supported by additional grants from the NIA (R01s AG054076, AG049607 and AG033040 and NINDS (R01 NS017950). The ERF study as a part of EUROSPAN (European Special Populations Research Network) was supported by European Commission FP6 STRP grant number 018947 (LSHG-CT-2006-01947) and also received funding from the European Community’s Seventh Framework Programme (FP7/2007-2013)/grant agreement HEALTH-F4- 2007-201413 by the European Commission under the programme “Quality of Life and Management of the Living Resources” of 5th Framework Programme (no. QLG2-CT-2002- 01254). High-throughput analysis of the ERF data was supported by a joint grant from the Netherlands Organization for Scientific Research and the Russian Foundation for Basic Research (NWO-RFBR 047.017.043). The Rotterdam Study is funded by Erasmus Medical Center and Erasmus University, Rotterdam, the Netherlands Organization for Health Research and Development (ZonMw), the Research Institute for Diseases in the Elderly (RIDE), the Ministry of Education, Culture and Science, the Ministry for Health, Welfare and Sports, the European Commission (DG XII), and the municipality of Rotterdam. Genetic data sets are also supported by the Netherlands Organization of Scientific Research NWO Investments (175.010.2005.011, 911-03-012), the Genetic Laboratory of the Department of Internal Medicine, Erasmus MC, the Research Institute for Diseases in the Elderly (014-93-015; RIDE2), and the Netherlands Genomics Initiative (NGI)/Netherlands Organization for Scientific Research (NWO) Netherlands Consortium for Healthy Aging (NCHA), project 050-060-810. All studies are grateful to their participants, faculty and staff. The content of these manuscripts is solely the responsibility of the authors and does not necessarily represent the official views of the National Institutes of Health or the U.S. Department of Health and Human Services. The FUS cohorts include: the Alzheimer’s Disease Centers (ADC) (P30 AG019610, P30 AG013846, P50 AG008702, P50 AG025688, P50 AG047266, P30 AG010133, P50 AG005146, P50 AG005134, P50 AG016574, P50 AG005138, P30 AG008051, P30 AG013854, P30 AG008017, P30 AG010161, P50 AG047366, P30 AG010129, P50 AG016573, P50 AG016570, P50 AG005131, P50 AG023501, P30 AG035982, P30 AG028383, P30 AG010124, P50 AG005133, P50 AG005142, P30 AG012300, P50 AG005136, P50 AG033514, P50 AG005681, and P50 AG047270), Alzheimer’s Disease Neuroimaging Initiative (ADNI) (U19AG024904), Amish Protective Variant Study (RF1AG058066), Cache County Study (R01AG11380, R01AG031272, R01AG21136, RF1AG054052), Case Western Reserve University Brain Bank (CWRUBB) (P50AG008012), Case Western Reserve University Rapid Decline (CWRURD) (RF1AG058267, NU38CK000480), CubanAmerican Alzheimer’s Disease Initiative (CuAADI) (3U01AG052410), Estudio Familiar de Influencia Genetica en Alzheimer (EFIGA) (5R37AG015473, RF1AG015473, R56AG051876), Genetic and Environmental Risk Factors for Alzheimer Disease Among African Americans Study (GenerAAtions) (2R01AG09029, R01AG025259, 2R01AG048927), Gwangju Alzheimer and Related Dementias Study (GARD) (U01AG062602), Hussman Institute for Human Genomics Brain Bank (HIHGBB) (R01AG027944, Alzheimer’s Association “Identification of Rare Variants in Alzheimer Disease”), Ibadan Study of Aging (IBADAN) (5R01AG009956), Mexican Health and Aging Study (MHAS) (R01AG018016), Multi-Institutional Research in Alzheimer’s Genetic Epidemiology (MIRAGE) (2R01AG09029, R01AG025259, 2R01AG048927), Northern Manhattan Study (NOMAS) (R01NS29993), Peru Alzheimer’s Disease Initiative (PeADI) (RF1AG054074), Puerto Rican 1066 (PR1066) (Wellcome Trust (GR066133/GR080002), European Research Council (340755)), Puerto Rican Alzheimer Disease Initiative (PRADI) (RF1AG054074), Reasons for Geographic and Racial Differences in Stroke (REGARDS) (U01NS041588), Research in African American Alzheimer Disease Initiative (REAAADI) (U01AG052410), Rush Alzheimer’s Disease Center (ROSMAP) (P30AG10161, R01AG15819, R01AG17919), University of Miami Brain Endowment Bank (MBB), and University of Miami/Case Western/North Carolina A&T African American (UM/CASE/NCAT) (U01AG052410, R01AG028786). The four LSACs are: the Human Genome Sequencing Center at the Baylor College of Medicine (U54 HG003273), the Broad Institute Genome Center (U54HG003067), The American Genome Center at the Uniformed Services University of the Health Sciences (U01AG057659), and the Washington University Genome Institute (U54HG003079). Biological samples and associated phenotypic data used in primary data analyses were stored at Study Investigators institutions, and at the National Cell Repository for Alzheimer’s Disease (NCRAD, U24AG021886) at Indiana University funded by NIA. Associated Phenotypic Data used in primary and secondary data analyses were provided by Study Investigators, the NIA funded Alzheimer’s Disease Centers (ADCs), and the National Alzheimer’s Coordinating Center (NACC, U01AG016976) and the National Institute on Aging Genetics of Alzheimer’s Disease Data Storage Site (NIAGADS, U24AG041689) at the University of Pennsylvania, funded by NIA This research was supported in part by the Intramural Research Program of the National Institutes of health, National Library of Medicine. Contributors to the Genetic Analysis Data included Study Investigators on projects that were individually funded by NIA, and other NIH institutes, and by private U.S. organizations, or foreign governmental or nongovernmental organizations.
Supplementary Material
The Supplementary Material for this article can be found online at: https://www.frontiersin.org/articles/10.3389/fgene.2021.752390/full#supplementary-material
References
Abyzov, A., Urban, A. E., Snyder, M., and Gerstein, M. (2011). CNVnator: An Approach to Discover, Genotype, and Characterize Typical and Atypical CNVs from Family and Population Genome Sequencing. Genome Res. 21, 974–984. [Internet]Jun [cited 2021 Feb 15]Available from: https://pubmed.ncbi.nlm.nih.gov/21324876/. doi:10.1101/gr.114876.110
Alzheimer's Association (2020). Alzheimer’s Disease Facts and Figures. Alzheimer’s Dement 16, 391–460. [Internet]Mar 1 [cited 2021 Jul 12]Available from: https://pubmed.ncbi.nlm.nih.gov/32157811/.
Beecham, G. W., Bis, J. C., Martin, E. R., Choi, S-H., DeStefano, A. L., Duijn, C. M. van., et al. (2017). The Alzheimer’s Disease Sequencing Project: Study Design and Sample Selection. Neurol. Genet. 3. [Internet]Oct 1 [cited 2021 Jul 29]Available from: /pmc/articles/PMC5646177/. doi:10.1212/NXG.0000000000000194
Beekly, D. L., Ramos, E. M., Lee, W. W., Deitrich, W. D., Jacka, M. E., Wu, J., et al. (2007). The National Alzheimer’s Coordinating Center (NACC) Database: The Uniform Data Set. Alzheimer Dis. Assoc. Disord. 21, 249–258. [cited 2021 Apr 6] Available from: https://www.ncbi.nlm.nih.gov/pmc/articles/PMC5646177/. doi:10.1097/wad.0b013e318142774e
Brouwers, N., Van Cauwenberghe, C., Engelborghs, S., Lambert, J. C., Bettens, K., Le Bastard, N., et al. (2012). Alzheimer Risk Associated with a Copy Number Variation in the Complement Receptor 1 Increasing C3b/C4b Binding Sites. Mol. Psychiatry 17, 223–233. [Internet]Feb 15 [cited 2021 Jul 12]Available from: www.nature.com/mp. doi:10.1038/mp.2011.24
Chang, C. C., Chow, C. C., Tellier, L. C., Vattikuti, S., Purcell, S. M., and Lee, J. J. (2015). Second-generation PLINK: Rising to the challenge of Larger and Richer Datasets. Gigascience 4, 7. [Internet]Dec 1 [cited 2021 Jul 27]Available from: https://academic.oup.com/gigascience/article/4/1/s13742-015-0047-8/2707533. doi:10.1186/s13742-015-0047-8
Chen, S., Krusche, P., Dolzhenko, E., Sherman, R. M., Petrovski, R., Schlesinger, F., et al. (2019). Paragraph: A Graph-Based Structural Variant Genotyper for Short-Read Sequence Data. Genome Biol. 20 (1), 1–13. [Internet]Dec 19 [cited 2021 Jun 23]. doi:10.1186/s13059-019-1909-7
Chung, B. H-Y., Tao, V. Q., and Tso, W. W-Y. (2014). Copy Number Variation and Autism: New Insights and Clinical Implications. J. Formos. Med. Assoc. 113, 400–408. [Internet]Jul [cited 2017 Jun 23]Available from: http://linkinghub.elsevier.com/retrieve/pii/S0929664613000570. doi:10.1016/j.jfma.2013.01.005
Collins, R. L., Brand, H., Karczewski, K. J., Zhao, X., Alföldi, J., Francioli, L. C., et al. (2020). A Structural Variation Reference for Medical and Population Genetics. Nature 581, 444–451. [Internet]May 28 [cited 2021 Apr 8]. doi:10.1038/s41586-020-2287-8
Cooper, G. M., Coe, B. P., Girirajan, S., Rosenfeld, J. A., Vu, T. H., Baker, C., et al. (2011). A Copy Number Variation Morbidity Map of Developmental Delay. Nat. Genet. 43, 838–846. [Internet]Aug 14 [cited 2017 Jun 30]Available from: http://www.ncbi.nlm.nih.gov/pubmed/21841781. doi:10.1038/ng.909
Danecek, P., Bonfield, J. K., Liddle, J., Marshall, J., Ohan, V., Pollard, M. O., et al. (2021). Twelve Years of SAMtools and BCFtools. Gigascience 10, 1–4. [Internet]Jan 29 [cited 2021 Jul 20]Available from: https://academic.oup.com/gigascience/article/10/2/giab008/6137722. doi:10.1093/gigascience/giab008
Eggertsson, H. P., Kristmundsdottir, S., Beyter, D., Jonsson, H., Skuladottir, A., Hardarson, M. T., et al. (2019). GraphTyper2 Enables Population-Scale Genotyping of Structural Variation Using Pangenome Graphs. Nat. Commun. 10. [Internet]Dec 1 [cited 2021 Jun 23]Available from: /pmc/articles/PMC6881350/. doi:10.1038/s41467-019-13341-9
Firth, H. V., Richards, S. M., Bevan, A. P., Clayton, S., Corpas, M., Rajan, D., et al. (2009). DECIPHER: Database of Chromosomal Imbalance and Phenotype in Humans Using Ensembl Resources. Am. J. Hum. Genet. 84 (4), 524–533. [Internet]Apr 10 [cited 2021 Jul 7]. Available from: /pmc/articles/PMC2667985/. doi:10.1016/j.ajhg.2009.03.010
GitHub - brentp/smoove (2021). Structural Variant Calling and Genotyping with Existing Tools, but, Smoothly. [Internet][cited 2021 Jun 24]. Available from: https://github.com/brentp/smoove.
GitHub - DecodeGenetics/svimmer (2021). Structural Variant Merging Tool. [Internet][cited 2021 Jun 24]. Available from: https://github.com/DecodeGenetics/svimmer.
Goate, A. (2006). Segregation of a Missense Mutation in the Amyloid β-protein Precursor Gene with Familial Alzheimer’s Disease [Internet]. J. Alzheimer’s Dis. IOS Press Vol. 9, 341–347. [cited 2021 Jul 12]Available from: https://pubmed.ncbi.nlm.nih.gov/16914872/. doi:10.3233/jad-2006-9s338
Heinzen, E. L., Need, A. C., Hayden, K. M., Chiba-Falek, O., Roses, A. D., Strittmatter, W. J., et al. (2010). Genome-wide Scan of Copy Number Variation in Late-Onset Alzheimer’s Disease. J. Alzheimer’s Dis. 19, 69–77. [Internet][cited 2021 Jul 12]Available from: https://pubmed.ncbi.nlm.nih.gov/20061627/. doi:10.3233/jad-2010-1212
Hickey, G., Heller, D., Monlong, J., Sibbesen, J. A., Sirén, J., Eizenga, J., et al. (2020). Genotyping Structural Variants in Pangenome Graphs Using the Vg Toolkit. Genome Biol. 21, 1–17. [Internet]Feb 12 [cited 2021 Jun 23]. doi:10.1186/s13059-020-1941-7
Kakinuma, H., and Sato, H. (2008). Copy-number Variations Associated with Autism Spectrum Disorder. Pharmacogenomics 9, 1143–1154. [Internet]Aug [cited 2017 Jun 23]Available from: http://www.ncbi.nlm.nih.gov/pubmed/18681787. doi:10.2217/14622416.9.8.1143
Kuzma, A., Valladares, O., Cweibel, R., Greenfest-Allen, E., Childress, D. M., Malamon, J., et al. (2016). NIAGADS: The NIA Genetics of Alzheimer’s Disease Data Storage Site. Alzheimer’s Dement. 12 (11), 1200–1203. doi:10.1016/j.jalz.2016.08.018
Lanoiselée, H. M., Nicolas, G., Wallon, D., Rovelet-Lecrux, A., Lacour, M., Rousseau, S., et al. (2017). APP, PSEN1, and PSEN2 Mutations in Early-Onset Alzheimer Disease: A Genetic Screening Study of Familial and Sporadic Cases. Plos Med. 14. [Internet]Mar 1 [cited 2021 Jul 12]Available from: https://pubmed.ncbi.nlm.nih.gov/28350801/. doi:10.1371/journal.pmed.1002270
Layer, R. M., Chiang, C., Quinlan, A. R., and Hall, I. M. (2014). LUMPY: A Probabilistic Framework for Structural Variant Discovery. Genome Biol. 15, R84. [Internet]Jun 26 [cited 2021 Feb 15]Available from: http://genomebiology.biomedcentral.com/articles/10.1186/gb-2014-15-6-r84. doi:10.1186/gb-2014-15-6-r84
Lee, W-P., Zhu, Q., Yang, X., Liu, S., Cerveira, E., Ryan, M., et al. (2021). JAX-CNV: A Whole Genome Sequencing-Based Algorithm for Copy Number Detection at Clinical Grade Level. medRxiv [Internet]. Mar 17 [cited 2021 Jun 23]. doi:10.1101/2021.03.16.21252173
Lew, A. R., Kellermayer, T. R., Sule, B. P., and Szigeti, K. (2018). Copy Number Variations in Adult-Onset Neuropsychiatric Diseases. Curr. Genomics 19, 420–430. [Internet]Mar 30 [cited 2021 Jul 12]Available from: https://pubmed.ncbi.nlm.nih.gov/30258274/. doi:10.2174/1389202919666180330153842
Malhotra, D., and Sebat, J. (2012). CNVs: Harbingers of a Rare Variant Revolution in Psychiatric Genetics. Cell. Elsevier B.V. 148, 1223–1241. doi:10.1016/j.cell.2012.02.039
McCarroll, S. A., and Altshuler, D. M. (2007). Copy-number Variation and Association Studies of Human Disease. Nat. Genet. 39, S37–S42. [Internet]Jul [cited 2018 Aug 23]Available from: http://www.ncbi.nlm.nih.gov/pubmed/17597780. doi:10.1038/ng2080
Quinlan, A. R., and Hall, I. M. (2010). BEDTools: A Flexible Suite of Utilities for Comparing Genomic Features. Bioinformatics 26, 841–842. [Internet]Jan 28 [cited 2021 Jul 1]Available from: https://pubmed.ncbi.nlm.nih.gov/20110278/. doi:10.1093/bioinformatics/btq033
Ridge, P. G., Mukherjee, S., Crane, P. K., Kauwe, J. S. K., and Consortium, A. D. G. (2013). Alzheimer’s Disease: Analyzing the Missing Heritability. PLoS One 8, e79771. [Internet]Nov 7 [cited 2021 Sep 19]Available from: https://journals.plos.org/plosone/article?id=10.1371/journal.pone.0079771. doi:10.1371/journal.pone.0079771
Saykin, A. J., Swaminathan, S., Kim, S., Shen, L., Risacher, S. L., Foroud, T., et al. (2011). Genomic Copy Number Analysis in Alzheimer’s Disease and Mild Cognitive Impairment: An ADNI Study. Int. J. Alzheimers Dis., 2011. [Internet][cited 2021 Jul 12]Available from: https://pubmed.ncbi.nlm.nih.gov/21660214/. doi:10.4061/2011/729478
Sims, R., Hill, M., and Williams, J. (20202020). The Multiplex Model of the Genetics of Alzheimer’s Disease. Nat. Neurosci. 23323, 311–322. [Internet]Feb 28 [cited 2021 Sep 19]. Available from: https://www.nature.com/articles/s41593-020-0599-5. doi:10.1038/s41593-020-0599-5
Sudmant, P. H., Rausch, T., Gardner, E. J., Handsaker, R. E., Abyzov, A., Huddleston, J., et al. (2015). An Integrated Map of Structural Variation in 2,504 Human Genomes. Nature 526, 75–81. [Internet]Sep 30 [cited 2017 Jun 22]. Available from: http://www.ncbi.nlm.nih.gov/pubmed/26432246. doi:10.1038/nature15394
Sullivan, P. F., Daly, M. J., and O’Donovan, M. (2012). Genetic Architectures of Psychiatric Disorders: The Emerging Picture and its Implications. Nat. Rev. Genet. 13, 537–551. Nature Publishing Group[cited 2021 Jul 12]Available from: www.nature.com/reviews/genetics. doi:10.1038/nrg3240
Szigeti, K., Kellermayer, B., Lentini, J. M., Trummer, B., Lal, D., Doody, R. S., et al. (2014). Ordered Subset Analysis of Copy Number Variation Association with Age at Onset of Alzheimer’s Disease. J. Alzheimer’s Dis. 41, 1063–1071. [Internet][cited 2021 Jul 12]Available from: https://pubmed.ncbi.nlm.nih.gov/24787912/. doi:10.3233/jad-132693
Szigeti, K., Lal, D., Li, Y., Doody, R. S., Wilhelmsen, K., Yan, L., et al. (2013). Genome-wide Scan for Copy Number Variation Association with Age at Onset of Alzheimer’s Disease. J. Alzheimer’s Dis. 33, 517–523. [Internet][cited 2021 Jul 12]Available from: https://pubmed.ncbi.nlm.nih.gov/23202439/. doi:10.3233/JAD-2012-121285
The 1000 Genomes Project Consortium (2010). A Map of Human Genome Variation from Population-Scale Sequencing. Nature 467 (7319), 1061–1073. [Internet]Oct 28 [cited 2013 May 22]. doi:10.1038/nature09534
Zhang, B. (2020). Integrative Analysis Identifies Copy Number Variations and Their Controlled Causal Molecular Networks in Alzheimer’s Disease. Alzheimer’s Dement 16, e043341. [Internet]Dec [cited 2021 Sep 28]Available from: https://onlinelibrary.wiley.com/doi/full/10.1002/alz.043341. doi:10.1002/alz.043341
Zheng, X., Demirci, F. Y., Barmada, M. M., Richardson, G. A., Lopez, O. L., Sweet, R. A., et al. (2015). Genome-wide Copy-Number Variation Study of Psychosis in Alzheimer’s Disease. Transl Psychiatry 5. [Internet]Jun 2 [cited 2021 Jul 12]Available from: https://pubmed.ncbi.nlm.nih.gov/26035058/. doi:10.1038/tp.2015.64
Keywords: copy number variation—CNV, Alzheiemer’s disease, whole-genome sequence (WGS), CNV association test, NGS—next generation sequencing
Citation: Lee W-P, Tucci AA, Conery M, Leung YY, Kuzma AB, Valladares O, Chou Y-F, Lu W, Wang L-S, Schellenberg GD and Tzeng J-Y (2021) Copy Number Variation Identification on 3,800 Alzheimer’s Disease Whole Genome Sequencing Data from the Alzheimer’s Disease Sequencing Project. Front. Genet. 12:752390. doi: 10.3389/fgene.2021.752390
Received: 03 August 2021; Accepted: 11 October 2021;
Published: 04 November 2021.
Edited by:
Claudia Gonzaga-Jauregui, Universidad Nacional Autónoma de México, MexicoReviewed by:
Audrey Qiuyan Fu, University of Idaho, United StatesNancy Monroy-Jaramillo, National Institute of Neurology and Neurosurgery, Mexico
Copyright © 2021 Lee, Tucci, Conery, Leung, Kuzma, Valladares, Chou, Lu, Wang, Schellenberg and Tzeng. This is an open-access article distributed under the terms of the Creative Commons Attribution License (CC BY). The use, distribution or reproduction in other forums is permitted, provided the original author(s) and the copyright owner(s) are credited and that the original publication in this journal is cited, in accordance with accepted academic practice. No use, distribution or reproduction is permitted which does not comply with these terms.
*Correspondence: Wan-Ping Lee, Wan-Ping.Lee@PennMedicine.upenn.edu; Jung-Ying Tzeng, jytzeng@ncsu.edu
†These authors have contributed equally to this work and share first authorship