 Yonglan Liao1
 Zhicheng Wang1Leonardo S. Glória2Kai Zhang3Cuixia Zhang4Rui Yang4Xinmao Luo1Xianbo Jia1
 Song-Jia Lai1*
 Shi-Yi Chen1*
- 1Farm Animal Genetic Resources Exploration and Innovation Key Laboratory of Sichuan Province, Sichuan Agricultural University, Chengdu, China
- 2Laboratory of Animal Science, State University of Northern of Rio de Janeiro, Campos dos Goytacazes, Brazil
- 3Sichuan Academy of Grassland Sciences, Chengdu, China
- 4Animal Breeding and Genetics Key Laboratory of Sichuan Province, Sichuan Animal Science Academy, Chengdu, China
Growth is a complex trait with moderate to high heritability in livestock and must be described by the longitudinal data measured over multiple time points. Therefore, the used phenotype in genome-wide association studies (GWAS) of growth traits could be either the measures at the preselected time point or the fitted parameters of whole growth trajectory. A promising alternative approach was recently proposed that combined the fitting of growth curves and estimation of single-nucleotide polymorphism (SNP) effects into single-step nonlinear mixed model (NMM). In this study, we collected the body weights at 35, 42, 49, 56, 63, 70, and 84 days of age for 401 animals in a crossbred population of meat rabbits and compared five fitting models of growth curves (Logistic, Gompertz, Brody, Von Bertalanffy, and Richards). The logistic model was preferably selected and subjected to GWAS using the approach of single-step NMM, which was based on 87,704 genome-wide SNPs. A total of 45 significant SNPs distributed on five chromosomes were found to simultaneously affect the two growth parameters of mature weight (A) and maturity rate (K). However, no SNP was found to be independently associated with either A or K. Seven positional genes, including KCNIP4, GBA3, PPARGC1A, LDB2, SHISA3, GNA13, and FGF10, were suggested to be candidates affecting growth performances in meat rabbits. To the best of our knowledge, this is the first report of GWAS based on single-step NMM for longitudinal traits in rabbits, which also revealed the genetic architecture of growth traits that are helpful in implementing genome selection.
Introduction
The domestic rabbit (Oryctolagus cuniculus) is an important livestock species in China and has been intensively raised for producing meat, wool, and fur. The most commonly raised type is meat rabbits in China, and the rabbit meat production reached 849,150 tons in 2016, which almost accounted for about 60% of global production (Li et al., 2018). However, progresses on genetic selection and improvement in rabbits have obviously lagged behind in comparison with other livestock species; therefore, the Chinese meat rabbit industry is still largely depending on these imported breeds, such as the Hyla, Hycole, and Hyplus rabbits from France (Qin, 2019). One of the important reasons is the serious lack of relevant studies conducted in rabbits, such as the genome-wide association studies (GWAS) and genomic selection (GS) for the economically important traits. Recently, some pioneer studies were published about the GWAS (Sosa-Madrid et al., 2020; Yang et al., 2020; Bovo et al., 2021) and GS (Chen et al., 2021; Helal et al., 2021; Mancin et al., 2021) in rabbits.
Growth is a complex and economically important trait with moderate to high estimates of heritability in rabbits (Akanno and Ibe, 2005; Dige et al., 2012; Soliman et al., 2014). In contrast to traits that are collected at a single time point (such as litter size and carcass performances), growth must be described by the longitudinal data repeatedly measured over multiple time points. Therefore, the relevant genetic studies on growth in livestock can be implemented through different approaches. The first approach is to select one or a few representative time points and subject them to separate analysis; for instance, the GWAS of growth traits were separately performed among multiple time points of age in meat rabbits (Yang et al., 2020). The second approach is to fit growth curves using nonlinear regression models and obtain the growth curve parameters (such as mature weight and maturity rate), and subsequently, these derived parameters are used as the pseudo-phenotypes for association analysis. This is the classical two-step method and has been commonly found in literature, such as the studies in beef cattle (Crispim et al., 2015; Duan et al., 2021). Furthermore, the two-step method could be followed by an additional step of multi-trait meta-analysis to indirectly combine the multiple parameters together (Duan et al., 2021). Recently, Silva et al. (2017) proposed an alternative modeling framework to integrate the fitting of growth curves and estimation of single-nucleotide polymorphism (SNP) effects simultaneously under nonlinear mixed model (NMM), which was applied to pigs and revealed to have the advantages of higher statistical power and joint modeling of residual effects in comparison with the two-step method. To our best knowledge, this single-step method has not yet been applied to GWAS of growth curves in rabbits.
In this context, we collected the individual growth records from weaning at 35 days of age (DOA) to finishing at 84 DOA in a commercial crossbred population of meat rabbits. Subsequently, the fitting of growth curves and GWAS were simultaneously analyzed using a single-step NMM to identify the prospective candidate variants, genes, and biological processes associated with growth trajectory. These results could be helpful in understanding the biological mechanisms underlying growth and implementing GS of growth traits in rabbits.
Materials and Methods
Animals and Phenotypes
One commercial crossbred population of meat rabbits, by crossing 22 Kangda5 rabbits (♂) with 53 Californian rabbits (♀), was subjected to collection of phenotypic records, which was described in our previous study (Yang et al., 2020). In brief, individual body weight (BW) was initially measured for 461 rabbits at seven time points, including 35, 42, 49, 56, 63, 70, and 84 DOA, respectively. At each time point, the phenotypic records were set to missing values if they deviated by more than three standard deviations (SD) from the population mean. As the short time intervals were measured, the individual BW was allowed to be slightly decreased (<5%) between two consecutive time points; otherwise, the latter record was set to missing value. The individuals that have more than two missing values at the seven time points were also removed, after which 405 individuals remained. No pedigree information is available for this population.
Genotypes and Quality Controls
For the initial SNP set that was generated from specific-locus amplified fragment sequencing approach (Yang et al., 2020), we reapplied more strict criterion of quality control (QC) using the filtering expression of “QualByDepth (QD) < 2.0 || FisherStrand (FS) > 60.0 || RMSMappingQuality (MQ) < 40.0” intrinsically implemented in GATK software v4.2 (McKenna et al., 2010). A total of 6,721,762 SNPs were obtained and subjected to additional QC steps using PLINK software v1.9 (Chang et al., 2015), which required the genotype missing rate lower than 0.1, individual missing rate lower than 0.2, minor allele frequency (MAF) higher than 0.05, and no extreme deviation from Hardy–Weinberg equilibrium (i.e., only retained SNPs with p > 1.0E−08). Furthermore, the missing genotypes were imputed using Beagle software v5.1 with default parameters (Browning et al., 2018). Using PLINK software v1.9 (Chang et al., 2015), the tightly linked SNPs were further discarded if the linkage disequilibrium (LD) values were higher than 0.9. Finally, 87,704 SNPs were used for GWAS among 401 individuals (215 males and 186 females), and these SNPs were distributed among all 21 rabbit autosomes (OCU). To investigate population structure, principal component analysis (PCA) was performed based on the finally included genotypes using PLINK software v1.9 (Chang et al., 2015).
Modeling of Growth Curves
Five nonlinear regression models were evaluated for fitting the growth curves (Koya and Goshu, 2013), including the logistic of
Genome-Wide Association Studies
The logistic was selected as best model (see Results section) and therefore used for the GWAS of growth curves through single-step NMM following Silva et al. (2017). This method fitted the two biological meaningful parameters of growth curves (i.e.,
where
where
According to Silva et al. (2017), the SNP effects could be further integrated into the null model through three different ways. First, the SNP effects are assumed to simultaneously affect both
where
The fitting of these four NMM was performed using the nlme package of R (Heisterkamp et al., 2017). Based on the likelihood ratio test (LRT), the statistical significance of SNP effects could be deduced by comparing the specific alternative hypotheses (i.e., the model of M1, M2, or M3) with the null hypothesis of M0, respectively. The derived LRT statistics are assumed to follow
Functional Analysis
In this study, the QTLs were empirically defined as chromosomal regions of ±100 kb around the significant SNPs (i.e., a total of 200-kb genomic region was selected). The candidate genes within QTL, including protein encoding and long non-coding RNAs (lncRNA), were retrieved using the biomaRt R package (Smedley et al., 2015). The OryCun2.0 assembly was used as the reference genome (https://www.ncbi.nlm.nih.gov/genome/?term=rabbit). For all the candidate genes, the functional enrichments were conducted using the DAVID tool (Huang et al., 2009), including the Gene Ontology (GO) terms (The Gene Ontology Consortium, 2019) and Kyoto Encyclopedia of Genes and Genomes (KEGG) pathway (Kanehisa et al., 2019). The default parameters and method of multiple testing correction were used for computing p–values, and the threshold of 0.05 was set.
Results
Descriptive Statistics
For the 401 finally included individuals, the descriptive statistics of BW at the seven time points are shown in Table 1, and their normal distributions were visually checked at every time points (Supplementary Figure S1). The 87,704 SNPs were distributed among 21 autosomes with the mean (±SD) of 24,099 ± 59,103 bp for their pairwise physical distances and 0.256 ± 0.133 for MAF, respectively (Supplementary Figure S2).
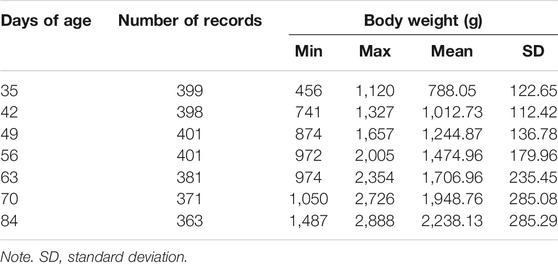
TABLE 1. The descriptive statistics of body weight at the seven time points.
Fitted Growth Curves
The growth curves of all individuals were successfully fitted using the four candidate models of logistic (AIC = 35,667.62 and BIC = 35,697.32), Gompertz (AIC = 35,699.36 and BIC = 35,729.06), Brody (AIC = 35,830.33 and BIC = 35,860.03), and Von Bertalanffy (AIC = 37,737.74 and BIC = 37,767.44), whereas the model of Richards did not converge and was therefore excluded for comparison (Figure 1; Supplementary Table S1). Among the four NMM successfully fitted, the logistic model showed the best goodness of fit with the lowest values of AIC and BIC, and was selected for the following GWAS. The estimates of parameter A and K of the logistic growth curves were 2,615.45 and 0.054, respectively. Furthermore, the growth curves of females and males were separately fitted, which also supported the logistic model having the best goodness of fit and similar growth parameters (Supplementary Table S1). There were only small differences for the A and K parameters estimated between males and females.
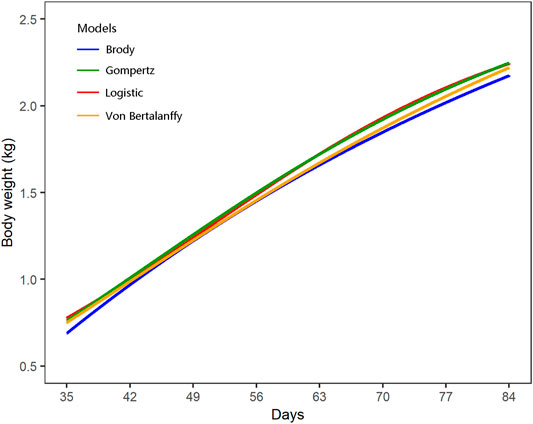
FIGURE 1. Fitting of growth curves using the four nonlinear regression models.
Association Analyses
Based on the PCA results (Supplementary Figure S3), no obvious population stratification was observed in this population studied. The first five PCs explained about 58.9% of total variability, which were included in the NMM as fixed effects with alleviated convergence problems. A total of 45 significant SNPs were revealed to simultaneously affect both parameter A and K, which were distributed among five chromosomes, OCU2, OCU4, OCU9, OCU11, and OCU19 (Figure 2; Table 2). Among them, the highest numbers of significant SNPs were observed on OCU2 (N = 41), and the three most significant SNPs were located on OCU2 (p = 5.98E−08), OCU4 (p = 7.51E−08), and OCU2 (p = 2.22E−07), respectively. All the 45 significant SNPs were clustered into 24 QTLs, and three of their QTLs (OCU2: 13.67–13.99 Mb, OCU2: 21.86–22.25 Mb, OCU2: 22.45–22.77 Mb) were identified based on three or more SNPs (Table 2). When considering the SNP effect separately for either parameter A or K, no significant SNP was identified at the predefined threshold (Figure 2). However, some suggestive associations were also observed (with p lower or close to 1.0E−05), such as the SNPs on OCU2, OCU3, OCU11, and OCU19 for parameter A, and OCU8 and OCU11 for parameter K.
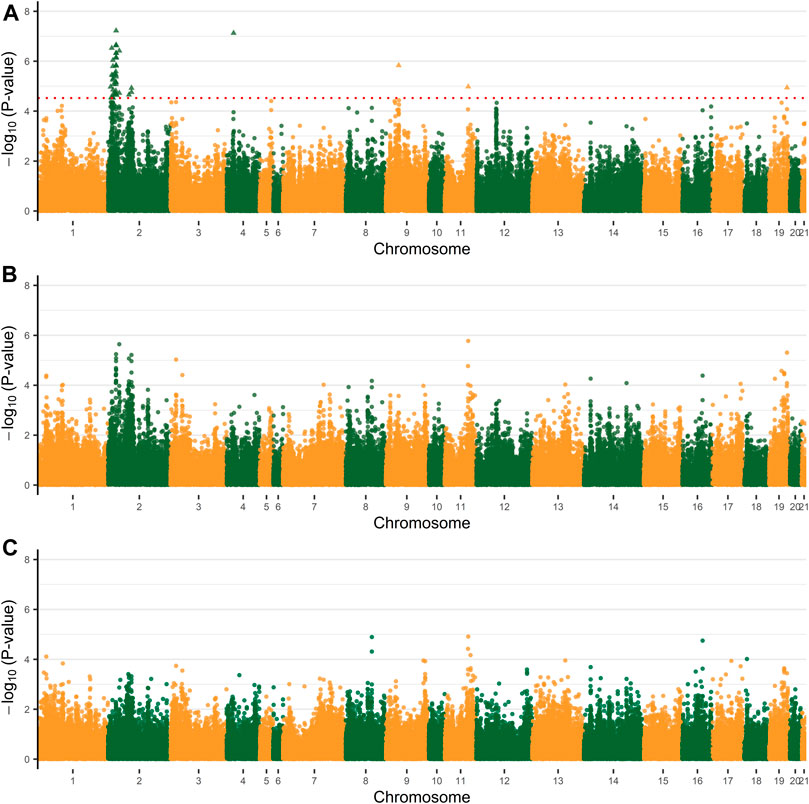
FIGURE 2. Manhattan plots of genome-wide association analysis (GWAS) for mature weight (A), maturity rate (K). (A) The Manhattan plot of both the parameter A and K. (B) The Manhattan plot of the parameter A. (C) The Manhattan plot of the parameter K. The dashed line of red indicates a 5% FDR-corrected threshold and the significant single-nucleotide polymorphisms (SNPs) are represented by triangles.
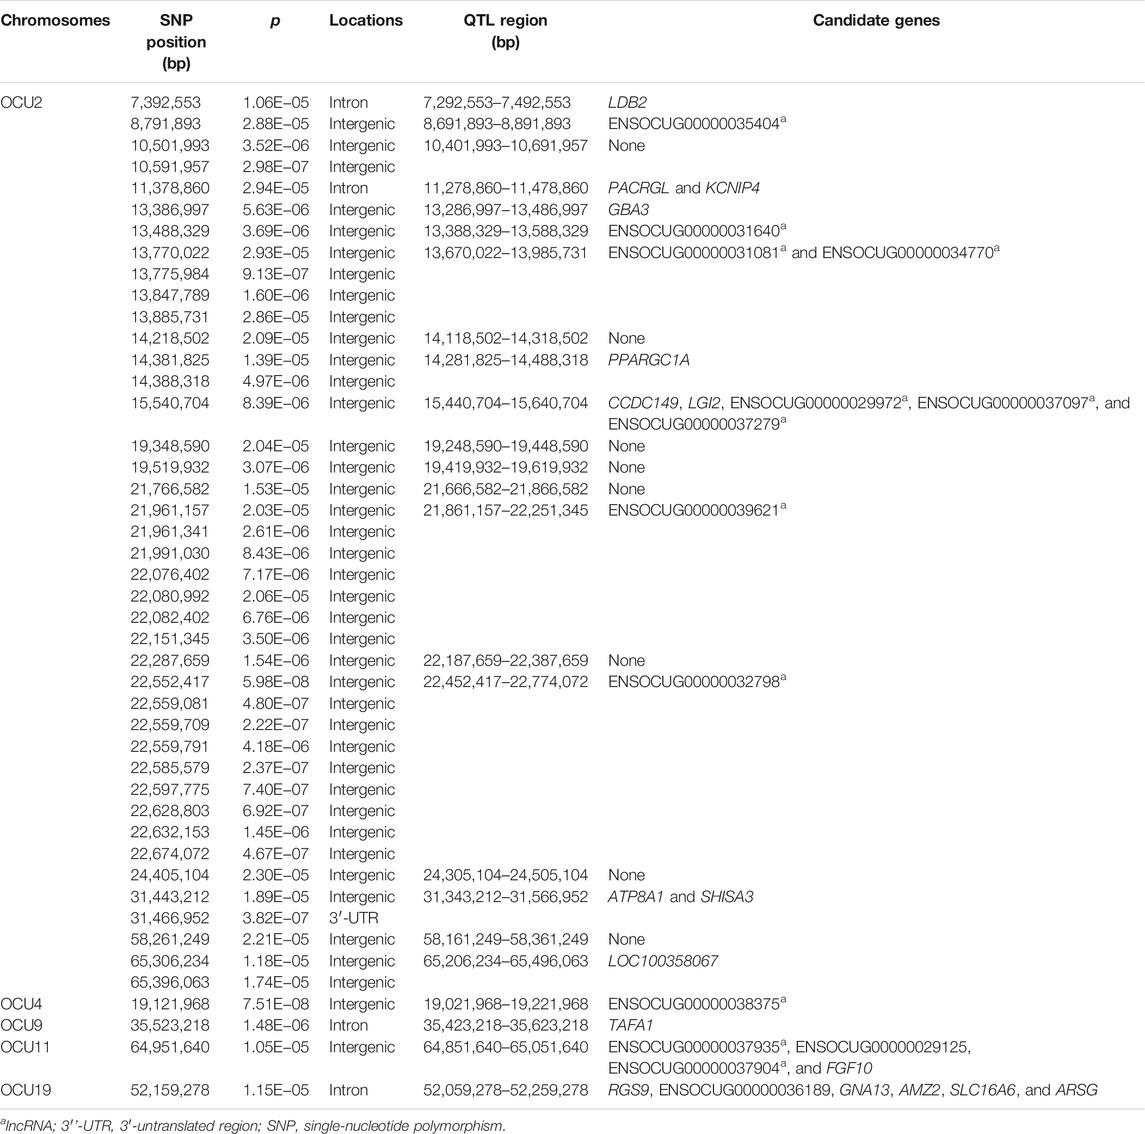
TABLE 2. Significant SNPs, QTLs, and candidate genes simultaneously affect both parameter A and K of the logistic growth curve in rabbits.
Candidate Genes and Functional Analyses
Within the 24 candidate QTLs regarding the significant SNP effects on both parameter A and K, a total of 19 protein-coding and 12 lncRNA positional candidate genes were identified (Table 2). Of these, four [LIM domain-binding 2 (LDB2), potassium voltage-gated channel interacting protein 4 (KCNIP4), TAFA chemokine like family member 1 (TAFA1), and G protein subunit alpha 13 (GNA13)] and one [ATPase phospholipid transporting 8A1 (ATP8A1)] candidate genes were found to have the significant SNPs located on intron and 3′-untranslated region (3′-UTR), respectively. Furthermore, three protein-coding genes located on OCU2 were supported by more than one significant SNPs, including the peroxisome proliferator-activated receptor gamma coactivator-1 alpha (PPARGC1A), ATPase phospholipid transporting 8A1 (ATP8A1), and shisa family member 3 (SHISA3) gene. Two lncRNA genes (ENSOCUG00000039621 and ENSOCUG00000032798) had seven and nine significant SNPs that were located on intergenic regions, respectively. The detailed information of these positional candidate genes is shown in Supplementary Table S2.
For these positional candidate genes, 19 biological processes of GO terms were significantly enriched (p < 0.05, Supplementary Table S3). However, no significant KEGG pathway was found. Four genes of GNA13, ATP8A1, LDB2, and fibroblast growth factor 10 (FGF10) were observed in eight GO terms that were mainly involved in the cell development, such as the biological processes of “regulation of cell migration” and “regulation of cell motility.” Furthermore, both LDB2 and FGF10 were enriched in the five GO terms that have the functional implications into growth, such as the biological processes of “somatic stem cell population maintenance” and “maintenance of cell number.”
Discussion
Growth traits have considerable economic implications in meat rabbit industry. For Gabali rabbits in Egypt, the heritability estimates were 0.19, 0.23, 0.16, and 0.14 for BW at 4, 8, 12, and 16 weeks of age (Soliman et al., 2014), which suggested a moderate heritability for these growth traits. The estimated heritability of individual BW ranged from 0.11 at 9 weeks of age to 0.43 at 6 weeks of age in New Zealand White and Dutch breeds of rabbits (Akanno and Ibe, 2005). The moderate to high heritability (from 0.266 to 0.540) was similarly estimated using both Sire Model and Animal Model in New Zealand White rabbits (Dige et al., 2012). Abou Khadiga et al. (2008) conducted the genetic evaluation in crossbred population of Spanish synthetic maternal line V and Egyptian Baladi Black, and found that growth traits were significantly affected by direct genetic effects. Furthermore, the genotype × environment interaction was also observed for affecting growth performances in growing rabbits (Zeferino et al., 2011). Together, these studies indicated that the improvement of growth traits by genetic selection is much feasible in rabbits. However, the relevant studies in rabbits, such as genomic evaluation and GWAS, have largely lagged behind in comparison with other livestock species (Jonas and Koning, 2015). Therefore, in this study, we performed the association analyses for individual BW at different growth time points using the genome-wide variants. As a relatively limited number of rabbits were included in the present study, however, the increased detection power of GWAS would be expected using larger datasets in future studies.
Like milk production traits in dairy livestock, the individual growth has been preferably described by longitudinal records measured over multiple time points. In practices, the phenotypic records at one or a few time points could be representatively selected and analyzed. However, an alternative approach is to fit the whole growth trajectory using nonlinear regression models and then use the derived model parameters for describing individual growth performance. In an early study (Ptak et al., 1994), three nonlinear models of Von Bertalanffy, Gompertz, and logistic were compared for fitting the growth in purebred and crossbred rabbits, and found that the Von Bertalanffy gave the best fit. The Gompertz growth curves were fitted and used in analyzing the effect of selection for growth rate on growth curves in rabbits (Blasco et al., 2003). Recently, Ding et al. (2019) fitted the growth curves using the logistic, Gompertz, and Von Bertalanffy models for crossbred population of California rabbit × New Zealand white rabbit and suggested that the most accurate model was logistic. In this study, the logistic was chosen as the best model to describe the growth trajectory of our crossbred population that was generated by crossing Kangda5 rabbits with Californian rabbits, which was consistent with the results of Ding et al. (2019). Therefore, the selection of the best model to fit the growth curve in rabbits would be breed or population dependent, which should be specifically compared in each study.
In livestock and poultry, mature weight and maturity rate are the two important parameters for describing growth performance; some individuals have higher maturity rate but smaller mature weight, and vice versa. Therefore, to identify genes or causal mutations independently affecting the mature weight and maturity rate is essential for implementing precision improvement of genetic selection. Using the estimated growth parameters as pseudo-phenotypes in GWAS of growth traits in Brahman cattle, a large number of significant SNPs were identified to be associated with mature weight and maturity rate, respectively (Crispim et al., 2015). A similar GWAS was recently reported for growth traits of Chinese Simmental beef cattle, which also revealed different SNPs for the two parameters (Duan et al., 2021). Silva et al. (2017) proposed an alternative method to combine the fitting of growth curves and estimation of SNP effects into one single-step NMM, and to apply to growth traits in pigs with an improved statistical power observed. In this study, we also employed the single-step NMM approach for GWAS of growth traits in a crossbred population of rabbits and found that all the significant SNPs simultaneously affected the two parameters of mature weight and maturity rate. The absence of SNPs independently associated with either mature weight or maturity rate would indicate the specific genetic architecture of growth performance for this studied population. Also, the number of significant SNPs identified in this study was also higher than our former observation (Yang et al., 2020) that was alternatively performed through the separate association analysis with BW at different time points. However, no growth curve parameter was estimated and used as pseudo-phenotype of association analysis by Yang et al. (2020), which would disable the direct comparison.
Around the significant SNPs identified in this study, we found some candidate genes that have the functional implications on growth traits in literature. Among them, the KCNIP4, a member of the family of voltage-gated potassium channel-interacting proteins, was found to be located within the QTL between the 21 and 67 cM regions of chromosome 6 that was associated with birth weight in Zandi sheep (Esmailizadeh, 2010; Mohammadi et al., 2020). Pasandideh et al. (2018) also suggested that the KCNIP4 gene was involved in the regulation of muscle growth and fat deposition in sheep. In chicken, Jin et al. (2015) found that KCNIP4 was located nearest to a significant SNP associated with the BW of 10 and 14 weeks of age. A nearby gene of GBA3 (glucosylceramidase beta 3) is related to hydrolyze beta-galactose and beta-glucose (Dekker et al., 2011), and was further found to be significantly associated with BW traits in sheep (Al-Mamun et al., 2015). In this study, one significant SNP was detected in the intron of LDB2, which is a transcriptional regulator (Johnsen et al., 2009) and was found to affect the growth traits of BW and average daily gain in chicken (Gu et al., 2011; Wang et al., 2019) and of BW in Nanjiang Yellow sheep (Guo et al., 2018).
Another important candidate gene is PPARGC1A, which was found in pigs to regulate the lipid deposition (Li et al., 2014b), composition of muscle fiber (Lee et al., 2012), and abdominal fat content (Stachowiak et al., 2007). Several SNPs have been identified in PPARGC1A gene to be associated with adult BW and average daily gain in Nanyang cattle (Li et al., 2014a), yearling weight in Nelore cattle (Fonseca et al., 2015), and birth weight and calf birth weight in Iranian Holstein cattle (Pasandideh, 2020). Furthermore, Chen et al. (2020) found a 17-bp InDel mutation within the 11th intron of PPARGC1A gene in sheep, which was associated with the BW. Both GNA13 and SHISA3 could affect individual growth as they are involved in the biological regulation of osteoclastogenesis and bone development (Wu et al., 2017; Murakami et al., 2019). Furthermore, we observed that the FGF10 gene located on OCU11 was significantly associated with both mature weight and maturity rate. Previous studies revealed that FGF10 could promote the proliferation and differentiation of adipocyte through the Ras/MAKP pathway (Konishi et al., 2006), and regulate adipogenesis in muscle tissue of goats (Xu et al., 2018) and Tibetan chickens (Zhang et al., 2018). We did not find the relevant publication in literature about functional implications for the 12 candidate lncRNA genes found in this study.
The post-GWAS functional studies are necessary for fine mapping the causal genetic variants and dissecting the underlying biological mechanism (Gallagher and Chen-Plotkin, 2018). Therefore, these candidate genes found in this study could be preferably selected in future studies to investigate their functional mechanisms affecting the individual growth in rabbits. On the other hand, these significant SNPs and genomic regions could be incorporated into the genomic prediction models with an improved accuracy, by using the weighted genomic best linear unbiased prediction (Zhang et al., 2016) or Bayesian (van den Berg et al., 2020) approaches.
Conclusion
In the crossbred population of meat rabbits, we employed the nonlinear mixed model to simultaneously fit growth curves and estimate SNP effects at the genome-wide level. The significant SNPs on five chromosomes (OCU2, OCU4, OCU9, OCU11, and OCU19) were found to simultaneously affect the mature weight and maturity rate, which further revealed some suggestive candidate genes, including the KCNIP4, GBA3, PPARGC1A, LDB2, SHISA3, GNA13, and FGF10. These obtained results are useful to increase our knowledge about growth mechanisms in rabbits, and could be used for improving the accuracy of genomic selection in this population.
Data Availability Statement
The original contributions presented in the study are included in the article/Supplementary Material, further inquiries can be directed to the corresponding authors.
Ethics Statement
Ethical review and approval was not required for the animal study because all data used in this study was obtained from the previous study.
Author Contributions
YL, S-YC, and S-JL conceived, designed, and coordinated this research. YL and ZW performed the data analysis with technical assistance from LG and S-YC. YL wrote the initial version of the manuscript. KZ, CZ, RY, XL, XJ, and S-JL provided all the datasets. All authors interpreted the results and edited the manuscript. All authors read and approved the final manuscript.
Funding
This study was financially supported by National Natural Science Foundation of China (32072684), Earmarked Fund for China Agriculture Research System (Grant No. CARS-44-A-2), and Science and Technology Department of Sichuan Province (2021YFYZ0033).
Conflict of Interest
The authors declare that the research was conducted in the absence of any commercial or financial relationships that could be construed as a potential conflict of interest.
Publisher’s Note
All claims expressed in this article are solely those of the authors and do not necessarily represent those of their affiliated organizations, or those of the publisher, the editors and the reviewers. Any product that may be evaluated in this article, or claim that may be made by its manufacturer, is not guaranteed or endorsed by the publisher.
Supplementary Material
The Supplementary Material for this article can be found online at: https://www.frontiersin.org/articles/10.3389/fgene.2021.750939/full#supplementary-material
References
Abou Khadiga, G., Saleh, K., Nofal, R., and Baselga, M. (2008). “Genetic Evaluation of Growth Traits in a Crossbreeding experiment Involving Line V and Baladi Black Rabbits in Egypt,” in Proceedings of the 9th World Rabbit Congress (WRC), Verona, Italy, June 10–13, 2008.
Akaike, H. (1974). A New Look at the Statistical Model Identification. IEEE Trans. Automat. Contr. 19, 716–723. doi:10.1109/TAC.1974.1100705
Akanno, E. C., and Ibe, S. N. (2005). Estimates of Genetic Parameters for Growth Traits of Domestic Rabbits in the Humid Tropics. Livestock Res. Rural Dev. 17, 86.
Al-Mamun, H. A., Kwan, P., Clark, S. A., Ferdosi, M. H., Tellam, R., and Gondro, C. (2015). Genome-wide Association Study of Body Weight in Australian Merino Sheep Reveals an Orthologous Region on OAR6 to Human and Bovine Genomic Regions Affecting Height and Weight. Genet. Sel. Evol. 47, 66. doi:10.1186/s12711-015-0142-4
Blasco, A., Piles, M., and Varona, L. (2003). A Bayesian Analysis of the Effect of Selection for Growth Rate on Growth Curves in Rabbits. Genet. Sel. Evol. 35, 21–41. doi:10.1186/1297-9686-35-1-21
Bovo, S., Schiavo, G., Utzeri, V. J., Ribani, A., Schiavitto, M., Buttazzoni, L., et al. (2021). A Genome‐wide Association Study for the Number of Teats in European Rabbits ( Oryctolagus cuniculus ) Identifies Several Candidate Genes Affecting This Trait. Anim. Genet. 52, 237–243. doi:10.1111/age.13036
Browning, B. L., Zhou, Y., and Browning, S. R. (2018). A One-Penny Imputed Genome from Next-Generation Reference Panels. Am. J. Hum. Genet. 103, 338–348. doi:10.1016/j.ajhg.2018.07.015
Chang, C. C., Chow, C. C., Tellier, L. C., Vattikuti, S., Purcell, S. M., and Lee, J. J. (2015). Second-generation PLINK: Rising to the challenge of Larger and Richer Datasets. GigaSci 4, 7. doi:10.1186/s13742-015-0047-8
Chen, P., Zhao, H., Wu, M., He, S., Yuan, T., Yi, X., et al. (2020). A Novel 17 Bp InDel Polymorphism within the PPARGC1A Gene Is Significantly Associated with Growth Traits in Sheep. Anim. Biotechnol. 8, 1–9. doi:10.1080/10495398.2020.1796697
Chen, S., Jia, X., and Lai, S. (2021). Evaluation of the Accuracy of Genome Selection in Rabbits. Chin. J. Rabbit Farming 1, 8–11. (in Chinese): CNKI:SUN:ZGYT.0.2021-01-003.
Crispim, A. C., Kelly, M. J., Guimarães, S. E. F., e Silva, F. F., Fortes, M. R. S., Wenceslau, R. R., et al. (2015). Multi-trait GWAS and New Candidate Genes Annotation for Growth Curve Parameters in Brahman Cattle. PLoS One 10, e0139906. doi:10.1371/journal.pone.0139906
Dekker, N., Voorn-Brouwer, T., Verhoek, M., Wennekes, T., Narayan, R. S., Speijer, D., et al. (2011). The Cytosolic β-glucosidase GBA3 Does Not Influence Type 1 Gaucher Disease Manifestation. Blood Cell Mol. Dis. 46, 19–26. doi:10.1016/j.bcmd.2010.07.009
Dige, M. S., Kumar, A., Kumar, P., Dubey, P. P., and Bhushan, B. (2012). Estimation of Variance Components and Genetic Parameters for Growth Traits in New Zealand white Rabbit (Oryctolagus cuniculus). J. Appl. Anim. Res. 40, 167–172. doi:10.1080/09712119.2011.645037
Ding, P., Jia, X., Chen, S., Gu, S., Hu, S., Wang, J., et al. (2019). Comparison and Analysis of California Rabbit × New Zealand white Rabbit (F1), F1 Random Mating Population (F2) Growth Curve Model Fitting. Chin. J. Rabbit Farming 6, 7–11. (in Chinese): CNKI:SUN:ZGYT.0.2019-06-003.
Duan, X., An, B., Du, L., Chang, T., Liang, M., Yang, B.-G., et al. (2021). Genome-wide Association Analysis of Growth Curve Parameters in Chinese Simmental Beef Cattle. Animals 11, 192. doi:10.3390/ani11010192
Esmailizadeh, A. K. (2010). A Partial Genome Scan to Identify Quantitative Trait Loci Affecting Birthweight in Kermani Sheep. Small Ruminant Res. 94, 73–78. doi:10.1016/j.smallrumres.2010.07.003
Fonseca, P. D. D. S., de Souza, F. R. P., de Camargo, G. M. F., Gil, F. M. M., Cardoso, D. F., Zetouni, L., et al. (2015). Association of ADIPOQ , OLR1 and PPARGC1A Gene Polymorphisms with Growth and Carcass Traits in Nelore Cattle. Meta Gene 4, 1–7. doi:10.1016/j.mgene.2015.02.001
Gallagher, M. D., and Chen-Plotkin, A. S. (2018). The post-GWAS Era: from Association to Function. Am. J. Hum. Genet. 102, 717–730. doi:10.1016/j.ajhg.2018.04.002
Gu, X., Feng, C., Ma, L., Song, C., Wang, Y., Da, Y., et al. (2011). Genome-wide Association Study of Body Weight in Chicken F2 Resource Population. PLoS One 6, e21872. doi:10.1371/journal.pone.0021872
Guo, J., Tao, H., Li, P., Li, L., Zhong, T., Wang, L., et al. (2018). Whole-genome Sequencing Reveals Selection Signatures Associated with Important Traits in Six Goat Breeds. Sci. Rep. 8, 10405. doi:10.1038/s41598-018-28719-w
Heisterkamp, S. H., Willigen, E. v., Diderichsen, P.-M., and Maringwa, J. (2017). Update of the Nlme Package to Allow a Fixed Standard Deviation of the Residual Error. R Journal. 9, 239–251. doi:10.32614/RJ-2017-010
Helal, M., Hany, N., Maged, M., Abdelaziz, M., Osama, N., Younan, Y. W., et al. (2021). Candidate Genes for Marker-Assisted Selection for Growth, Carcass and Meat Quality Traits in Rabbits. Anim. Biotechnol. 4, 1–20. doi:10.1080/10495398.2021.1908315
Huang, D. W., Sherman, B. T., and Lempicki, R. A. (2009). Systematic and Integrative Analysis of Large Gene Lists Using DAVID Bioinformatics Resources. Nat. Protoc. 4, 44–57. doi:10.1038/nprot.2008.211
Jin, C. F., Chen, Y. J., Yang, Z. Q., Shi, K., and Chen, C. K. (2015). A Genome-wide Association Study of Growth Trait-Related Single Nucleotide Polymorphisms in Chinese Yancheng Chickens. Genet. Mol. Res. 14, 15783–15792. doi:10.4238/2015.December.1.30
Johnsen, S. A., Güngör, C., Prenzel, T., Riethdorf, S., Riethdorf, L., Taniguchi-Ishigaki, N., et al. (2009). Regulation of Estrogen-dependent Transcription by the LIM Cofactors CLIM and RLIM in Breast Cancer. Cancer Res. 69, 128–136. doi:10.1158/0008-5472.CAN-08-1630
Jonas, E., and Koning, D.-J. d. (2015). Genomic Selection Needs to Be Carefully Assessed to Meet Specific Requirements in Livestock Breeding Programs. Front. Genet. 6, 49. doi:10.3389/fgene.2015.00049
Kanehisa, M., Sato, Y., Furumichi, M., Morishima, K., and Tanabe, M. (2019). New Approach for Understanding Genome Variations in KEGG. Nucleic Acids Res. 47, D590–D595. doi:10.1093/nar/gky962
Konishi, M., Asaki, T., Koike, N., Miwa, H., Miyake, A., and Itoh, N. (2006). Role of Fgf10 in Cell Proliferation in white Adipose Tissue. Mol. Cell Endocrinol. 249, 71–77. doi:10.1016/j.mce.2006.01.010
Koya, P. R., and Goshu, A. T. (2013). Generalized Mathematical Model for Biological Growths. Open Journal of Modelling and Simulation 01, 42–53. doi:10.4236/ojmsi.2013.14008
Lee, J.-S., Kim, J.-M., Hong, J.-S., Lim, K.-S., Hong, K.-C., and Lee, Y. S. (2012). Effects of Polymorphisms in the 3′ Untranslated Region of the Porcine PPARGC1A Gene on Muscle Fiber Characteristics and Meat Quality Traits. Mol. Biol. Rep. 39, 3943–3950. doi:10.1007/s11033-011-1173-8
Li, Q., Wang, Z., Zhang, B., Lu, Y., Yang, Y., Ban, D., et al. (2014a). Single Nucleotide Polymorphism Scanning and Expression of the Pig PPARGC1A Gene in Different Breeds. Lipids 49, 1047–1055. doi:10.1007/s11745-014-3928-1
Li, M., Liu, M., Liu, D., Lan, X., Lei, C., and Chen, H. (2014b). The Novel Coding Region SNPs of PPARGC1A Gene and Their Associations with Growth Traits in Chinese Native Cattle. Mol. Biol. Rep. 41, 39–44. doi:10.1007/s11033-013-2835-5
Li, S., Zeng, W., Li, R., Hoffman, L. C., He, Z., Sun, Q., et al. (2018). Rabbit Meat Production and Processing in China. Meat Sci. 145, 320–328. doi:10.1016/j.meatsci.2018.06.037
Mancin, E., Sosa-Madrid, B. S., Blasco, A., and Ibáñez-Escriche, N. (2021). Genotype Imputation to Improve the Cost-Efficiency of Genomic Selection in Rabbits. Animals 11, 803. doi:10.3390/ani11030803
McKenna, A., Hanna, M., Banks, E., Sivachenko, A., Cibulskis, K., Kernytsky, A., et al. (2010). The Genome Analysis Toolkit: a MapReduce Framework for Analyzing Next-Generation DNA Sequencing Data. Genome Res. 20, 1297–1303. doi:10.1101/gr.107524.110
Mohammadi, H., Rafat, S. A., Shahrbabak, H. M., Shodja, J., and Moradi, M. H. (2020). Genome-wide Association Study and Gene Ontology for Growth and Wool Characteristics in Zandi Sheep. J. Livestock Sci. Technol. 8, 45–55. doi:10.22103/JLST.2020.15795.1317
Murakami, K., Zhifeng, H., Suzuki, T., Kobayashi, Y., and Nakamura, Y. (2019). The Shisa3 Knockout Mouse Exhibits normal Bone Phenotype. J. Bone Miner. Metab. 37, 967–975. doi:10.1007/s00774-019-01014-y
Pasandideh, M., Rahimi-Mianji, G., and Gholizadeh, M. (2018). A Genome Scan for Quantitative Trait Loci Affecting Average Daily Gain and Kleiber Ratio in Baluchi Sheep. J. Genet. 97, 493–503. doi:10.1007/s12041-018-0941-9
Pasandideh, M. (2020). Two SNPs in the Bovine PPARGC1A Gene Are Associated with the Birth Weight of Holstein Calves. Meta Gene 25, 100732. doi:10.1016/j.mgene.2020.100732
Ptak, E., Bieniek, J., and Jagusiak, W. (1994). “Comparison of Growth Curves of Purebred and Crossbred Rabbits,” in Proceedings of the 5th World Congress of Genetic Applied to Livestock Production (WCGALP), Guelph, Canada, August 7–12, 1994.
Qin, Y. H. (2019). Rabbit Breeding Technology and Seed Industry Development. Feed and Husbandry 2, 53–57. (in Chinese): CNKI:SUN:SNCM.0.2019-02-012.
Schwarz, G. (1978). Estimating the Dimension of a Model. Ann. Statist. 6, 461–464. doi:10.1214/aos/1176344136
Silva, F. F. E., Zambrano, M. F. B., Varona, L., Glória, L. S., Lopes, P. S., Silva, M. V. G. B., et al. (2017). Genome Association Study through Nonlinear Mixed Models Revealed New Candidate Genes for Pig Growth Curves. Sci. Agric. (Piracicaba, Braz. 74, 1–7. doi:10.1590/1678-992x-2016-0023
Smedley, D., Haider, S., Durinck, S., Pandini, L., Provero, P., Allen, J., et al. (2015). The BioMart Community portal: an Innovative Alternative to Large, Centralized Data Repositories. Nucleic Acids Res. 43, W589–W598. doi:10.1093/nar/gkv350
Soliman, H., Gad, S., and Esmail, I. (2014). Genetic Parameters for Post-weaning Growth Traits of Gabali Rabbits in Egypt. Egyptian Poultry Science Journal 34, 655–664. doi:10.21608/epsj.2014.32587
Sosa‐Madrid, B. S., Santacreu, M. A., Blasco, A., Fontanesi, L., Pena, R. N., and Ibáñez‐Escriche, N. (2020). A Genomewide Association Study in Divergently Selected Lines in Rabbits Reveals Novel Genomic Regions Associated with Litter Size Traits. J. Anim. Breed. Genet. 137, 123–138. doi:10.1111/jbg.12451
Stachowiak, M., Szydlowski, M., Cieslak, J., and Switonski, M. (2007). SNPs in the Porcine PPARGC1a Gene: Interbreed Differences and Their Phenotypic Effects. Cell. Mol. Biol. Lett. 12, 231–239. doi:10.2478/s11658-006-0066-7
Storey, J. D., Taylor, J. E., and Siegmund, D. (2004). Strong Control, Conservative point Estimation and Simultaneous Conservative Consistency of False Discovery Rates: a Unified Approach. J. R. Stat. Soc B 66, 187–205. doi:10.1111/j.1467-9868.2004.00439.x
The Gene Ontology Consortium (2019). The Gene Ontology Resource: 20 Years and Still GOing strong. Nucleic Acids Res. 47, D330–D338. doi:10.1093/nar/gky1055
van den Berg, I., MacLeod, I. M., Reich, C. M., Breen, E. J., and Pryce, J. E. (2020). Optimizing Genomic Prediction for Australian Red Dairy Cattle. J. Dairy Sci. 103, 6276–6298. doi:10.3168/jds.2019-17914
Wang, W. H., Wang, J. Y., Zhang, T., Wang, Y., Zhang, Y., and Han, K. (2019). Genome‐wide Association Study of Growth Traits in Jinghai Yellow Chicken Hens Using SLAF‐seq Technology. Anim. Genet. 50, 175–176. doi:10.1111/age.12346
Wu, M., Chen, W., Lu, Y., Zhu, G., Hao, L., and Li, Y.-P. (2017). Gα13 Negatively Controls Osteoclastogenesis through Inhibition of the Akt-Gsk3β-NFATc1 Signalling Pathway. Nat. Commun. 8, 13700. doi:10.1038/ncomms13700
Xu, Q., Lin, S., Wang, Y., Zhu, J., and Lin, Y. (2018). Fibroblast Growth Factor 10 (FGF10) Promotes the Adipogenesis of Intramuscular Preadipocytes in Goat. Mol. Biol. Rep. 45, 1881–1888. doi:10.1007/s11033-018-4334-1
Yang, X., Deng, F., Wu, Z., Chen, S.-Y., Shi, Y., Jia, X., et al. (2020). A Genome-wide Association Study Identifying Genetic Variants Associated with Growth, Carcass and Meat Quality Traits in Rabbits. Animals 10, 1068. doi:10.3390/ani10061068
Zeferino, C. P., Moura, A. S. A. M. T., Fernandes, S., Kanayama, J. S., Scapinello, C., and Sartori, J. R. (2011). Genetic Group×ambient Temperature Interaction Effects on Physiological Responses and Growth Performance of Rabbits. Livestock Sci. 140, 177–183. doi:10.1016/j.livsci.2011.03.027
Zhang, R., Li, R., Feng, Q., Zhi, L., Li, Z., Xu, Y.-O., et al. (2018). Expression Profiles and Associations of FGF1 and FGF10 with Intramuscular Fat in Tibetan Chicken. Br. Poult. Sci. 59, 613–617. doi:10.1080/00071668.2018.1507018
Keywords: GWAS, longitudinal data, genomic analysis, NMM, body weight
Citation: Liao Y, Wang Z, Glória LS, Zhang K, Zhang C, Yang R, Luo X, Jia X, Lai S-J and Chen S-Y (2021) Genome-Wide Association Studies for Growth Curves in Meat Rabbits Through the Single-Step Nonlinear Mixed Model. Front. Genet. 12:750939. doi: 10.3389/fgene.2021.750939
Received: 31 July 2021; Accepted: 15 September 2021;
Published: 08 October 2021.
Edited by:
Mudasir Ahmad Syed, Sher-e-Kashmir University of Agricultural Sciences and Technology, IndiaReviewed by:
Lei Zhou, China Agricultural University, ChinaGuillermo Giovambattista, CONICET Institute of Veterinary Genetics (IGEVET), Argentina
Copyright © 2021 Liao, Wang, Glória, Zhang, Zhang, Yang, Luo, Jia, Lai and Chen. This is an open-access article distributed under the terms of the Creative Commons Attribution License (CC BY). The use, distribution or reproduction in other forums is permitted, provided the original author(s) and the copyright owner(s) are credited and that the original publication in this journal is cited, in accordance with accepted academic practice. No use, distribution or reproduction is permitted which does not comply with these terms.
*Correspondence: Song-Jia Lai, laisj5794@163.com; Shi-Yi Chen, sychensau@gmail.com