 Zeying Wang1,2†
 Yanru Wang1†
 Taiyu Hui1†Rui Chen1†Yanan Xu1
 Yu Zhang1He Tian1Wei Wang1Yuyan Cong1Suping Guo1Yanxu Zhu3Xinghui Zhang3Dan Guo4Man Bai1
 Yixing Fan1Chang Yue1
 Zhixian Bai1Jiaming Sun1
 Weidong Cai1Xinjiang Zhang1Ming Gu1Yuting Qin1Yinggang Sun1Yanzhi Wu1Rina Wu2*Xingtang Dou3*Wenlin Bai1*
 Yuanyuan Zheng1*
- 1College of Animal Science and Veterinary Medicine, Shenyang Agricultural University, Shenyang, China
- 2College of Food Science, Shenyang Agricultural University, Shenyang, China
- 3Liaoning Province Modern Agricultural Production Base Construction Engineering Center, Shenyang, China
- 4Liaoning Provincial Department of Science and Technology, Shenyang, China
Cashmere fineness is one of the important factors determining cashmere quality; however, our understanding of the regulation of cashmere fineness at the cellular level is limited. Here, we used single-cell RNA sequencing and computational models to identify 13 skin cell types in Liaoning cashmere goats. We also analyzed the molecular changes in the development process by cell trajectory analysis and revealed the maturation process in the gene expression profile in Liaoning cashmere goats. Weighted gene co-expression network analysis explored hub genes in cell clusters related to cashmere formation. Secondary hair follicle dermal papilla cells (SDPCs) play an important role in the growth and density of cashmere. ACTA2, a marker gene of SDPCs, was selected for immunofluorescence (IF) and Western blot (WB) verification. Our results indicate that ACTA2 is mainly expressed in SDPCs, and WB results show different expression levels. COL1A1 is a highly expressed gene in SDPCs, which was verified by IF and WB. We then selected CXCL8 of SDPCs to verify and prove the differential expression in the coarse and fine types of Liaoning cashmere goats. Therefore, the CXCL8 gene may regulate cashmere fineness. These genes may be involved in regulating the fineness of cashmere in goat SDPCs; our research provides new insights into the mechanism of cashmere growth and fineness regulation by cells.
Introduction
Cashmere goats are a species with high economic value. Cashmere has a certain position in the international market, and their quality meets the requirements. Among them, the value of cashmere is the most important. Cashmere includes two parts, the primary and secondary hair follicles, and the growth of cashmere is regulated by secondary hair follicles and is the main source of cashmere (Bai et al., 2018). Cashmere is the unmedullated villous fiber growing from the secondary hair follicles of goat skin, which resides in the underlayer of the coat. The secondary hair follicles of cashmere goats show regular periodic growth, which generally goes through three stages: growth, regressive, and resting.
The growth cycle of secondary hair follicles of cashmere goats is mainly affected by the length of light, temperature, feeding conditions, and breed; as a result, it presents seasonal changes (Wang et al., 2017). Although the output of cashmere is high, the overall trend of cashmere is coarse, affecting the formation of textile crafts.
We detect genetics and backgrounds that affect cashmere fineness from different aspects. Liu et al. detect candidate genes that are closely related to cashmere fineness in Inner Mongolia cashmere goats by genome-wide association analysis (Liu et al., 2012). KAP and its family are an important element that is shown to regulate the fineness of cashmere (Jin et al., 2017). To find a more reliable internal genetic background that determines the fineness of cashmere, we use the most advanced single-cell RNA-seq, a technique for observing gene expression at the single-cell level (Gong et al., 2018). Single-cell sequencing enables more precise selection of key genes involved in cashmere fineness in secondary hair follicle dermal papilla cells (SDPCs). Through this, we can determine the true nature of certain specific genes that can be expressed in secondary hair follicle cells. The latest single-cell RNA sequencing (scRNA-seq) is able to identify a large number of cells (Buenrostro et al., 2018; Pace et al., 2018; Pandey et al., 2018; Shah et al., 2018). In mice, small intestine single-cell sequencing was used to obtain helper cell types that support intestinal stem cells to produce mature epithelial cell types (Biton et al., 2018). Similarly, single-cell transcriptomic analysis reveals heterogeneous differentiation and spatial characteristics of mouse epidermis and hair follicles (Joost et al., 2016). Furthermore, to determine the differences in oocyte maturation at different stages, transcriptome sequencing of single cells was compared with oocyte maturation gene expression in children and female goats to screen and verify genes related to oocyte maturation (Yin et al., 2017). However, research on regulating the fineness of cashmere at the cellular level is still scarce.
Herein, the purpose of this study was to investigate cell-/tissue-specific transcriptional profiles. Therefore, the cells of cashmere goat skin were sequenced using single-cell sequencing technology to systematically analyze the cell heterogeneity in tissue-stable epidermal cells. We employed cell trajectory analysis to reveal molecular changes during development, and used immunofluorescence (IF) and Western blot (WB) to verify new key genes that may be a turning point in regulating the fineness of cashmere. Through deep research and analysis of cashmere skin cells, more gene information can be obtained to screen the genes related to cashmere fiber fineness more clearly and accurately so as to improve the quality of cashmere, increase the economic benefit, and lay the foundation for the future research on cashmere fiber fineness correlation. Our original data is in the GEO database, and the GSE accession ID is GSE182474.
Results and Analyses
Single-Cell Sequencing Identifies 13 Distinct Cell Populations in Goat Skin
To better define the cell types in Liaoning cashmere goat skin, we performed a scRNA-seq analysis in the coarse (CT-LCG) and fine (FT-LCG) types of Liaoning cashmere goat skin in their secondary hair follicle stage of prime growth. For every type of goat, we obtained 551,655,085 and 556,307,136 reads. The sequencing saturation rates were 76.9 and 68.3%, respectively, (Figure 1A). We separated and sequenced 6,102 and 11,197 cells, following strict quality control; 3,443 and 9,608 cells remained for downstream analysis in CT-LCG and FT-LCG.
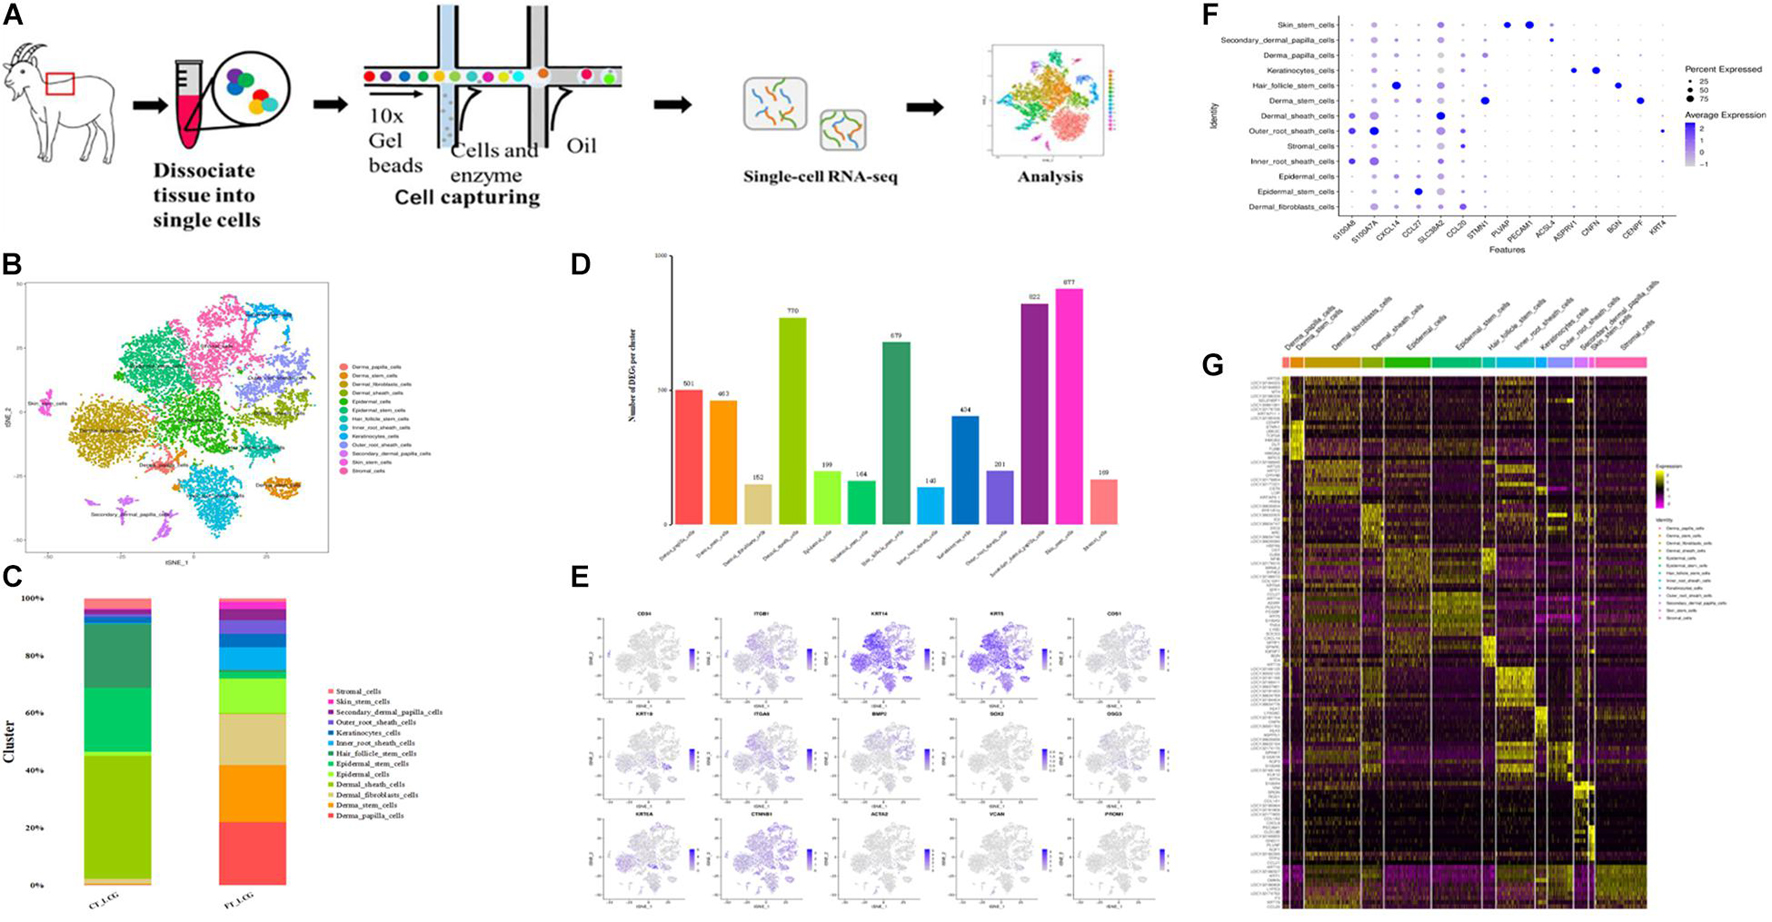
Figure 1. Identification of cashmere goat skin cell types. (A) Schematic representation of cashmere goat skin tissue preparation for single-cell transcriptome analysis. (B) t-SNE clustering of cells based on expression levels of genes. Each color represents a class of cells. (C) Graph showing percentage of each cluster in two samples. (D) Number of DEGs in each cluster. (E) t-SNE plots of marker genes expression value in per cluster. (F) Highly expressed genes in every cell type. (G) Heat map of the top 10 specific marker genes.
We first defined the different cell populations in cashmere goat skin, using the analysis of unsupervised clustering and t-distributed stochastic neighbor embedding dimension reduction (t-SNE). After standard quality control excluded cells including gene check <500 and mitochondrial gene coverage >10%, samples underwent detailed clustering analysis by Seurat workflow to define 13 distinct populations (Figure 1B). The average expression profile of the two samples is highly correlated, and the number of cells in each type is shown in Figure 1C. We found that dermal sheath cells, epidermal stem cells, and hair follicle stem cells make up a large proportion of CT-LCG; meanwhile, dermal papilla cells (DPCs), dermal stem cells, dermal fibroblast cells, and epidermal cells are the largest component of FT-LCG. We identified the gene expression profile per cluster; differential expression genes (DEGs) refer to the difference between the average expression of cells in clusters (Figure 1D). The top 10 up-expression genes of each cluster are shown in Table 1. In total, two kinds of DPCs, four stem cells, three sheath cells, one keratinocyte, one fibroblast, one epidermal cell, and one stromal cell were identified as assigned in goat skin. We detected that genes enriched in distinct clusters differently marked various cell types. For instance, KRT14 and KRT5 are known expression markers in epidermis stem cells (Cluster 1; Figure 1E). DKK1 are highly expressed in epidermis cells (Cluster 2). Dermal sheath cells (Cluster 6) were identified with a specific expression of known marker gene BMP2. Genes enriched in Cluster 7 were strongly labeled in dermal stem cells and expressed cell markers, such as SOX2 and FOXM1. Hair follicle stem cells (Cluster 8, HFSCs) promote hair development and were identified by multiple specific markers (e.g., KRT19; DSG3; and ITGA6). Skin stem cells (Cluster 12) also expressed selective genes, including CD34 and ITGB1. Finally, we found that cells from C10 showed a characteristic of DPCs, which is a high expression level of CTNNB1, and C11 showed characteristics of SDPCs, such as high expression levels of VCAN and ACTA2. Moreover, dermal fibroblast cells markers (e.g., VUM and COL1A1), inner root sheath cell markers (e.g., CDIP1; CDS1; and FOXN1), outer root sheath cell markers (e.g., DOCK6 and KRT19), a stromal cell marker (e.g., ITGA6), and a keratinocyte cell marker (e.g., KRT6A) showed specificity expression in Clusters 0, 3, 5, 4, and 9, respectively.
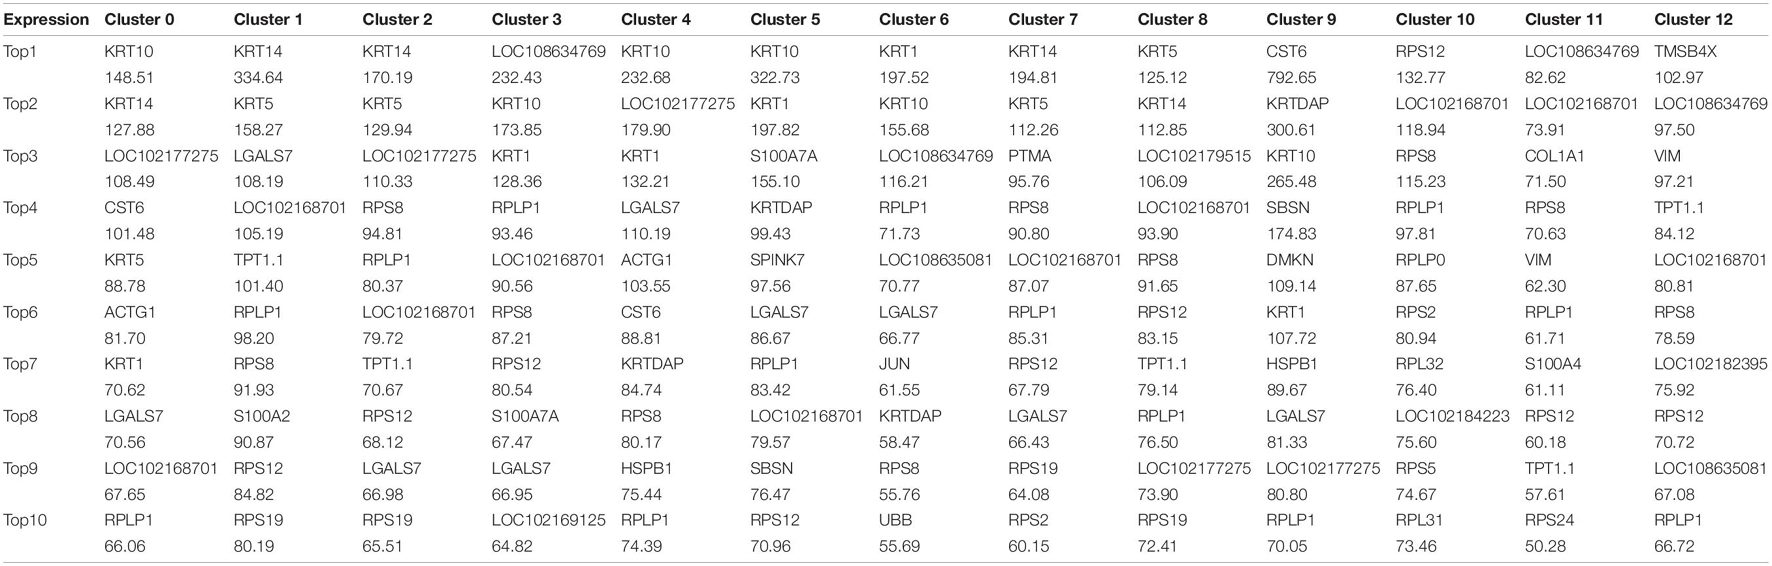
Table 1. The top 10 genes per clusters.
Importantly, the high-expression genes per cell group are shown in Figure 1F. KRT5 and KRT14 were expressed highest in epidermis stem cells and significantly enriched in Clusters 0, 2, 7, and 8. CCL27, ADIRF, and LY6D were obviously differentially expressed in epidermis stem cells. KRT10 were expressed highest in Clusters 4 and 5. LOC102179515, NFIB, BGN, and SFPRP1 were overexpressed on Cluster 8. Interestingly, CXCL14 was overexpressed on Clusters 8 and 11, which may be related to hair development. Indeed, KRTDAP and CST6 were expressed highest in Cluster 9. Notably, KRT35 and KRTAP11-1 may be related to cashmere character (Zheng et al., 2019), whereas, in goats, their expressions are confined to DPCs. In addition, LEF1 was considered to be a hair-inducing gene of DPCs (Dong et al., 2017). The expression of the positive genes IGFBP5 and IGFBP6 is discovered highly expressed in SDPCs. ALX4, which may be related to cashmere fineness (Qiao et al., 2017), is only expressed in DPCs and SDPCs. CCL21, GNG11, and TFPI2 are expressed highest in HFSCs, and VIM and CLEC3B were overexpressed on DPCs and HFSCs. KRT19 and SOX9 were proven to exist in the anagen secondary HFSCs (He et al., 2020), which are highly expressed in our results in HFSCs. Some genes are only expressed in certain cells, such as PLVAP, PECAM1, and CENPF. These significantly up-expressed genes, especially overexpressed in each functional cluster, and may be functional candidate genes associated with fibrogenesis. Collectively, these data establish the classification of skin cells and the selective gene expression pattern of cashmere goat. Below is an overview of DEGs. There is the heat map of the top 10 specific marker genes in Figure 1G, which showed analysis results of differentially expressed genes.
Cell Trajectory Analysis Reveals Cell Development in Cashmere Goat Skin
To further investigate the classification of skin cell populations and their developmental relationship, we performed cell trajectory analysis using the Monocle analysis toolkit (Ming and Song, 2011). To enable a single cell to differentially express genes during development based on their trajectories, cells were calculated by Monocle 2 in an unsupervised way via maximizing transcription similarity between consecutive cell pairs. Therefore, this method can be used to identify various phases of skin development in cashmere goats. Monocyte 2 had a large overlap in each cluster, and the subpopulation of cell classification was distributed in the whole skin, indicating versatility.
To explore which gene regulates cashmere fiber development progression per axis, we classified and clustered the gene expression changes with cell trajectory. Cell trajectory analysis results revealed the skin development of the cashmere goat is divided into 15 states, and every kind of cell was involved in almost the whole development process (Figures 2A,B). In support of the draw order in cell trajectory, our analysis revealed the organization of genes that are differentially expressed in each branch, which is closely related to the genes that are famous for participating in cashmere growth and hair development. Interestingly, KRTAP11-1, TCHH, KRTDAP, and S100A8 that were briefly up-regulated and then down-regulated were observed. However, a subset of genes, such as KRT5, RPS7, RPL3, and RPL5, were sustained as up-regulated over time (Figure 2C). Further confirming the validity of the cell trajectory analysis, the top 6 genes, such as KRTAP11-1 and TCHH (Figure 2D), which GO analysis enriched with intermediate filament and keratinization, are important pathways for cashmere growth, indicating these genes may relate to cashmere formation and development. KEGG pathways of these genes mainly enriched to the WNT, TGF beta, and PI3K-Akt signaling pathways. These data and analyses reveal the clear developmental stages of goat skin; the expressions of differential genes along the timeline of bifurcations indicates that different molecular paths guide the development of different populations.
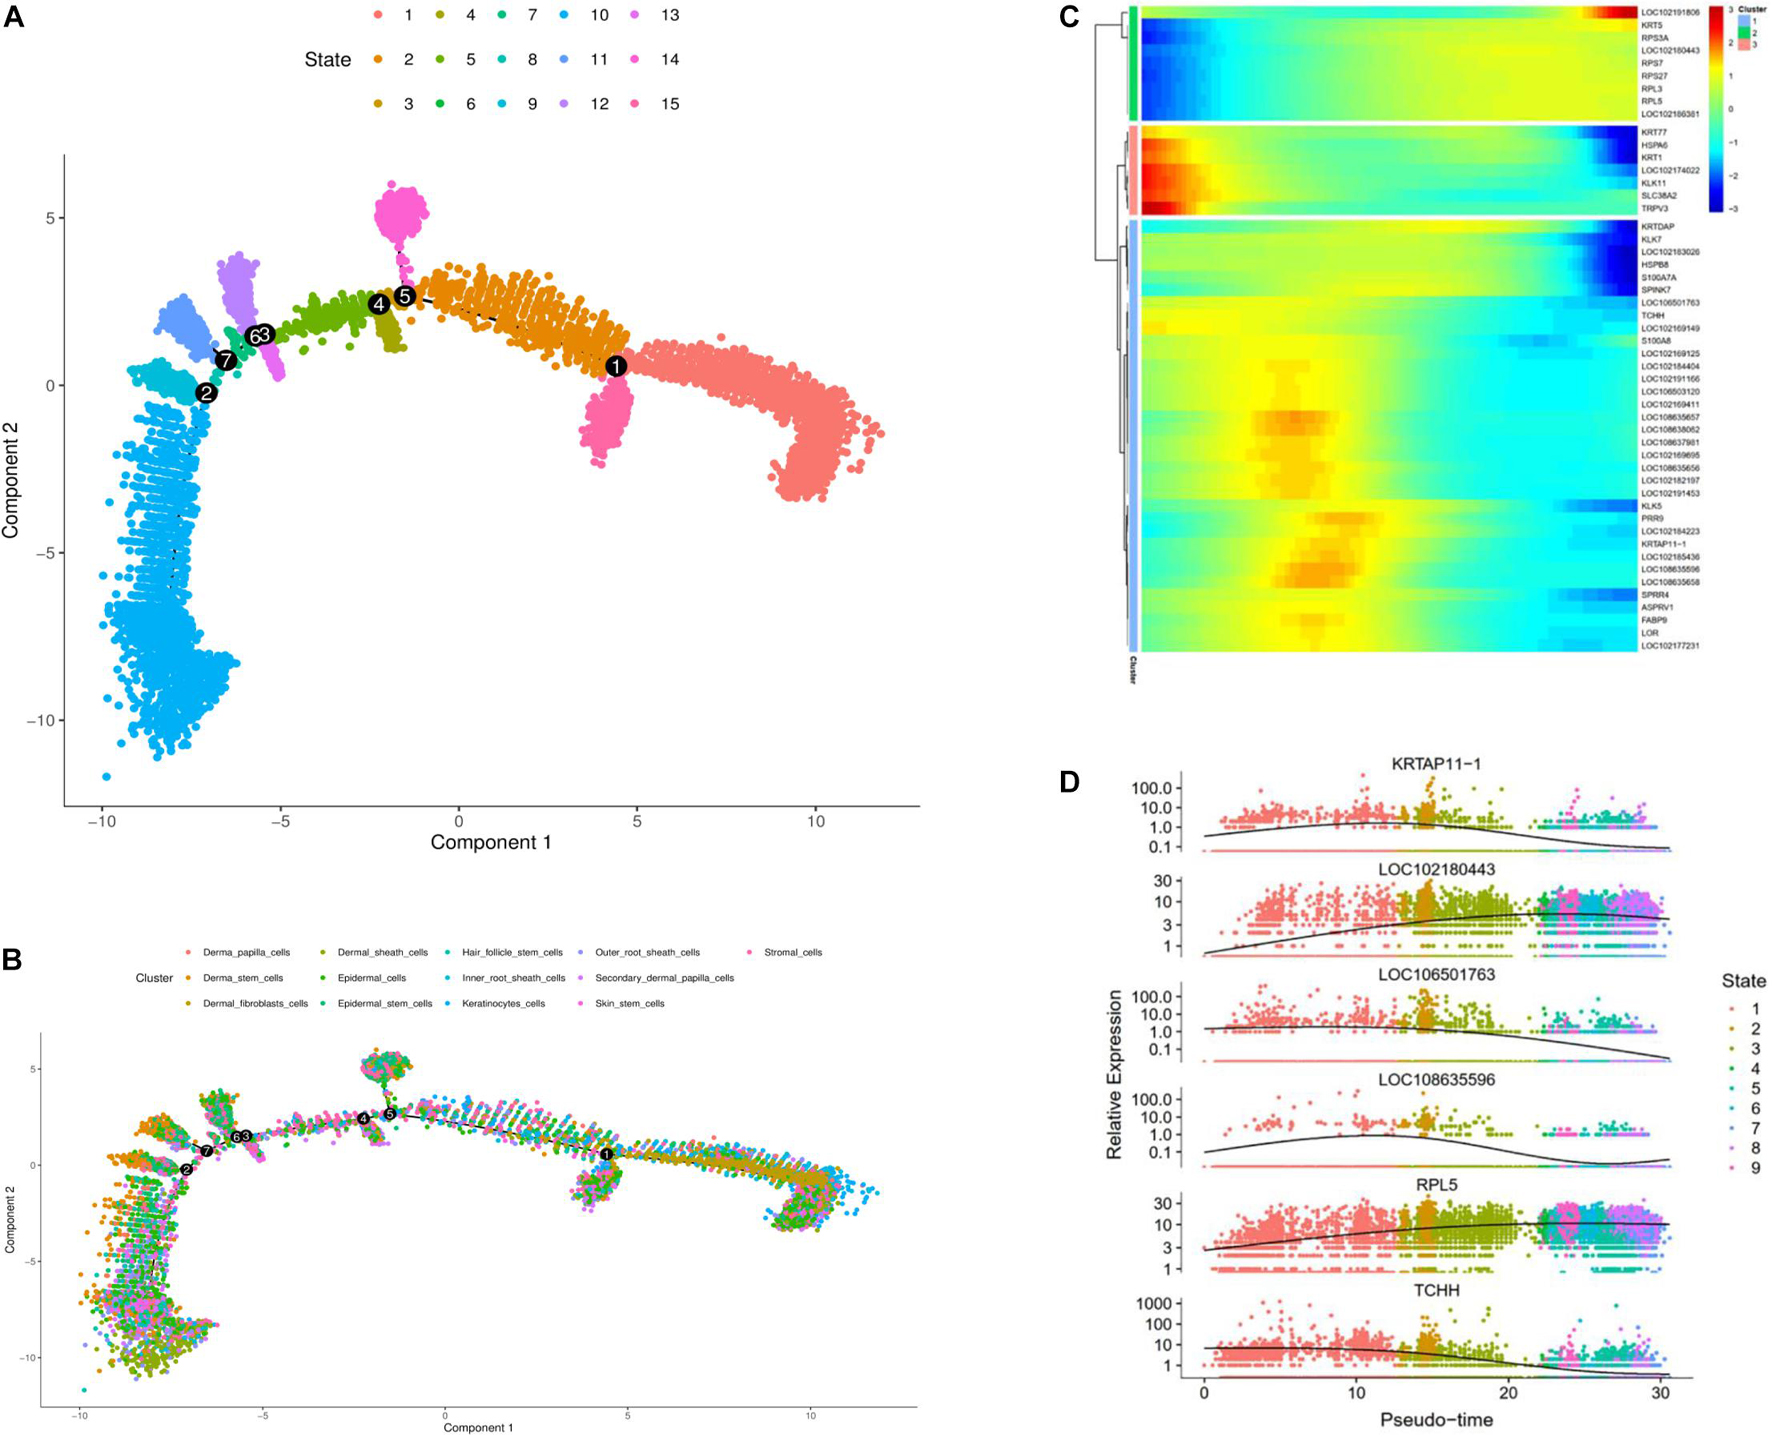
Figure 2. Cell trajectory analysis on goat skin cells. (A) Monocle 2 cell trajectory analysis of goat skin cells. (B) Monocle 2 cell trajectory colored according to the identity of 13 goat skin cells. (C) Clustering of genes represent differential expression patterns across goat skin cell populations. (D) Dynamic expression values of top six different genes are plotted on pseudo-time. X-axis represents pseudo time, and Y-axis represents gene expression levels.
Weighted Gene Correlation Network Analysis of Cashmere Goat Skin
To further identify the genes related to cashmere growth, we conducted Weighted gene correlation network analysis (WGCNA) on cashmere goat skin. WGCNA, a relatively new statistical analysis, is usually used to construct networks based on gene correlations and recognize intramodular hub genes (Tahmasebi et al., 2019). The average expression profile of each gene in each type of cell was analyzed to screen genes for WGCNA. The cluster dendrogram consists of 31 coexpression modules, including tan, green, yellow, white, green, and other colors (Figure 3A). We also found that, compared with others, the blue module had a strong coexpression relationship by building a topological overlap matrix (TOM) diagram (Figure 3B). The darker the color, the higher the topological overlap.
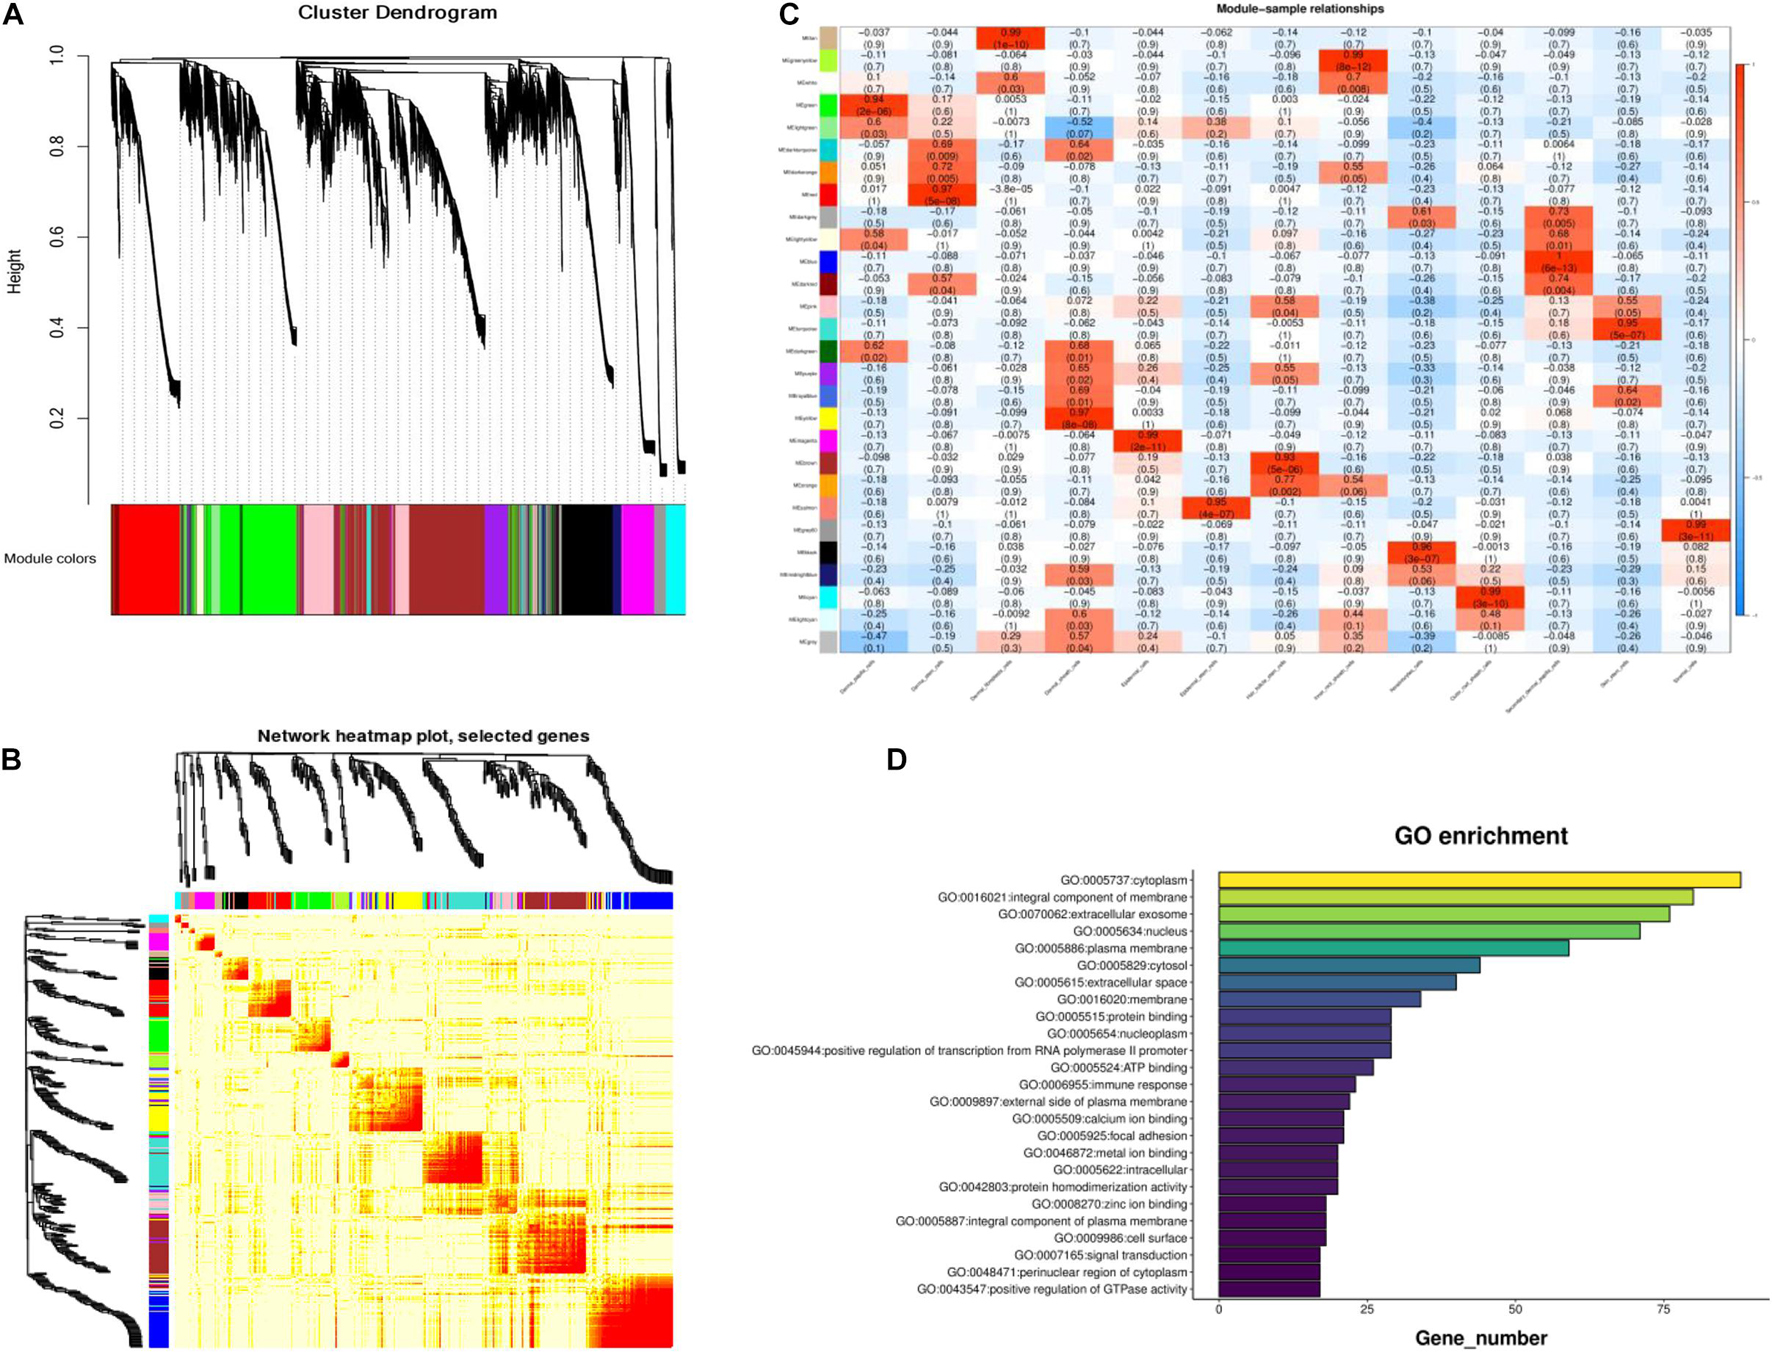
Figure 3. Module identification of cashmere goat skin. (A) Cluster dendrogram of all screened genes. (B) TOM of all screened genes. (C) Heat map of the correlation between modules and cashmere skin cells. Each specific color represents the specific gene module. (D) GO analysis of the core genes in blue module.
As shown in Figure 3C, all genes in the 13 type cells were selected to produce the module trait relationship. Interestingly, before, there was almost no similarity between each module, suggesting that most modules had a certain promoting effect on each cluster. The significant enrichment module in SDPCs is blue, in DPCs is green, and in stromal cells is gray60, and the number of genes per module was 2,629, 1,839, and 256, respectively. The blue module of the SDPC cluster related to cashmere growth had the deepest color, suggesting that genes in this module might have a positive effect on cashmere fineness. We identified hub genes COL1A1, COL1A2, CCL26, CCDC80, HOXA13, CXCL8, KRT24, and BMP3 as having significant connectivity, which may be associated with cashmere development.
Enrichment analysis was used to explore the biological functions of genes in these modules to further determine the relationship between these genes and cashmere growth. The GO analysis results of the core genes in the blue module are displayed in Figure 3D. It was found that these genes are suggestive of cytoplasm, an integral component of the membrane.
Through the correlation analysis between modules and samples, we selected four modules with the highest correlation to construct the network diagram. The detailed network information of the core genes for four selected modules, including blue, brown, green, and gray60 modules, is shown in Figure 4. In the gene networks, some hub genes interacted with many other genes, which indicate that they are more likely to be necessary. COL1A1, CCDC80, and HOXA13 are associated with many genes in the blue module. CXCL8, NFKBIE, and CCL24 are active in the green module. KRT3, KRT4, and KLK12 are positively linked to other genes in the gray60 module. KRT19, KRT38, NFIB, and LHX2 are positive genes in the brown module. COL1A1, with a significant connectivity in SDPCs, may serve as a target for cashmere formation.
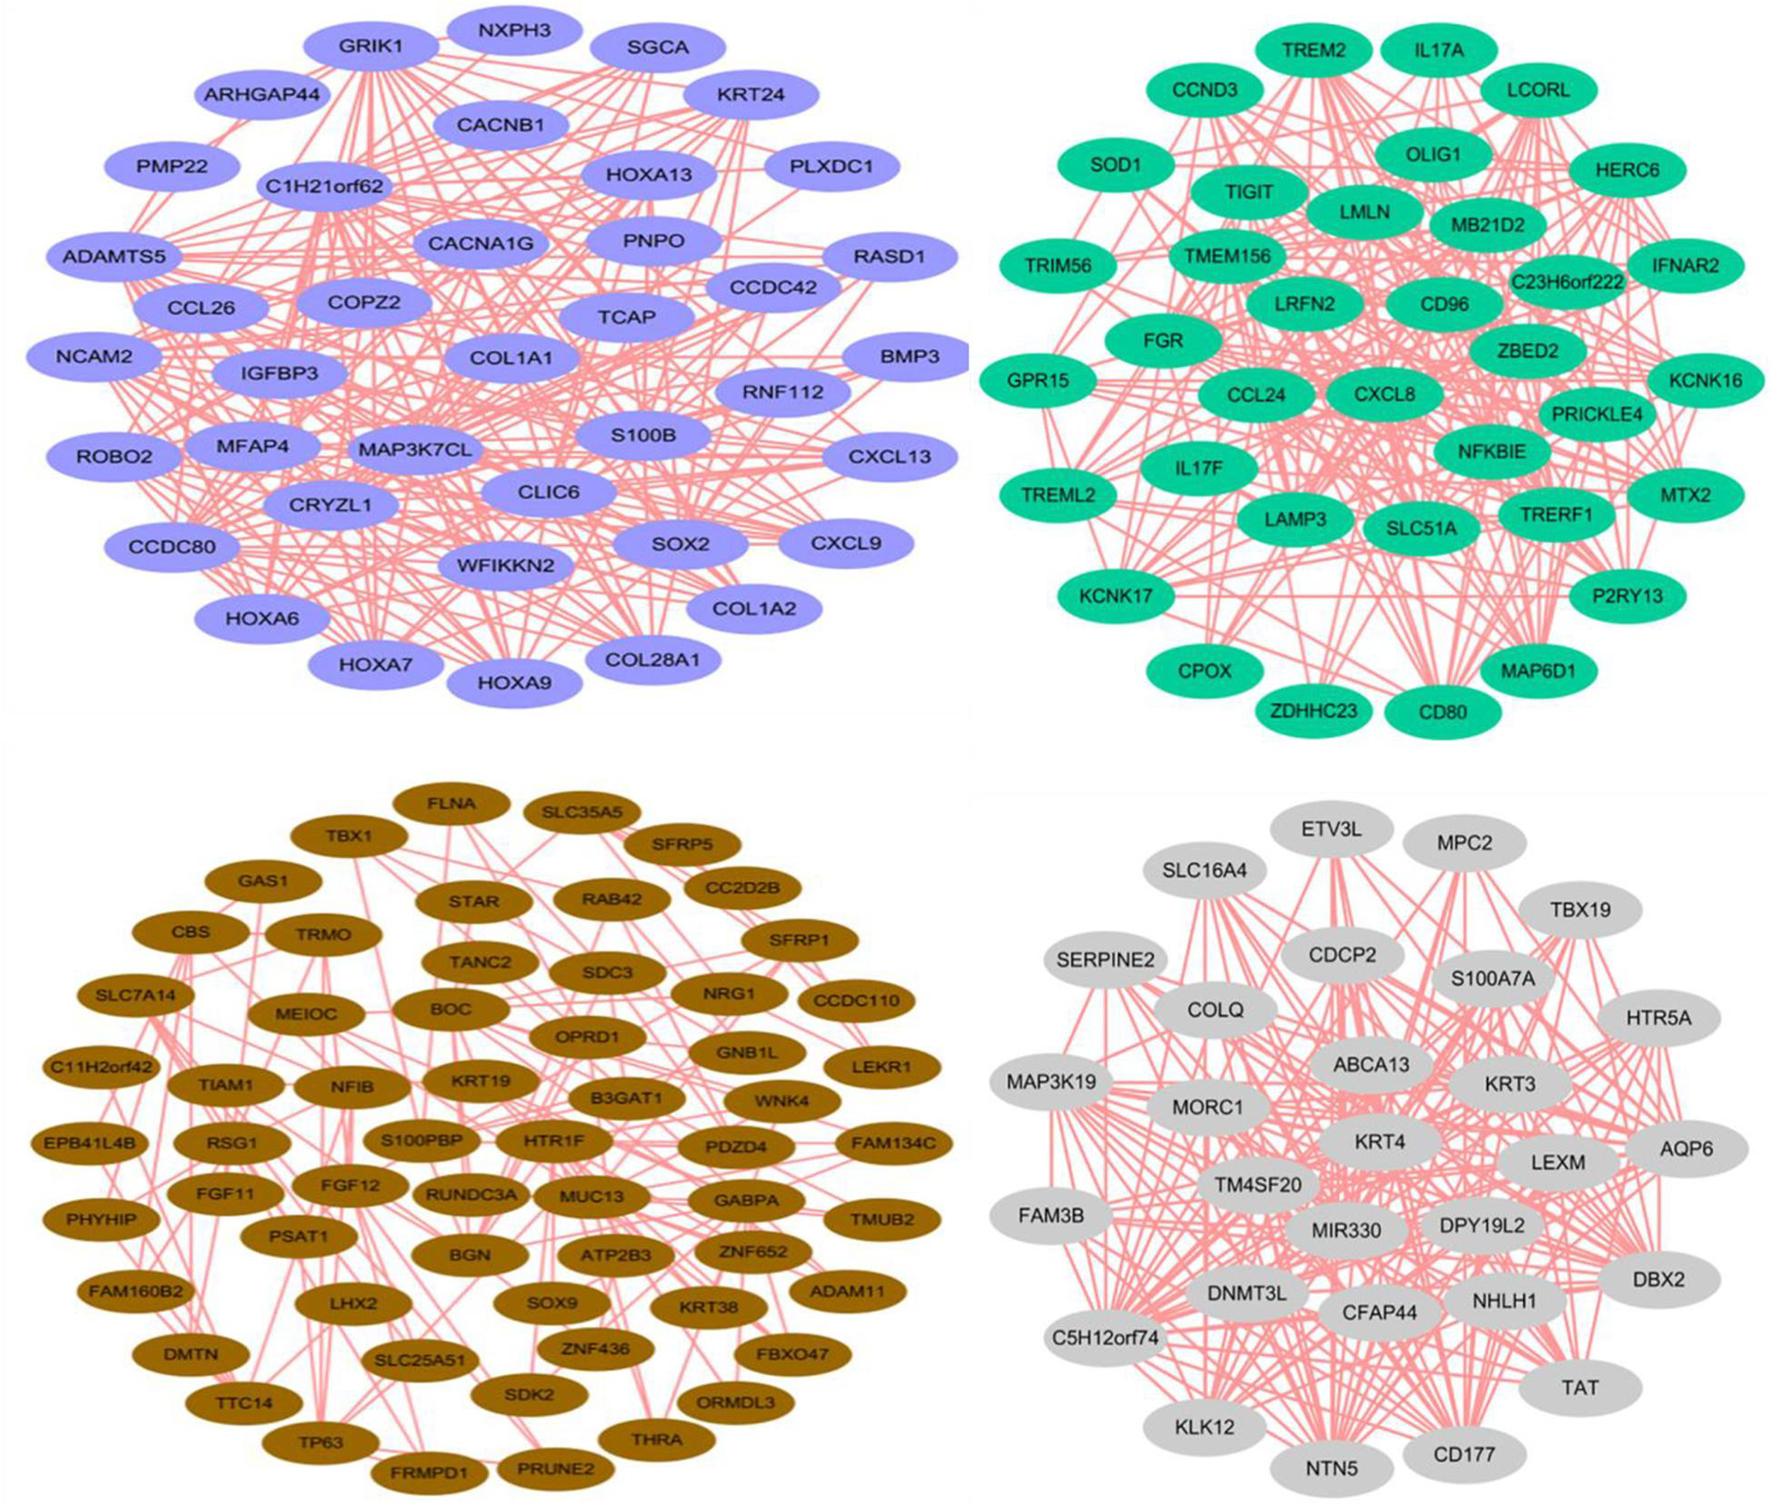
Figure 4. Coexpression networks of core genes in blue, brown, green, and gray60 modules. Each color represents a module.
Identification and Analysis of Dermal Papilla Cells and Secondary Hair Follicle Dermal Papilla Cells in Cashmere Goat Skin
Previous work shows that DPCs can induce hair follicle regeneration, determine the size of hair follicles to a certain extent, and play an essential role in the hair follicle cycle change process (Ma et al., 2019). Moreover, DPCs are important signaling components that guide the proliferation, upward migration, and differentiation of HF stem cell progenitor cells to form other types of HF cells (Dai et al., 2021). DPCs and SDPCs have different effects on the growth of hair: DPCs control the growth of wool, and SDPCs decide the cashmere (Shen, 2017). DPCs subtly grasp the continuous growth of mammalian hair, including cashmere. There are 100 high-expression genes in DPCs, and the top10 genes from 13 cell clusters are exhibited in Figure 5. LOC102184693, KRT35, KRTAP11-1, KRTAP3-1, and MT4 almost only expressed in DPCs. In hair follicle and goat skin, KRT35 and KRTAP11-1 frequently appear. Moreover, we detected two crucial activators HOXC8 and RSPO1 that were enriched in DPCs as reported (Ma et al., 2019). In addition, the family of RPS and RPL are significantly expressed in DPCs, such as RPS8, RPS2, RPL0, and RPL32. RPS12, as the key effector of cell competition caused by other RP gene mutations, has the highest expression in DPCs. Among them, PTGER4 and ESR1 are more abundant in DPCs consistent with previous studies (Movérare et al., 2002; Torii et al., 2002). To better understand the functioning approaches of DEGs in DPCs, GO, and KEGG enrichment analysis were performed. Finally, 452 pathways were enriched, such as keratin filament and hair follicle morphogenesis. By KEGG analysis, some pathways related to cashmere growth and development were enriched, including TGF-beta signaling pathway, alcoholism, PPAR, and Notch signaling pathway.
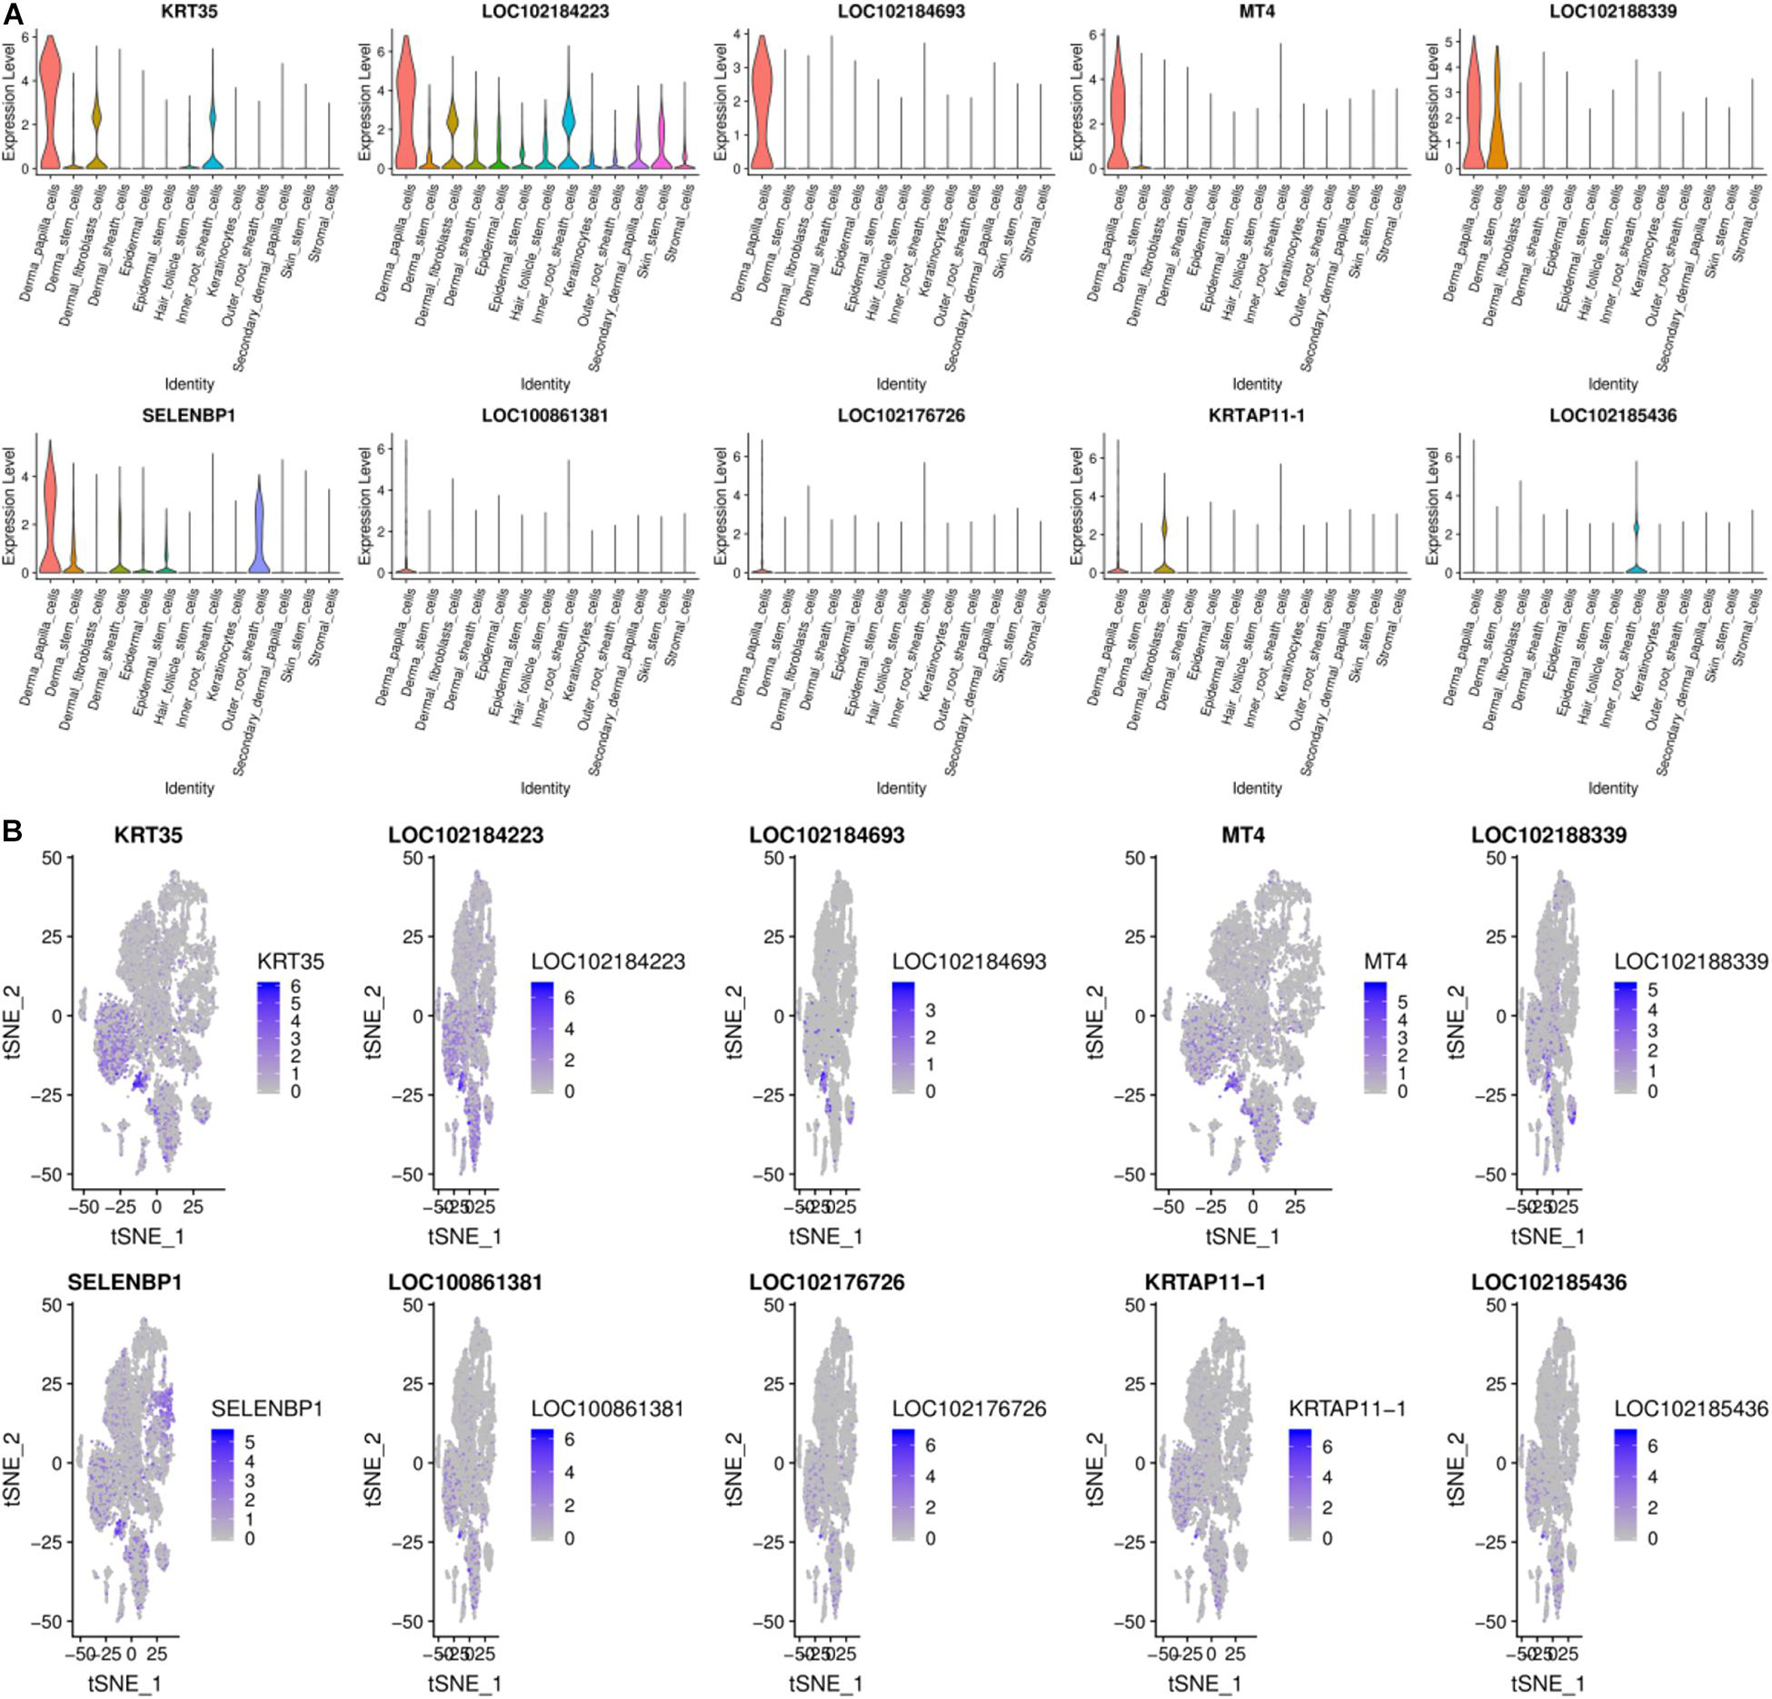
Figure 5. Gene expression profiling of DPCs. (A) Violin plots for expression of top 10 genes. (B) Relative expression levels of top 10 genes on the t-SNE plots.
Recently, research in this field has indicated that hair type can be determined by SDPCs. In SDPCs, the top10 up-expression genes are exhibited in Figures 6A,B. Of note, COL1A1, COL1A2, COL3A1, S100A4, VIM, CRABP2, CCDC80, ACTG2, CCL26, and CXCL12 are solely abundant in SDPCs. COL1A2, COL3A1, and CCDC80 are reported to be differentially expressed in different cashmere fibers (Zheng et al., 2019). Furthermore, the expression of S100A4 was the highest in SDPCs, which may involve Yangtze River Delta white goat hair growth (Li et al., 2013). Also, NFKBIA is highly enriched in SDPCs, which may play an important role in cashmere growth (Jin et al., 2018; Zheng et al., 2019). Similarly, CRABP1, a constant marker of DPCs, has a high expression in SDPCs and expresses throughout all stages of hair cycling (Driskell et al., 2012). To further excavate the critical genes regulating cashmere fineness, enrichment was analyzed in SDPCs. A total of 848 GO terms were significantly enriched; as expected, hair follicle morphogenesis, hair follicle development, and intermediate filament cytoskeleton were significantly enriched GO terms. The top 20 differentially expressed GO terms are shown in Figure 6C. The top 20 pathways by KEGG analysis were significantly enriched, such as PI3K-Akt, TGF beta, and WNT signaling pathways (Figure 6D). BMP3, BMP4, BMP7, FGF7, FGF2, COL1A1, IGF1, and WNT5A enriched these pathways.
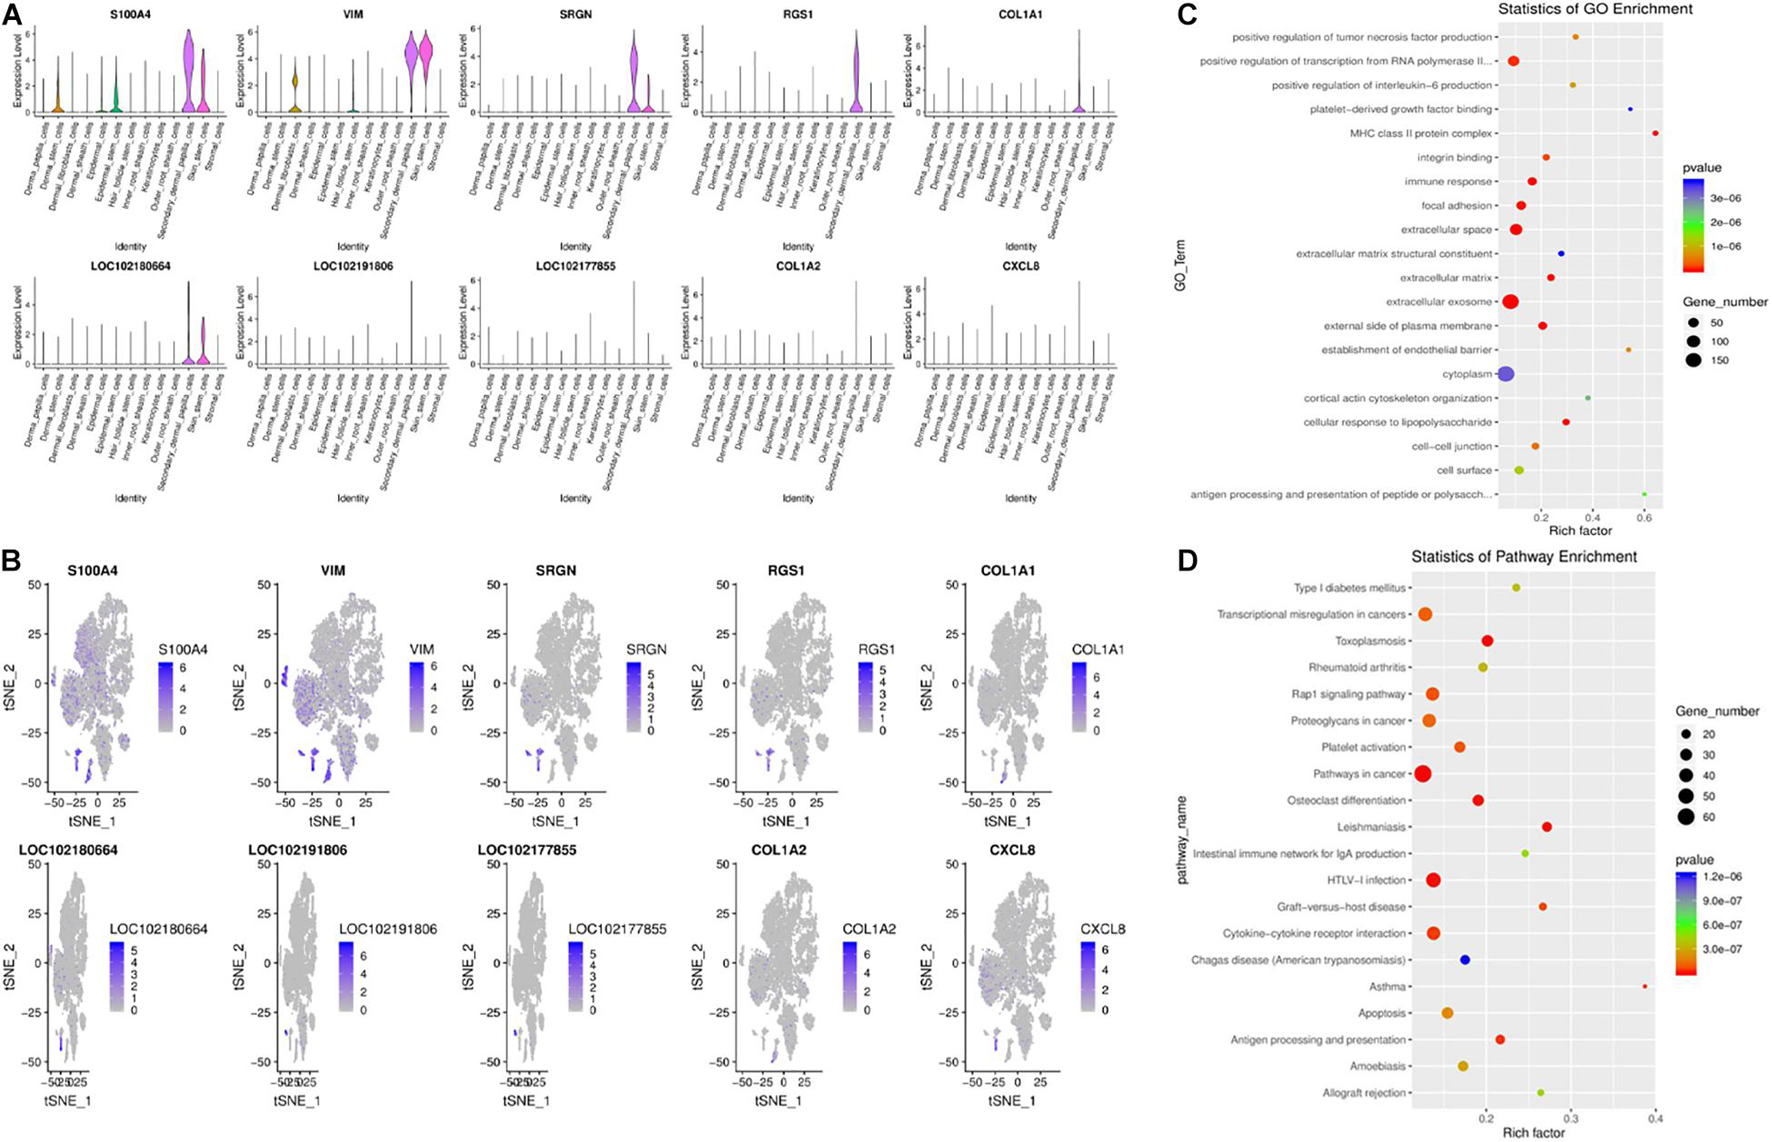
Figure 6. Gene expression profiling of SDPCs. (A) Violin plots for expression of top 10 genes. (B) Relative expression levels of top 10 genes on the t-SNE plots. (C) Top 20 significantly enriched GO terms. (D) Top 20 KEGG pathways.
To explore differential genes in the development period, we took a closer look at cell trajectory analysis of DPCs and SDPCs, respectively. Trajectory analysis provided the development process and five differentiation states in DPCs (Figures 7A,B). CST6, KRT10, KRTDAP, and DMKN decreased first, then rose and fell at DPCs (Figures 7C,D), and yet KRT35 and MT4 were momentarily up-regulated and then down-regulated. SOX4 and CEBPB were continually up-regulated, and KRT14 and KRT1 were down-regulated. Cell trajectory analysis demonstrated a total of five states in SDPC development stages (Figures 8A,B). CXCL8 and CD34, after a transient period of stability, began to down-regulate (Figure 8C). Notably, CXCL4, COL1A1, COL1A2, and COL3A1 were continually downregulating, and SRGN, NFKB1, and RGCC showed late specific expression (Figure 8D). As expected, GO analysis showed that DPCs and SDPCs both significantly enriched KRT14, CXCL4, and COL1A1 in the development process, and with the development of a pseudo-timeline on the axis, these genes involved in the development were down-regulated. KRT35, SRGN, and NFKB1 showed specific expressions in development later. CXCL4, COL1A1, KRT14, and KRT35 may be the key candidate genes for regulation DPCs and SDPCs.
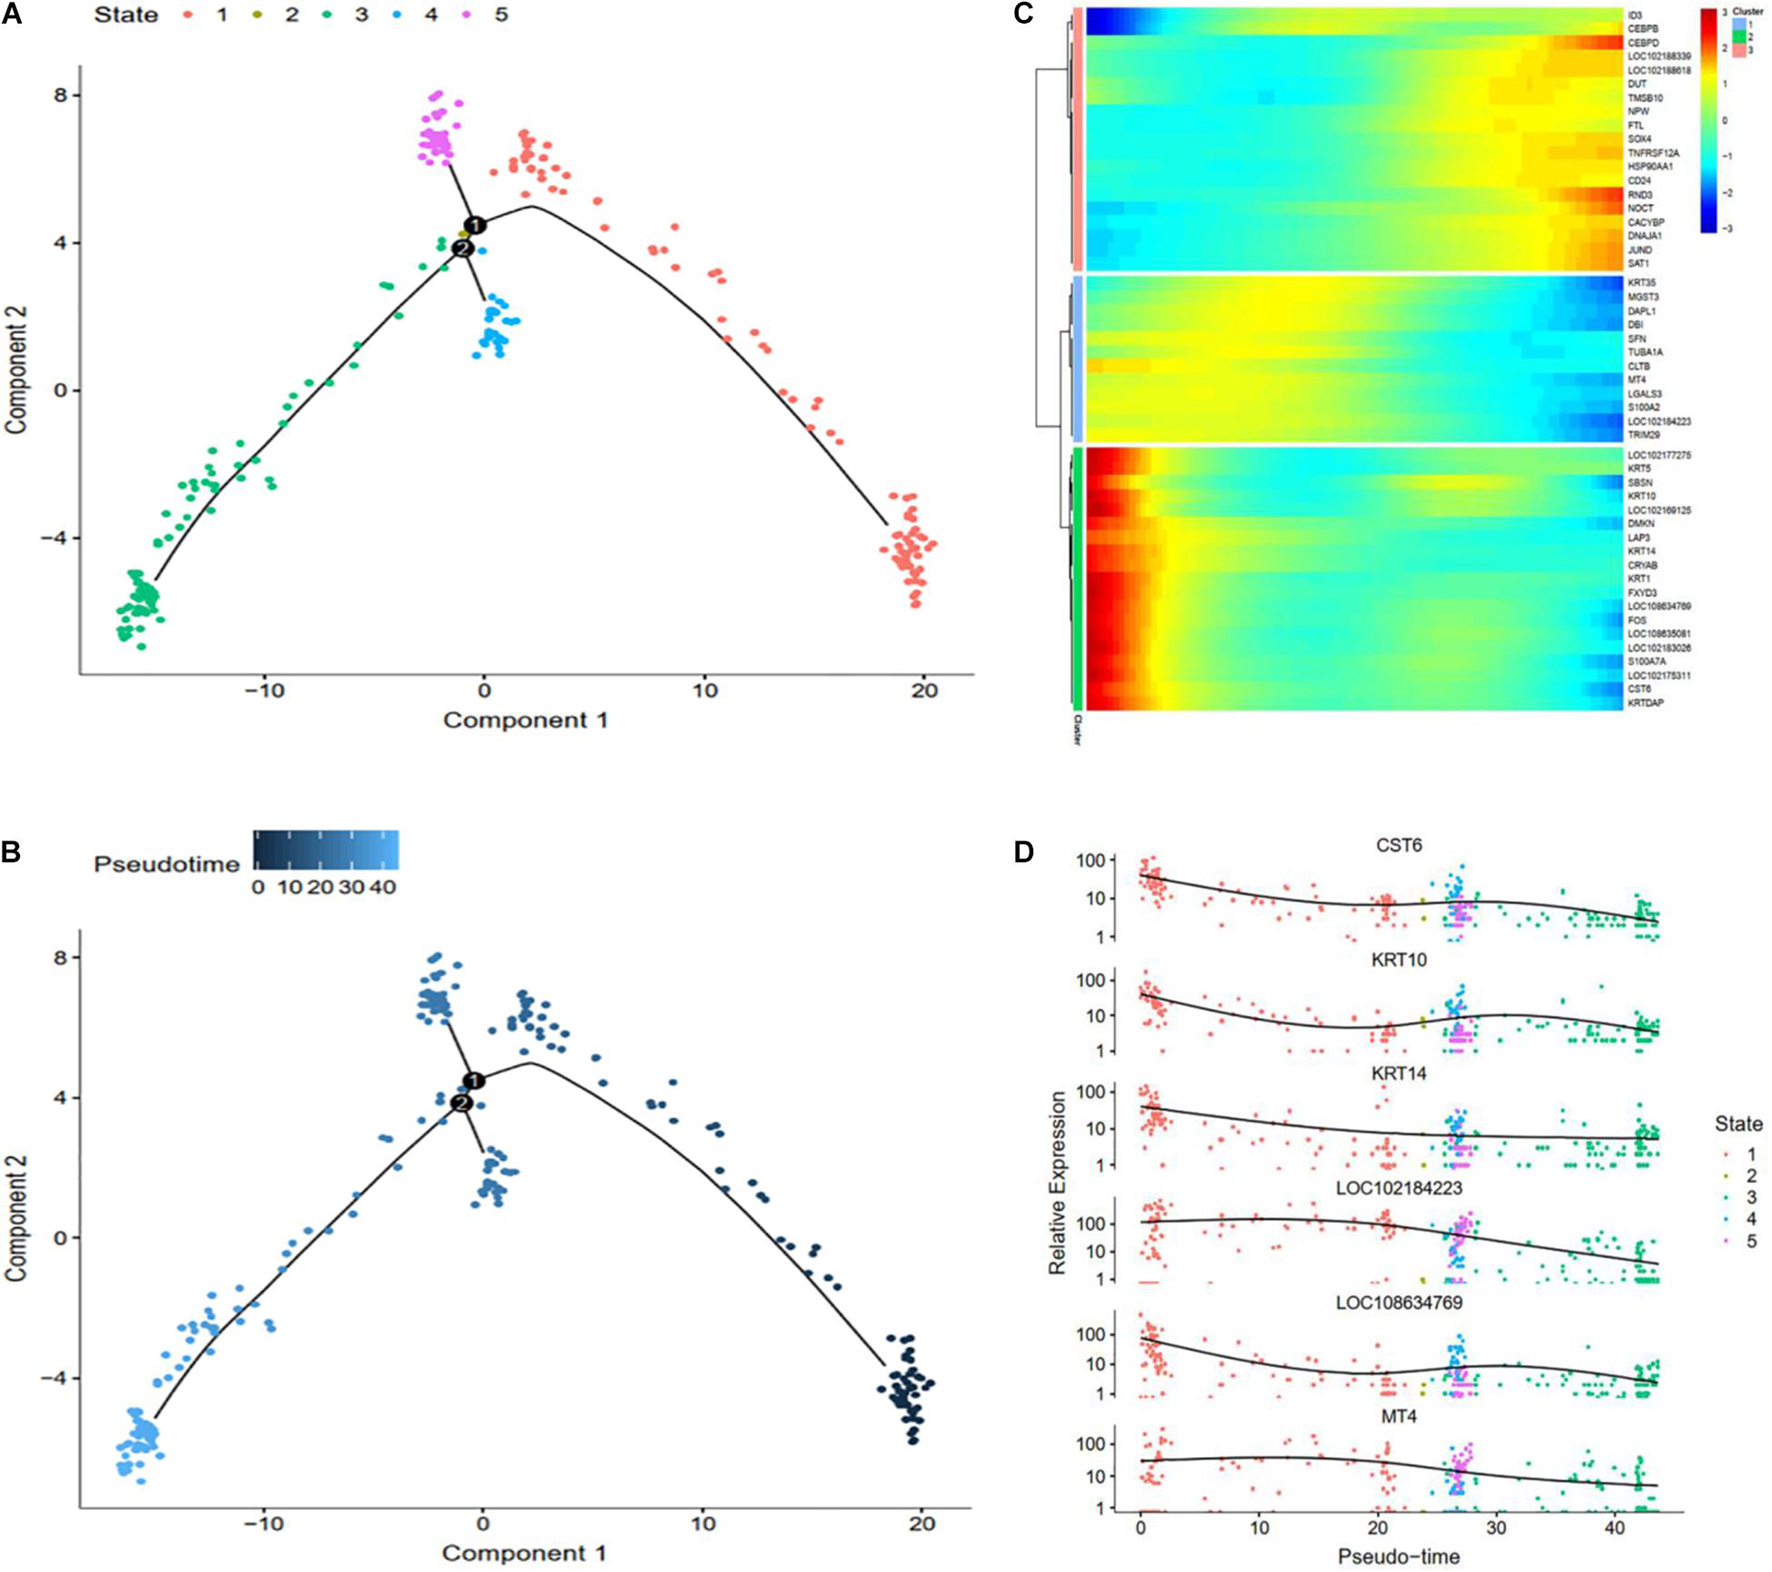
Figure 7. Cell trajectory analysis in DPCs of goat skin. (A) Monocle 2 cell trajectory of goat DPCs. (B) Pseudo-time is displayed in a dark to light blue gradient and indicates the start of pseudo-time. (C) Clustering of top 50 genes exhibiting in DPCs. (D) Expression levels of six responsive genes in DPCs. X-axis represents pseudo-time, Y-axis represents gene expression levels.
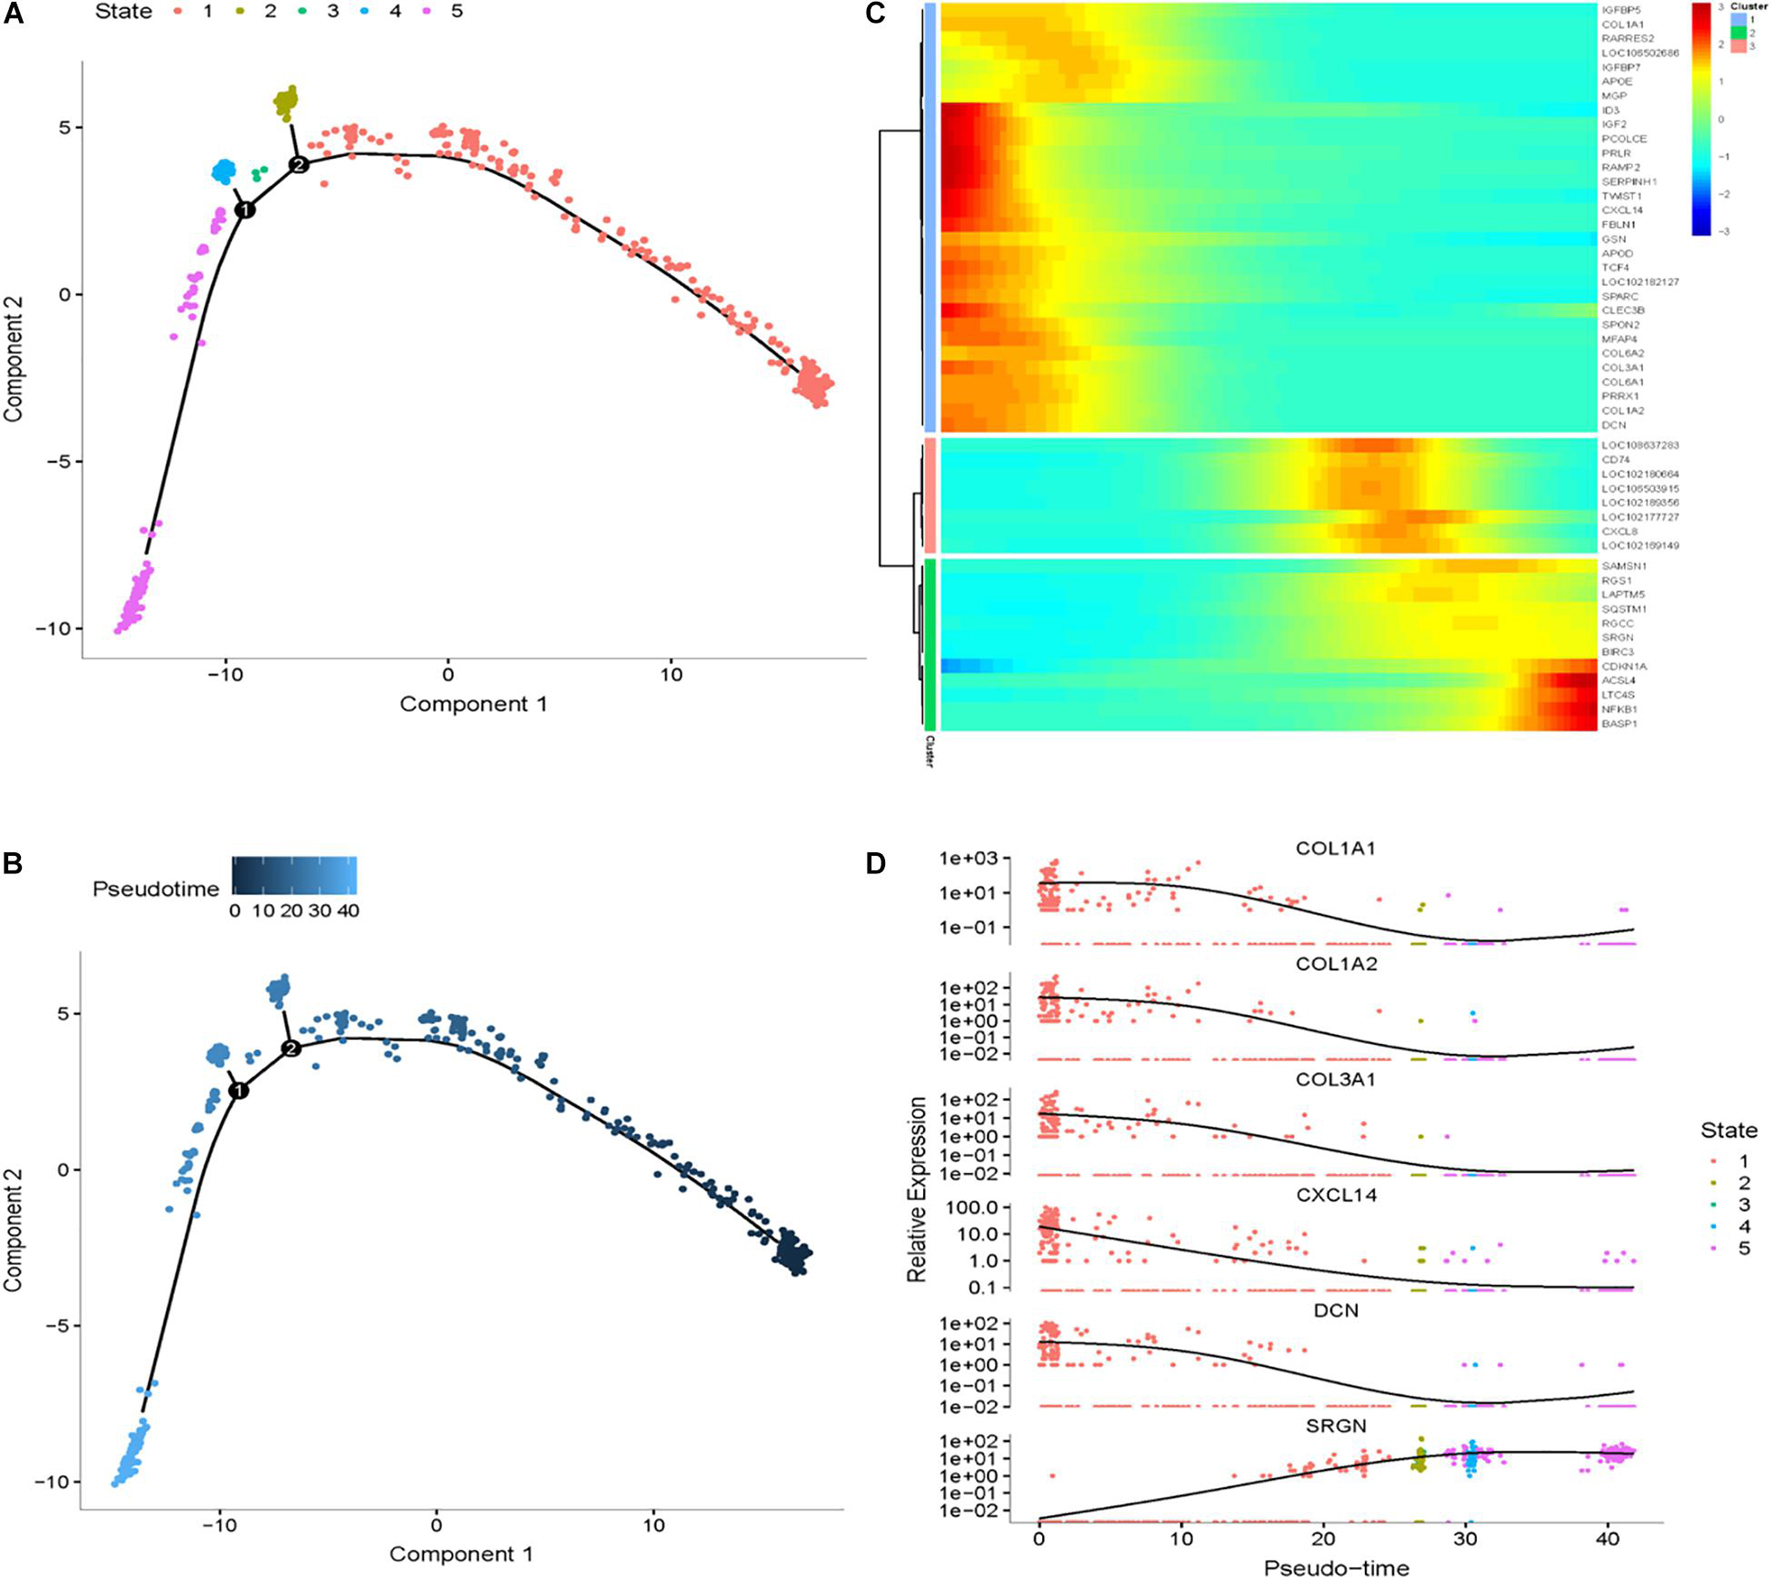
Figure 8. Cell trajectory analysis in SDPCs of goat skin. (A) Monocle 2 cell trajectory of goat DPCs. (B) Pseudo-time is displayed in a dark to light blue gradient and indicates the start of pseudo-time. (C) Clustering of top 50 genes exhibiting in SDPCs. (D) Expression levels of six responsive genes in DPCs. X-axis represents pseudo-time, Y-axis represents gene expression levels.
Analysis and Verification of Genes Difference in Secondary Hair Follicle Dermal Papilla Cells of CT-LCG and FT-LCG
IF results of COL1A1 in FT-LCG and CT-LCG skin tissues (200x) (Figure 9). A total of 16,601 genes were found in SDPCs of two samples (Figure 10A), and there are 15 representative DEGs between CT-LCG and FT-LCG exhibited in Figure 10B. TCHH, S100A8, and IGF2 were highly expressed in CT-LCG, and CD74, CCL27, COL1A1, and CXCL8 were highly expressed in FT-LCG. To further excavate the critical genes regulating cashmere fineness, enrichment was analyzed in SDPCs. There are 48 and 45 significant pathways in CT-LCG and FT-LCG. CT-LCG are mainly enriched to the Jak-STAT, TGF-beta, and PI3K-Akt signaling pathways (Figure 10C), and FT-LCG is also enriched in the TGF-beta signaling pathway (Figure 10D). COL1A1 is enriched in the PI3K-Akt signaling pathway, and CXCL8 enriched to the NF-kappa B signaling pathway, which is reported to may be related to cashmere. We found that there were significant differences in the highly expressed genes and enrichment pathways in CT-LCG and FT-LCG.
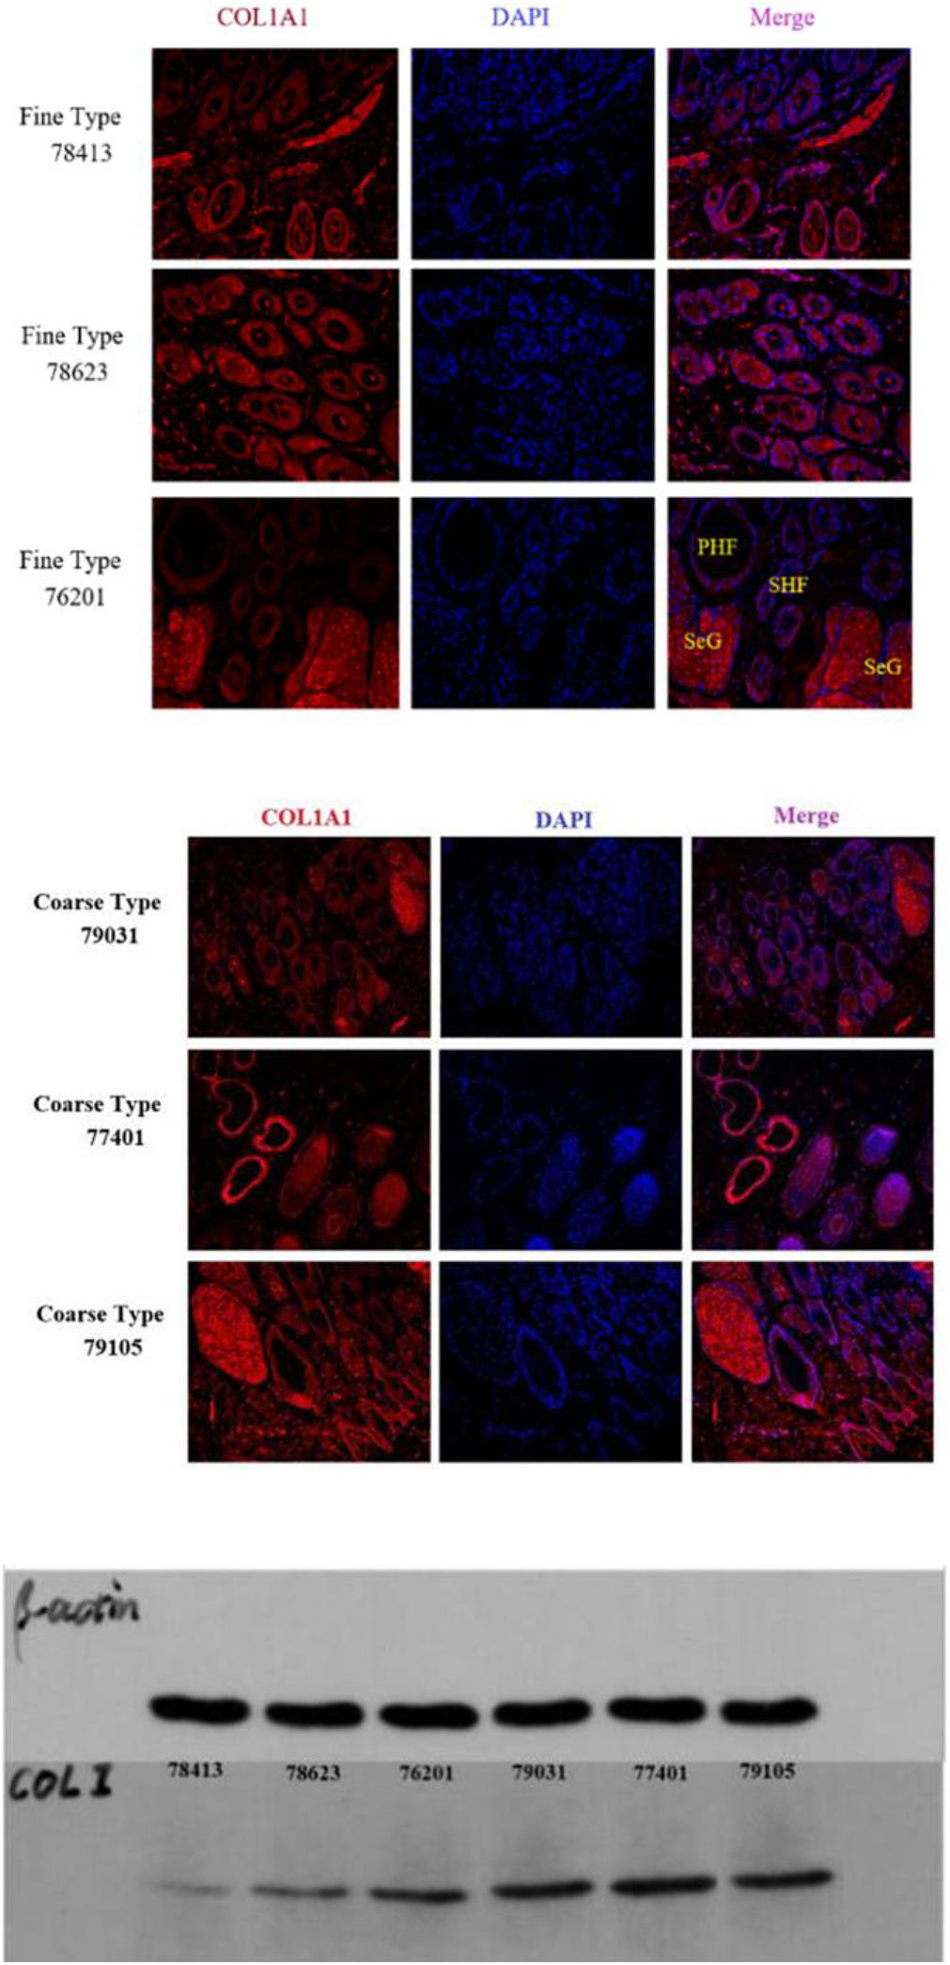
Figure 9. IF results of COL1A1 in FT-LCG and CT-LCG skin tissues (200x).
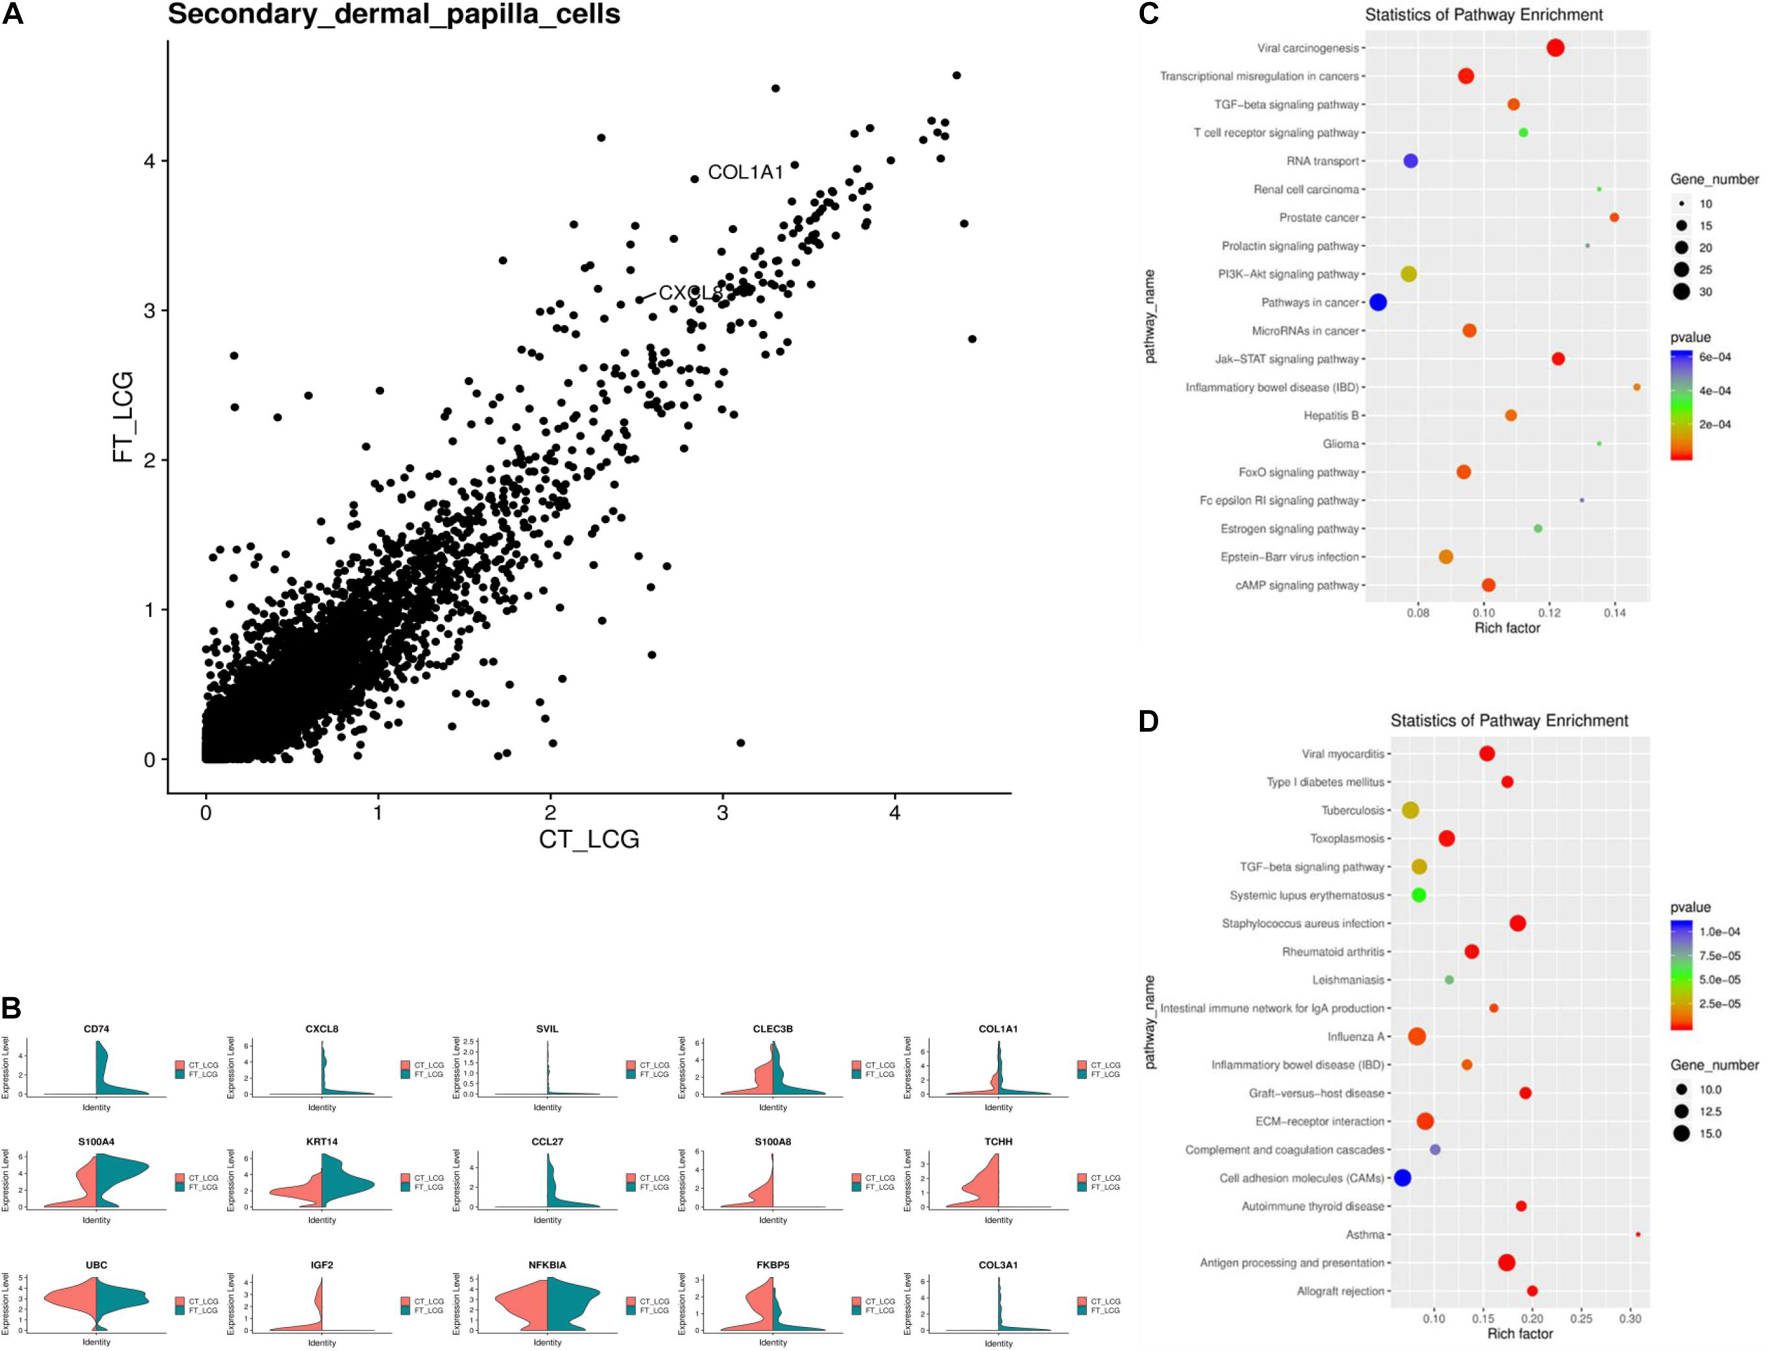
Figure 10. Analysis of DEGs between CT-LCG and FT-LCG SDPCs. (A) Scatterplot of DEGs in SDPCs. (B) Top 20 up-expressed genes in SDPCs. Red: CT-LCG; Green: FT-LCG. (C) KEGG analysis in CT-LCG. (D) KEGG analysis in FT-LCG.
We identified ACTA2 (α-SMA) as a marker gene of SDP cells by IF, and α-SMA protein was almost exclusively expressed on secondary hair follicles as shown in Figure 11. Meanwhile, we also chose COL1A1 and CXCL8 as marker genes of SDP cells. To further determine the relationship between these genes and cashmere fineness, we validated COL1A1 and CXCL8 in SDPCs by IF assay. We conducted IF tests on the skin of three kinds of coarse hairs and three kinds of fine hairs of Liaoning cashmere goats. The differential expressions of COL1A1 in coarse- and fine-type skin indicate that the number of SHFs in fine skin is more distributed, arranged tightly, and with smaller cashmere diameter, and the number of SHFs in coarse skin is less distributed, arranged sparsely, and with larger cashmere diameter (Figure 12). Wang shows that COL1A1 has differences in CT-LCG and FT-LCG (Jin et al., 2018). In the results of IF, the nucleus is blue, and the target protein is green. PHF is the primary hair follicle, and SHF is the secondary hair follicle, which is the place where cashmere grows. SeG is sebaceous glands. They form the hair follicle cluster. The SDPCs existed in the SHFs. CXCL8 is the DEG of CT-LCG and FT-LCG screened by us. The results show that the expression level of CXCL8 (IL-8) protein in CT-LCG was lower than that in FT-LCG (Figure 13). The results of fine and coarse fluorescent immunoassays are presented below. From the results, we can see that the results of IF are consistent with the results of single-cell sequencing.
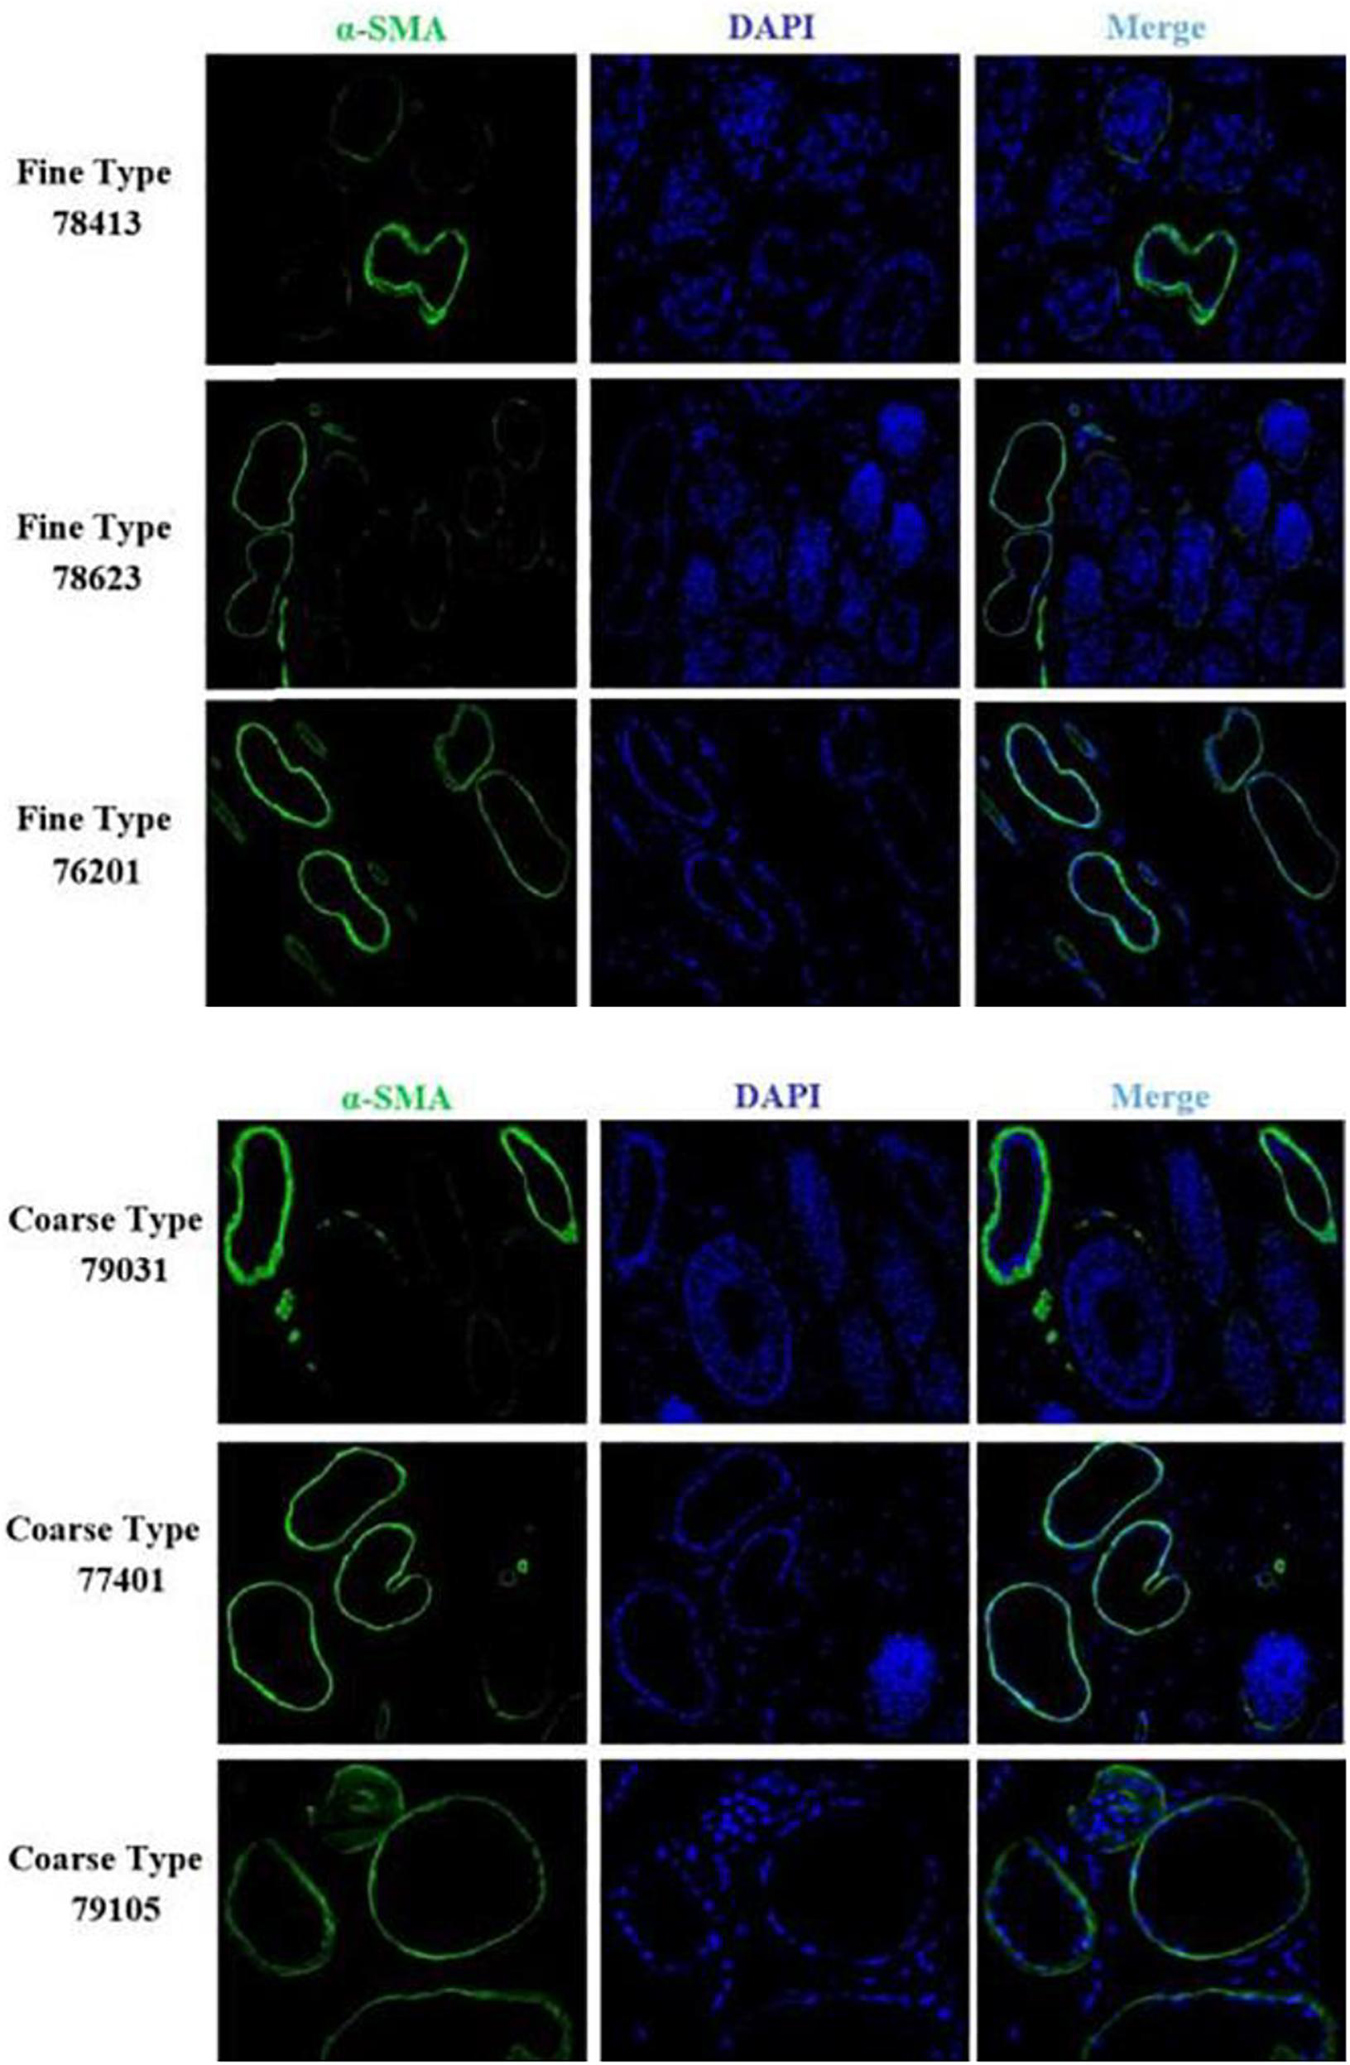
Figure 11. IF results of ACTA2 (α-SMA) in FT-LCG and CT-LCG skin tissues (200x). ACTA2 is basically expressed in SHFs.
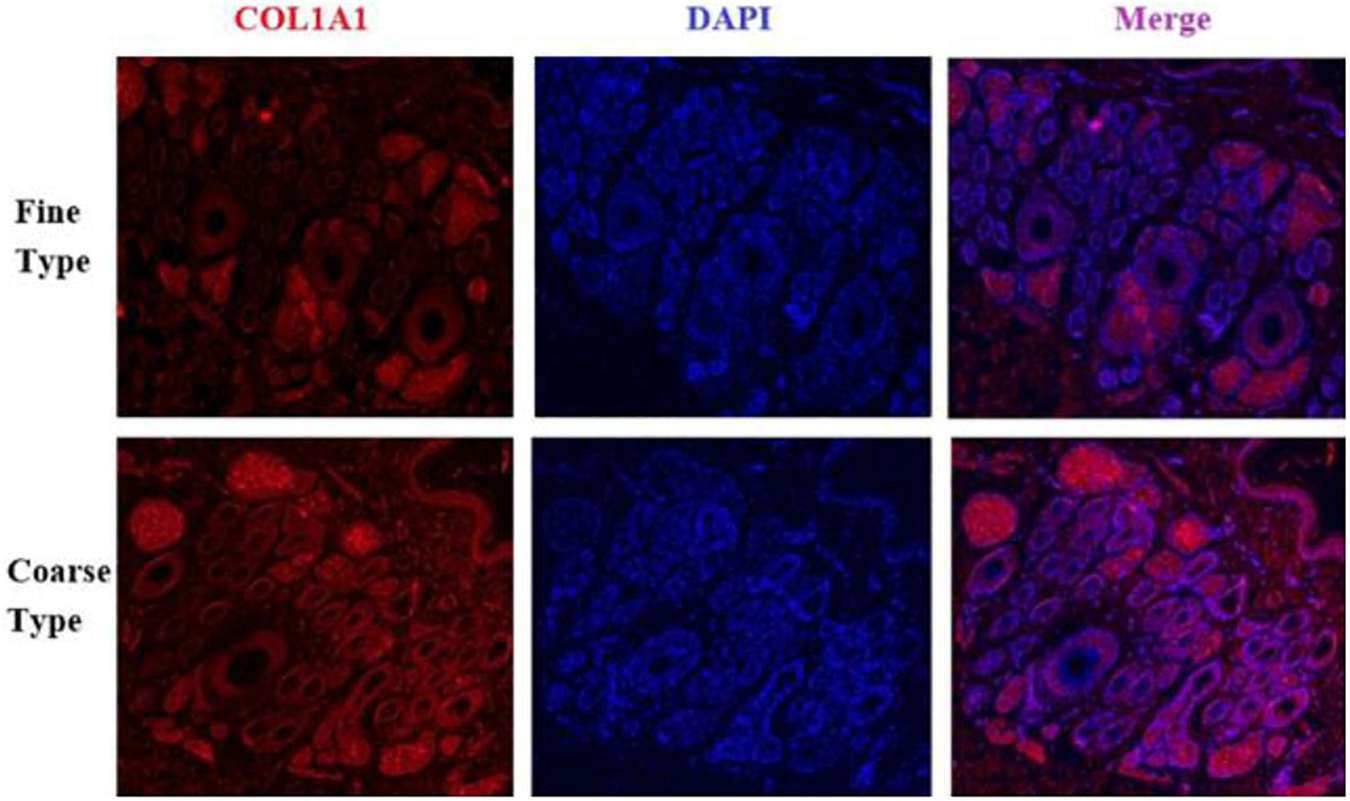
Figure 12. IF results of COL1A1 in FT-LCG and CT-LCG skin tissues (40x).
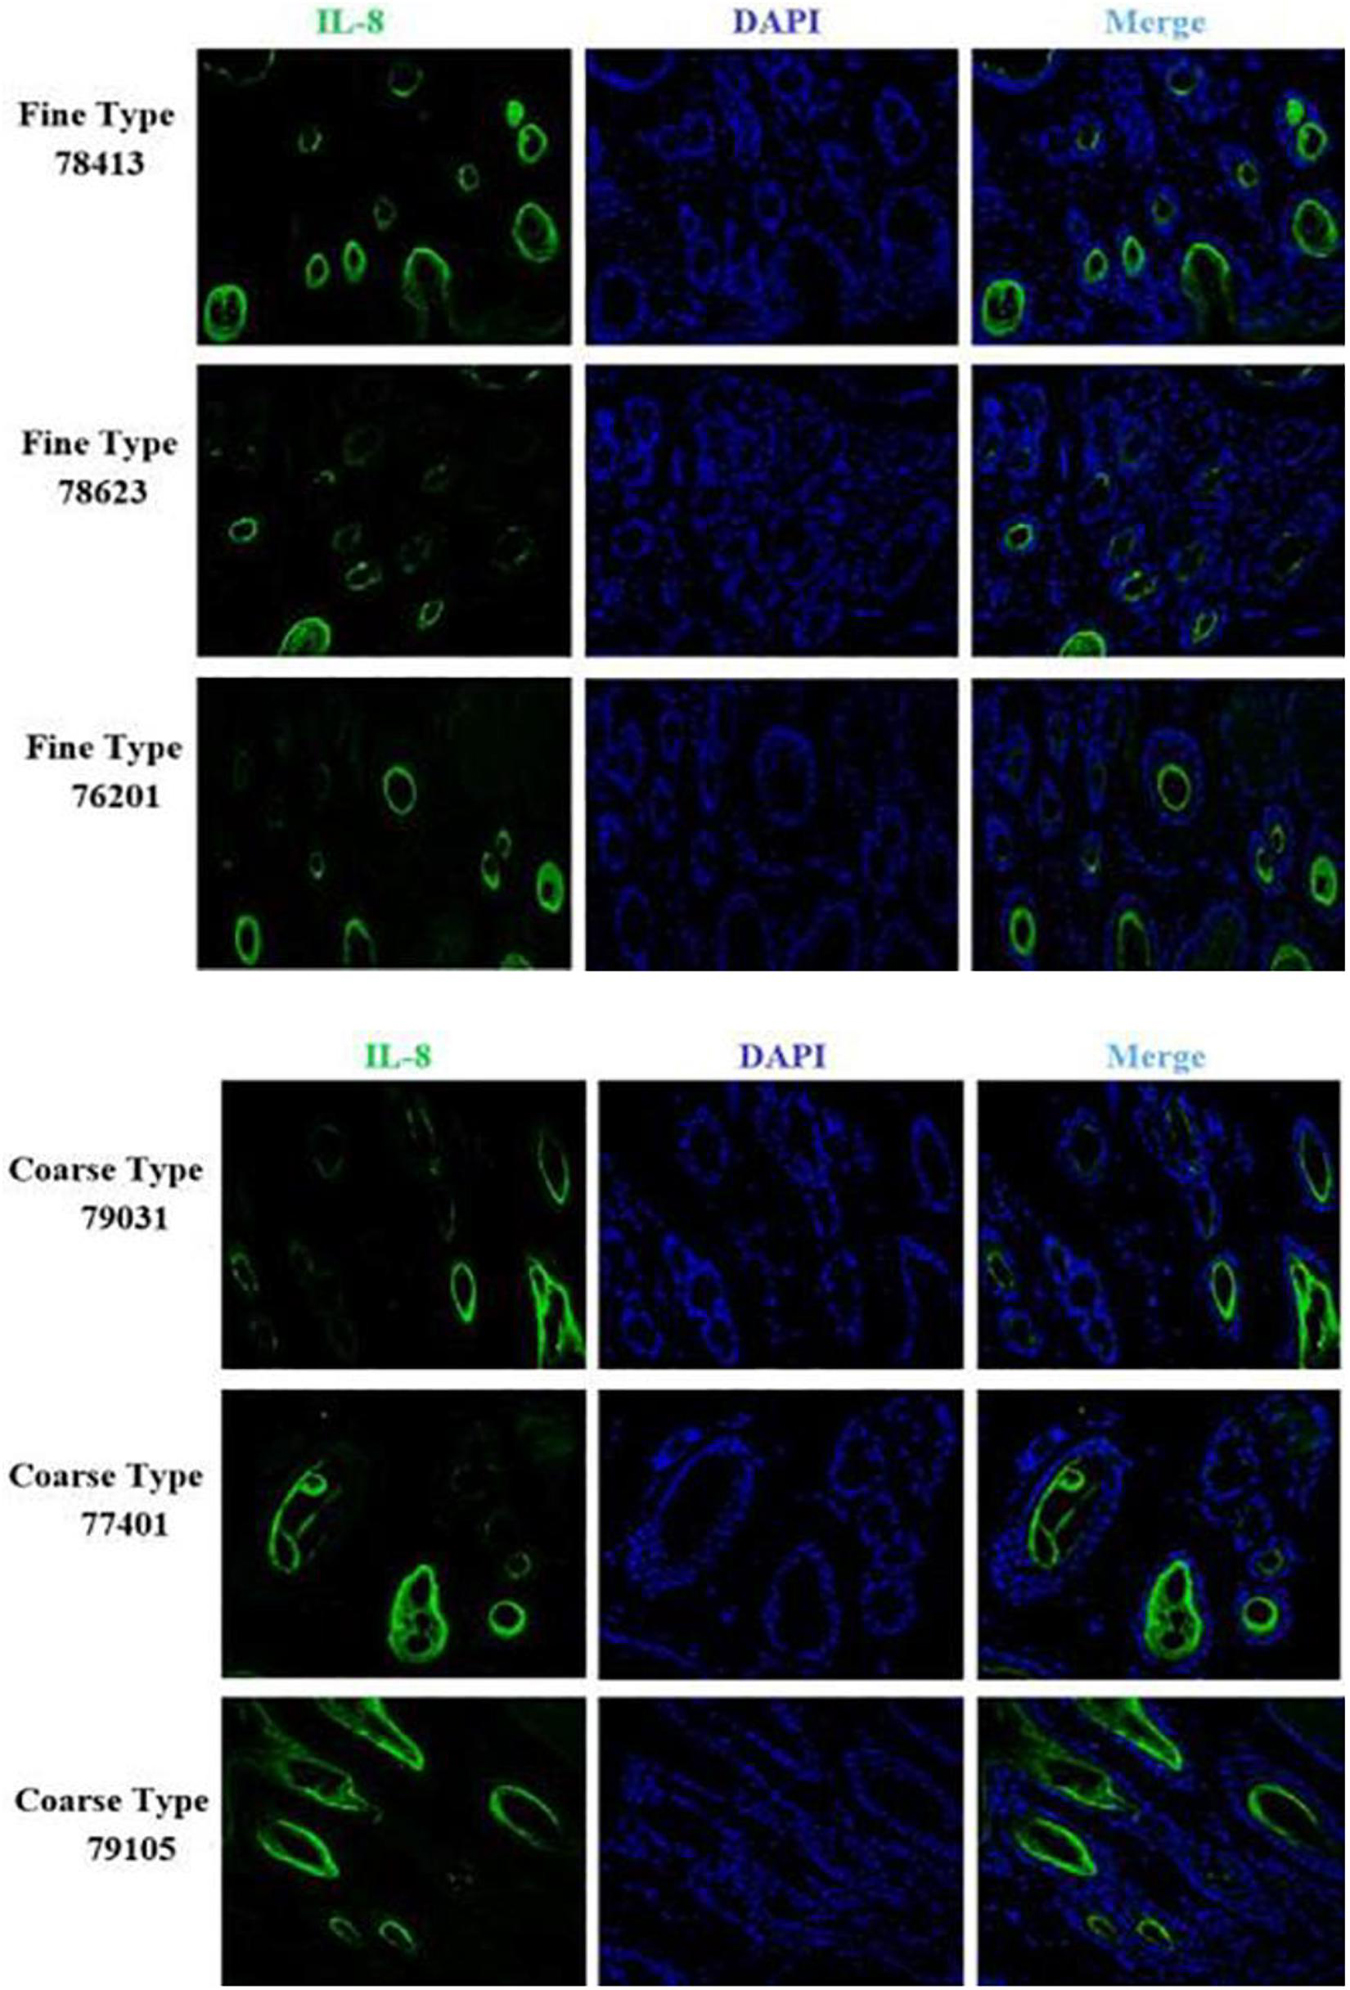
Figure 13. IF results of CXCL8 in FT-LCG and CT-LCG skin tissues (200x).
The optical density (OD) value of protein standard was measured at the wavelength of 568 nm, and the standard curve was established. The regression equation and variance coefficient were y = 0.6965x + 0.0141 and R2 = 0.997. Meanwhile, the results of electrophoresis show that the expression level of ACTA2 (α-SMA) and CXCL8 in CT-LCG was lower than that in FT-LCG as shown in Figure 14.
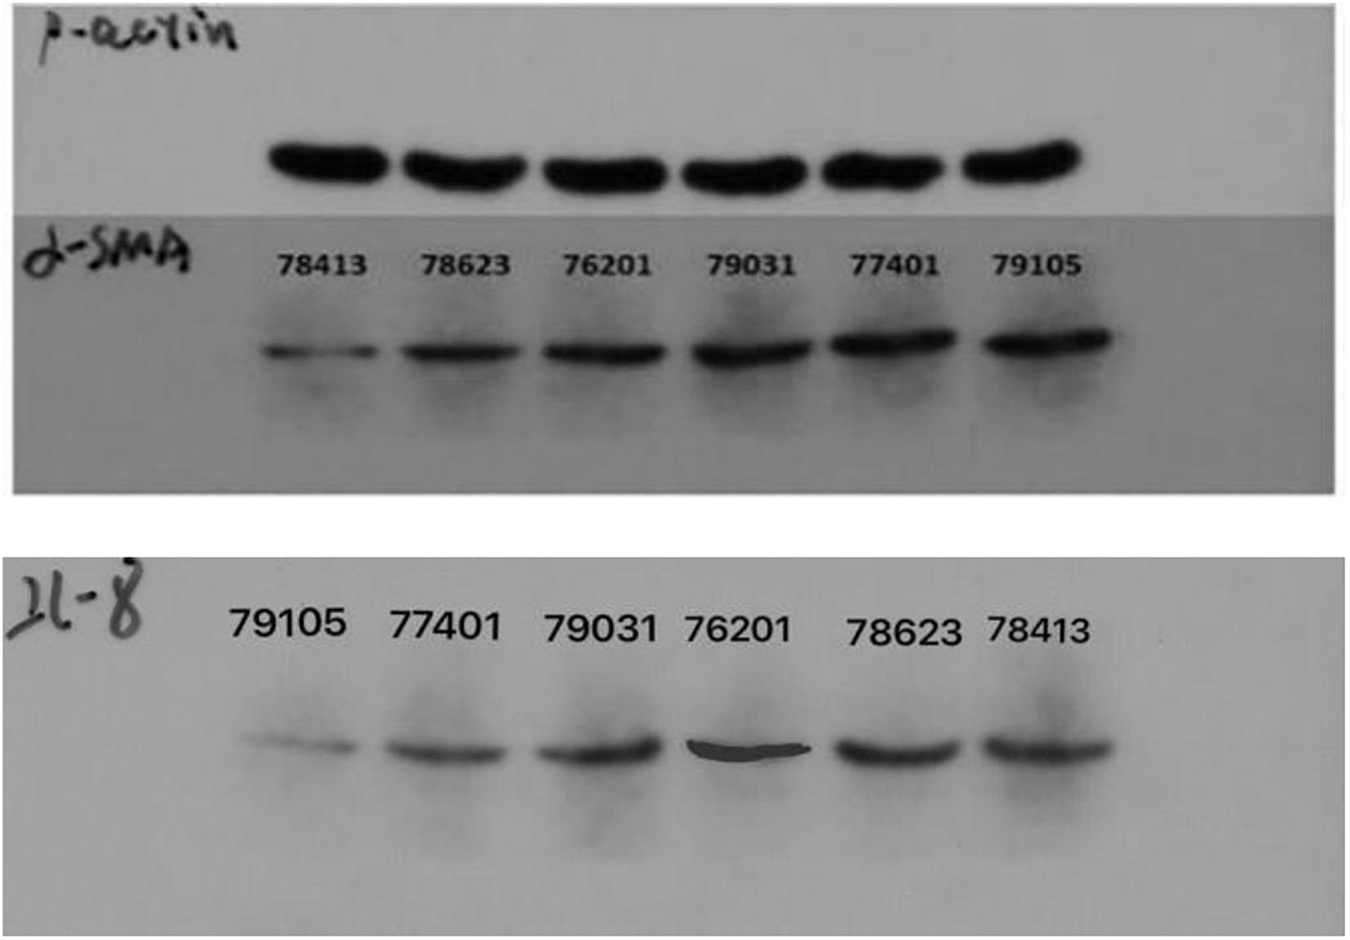
Figure 14. The electrophoretogram of ACTA2 (α-SMA) and CXCL8 (IL-8) at CT-LCG and FT-LCG.
Discussion
Cashmere goats mainly produce cashmere fiber, which plays an indispensable role in the textile industry. Cashmere fineness, the characteristic of natural quality, is a very important evaluation index in cashmere production. The study on cashmere diameter is the core issue of cashmere industry development. However, research on the fineness of cashmere is limited, and there is almost no research on the cellular level. The development of sscRNA-seq not only enriches the research methods of identifying cell types in cashmere goat skin, but also provides more candidate genes for hair formation regulation. Previous studies use single cell sequencing technology to reveal the molecular signatures of human, mouse, and other animals (Guo et al., 2018; Tepe et al., 2018; Fan et al., 2019; Zhang et al., 2020).
Here, we use single-cell sequencing to recognize 13 clusters of cells in Liaoning cashmere goat skin, including DPCs, SDPCs and stromal cells. We detected highly expressed genes in every cell type, and the development process of goat skin was studied by cell trajectory analysis. Differential gene expression profiles of 13 clusters provide a unique opportunity to identify positive markers to study the function of rare and insufficient cashmere goat skin. Then, we identified 31 modules in 13 types of cells through WGCNA, and the blue module was the most significant one in the SDP related to cashmere growth. Finally, we identified 16,601 genes, and 15 typical DEGs were screened in SDPCs between CT-LCG and FT-LCG, and COL1A1 and CXCL8 were verified. Our current study provides the first step to fill in the knowledge gaps about the characteristics of skin cell types in cashmere goats.
The cell trajectory analysis of cashmere goat skin is divided into 15 stages and seven nodes. With the development of the time axis, KRTAP11-1, KRTDAP, and TCHH play a role in early development, and KRT5, PPS7, and RPL5 play a role in development later. The results show that most of these genes were active in the later stage of skin development. GO analysis enriched to intermediate filament and keratinization, and KEGG pathway analysis mainly enriched to WNT, TGF beta, and PI3K-Akt signaling pathways, indicating that these genes may relate to cashmere formation and development. The WGCNA results have enriched 31 modules in total, and we have carried out network analysis on four modules. COL1A1, CCDC80, HOXA13, NFKBIE, CCL24, KRT3, KRT4, KRT19, KRT38, NFIB, and LHX2 are the key genes in the co-expression analysis module. COL1A1 is an important gene of the result of pseudo-time analysis and WGCNA in SDPCs of cashmere goat, which may be related to cashmere formation. In the clustering analysis and cell trajectory analysis, we removed batch effects by harmony.
Dermal papilla cells act as a relay station to transmit the effects of hormones and other molecules produced locally or systematically on hair growth (Paus et al., 2014), which also can instruct the activity of follicular keratinocytes to reshape hair follicles and produce a new hair shaft. Also, previous studies demonstrate that the induction characteristics of DPCs play a key role in morphogenesis, development, and hair formation of hair follicles and regulates the hair growth cycle after birth (Yang and Cotsarelis, 2010; Driskell et al., 2012). It is well known that some characteristic molecules are considered as classic signs to evaluate the induction characteristics of DPCs, such as HSPC016, Wnt10b, BMP6, and Wnt5a (Hu et al., 2010; Yang and Cotsarelis, 2010; Ouji et al., 2012; Song et al., 2012). However, their roles in the regulation of DPC secretion and their molecular mechanisms are still unclear. In our study, we observed that KRT35, KRTAP11-1, and KRTAP3-1 have unique expressions in DPCs. SOX2, WNT10b, HOXC8, and RSPO1 also have high expressions in DPCs. SOX2 is a specific marker gene in DPCs and its restricted expression in guard (Driskell et al., 2012). Wnt10b can accelerate the proliferation of DPCs and also has a potent ability to maintain VERSICAN expression in DPCs and sustained hair follicle (Ouji et al., 2012). Additionally, Ma defined 25 core signatures of cashmere goat DPCs, such as HOXC8 and RSPO1 (Ma et al., 2019).
Recently, a considerable number of genes have been identified that might be involved in reconstruction and development of cashmere goat SHFs. Wang reports some genes, such as HOXC13, SOX9, JUNB, LHX2, and GATA3, involved in hair follicle differentiation through selective expression in embryonic day 120 (Wang et al., 2020). In recent years, studies about cashmere goat SDPCs have increased (Geng et al., 2013; Mitoma et al., 2014; Liu et al., 2016; Yang et al., 2017); however, little information was available associated with the development and cashmere fineness of Liaoning cashmere goat SDPCs. In our investigations, we demonstrate that some genes exhibited significantly different expressions in SDPCs, such as COL1A1, COL3A1, and CCDC80. S100A4 had the highest enrichment in SDPCs, which were discovered in the human hair follicle DPCs (Mitoma et al., 2014). In addition, we identified 15 DEGs in two kinds of fiber fineness Liaoning cashmere goat skin, and CXCL8 had a significant difference in SDPCs of CT-LCG and FT-LCG. SDPCs play an important role in the growth and density of cashmere.
In conclusion, we identified 13 kinds of cells and DEGs in the skin of cashmere goats. The skin development of cashmere goats can be divided into 15 stages through the analysis of the cell trajectory. According to the network constructed by WGCNA, 31 modules were determined, and four modules were selected for detailed analysis, among which the genes in the blue module were the most significant in SDPCs. The results of scRNA-seq and IF demonstrate that COL1A1 may act in the regulation skin development, and CXCL8 may regulate cashmere fineness in Liaoning cashmere goats. Furthermore, our study provides valuable resources for the identification of a cell map of formerly unknown cashmere goats, which, in turn, will help to study the special contribution of cells to cashmere fiber.
Potential Implications
Cashmere fineness is one of the important factors determining cashmere quality; however, our understanding about the cells that make up the cashmere fineness is limited. We identified the key genes regulating cashmere formation in cashmere goat skin by 10 × Genomics single-cell sequencing. These genes may be involved in regulating the fineness of cashmere in goat SDPCs, and our research will provide new insights into the mechanism of cashmere growth and cashmere fineness regulation by cells.
Materials and Methods
Tissue Dissociation and Preparation of Single-Cell Suspensions
The skin tissue of cashmere is taken from the scapularis of two healthy Liaoning cashmere goats from the Liaoning Animal Husbandry Research Institute. The cashmere fineness of the two goats is 17.19 and 14.3 μm. Place a sterile RNase-free culture dish containing an appropriate amount of calcium-free and magnesium-free 1 × PBS on ice, the tissue was transferred into the culture dish and cut into 0.5-mm2 pieces, the tissues were washed with 1 × PBS to remove as many nonpurpose tissues as possible, such as blood stains and fatty layers. Tissues were dissociated into single cells in dissociation solution (0.35% collagenase IV5, 2 mg/ml papain, and 120 units/ml DNase I) in a 37°C water bath with shaking for 20 min at 100 rpm. Digestion was terminated with 1 × PBS containing 10% fetal bovine serum (FBS, V/V), then pipetting 5–10 times with a Pasteur pipette. The resulting cell suspension was filtered by passing through 70–30 μm stacked cell strainer and centrifuged at 300 g for 5 min at 4°C. The cell pellet was resuspended in 100 μ l 1 × PBS (0.04% BSA) and added to 1 ml 1× red blood cell lysis buffer (MACS 130-094-183, 10×) and incubated at room temperature or on ice for 2–10 min to lyse the remaining red blood cells. After incubation, the suspension was centrifuged at 300 g for 5 min at room temperature. The suspension was resuspended in 100 μl Dead Cell Removal MicroBeads (MACS 130-090-101) to remove dead cells using Miltenyi® Dead Cell Removal Kit (MACS 130-090-101). Then the suspension was resuspended in 1× PBS (0.04% BSA) and centrifuged at 300 g for 3 min at 4°C (repeat twice). The cell pellet was resuspended in 50 μl of 1× PBS (0.04% BSA). The overall cell viability was confirmed by trypan blue exclusion, which needed to be above 85%. Single cell suspensions were counted using a Countess II Automated Cell Counter and concentration adjusted to 700–1,200 cells/μl. All experimental procedures used in this study were approved and conducted according to the guidelines by the Laboratory Animal Management Committee of Shenyang Agricultural University; animal welfare number is 201806019.
Chromium 10 × Genomics Library and Sequencing
Single-cell suspensions were loaded on to 10x chromium to capture single cells according to the manufacturer’s instructions of the 10X Genomics Chromium Single-Cell 3’ kit (V3). The following cDNA amplification and library construction steps were performed according to the standard protocol. Libraries were sequenced on an Illumina NovaSeq 6000 sequencing system (paired-end multiplexing run, 150 bp) by LC-Bio Technology Co. Ltd. (Hangzhou, China) at a minimum depth of 20,000 reads per cell.
Bioinformatics Analysis
We used 10x Genomics official analysis software Cell Ranger1 to filter, compare, quantify, and identify the recovered cells, and finally get the gene expression matrix of each cell. Seurat2 was used for further cell filtration, standardization, and classification of cell subsets; DEG analysis of each subgroup; and marker gene screening. We performed cell filtration based on the number of genes expressed by cells (using the gene expression number 500 as the threshold). The filtering of low-quality cells uses the Seurat data analysis R package. Its functions include quality control, filtering, data standardization, principal component analysis (PCA), t-SNE differential gene analysis, etc. At the same time, it has the function of visualizing the analysis results (Butler et al., 2018). Seurat analyzed the DEGs in different cell populations by the bimod (McDavid et al., 2013) likelihood ratio statistical test to screen up-regulated genes in different cell populations.
To visualize the data, we further reduced the dimensionality of all 13,051 cells using Seurat and used t-SNE to project the cells into 2-D space. The steps include (1) using the LogNormalize method of the “Normalization” function of the Seurat software to calculated the expression value of genes; (2) PCA was performed using the normalized expression value. Within all the PCs, the top 10 were used to do clustering and t-SNE analysis. (3) To find clusters, select the weighted shared nearest neighbor graph-based clustering method. Marker genes for each cluster were identified with bimod with default parameters via the find all markers function in Seurat (version 3.1.1). This selects marker genes that are expressed in more than 10% of the cells in a cluster and average log (fold change) of greater than 0.26. For cell trajectory analysis, we used the Monocle analysis toolkit (Trapnell et al., 2014), and Monocle 2 analysis was used to order cells in pseudo-time. We use the default function to estimate the size factor and dispersion. We applied DDRTree for dimension reduction. To visualize all pseudo chronos genes that may regulate cashmere development, we cluster the regulation of genes according to time changes. GO3 and KEGG are the functions of Kyoto Gene and Genome Encyclopedia4 to analyze the function of differential genes. The results are displayed using a ggpl set analysis scatterplot. GO/KEGG Bioinformatic analysis was performed using the OmicStudio tools at https://www.omicstudio.cn/tool.
Weighted Gene Correlation Network Analysis
The co-expression network was performed using the “WGCNA” R package for the filtered genes (Langfelder and Horvath, 2008). We use the pairwise Pearson coefficient to find the co-expression adjacency matrix of all genes in the weighting. The TOM matrix is used to estimate its connectivity in the network (Langfelder and Horvath, 2012). The co-expression network analysis of hub gene in modules was established by Cytoscape 3.5.1 software. Each node represents a gene associated with a different number of genes. The partition module uses the BlockWiseModules function in the WGCNA package. The main parameters are power = 9; merge cut height = 0.25; everything else is default; the network graph visualization uses the Export Network to Cytoscape function in the WGCNA package. The main parameter: threshold = 0.1, and the other parameters are the default parameters.
Immunofluorescence
Skin tissue used for this test was derived from six Liaoning cashmere goats, including three fine-type goats and three coarse-type goats. The goat number of the three fine goats were 78,413, 78,623, and 76,201, and their cashmere fineness is 14.32, 14.69, and 14.77 μm, respectively. The goat number of the three coarse goats is 79,031, 77,401, and 79,105, and their cashmere fineness is 17.23, 17.63, and 17.91 μm, respectively. The skin tissues were fixed with 4% paraformaldehyde for 24 h, dehydrated with gradient alcohol, treated with xylene transparently, and embedded in paraffin. Slides were sliced by a Leica pathological slicer (Leica RM 2016 rotary slicer, Germany). The slides were put into a 40°C water bath pot for spreading. The anti-stripping glass piece is inserted into the water surface obliquely to remove the slice so that the slice is attached to the appropriate position of the slides. The slice was baked in a 60°C oven (Wuhan Junjie jk-6 biological tissue spreading and baking machine) for 3 h. The paraffin sections were successively put into xylene I (20 min) – xylene II (20 min) – xylene III (20 min) – anhydrous ethanol I (5 min) – anhydrous ethanol II (5 min) – 95% alcohol (5 min) – 90% alcohol (5 min) – 80% alcohol (5 min) – 70% alcohol (5 min), and then soaked in distilled water for 5 min. Microwave was used for antigen repair. The dewaxed and hydrated tissue sections are placed on the high temperature–resistant plastic section frame in the beaker (or repair box), and a proper amount of repair solution (0.01 M citric acid buffer, pH 6.0) is added in the beaker. The liquid surface should be soaked in the slides to a certain height. The microwave oven can first use high-grade heating to make the liquid boil. When heating to boiling, adjust it to the middle level and start timing; the repair time is 15 min. Take out the beaker from the microwave oven, put it into cold water to cool down, take out the glass slide when the repair solution drops to room temperature, wash it with PBS (pH 7.4) three times, each time for 3 min. Dry the slides with absorbent paper, draw a circle around the tissues with the brush of the immune group, drip diluted normal goat serum, and seal it at room temperature for 30 min to reduce nonspecific staining. Shake off the excess liquid, do not wash it, then drop the diluted first antibody, after adding the first antibody, incubate it in a 4°C wet box overnight (15 h). The sections were washed by BST three times for 3 min each time. After the sections were dried by absorbent paper, the diluted fluorescent secondary antibody was added. The slides were incubated in a wet box at 37°C for 1 h. The slides were washed by PBST four times, 3 min each time. The sections were washed by BST three times, 3 min each time. After the sections were dried by absorbent paper, the diluted fluorescent secondary antibody was added. The sections were incubated in a wet box at 37°C for 1 h. The sections were washed by PBST four times, 3 min each time. Primary antibody: collagen I (Wuhan doctoral Bioengineering Co., Ltd.), ACTA2 (Abcam), IL-8 (Abcam), dilution ratio is 1:100. Secondary antibody: fluorescence (Cy3) labeled Sheep anti rabbit IgG (Abcam), fluorescence (Cy3) labeling of Goat anti mouse IgG, dilution ratio is 1:100.
Western Blot
The proteins in each group were extracted using the radio immunoprecipitation assay lysis buffer added with protease inhibitors. Then, quantification of protein was performed with a bicinchoninic acid Protein Assay Kit. The extracted protein supernatant was mixed with 5× sodium dodecyl sulfate (SDS)-polyacrylamide gel electrophoresis (PAGE) loading buffer (the volume ratio was 4:1) and put into boiling water for 10 min. Prepare electrophoresis gel, which consists of 6 ml 5% concentrated gum and 20 ml 12% separating gum, the former consists of 4.1 ml of H2O, 1.0 ml 30% Acrylamide, 0.75 ml 1.0 Mtris–HCl (pH6.8), 0.06 ml 10% SDS and 0.06 ml APS; the latter consists of 6.6 ml of H2O, 8.0 ml 30% Acrylamide, 5.0 ml 1.5 Mtris–HCl (pH8.8), 0.2 ml 10% SDS, 0.2 ml APS, and 0.008 ml TEMED. Fix the prepared glue on the electrophoresis tank and pour the electrophoresis solution into the storage tank. The prepared protein sample and marker were added into the sample hole with a micro sampler, and the total protein content of each sample was 40 μg. After adding the sample, first constant pressure 80 V electrophoresis was applied to the Bromphenol blue indicator at the junction between the concentrated and separation glue and changed to constant pressure 120 V to Bromphenol blue to the bottom of gel; this process is about 1.5 h. Take out the gel, cut the target strip according to marker, rinse with distilled water, cut the same size polyvinylidene fluoride (PVDF) film and filter paper with the PAGE gel, immerse the PVDF membrane with methanol for a few seconds, and immerse it in the electromigration buffer with the filter paper. According to the black plate – fiber mat – filter paper – gel – PVDF membrane – filter paper – fiber mat – white plate in good order, after clamping the plate into the rotating film instrument, black plate side contrast black negative pole. Fill the membrane transfer tank with electric fluid to start membrane transfer. The PVDF membrane was soaked in tris buffered saline tween (TBST; blocking solution) containing 5% skimmed milk powder and sealed in a shaker at room temperature for 2 h. The PVDF membrane was immersed in the primary antibody incubation solution and incubated overnight at 4°C. The antibodies are β-actin, Collagen I, ACTA2, and CXCL8. Their dilution is 1:1000. The PVDF membrane was fully washed by TBST five times, 5 min/time. Put up to three films in a dish, and pay attention to whether the film is attached to the dish wall or whether the films overlap during membrane washing. TBST was used to dilute the corresponding HRP labeled second antibody—1:50,000, and the PVDF membrane was immersed in the second antibody incubation solution and incubated in a shaker at room temperature for 2 h. The PVDF membrane was fully washed by TBST five times, 5 min/time. Mix the reinforcement solution and stable peroxidase solution of electrochemiluminescence reagent in the proportion of 1:1, drop the working solution onto PVDF membrane, react for several minutes, after the fluorescence band is obvious, use filter paper to absorb the excess substrate solution, cover with fresh-keeping film, press the X-ray film, then successively add the developing solution, fixing solution, and develop the film. Dry the film, scan the film, and analyze the gray value of the film with IPP. β-actin was used as a loading control.
Data Availability Statement
The datasets presented in this study can be found in online repositories. The names of the repository/repositories and accession number(s) can be found here: GEO GSE182474.
Ethics Statement
The animal study was reviewed and approved by the Laboratory Animal Management Committee of Shenyang Agricultural University.
Author Contributions
ZW and RW design the project. YYZ, YRW, TH, and RC carry out the experiment. YXZ, XD, XHZ, and DG provide resources. JS, WC, XJZ, MG, and YQ perform and isolate sample collection. YYZ, YRW, TH, YX, YZ, SG, CY, and ZB perform the bioinformatic analysis. HT, WW, YC, MB, and YF perform the soft. All authors reviewed the manuscript.
Funding
This work was supported financially by grants from the National Natural Science Foundation of China (NO. 31802038), The 69th batch of China Postdoctoral Science Foundation (Regional Special Support Program; NO. 2021M693859), Youth seedling project of Liaoning Provincial Department of Education, China (LSNQN201905), Liaoning Revitalization Talents Program (XLYC1807040), Liaoning BaiQianWan Talents Program Project, National Downy Sheep Industrial Technology System (CARS-39-10), and National Natural Science Foundation of China (NO. 31872325). Liaoning Provincial Department of science and technology, agricultural key issues and industrialization project (2020JH2/10200029).
Conflict of Interest
The authors declare that the research was conducted in the absence of any commercial or financial relationships that could be construed as a potential conflict of interest.
Publisher’s Note
All claims expressed in this article are solely those of the authors and do not necessarily represent those of their affiliated organizations, or those of the publisher, the editors and the reviewers. Any product that may be evaluated in this article, or claim that may be made by its manufacturer, is not guaranteed or endorsed by the publisher.
Acknowledgments
We thank LC-Bio Technology Co., Ltd., (Hangzhou, China) for its help in the process of Bioinformation Analysis.
Footnotes
- ^ https://support.10xgenomics.com/single-cell-geneexpression/software/overview/welcome
- ^ https://satijalab.org/seurat/
- ^ http://geneontology.org/
- ^ www.genome.jp/kegg
References
Bai, W. L., Zhao, S. J., Wang, Z. Y., Zhu, Y. B., Dang, Y. L., Cong, Y. Y., et al. (2018). LncRNAs in secondary hair follicle of cashmere goat: identification, expression, and their regulatory network in Wnt signaling pathway. Anim. Biotechnol. 29, 199–211. doi: 10.1080/10495398.2017.1356731
Biton, M., Haber, A. L., Rogel, N., Burgin, G., Beyaz, S., Schnell, A., et al. (2018). T helper cell cytokines modulate intestinal stem cell renewal and differentiation. Cell 175, 1307–1320.e22.
Buenrostro, J. D., Corces, M. R., Lareau, C. A., Wu, B., Schep, A. N., Aryee, M. J., et al. (2018). Integrated single-cell analysis maps the continuous regulatory landscape of human hematopoietic differentiation. Cell 173, 1535–1548.e16.
Butler, A., Hoffman, P., Smibert, P., Papalexi, E., and Satija, R. (2018). Integrating single-cell transcriptomic data across different conditions, technologies, and species. Nat. Biotechnol. 36, 411–420.
Dai, B., Sha, R., Yuan, J., and Liu, D. (2021). Multiple potential roles of thymosin β4 in the growth and development of hair follicles. J. Cell. Mol. Med. 25, 1350–1358. doi: 10.1111/jcmm.16241
Dong, L., Hao, H., Liu, J., Tong, C., Ti, D., Chen, D., et al. (2017). Wnt1a maintains characteristics of dermal papilla cells that induce mouse hair regeneration in a 3D preculture system. J. Tissue Eng. Regen. Med. 11, 1479–1489. doi: 10.1002/term.2046
Driskell, R. R., Juneja, V. R., Connelly, J. T., Kretzschmar, K., Tan, D. W. M., and Watt, F. M. (2012). Clonal growth of dermal papilla cells in hydrogels reveals intrinsic differences between Sox2-positive and -negative cells in vitro and in vivo. J. Invest. Dermatol. 132, 1084–1093.
Fan, X., Bialecka, M., Moustakas, I., Lam, E., Torrens-Juaneda, V., Borggreven, N. V., et al. (2019). Single-cell reconstruction of follicular remodeling in the human adult ovary. Nat. Commun. 10:3164.
Geng, R., Yuan, C., and Chen, Y. (2013). Exploring differentially expressed genes by RNA-Seq in cashmere goat (Capra hircus) skin during hair follicle development and cycling. PLoS One 8:e62704. doi: 10.1371/journal.pone.0062704
Gong, W., Kwak, I. Y., Pota, P., Koyano-Nakagawa, N., and Garry, D. J. (2018). DrImpute: imputing dropout events in single cell RNA sequencing data. BMC Bioinformatics 19:220. doi: 10.1186/s12859-018-2226-y
Guo, J., Grow, E. J., Mlcochova, H., Maher, G. J., Lindskog, C., Nie, X., et al. (2018). The adult human testis transcriptional cell atlas. Cell Res. 28, 1141–1157. doi: 10.1038/s41422-018-0099-2
He, N., Su, R., Wang, Z., Zhang, Y., and Li, J. (2020). Exploring differentially expressed genes between anagen and telogen secondary hair follicle stem cells from the Cashmere goat (Capra hircus) by RNA-Seq. PLoS One 15:e0231376. doi: 10.1371/journal.pone.0231376
Hu, B., Lefort, K., Qiu, W., Nguyen, B. C., Rajaram, R. D., Castillo, E., et al. (2010). Control of hair follicle cell fate by underlying mesenchyme through a CSL-Wnt5a-FoxN1 regulatory axis. Genes Dev. 24, 1519–1532. doi: 10.1101/gad.1886910
Jin, M., Cao, M., Cao, Q., Piao, J., Zhao, F., and Piao, J. (2018). Long noncoding RNA and gene expression analysis of melatonin-exposed Liaoning cashmere goat fibroblasts indicating cashmere growth. Naturwissenschaften 105:60. doi: 10.1007/s00114-018-1585-6
Jin, M., Cao, Q., Wang, R., Piao, J., Zhao, F., Piao, J., et al. (2017). Molecular characterization and expression pattern of a novel Keratin-associated protein 11.1 gene in the Liaoning cashmere goat (Capra hircus). Asian Australas J. Anim. Sci. 30, 328–337. doi: 10.5713/ajas.16.0078
Joost, S., Zeisel, A., Jacob, T., Sun, X., La Manno, G., Lönnerberg, P., et al. (2016). Single-cell transcriptomics reveals that differentiation and spatial signatures shape epidermal and hair follicle heterogeneity. Cell Syst. 3, 221–237.e9. doi: 10.1016/j.cels.2016.08.010
Langfelder, P., and Horvath, S. (2008). WGCNA: an R package for weighted correlation network analysis. BMC Bioinformatics 9:559. doi: 10.1186/1471-2105-9-559
Langfelder, P., and Horvath, S. (2012). Fast R functions for robust correlations and hierarchical clustering. J. Stat. Softw. 46:i11. doi: 10.18637/jss.v046.i11
Li, Y., Li, W., Zhang, J., Ji, D., Zhang, G., and Yang, B. (2013). Identification of genes influencing formation of the type III Brush Hair in Yangtze River Delta white goats by differential display of mRNA. Gene 526, 205–209. doi: 10.1016/j.gene.2013.05.030
Liu, B., Gao, F., Guo, J., Wu, D., Hao, B., Li, Y., et al. (2016). A microarray-based analysis reveals that a short photoperiod promotes hair growth in the Arbas cashmere goat. PLoS One 11:e0147124. doi: 10.1371/journal.pone.0147124
Liu, Z., Xiao, H., Li, H., Zhao, Y., Lai, S., Yu, X., et al. (2012). Identification of conserved and novel microRNAs in cashmere goat skin by deep sequencing. PLoS One 7:e50001. doi: 10.1371/journal.pone.0050001
Ma, S., Wang, Y., Zhou, G., Ding, Y., Yang, Y., Wang, X., et al. (2019). Synchronous profiling and analysis of mRNAs and ncRNAs in the dermal papilla cells from cashmere goats. BMC Genomics 20:512. doi: 10.1186/s12864-019-5861-4
McDavid, A., Finak, G., Chattopadyay, P. K., Dominguez, M., Lamoreaux, L., Ma, S. S., et al. (2013). Data exploration, quality control and testing in single-cell qPCR-based gene expression experiments. Bioinformatics 29, 461–467. doi: 10.1093/bioinformatics/bts714
Ming, G. L., and Song, H. (2011). Adult neurogenesis in the mammalian brain: significant answers and significant questions. Neuron 70, 687–702. doi: 10.1016/j.neuron.2011.05.001
Mitoma, C., Kohda, F., Mizote, Y., Miake, A., Ijichi, A., Kawahara, S., et al. (2014). Localization of S100A2, S100A4, S100A6, S100A7, and S100P in the human hair follicle. Fukuoka Igaku Zasshi 105, 148–156.
Movérare, S., Lindberg, M. K., Faergemann, J., Gustafsson, J. A., and Ohlsson, C. (2002). Estrogen receptor alpha, but not estrogen receptor beta, is involved in the regulation of the hair follicle cycling as well as the thickness of epidermis in male mice. J. Invest. Dermatol. 119, 1053–1058. doi: 10.1046/j.1523-1747.2002.00637.x
Ouji, Y., Ishizaka, S., and Yoshikawa, M. (2012). Dermal papilla cells serially cultured with Wnt-10b sustain their hair follicle induction activity after transplantation into nude mice. Cell Transplant. 21, 2313–2324. doi: 10.3727/096368912X636867
Pace, L., Goudot, C., Zueva, E., Gueguen, P., Burgdorf, N., Waterfall, J. J., et al. (2018). The epigenetic control of stemness in CD8(+) T cell fate commitment. Science 359, 177–186. doi: 10.1126/science.aah6499
Pandey, S., Shekhar, K., Regev, A., and Schier, A. F. (2018). Comprehensive identification and spatial mapping of habenular neuronal types using single-cell RNA-seq. Curr. Biol. 28, 1052–1065.e7. doi: 10.1016/j.cub.2018.02.040
Paus, R., Langan, E. A., Vidali, S., Ramot, Y., and Andersen, B. (2014). Neuroendocrinology of the hair follicle: principles and clinical perspectives. Trends Mol. Med. 20, 559–570. doi: 10.1016/j.molmed.2014.06.002
Qiao, X., Su, R., Wang, Y., Wang, R., Yang, T., Li, X., et al. (2017). Genome-wide target enrichment-aided chip design: a 66 K SNP chip for cashmere goat. Sci. Rep. 7:8621. doi: 10.1038/s41598-017-09285-z
Shah, P. T., Stratton, J. A., Stykel, M. G., Abbasi, S., Sharma, S., Mayr, K. A., et al. (2018). Single-cell transcriptomics and fate mapping of ependymal cells reveals an absence of neural stem cell function. Cell 173, 1045–1057.e9. doi: 10.1016/j.cell.2018.03.063
Shen, Z. (2017). Regulation of IGF1 and TIMP1 on the Related Signal Pathways During Development of Arbas Cashmere Goat Dermal Papilla Cells [D]. Hohhot: Inner Mongolia University.
Song, Z., Zhou, C., Wang, J., Yang, W., and Hao, F. (2012). Effect of HSPC016 gene expression on the aggregative growth of dermal papillae cells. Australas J. Dermatol. 53, e26–e29. doi: 10.1111/j.1440-0960.2010.00700.x
Tahmasebi, A., Ashrafi-Dehkordi, E., Shahriari, A. G., Mazloomi, S. M., and Ebrahimie, E. (2019). Integrative meta-analysis of transcriptomic responses to abiotic stress in cotton. Prog. Biophys. Mol. Biol. 146, 112–122. doi: 10.1016/j.pbiomolbio.2019.02.005
Tepe, B., Hill, M. C., Pekarek, B. T., Hunt, P. J., Martin, T. J., Martin, J. F., et al. (2018). Single-cell RNA-seq of mouse olfactory bulb reveals cellular heterogeneity and activity-dependent molecular census of adult-born neurons. Cell Rep. 25, 2689–2703.e3. doi: 10.1016/j.celrep.2018.11.034
Torii, E., Segi, E., Sugimoto, Y., Takahashi, K., Kabashima, K., Ikai, K., et al. (2002). Expression of prostaglandin E(2) receptor subtypes in mouse hair follicles. Biochem. Biophys. Res. Commun. 290, 696–700. doi: 10.1006/bbrc.2001.6256
Trapnell, C., Cacchiarelli, D., Grimsby, J., Pokharel, P., Li, S., Morse, M., et al. (2014). The dynamics and regulators of cell fate decisions are revealed by pseudotemporal ordering of single cells. Nat. Biotechnol. 32, 381–386. doi: 10.1038/nbt.2859
Wang, S., Ge, W., Luo, Z., Guo, Y., Jiao, B., Qu, L., et al. (2017). Integrated analysis of coding genes and non-coding RNAs during hair follicle cycle of cashmere goat (Capra hircus). BMC Genomics 18:767. doi: 10.1186/s12864-017-4145-0
Wang, S., Li, F., Liu, J., Zhang, Y., Zheng, Y., Ge, W., et al. (2020). Integrative analysis of methylome and transcriptome reveals the regulatory mechanisms of hair follicle morphogenesis in cashmere goat. Cells 9:969. doi: 10.3390/cells9040969
Yang, C. C., and Cotsarelis, G. (2010). Review of hair follicle dermal cells. J. Dermatol. Sci. 57, 2–11. doi: 10.1016/j.jdermsci.2009.11.005
Yang, M., Song, S., Dong, K., Chen, X., Liu, X., Rouzi, M., et al. (2017). Skin transcriptome reveals the intrinsic molecular mechanisms underlying hair follicle cycling in Cashmere goats under natural and shortened photoperiod conditions. Sci. Rep. 7:13502.
Yin, X. Y., Cheng, G. H., Guo, H. Y., Wang, Q., Li, Y. J., and Zhang, H. (2017). Single cell transcriptome profiling revealed differences in gene expression during oocyte maturation in Haimen white goats. Genet. Mol. Res. 16:gmr16019564. doi: 10.4238/gmr16019564
Zhang, W., Zhang, S., Yan, P., Ren, J., Song, M., Li, J., et al. (2020). A single-cell transcriptomic landscape of primate arterial aging. Nat. Commun. 11:2202. doi: 10.1038/s41467-020-15997-0
Keywords: 10 × Genomics single-cell sequencing, cashmere fineness, SDPCs, COL1A1, ACTA2, CXCL8
Citation: Wang Z, Wang Y, Hui T, Chen R, Xu Y, Zhang Y, Tian H, Wang W, Cong Y, Guo S, Zhu Y, Zhang X, Guo D, Bai M, Fan Y, Yue C, Bai Z, Sun J, Cai W, Zhang X, Gu M, Qin Y, Sun Y, Wu Y, Wu R, Dou X, Bai W and Zheng Y (2021) Single-Cell Sequencing Reveals Differential Cell Types in Skin Tissues of Liaoning Cashmere Goats and Key Genes Related Potentially to the Fineness of Cashmere Fiber. Front. Genet. 12:726670. doi: 10.3389/fgene.2021.726670
Received: 08 July 2021; Accepted: 25 August 2021;
Published: 10 November 2021.
Edited by:
Gary S. Stein, University of Vermont, United StatesCopyright © 2021 Wang, Wang, Hui, Chen, Xu, Zhang, Tian, Wang, Cong, Guo, Zhu, Zhang, Guo, Bai, Fan, Yue, Bai, Sun, Cai, Zhang, Gu, Qin, Sun, Wu, Wu, Dou, Bai and Zheng. This is an open-access article distributed under the terms of the Creative Commons Attribution License (CC BY). The use, distribution or reproduction in other forums is permitted, provided the original author(s) and the copyright owner(s) are credited and that the original publication in this journal is cited, in accordance with accepted academic practice. No use, distribution or reproduction is permitted which does not comply with these terms.
*Correspondence: Rina Wu, rinawu@syau.edu.cn; wrn6956@163.com; Xingtang Dou, dou791120@sina.com; Wenlin Bai, baiwenlin@syau.edu.cn; Yuanyuan Zheng, zhengyuanyuan07@163.com
†These authors share first authorship