 Biao Chen1
 Ximing Xu
 Dan-dan Lin
 Wei-guo Dong
- 1Cancer Center, Renmin Hospital of Wuhan University, Wuhan, China
- 2Department of Gastroenterology, Renmin Hospital of Wuhan University, Wuhan, China
Keratin 18 (KRT18), one of the most abundant keratins in epithelial and endothelial cells, has been reported to be aberrantly expressed in many malignancies and extensively regarded as a biomarker and important regulator in multiple cancers, including gastric cancer (GC). But the molecular regulatory mechanisms of KRT18 in GC patients and cells are largely unknown. In the present study, we analyzed the expression level of KRT18 in 450 stomach adenocarcinoma tissue samples from TCGA database and found a significantly higher expression level in tumor tissues. We then explored the potential functions of KRT18 in AGS cells (human gastric adenocarcinoma cell line) by KRT18 knockdown using siRNA and whole transcriptome RNA-seq analysis. Notably, KRT18 selectively regulates expression of cell proliferation and apoptotic genes. Beyond this, KRT18 affects the alternative splicing of genes enriched in apoptosis, cell cycle, and other cancer-related pathways, which were then validated by reverse transcription–quantitative polymerase chain reaction approach. We validated KRT18-KD promoted apoptosis and inhibited proliferation in AGS cells. We then used RNA-seq data of GC samples to further demonstrate the modulation of KRT18 on alternative splicing regulation. These results together support the conclusion that KRT18 extensively modulates diverse alternative splicing events of genes enriched in proliferation and apoptosis processes. And the dysregulated splicing factors at transcriptional or posttranscriptional level by KRT18 may contribute to the alternative splicing change of many genes, which expands the functional importance of keratins in apoptotic and cell cycle pathways at the posttranscriptional level in GC.
Background
Gastric cancer (GC) is one of the most common and deadly neoplasms in the world, with the fifth incidence and the third mortality in all cancers around the world, following lung and colorectal cancer (Van Cutsem et al., 2016; Rawla and Barsouk, 2019; Thrift and El-Serag, 2020). The incidence data of GC show strong geographical variation. More than half of the cases were found in developing countries. The high-risk areas includes East Asia, Eastern Europe, and some parts of America (Sitarz et al., 2018). The main risk factors of GC include dietary factors and Helicobacter pylori infection. It is found that various salt-preserved foods and low consumption of vegetables and fruits may make the risk of GC higher (Hartgrink et al., 2009). Studies have also revealed that H. pylori infection is an important cause of the gastritis before most GCs (Loor and Dumitrascu, 2016; Van Cutsem et al., 2016). H. pylori infection was reported to trigger GC by multiple pathogenic mechanisms, including endoplasmic reticulum stress and the unfolded protein response, autophagy, oxidative stress, and inflammation (Amieva and Peek, 2016; Diaz et al., 2018). Genetic cause of GC refers mutations of some genes, including CDH1, ARID1A, TP53, MUC6, CTNNA2, and others (Wang et al., 2014). It was reported that HER2 positivity is associated with worsening prognosis, increased disease invasiveness, and shortened survival time in approximately 12–20% of GCs (Gravalos and Jimeno, 2008; Van Cutsem et al., 2015). Even though multidisciplinary approach has been gradually applied to treat GC with the advances in diagnosis, genomic classification, surgical resection, chemoradiation, and immune therapies, the prognosis for advanced GC remains unsatisfactory (Sitarz et al., 2018). Therefore, it is very important to identify molecular markers and therapeutic targets to improve the effectiveness of GC treatment.
Keratin 18 (CK18/KRT18) is one of the keratins (cytokeratins), which are intermediate filaments (IFs) essential for tissue completion (Hesse et al., 2001; Coulombe and Wong, 2004). Keratins primarily play a role in protecting epithelial cells from both mechanical and non-mechanical stressors (Dmello et al., 2019). Keratin filaments can be dynamically remodeled, undergoing reorganization upon various mechanical and non-mechanical stimuli to regulate cellular processes, including cell migration and signaling (Chung et al., 2013). It has been reported that keratins have many roles in tumorigenesis (Hu et al., 2017), progression (Sharma et al., 2019), and drug responsiveness processes (Yin et al., 2016; Zhang et al., 2016), which allows them to be regarded as diagnostic markers and prognostic markers in tumors.
The staining of IFs, most notably keratins, has been used to be a useful tool to diagnose human tumors clinically (Mohme et al., 2017; Sharma et al., 2019). KRT18, as one of the most abundant keratins in epithelial and endothelial cells, was reported to be aberrantly expressed in many malignancies and extensively regarded as a diagnostic and prognostic marker in cancers, including non–small cell lung cancer (Zhang et al., 2016), GC (Bilici, 2015; Nagel et al., 2018), hepatocellular cancer (Golob-Schwarzl et al., 2019), breast cancer (Bozza et al., 2018), and colorectal cancer (Zhang et al., 2019a). It is the major component of IFs in epithelial cells and released from cells into the blood in either intact (M65) or caspase-cleaved forms (M30) during apoptotic and necrotic cell death (Kramer et al., 2004; Schutte et al., 2004). Notably, the M30 and M65 have prognostic and predictive significance in advanced GC (Bilici, 2015; Nagel et al., 2018).
In addition to being a biomarker in cancers, increasing evidence has suggested that KRT18 is an important regulator in many diseases, including cancer. As keratin functions are related to cell injury and death. It was found that KRT18 expression level can be encouraged by EGR1, which then promotes cell apoptosis in non–small cell lung carcinoma (Zhang et al., 2014). And the diminished KRT18 expression was reported to improve the susceptibility of cytokine-induced death of cervical cancer cells (Sullivan et al., 2010) and inhibit cell migration and enhance paclitaxel sensitivity in lung cancer cells (Zhang et al., 2016). In breast cancer, KRT18 was reported to critically contribute to initiation of transforming growth factor β1 (TGF-β1)–induced epithelial–mesenchymal transition (EMT) in breast epithelial cells (Jung et al., 2016). Conversely, Shi et al. (2019) recently found that KRT18 knockdown increases BCRP (breast cancer resistant protein) expression and induces EMT process in human breast cancer MCF-7 cells (Shi et al., 2019). Moreover, a novel apoptotic function of KRT18 was discovered recently, which shows that KRT18 affects transcriptomes favoring apoptosis at both of transcriptional and alternative splicing (AS) levels in HeLa cells (Cheng et al., 2019). Transcriptional and posttranscriptional regulations are key molecular mechanisms contributing to the complex biological function of the human genome during gene expression process. It is worthy to investigate the regulation function of KRT18, a cytokeratin, at transcriptional and posttranscriptional levels in GC.
Alternative splicing regulation is related to transcripts of more than 95% of multiexon genes in human, and coordinated splicing networks regulate tissue and organ development (Pan et al., 2008; Baralle and Giudice, 2017). Deregulation of transcription and AS are all hallmarks of cancer (Bradner et al., 2017; Corbett, 2018). Studies on splice variants have found that incorrect splicing contributes to many human malignant tumorigenesis, including GC (da Cunha et al., 2016; Peng et al., 2019). The AS regulation of cancer-related genes allows the production of cancer-specific splicing isoforms, which are drivers of cancer progression or significant contributors to specific cancer hallmarks (El Marabti and Younis, 2018). Recently, emerging data have uncovered the cancer-specific AS isoforms of genes, which potentially were important targets for cancer therapy (Kahles et al., 2018). Meanwhile, the dynamic regulation of corresponding RNA splicing factors (SFs) and other regulators targeting important AS events (ASEs) play a critical role in tumorigenesis and serve as potential cancer treatment targets (Song et al., 2018). The previous study reported new regulatory function of KRT18, altering splicing events of apoptotic genes in HeLa cells (Cheng et al., 2019). But it remains unclear for the regulation mechanism of KRT18 on apoptosis process at transcriptional or posttranscriptional level in GC, in addition to undergoing caspase-mediated cleavage during epithelial apoptotic and necrotic cell death.
In the present study, we analyzed the expression level of KRT18 in 450 stomach adenocarcinoma (STAD) tissue samples available in TCGA database, showing a significant increase in cancer samples. We then explored the potential functions of KRT18 in GC AGS cells (human gastric adenocarcinoma cell line) using siRNA to knockdown KRT18 expression. The results showed that KRT18 selectively regulates expression of cell proliferation and apoptosis genes and affects the AS of pre-mRNAs from hundreds of genes, enriched in cancer-related pathways, which were validated by reverse transcription–quantitative polymerase chain reaction (RT-qPCR) approach. We then used the RNA-seq data of gastric tumor samples to further analyze the potential impact of KRT18 on AS regulation of cancer transcriptome. These results together support the conclusion that KRT18 extensively regulates diverse ASEs of genes enriched in cell cycle and apoptosis process, which was possibly by affecting SFs at transcriptional or posttranscriptional level, expanding the functional importance of keratins in apoptotic pathways at the AS level in GC.
Materials and Methods
Cell Culture and Transfections
Human GC cell line AGS was obtained from Procell (CL-0022, Wuhan, Hubei, China). The AGS cell line has been authenticated with STR analysis and tested for the free of mycoplasma contamination by the provider.
AGS cells were cultured with 5% CO2 at 37°C in Ham’s F-12 (Ham’s F-12 Nutrient Mixture), which were with 10% FBS (fetal bovine serum, 164210, Procell, Wuhan, Hubei, China), 100 U/mL penicillin, and 100 U/mL streptomycin (Hyclone). To silence the expression of KRT18 in AGS cells, we synthesized three siRNAs from Genepharma (Shanghai, China). The siRNA sequence against KRT18 mRNA sequence is shown in Table 1. According to the manufacturer’s protocol, three siRNAs were transfected into AGS cells using Lipofectamine 2000 (Invitrogen, Carlsbad, CA, United States), which were harvested after 48 h for following RT-qPCR analysis.
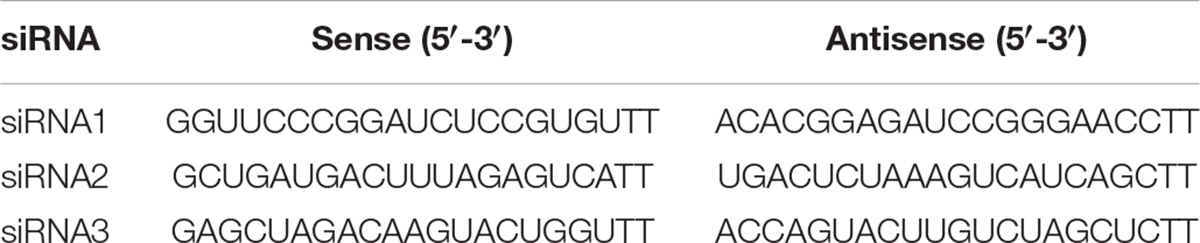
Table 1. The sequences of 3 siRNA against KRT18 mRNA sequence.
Assessment of the Knockdown of KRT18 by siRNA
We used housekeeping gene GAPDH (glyceraldehyde-3-phosphate dehydrogenase) as a control gene to assess whether KRT18 was knocked down in AGS cells. Complementary DNA (cDNA) synthesis was performed according to standard procedures followed by 65°C for 5 min, 25°C for 10 min, and 42°C for 30 min using the Kit One-Step gDNA Removal and cDNA synthesis mix (AT311-02, Transgen Biotech, China) with PCR machine (Mycycler, Bio-Rad). And real-time quantification PCR was performed using HieffTM qPCR SYBR® Green Master Mix (Low Rox Plus; YEASEN, Shanghai, China) to evaluate the knockdown inefficiencies of KRT18 by siRNAs. The qPCR was run at 95°C for 5 min, followed by 40 cycles of 95°C for 10 s and 60°C for 30 s. Primer sequences used for RT-qPCR are presented in Table 2. The concentration of each transcript was then normalized to the GAPDH mRNA level using 2–Δ Δ CT method (Livak and Schmittgen, 2001) to measure the transcript level of KRT18, with a non–reverse transcription group as a background.

Table 2. Primer sequences of KRT18 expression assessment used in RT-qPCR experiments.
RNA Extraction and High-Throughput Sequencing
The AGS cells were ground into fine powder before RNA extraction. Total RNA was extracted with TRIZOL (Ambion), purified with two phenol–chloroform treatments treated with RQ1 DNase (Promega) to remove DNA. The quality and quantity of the purified RNA were determined by measuring the absorbance at 260 nm/280 nm (A260/A280) using smartspec plus (Bio-Rad) and using 1.5% agarose gel electrophoresis to verify RNA integrity. One microgram of total RNA for each sample was used for RNA-seq library preparation by KAPA Stranded mRNA-Seq Kit for Illumina® Platforms (#KK8544). Polyadenylated mRNAs were purified by VAHTS mRNA capture beads (N401-01), fragmented, and converted into double-strand cDNA. Following end repair, Diluted Roche Adaptor (KK8726) was ligated to A tailing of the DNAs. After purification of ligation product and size fractioning to 300–500 bps, the ligated products were amplified and purified, quantified, and stored at −80°C before sequencing (Li et al., 2018). The strand marked with dUTP (the 2nd cDNA strand) is not amplified, allowing strand-specific sequencing. According to the manufacturer’s instructions, the libraries were applied to Illumina Novaseq 6000 system for 150-nt paired-end sequencing (ABLife Inc., Wuhan, China).
RNA-seq Raw Data Clean and Alignment
Raw sequencing reads were first cleaned by discarding those containing more than 2-N bases, trimming off adaptors and low-quality bases using FASTX-Toolkit (version 0.0.13), and dropping the short reads less than 16 nt. These clean reads were subsequently aligned to the GRch38 genome by TopHat2 (Kim et al., 2013) with four mismatches. Uniquely mapped reads were ultimately used to calculate reads number and FPKM (paired-end fragments per kilobase of exon per million fragments mapped) value, mRNA expression level for each gene.
Differentially Expressed Gene Analysis
The R Bioconductor package EdgeR (Robinson et al., 2010) was used to analyze the differentially expressed genes (DEGs) using RNA-seq data between the KRT18-KD and control groups. DEGs were determined based on the fold change (fold change ≥ 2 or ≤0.5) and p-value (p < 0.01).
Gene Ontology (GO) and enriched Kyoto Encyclopedia of Genes and Genomes (KEGG) pathway analyses were performed using KOBAS 2.0 server (Xie et al., 2011) to predict genes function and calculate the functional categories distribution frequency. Using hypergeometric test and Benjamini–Hochberg false discovery rate (FDR) controlling procedure, the enrichment of each pathway (corrected p < 0.05) was defined.
Alternative Splicing Analysis
The ABLas pipeline as described previously (Xia et al., 2017) was used to define and quantify the ASEs between the KRT18-KD and control samples. In brief, detection of 10 types of canonical ASEs in each sample was based on the splice junction reads. These ASEs were exon skipping (ES), cassette exon (CE), alternative 5′ splice site (A5SS), alternative 3′ splice site (A3SS), mutual exclusive exon skipping (MXE), the MXE combined with alternative polyadenylation site (3pMXE), or with alternative 5′ promoter (5pMXE), intron retention (IR), A3SS&ES and A5SS&ES, and regulated ASEs (RASEs) (KRT18-affected ASAS events).
Alternative splicing ratios of all ASEs were calculated using the following formula: AS junction reads/(AS junction reads + M junction reads), where AS is altered splicing events, and M is model splicing events. We calculated and compared the changed AS ratio of alternatively spliced reads and constitutively spliced reads between KRT18-KD and control group samples, which was defined as the RASE ratio. After that, Student t-test was performed to evaluate the significance of the RASE ratio. The RASE ratio > 0.2 and p < 0.05 were set as the threshold for RASE detection.
RT-qPCR Validation of DEGs and RASEs
To elucidate the validity of DEGs and RASEs in AGS cells, RT-qPCR was performed in this study for selected important DEGs and RASEs and normalized with the human housekeeping gene GAPDH. All primers for detecting genes transcript and specific splicing events are shown in Supplementary Table 6. To quantitatively analyze the two different splicing isoforms of a specific ASE using a qPCR approach, we designed two pairs of primers to specifically amplify each of these two isoforms after the initial synthesis of the first-strand cDNA using random primers. To achieve this specificity, we designed a primer pairing the splice junction of the constitutive exon and alternative exon (Supplementary Table 6). The RNA samples used for RT-qPCR were the same as that for RNA-seq. The RT-qPCR was respectively performed in triplicates for KRT18-KD and control samples.
PI Staining to Detect Cell Cycle Distribution
Cultured cells with different treatments were resuspended in 95% ethyl alcohol at 4°C overnight and then washed twice with cold phosphate-buffered saline and treated with RNase for 30 min at room temperature followed by dying with PI in darkness at 4°C for 30 min using cell cycle detection kit (FXP0211-100, 4A Biotech Co. Ltd., Beijing, China) according to the manufacturer’s protocol. Next, cells were analyzed on a FACSAria flow cytometer (Cytoflex, Beckman). Red fluorescence intensity was detected, and DNA content was analyzed with ModFitWinTrial software.
Cell Proliferation Assay
The proliferation capacity of the AGS cells was assessed with a CCK8 assay (HY-K0301, MCE), which was performed according to the manufacturer’s instructions. The absorbance was measured at 450 nm using an enzyme-linked immunosorbent assay plate reader (FC, Thermo). Each experiment was performed in triplicate at least.
Flow Cytometric Analysis of Cell Apoptosis
One hundred five AGS cells were seeded in 24-well culture plates incubated for 24 h at 37°C and 5% CO2. Apoptosis was detected with flow cytometry (Cytoflex, Beckman) using double-staining with Fluor647-conjugated annexin V and PI (4A Biotech Co. Ltd., Beijing, China).
Downloading RNA-seq Data of GC Samples
The RNA-seq data of GC samples were downloaded from TCGA database and GSE113255 (Kim et al., 2020) to analyze the expression of KRT18 and regulation of AS in GC samples.
Results
KRT18 Is Overexpressed in Stomach Adenocarcinoma Samples and Selectively Regulates the Expression of Genes Involved in Cell Proliferation and Apoptosis in AGS Cells
To investigate the connection between KRT18 and gastric carcinoma, we analyzed KRT18 expression pattern of STAD samples from The Cancer Genome Atlas (TCGA) database, including 415 tumor tissue and 35 normal (para-carcinoma tissue) samples. KRT18 showed a significantly higher expression level in tumor tissues compared to normal tissues (Figure 1A). Among the staged 415 tumor tissue samples according to the standard of National Comprehensive Cancer Network stage, the expression of KRT18 was significantly up-regulated in most tumor stages, more pronouncedly in late stages (Supplementary Figure 1A). We further performed survival analysis using the expression data but found no relationship between KRT18 expression level and overall survival probability in the STAD samples from TCGA database (Supplementary Figure 1B).
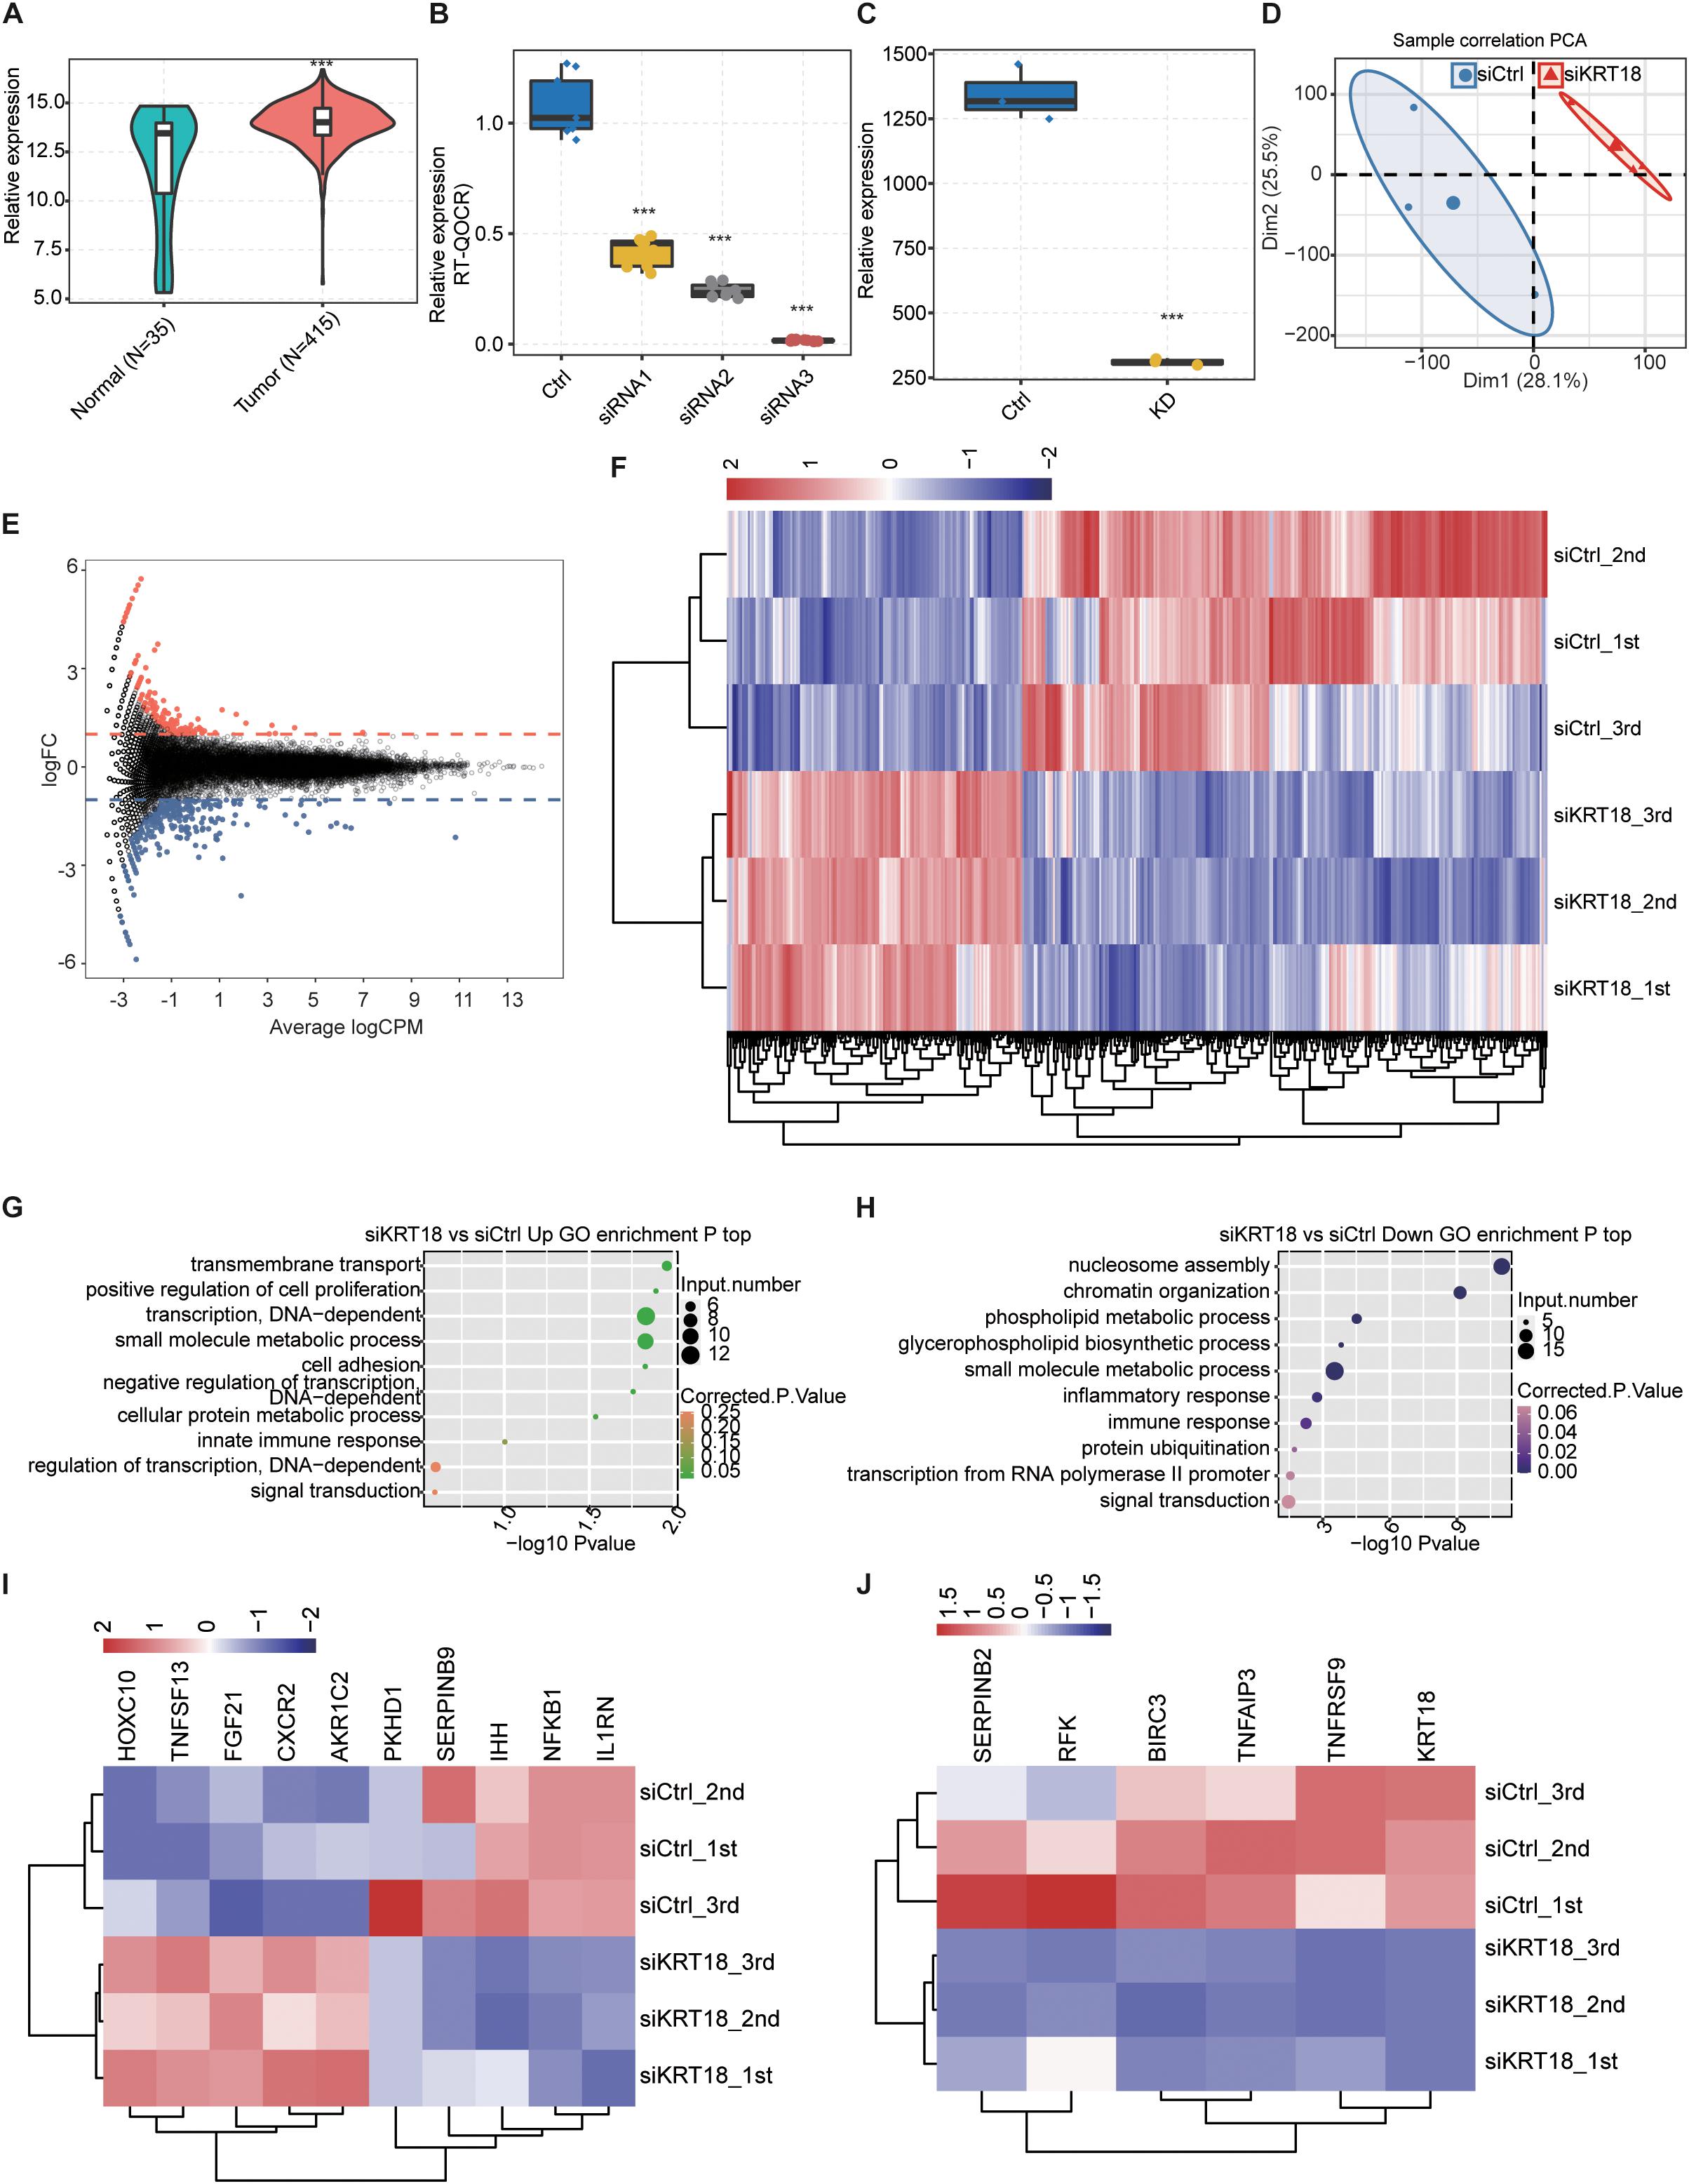
Figure 1. Overexpression of KRT18 in stomach adenocarcinoma (STAD) and RNA-seq analysis of KRT18-regulated transcriptome profile in AGS cells. (A) Overexpression of KRT18 in 450 stomach adenocarcinoma (STAD) samples from TCGA database, including 415 tumor tissue and 35 normal samples (para-carcinoma tissue). (B) KRT18 expression quantified by qRT-PCR after knocking down KRT18 in AGS cells using three siRNAs. (C) KRT18 expression quantified by RNA sequencing data of AGS cells treated with KRT18-siRNA2, FPKM values were calculated as explained in section “Materials and Methods.” Error bars represent mean ± SEM. ***p < 0.001, Student t-test. (D) Principal (F) (PCA) of KRT18-KD versus control AGS cells based on FPKM value of all expressed genes. The samples were grouped by KRT18-KD and control, and the ellipse for each group is the confidence ellipse. (E) MA plot shows KRT18-regulated genes identified in AGS cells. Up-regulated genes are labeled in red, whereas down-regulated genes are labeled in blue. (F) Hierarchical clustering of DEGs in KRT18-KD and controls. FPKM values are log2-transformed and then median-centered by each gene. (G,H) The top 10 representative GO biological processes of up- and down-regulated genes. (I) Heatmap presenting deregulation expression of cell proliferation or apoptosis genes in KRT18-KD AGS cells. (J) Heatmap presenting repressed expression of the other six apoptotic genes in KRT18-KD AGS cells.
In order to clearly understand the KRT18-affected gene expression regulation, we constructed KRT18-silenced AGS cell model with three biological replicates by siRNA and empty vector, followed with RNA-seq experiments and analysis. Using three synthetic siRNAs targeting mRNA of KRT18 (Table 1), we successfully knocked down KRT18 in AGS cells and examined its expression by RT-qPCR (Figure 1B; primer details are shown in Table 2). The siRNA2-silenced KRT18 AGS cells (KRT18-KD) were used in subsequent RNA-seq experiments.
Three biological replicating RNA-seq samples were constructed for KRT18-KD and control cells. After aligning quality filtered reads to the human GRCH38 genome and calculating the expression values in units of FPKM, the six samples totally yield 30,632 expressed genes (FPKM > 0), with 22,174–23,893 expressed genes in each sample (Supplementary Table 1). FPKM value of KRT18 showed a significant decrease in KRT18-KD group compared to the control group (Figure 1C). Principal component analysis based on FPKM values of all expressed genes showed that knockdown of KRT18 was the major factor globally influencing the gene expression pattern (Figure 1D).
Based on the RNA-seq data of above KRT18-KD and control cells, we used edgeR to further identify genes regulated by KRT18 at expression level. A total of 440 DEGs were identified between the KRT18-KD and control cells, including 153 up-regulated and 272 down-regulated genes (Supplementary Table 2), with criteria as fold change ≥ 1.5 or ≤0.67 and FDR < 0.05 (Figure 1E). The heatmap analysis of the expression patterns of the DEGs in RNA-seq samples showed a high consistency of the KRT18-mediated transcription in three biological replicates (Figure 1F). These results indicated that KRT18-KD significantly affected the gene expression level of a set of genes. To investigate the potential biological functions of these DEGs, we subjected all the DEGs to GO (Figure 1G) and KEGG enrichment analysis (Supplementary Figure 2). In the biological process terms of GO analysis, the up-regulated genes in the KRT18-KD group were mainly enriched in small molecule metabolic process, DNA-dependent transcription, and transmembrane transport, whereas down-regulated genes were mostly related to nucleosome assembly, chromatin organization, phospholipid metabolic process, and inflammatory/immune response (Figure 1H). The expression pattern of the cancer-related DEGs showed a high consistency of the KRT18-affected transcription in three biological replicate datasets (Figure 1I). Besides genes in Figure 1I, we also detected that six genes involved in apoptotic process were specifically down-regulated in si-KRT18 samples, including BIRC3, SERPINB2, KRT18, RFK, TNFRSF9, and TNFAIP3 (Figure 1J). The results showed that KRT18 selectively affects genes enriched in DNA-dependent transcription and metabolic process pathways related to cancer development at transcriptional level.
KRT18 Affects the Alternative Splicing Events of Genes Related to Cell Cycle and Apoptosis
Alternative splicing regulation is an important posttranscriptional regulation highly related to cancer (Chen and Weiss, 2015; Climente-Gonzalez et al., 2017). To uncover the role of KRT18 on AS, we further explored the KRT18-dependent ASEs in AGS cells using transcriptome sequencing data. A total of 20.6 ± 5.04 M junction reads, approximately 33.37–37.11% of all uniquely mapped reads, provided a solid foundation to explore AS changes (Supplementary Table 1). After comparing all junction reads of KRT18-KD and control AGS cells to the reference genome annotation, we detected 136,429 novel and 153,133 known splice junctions using TopHat2 (Supplementary Table 3). Using ABLas pipeline, we analyzed ASEs from the junction reads to identify 15,313 known ASEs (annotated ASEs) and 49,089 novel ASEs (unannotated ASEs) (ASE types are described in section “Materials and Methods”). We then identified 1,087 high-confidence RASEs by applying a stringent cutoff of p < 0.05, change AS ratio ≥ 0.2 (KRT18-KD vs. control group) (details can be found in Supplementary Table 4), indicating that KRT18 has a broad influence on AS of genes. RASEs mainly refer to alternative 3’ splice sites (A3SS), alternative 5’ splice sites (A5SS), ES, and CEs (Figure 2A). More extensively, the KRT18-affected ASE change patterns were highly consistent in three biological replicate datasets (Figure 2B). We analyzed the expression at transcriptional level of KRT18-affected alternative spliced genes (RASGs) and found that there are hardly any significant expression changes in RASGs (Figure 2C). By performing functional enrichment analysis, it was revealed that these RASGs were mainly enriched in gene expression, mitosis, cell cycle, DNA repair, negative regulation of type I interferon production, regulation of translation, TGF-β receptor signaling pathway, apoptotic process, and transcription, as well as RNA processing for GO biological process terms (Figure 2D; details can be found in Supplementary Table 5). Enriched KEGG pathways included those involved in ubiquitin-mediated proteolysis, erbB signaling pathway, cell cycle, neurotrophin signaling pathway, RIG-I–like receptor signaling pathway, colorectal cancer, endometrial cancer, influenza A, and insulin signaling pathway (Figure 2E; details can be found in Supplementary Table 5). These results indicated that KRT18-KD affected the AS of genes related to tumorigenesis pathways, including mitosis, cell cycle, and apoptosis.
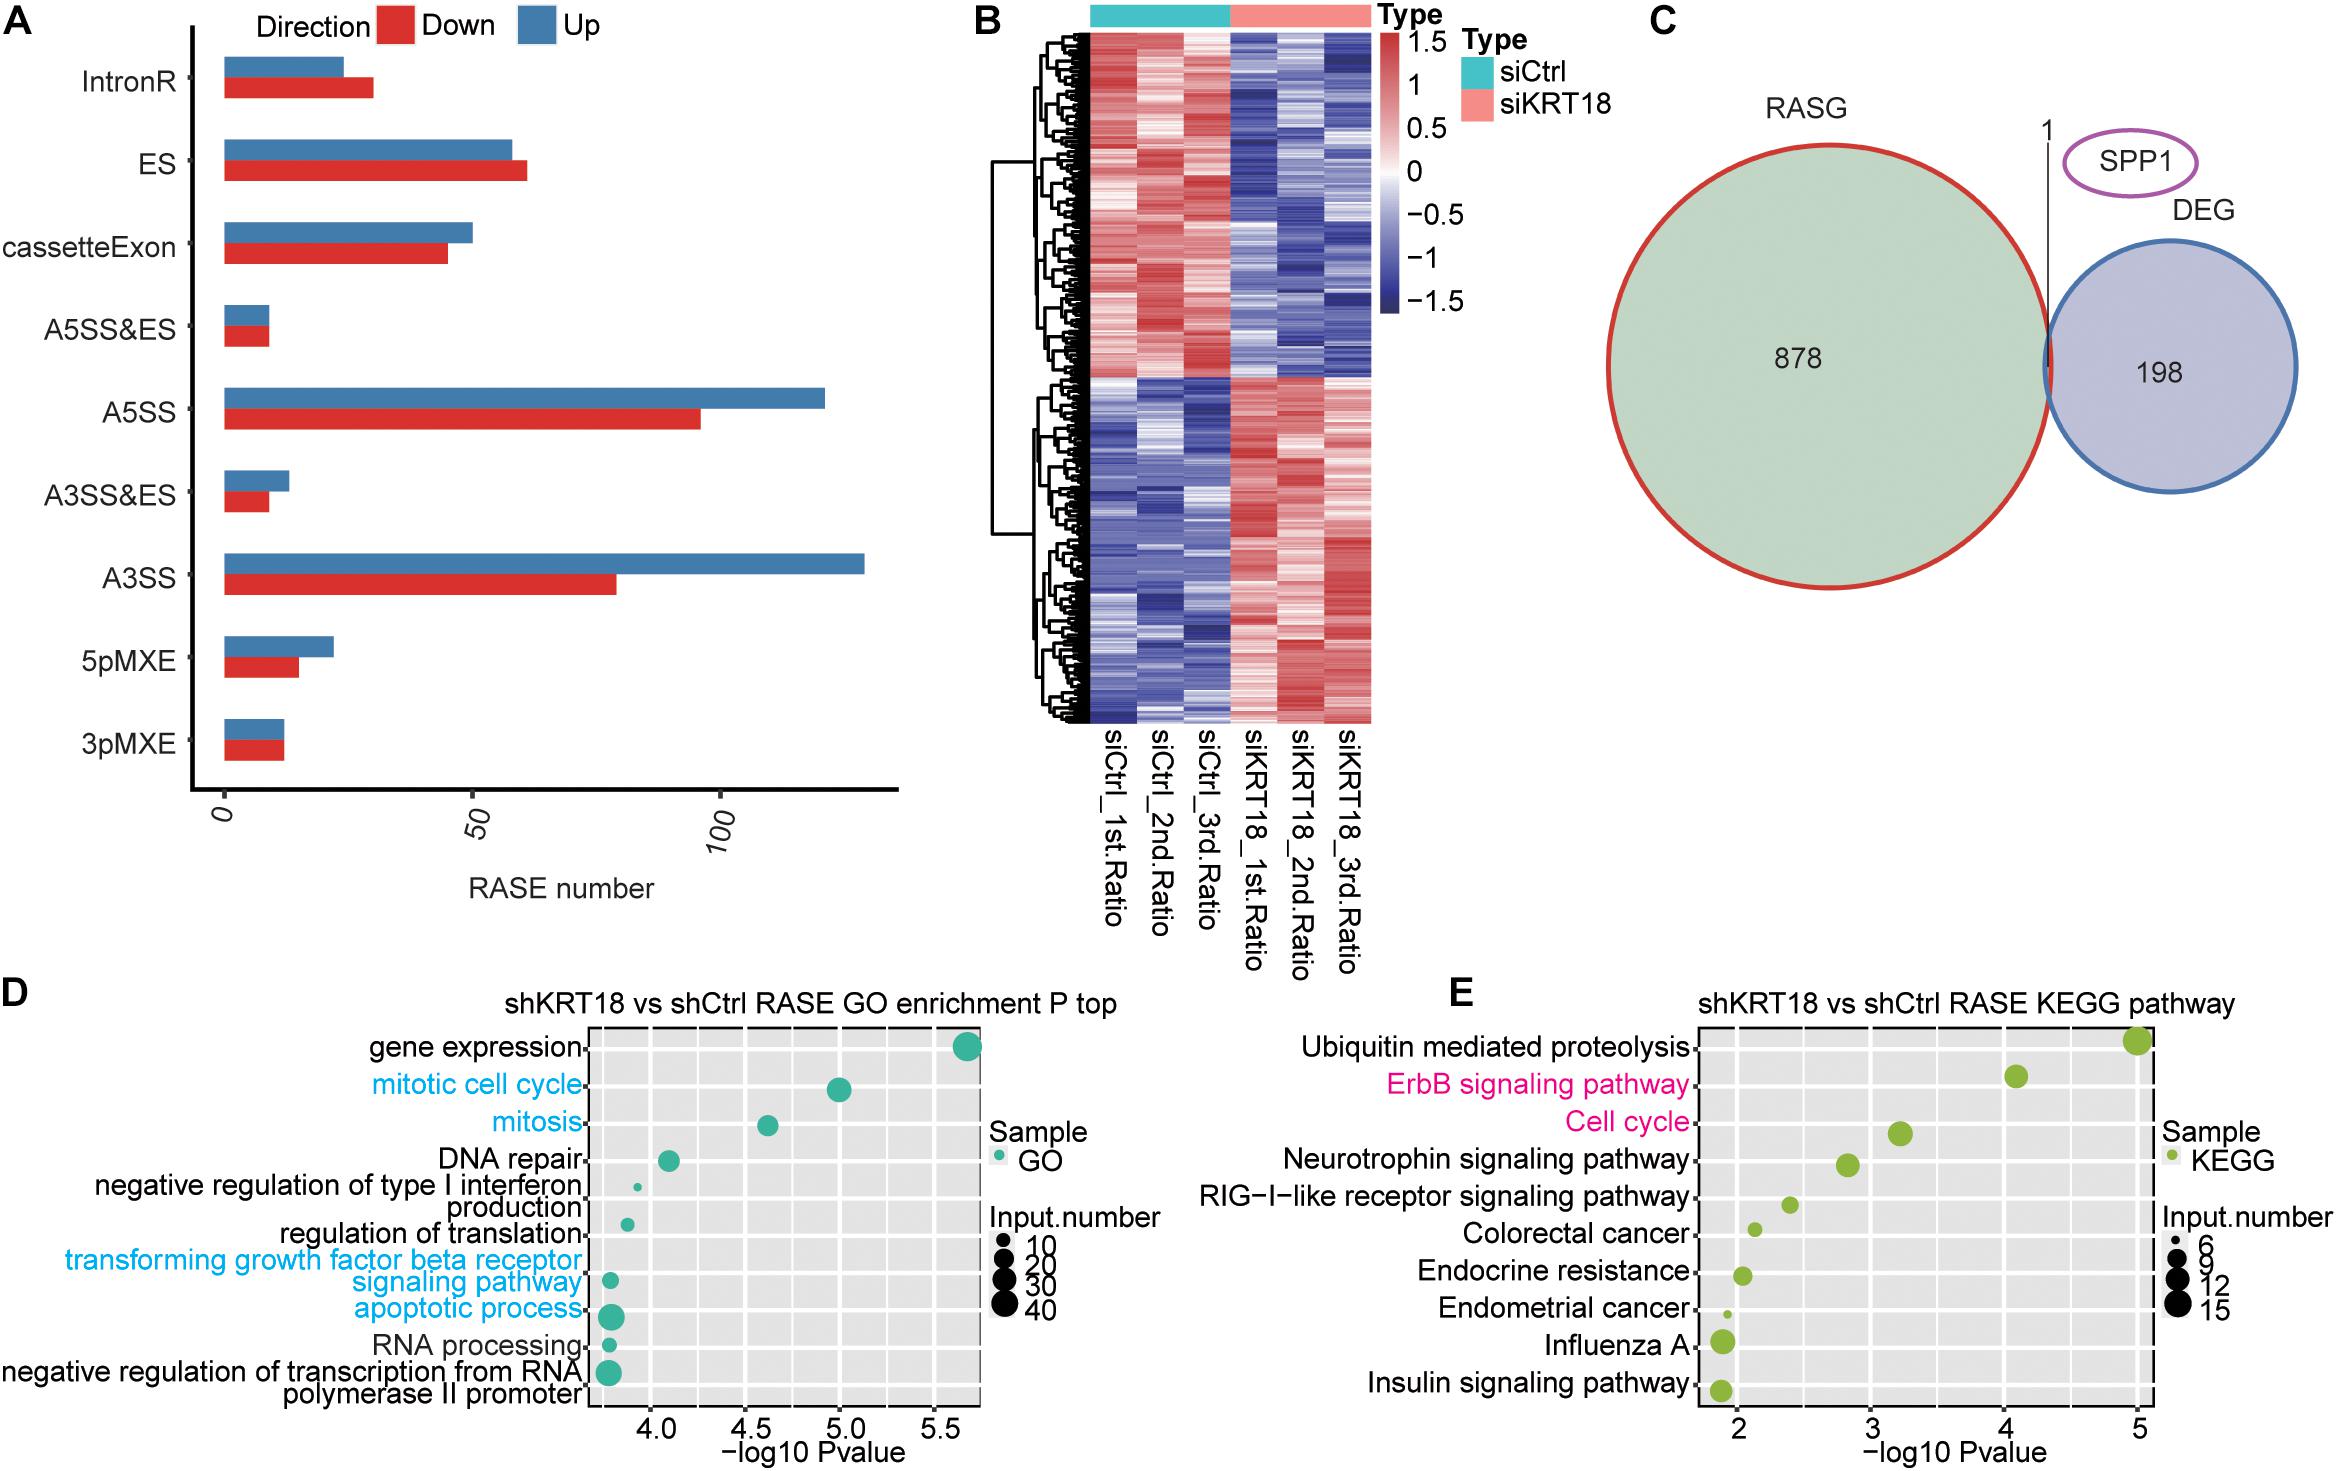
Figure 2. Analysis of KRT18-regulated alternative splicing in AGS cells. (A) Classification of KRT18-regulated alternatively spliced events in AGS cells. (B) Heatmap presenting AS ratio pattern of KRT18-affected ASEs. (C) Venn diagram shows the result of overlap analysis between KRT18-regulated differentially expressed genes (DEGs) and alternative splicing genes (RASGs). (D) The top 10 GO biological process terms and (E) KEGG functional pathway of the alternative splicing genes are shown in bubble plots.
Validation of KRT18-Affected Cell Proliferation and Apoptosis Genes at Transcriptional and Alternative Splicing Level in AGS Cells
To focus on the role of KRT18 in regulating tumor occurrence and progression, we investigated the expression of DEGs enriched in cell proliferation and apoptosis and the AS of RASGs related to cell cycle and apoptosis (cancer-related) in KRT18-KD and control AGS cells, followed with verification experiments. RT-qPCR experiment quantifying DEG expression level showed that five of seven important DEGs, including FGF21, NUPR1, ZNF616, NFKB1, and IL1RN, were highly in agreement with the analysis results of RNA-seq data (Figure 3A and Supplementary Figure 3A). RT-qPCR experiment results showed that the AS ratios of 8 from 12 RASGs related to cell proliferation and apoptosis were highly in agreement with the transcriptome analysis results of RNA-seq data (Figure 3B and Supplementary Figure 3B). RT-qPCR experiment was performed using the primers designed to specifically amplify 7 validated DEGs and 12 ASEs in KRT18-KD and control AGS cells (Supplementary Table 6). Two important ASEs were located in MAPK9 (JNK2) and STRA13, which have been well studied as key genes in cell proliferation in cancers.
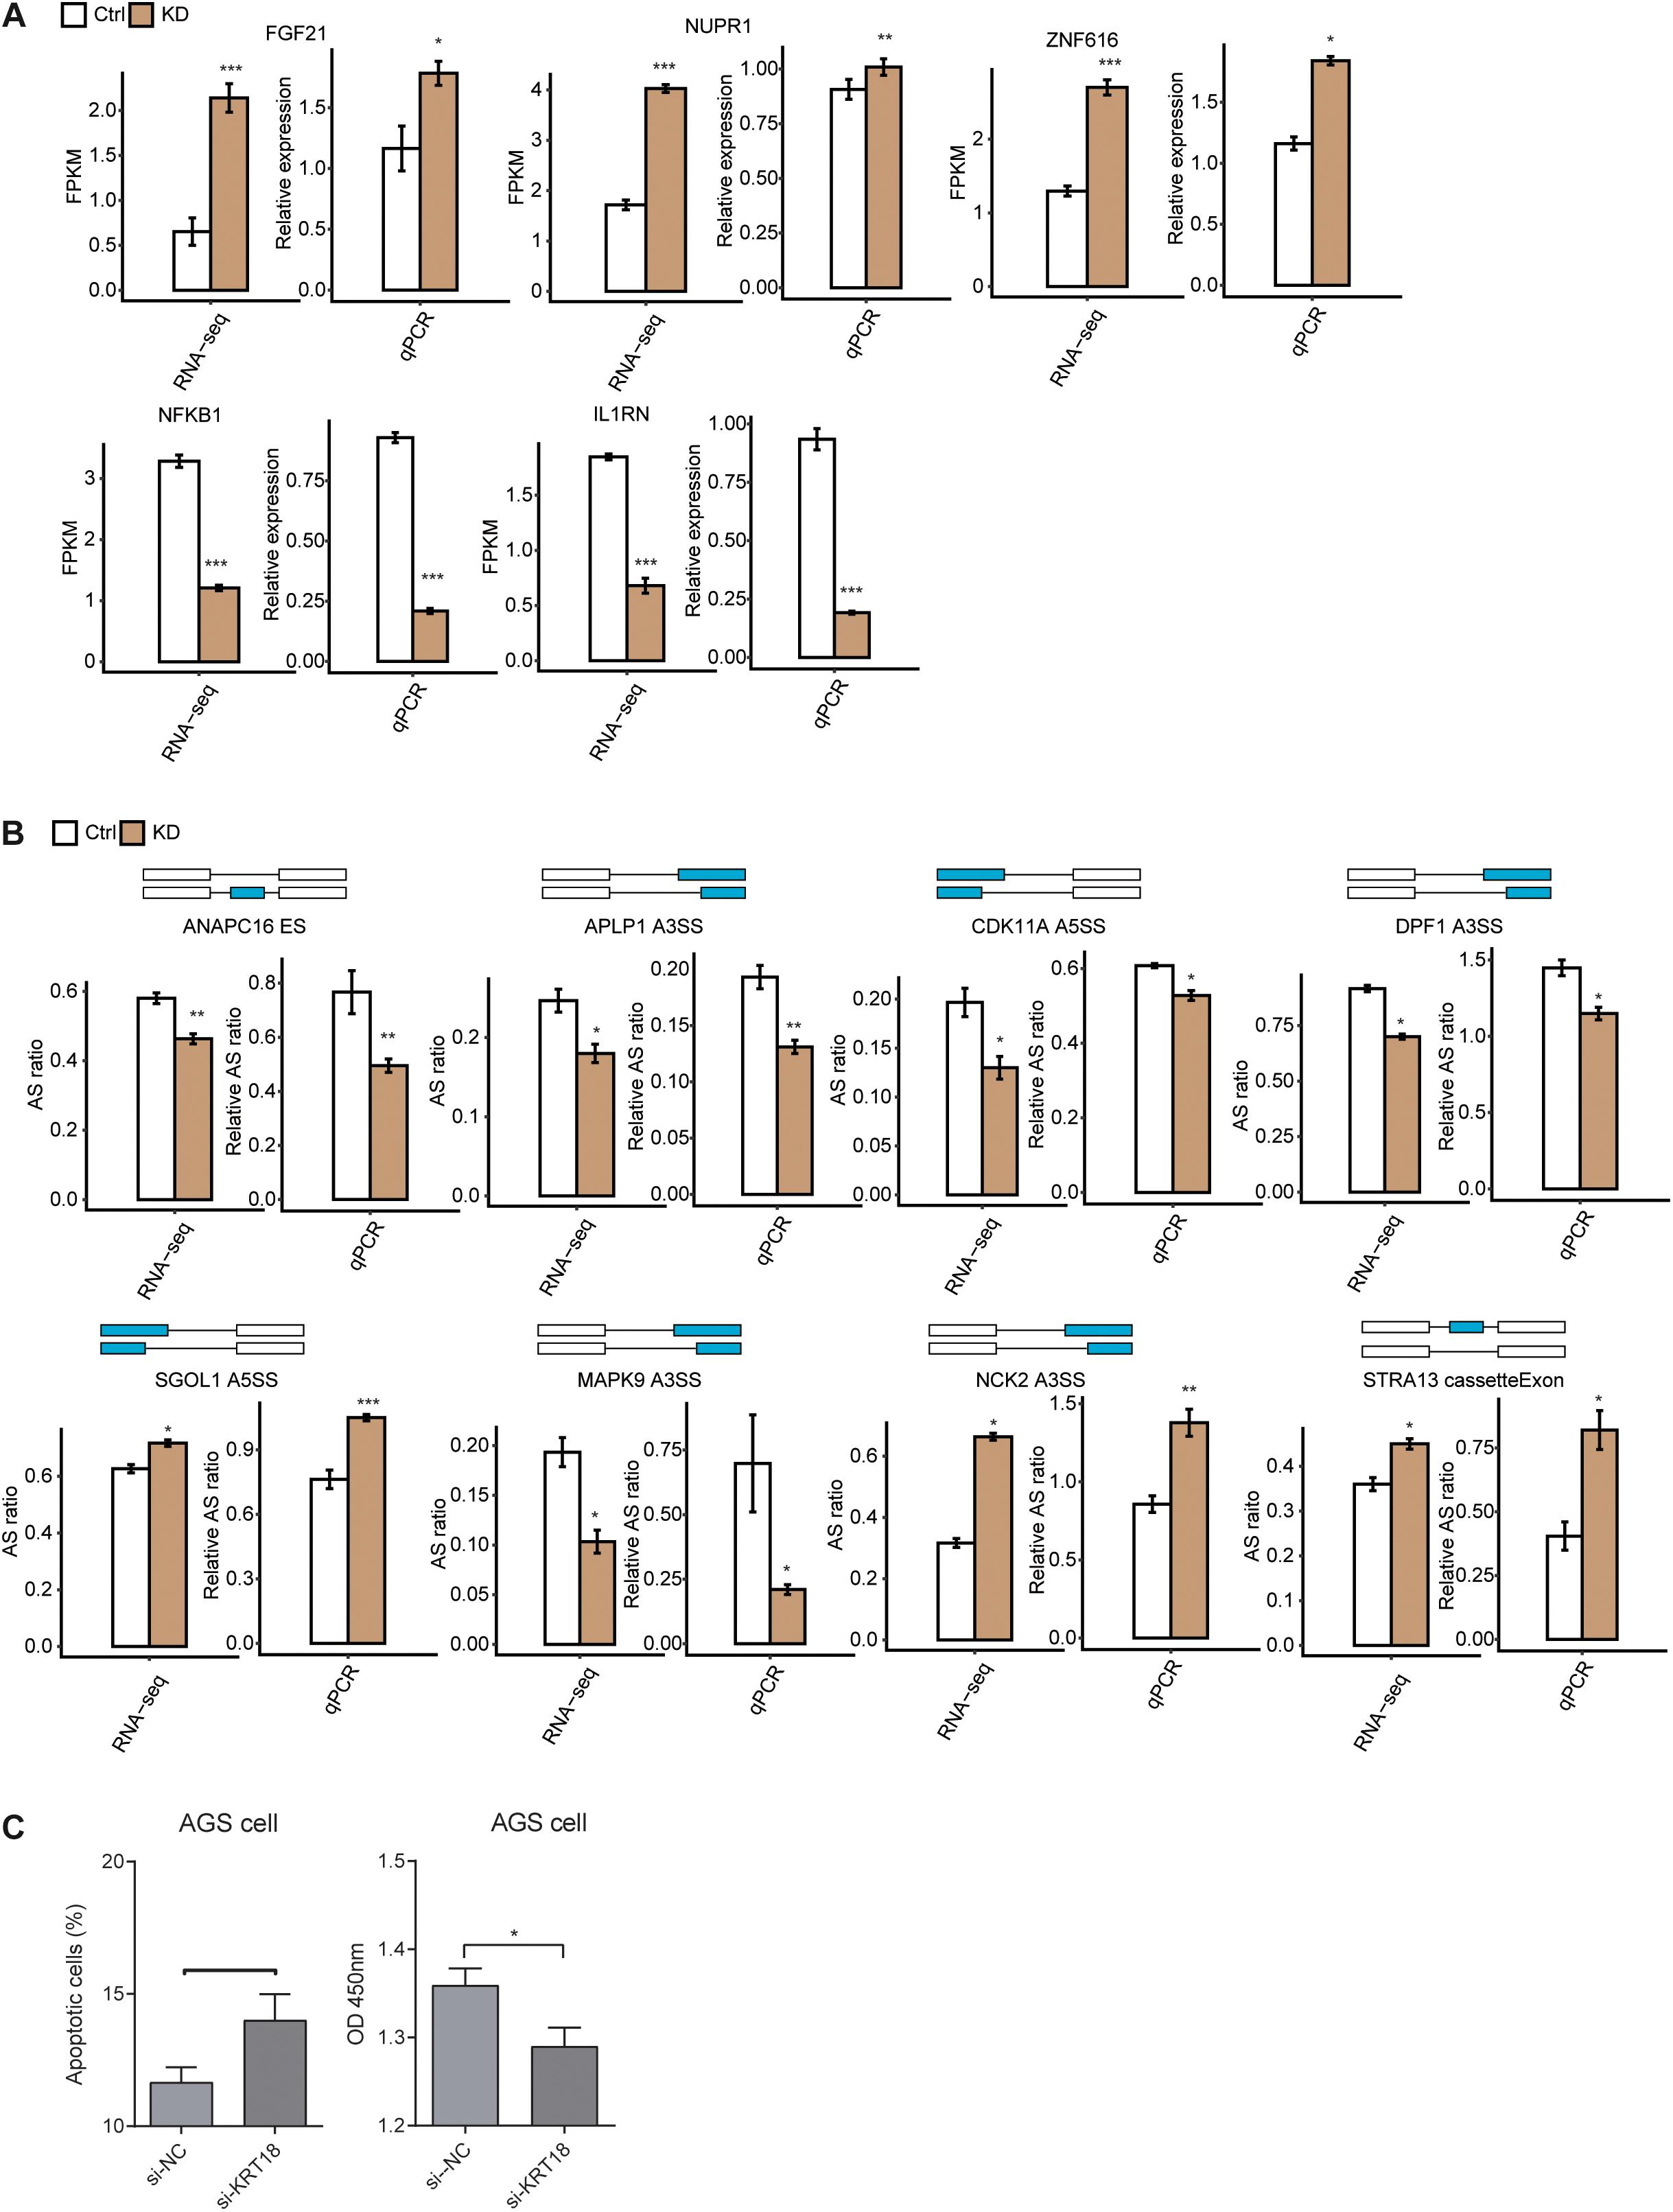
Figure 3. Validation of KRT18-affected expression and alternative splicing of genes related to cell proliferation and apoptosis in AGS cells. (A) Validation of KRT18-regulated gene expression by RT-qPCR in AGS cells. Gene expression quantified by RNA sequencing data and qRT-PCR. FPKM values were calculated as explained in section “Materials and Methods.” (B) Validation of KRT18-regulated alternative splicing events (RASEs) in genes related to cell cycle or apoptosis process by RT-qPCR in AGS cells. The schematic diagrams (top panel) depict the structures of ASEs, AS (altered splicing events), and M (model splicing events) (alternative exon was labeled in blue). The exon sequences are denoted by boxes and intron sequences by the horizontal line. RNA-seq quantification and RT-qPCR validation of ASEs are shown in the bottom panel. The altered ratios of AS events in RNA-seq were calculated using the formula: AS junction reads/(AS junction reads + M junction reads), whereas the altered ratios of AS events in RT-qPCR were calculated using the following formula: AS transcripts level/M transcripts level. Error bars represent mean ± SEM. *p < 0.05, **p < 0.01, ***p < 0.001, Student t-test. (C) Bar plot showing the apoptotic level (left panel) and proliferation level changes of AGS cells after KRT18-KD.
To test whether KRT18 affects apoptosis and proliferation, we performed cellular apoptosis and proliferation experiments in GC cells, including AGS and MKN-45 cells. The KRT18-KD efficiencies were approximately 70 and 50% for AGS and MKN-45 cells, respectively. The results showed that KRT18-KD increased the apoptotic level and inhibited proliferation level in AGS cells (Figure 3C), whereas there was no difference for apoptotic and proliferation level in MKN-45 cell (Supplementary Figure 3C). As we detected mitosis and cell cycle pathways were enriched in KRT18-affected ASGs, we also checked the G2/G1 cell cycle transition ratio. However, we found there were no changes between KRT18-KD and control samples in both AGS and MKN-45 cells (Supplementary Figure 3D). These results demonstrated KRT18 could inhibit apoptosis and promote proliferation in gastric AGS cells.
KRT18-Affected Alternative Spliced Genes Showed Similar Pattern in AGS Cells and KRT18-Dependent GC Samples
We then sought to study how the KRT18-affected ASEs also operate in GC samples. We downloaded a transcriptome dataset from GEO database (GSE113255) of 140 fresh-frozen tissues samples, including diffuse-type GC (n = 107), intestinal-type GC (n = 23), and normal gastric tissues (n = 10) (Kim et al., 2020). KRT18 expression analysis results showed significantly higher expression in intestinal-type GC compared to normal samples (Figure 4A), consistent with the results in STAD samples from TCGA database.
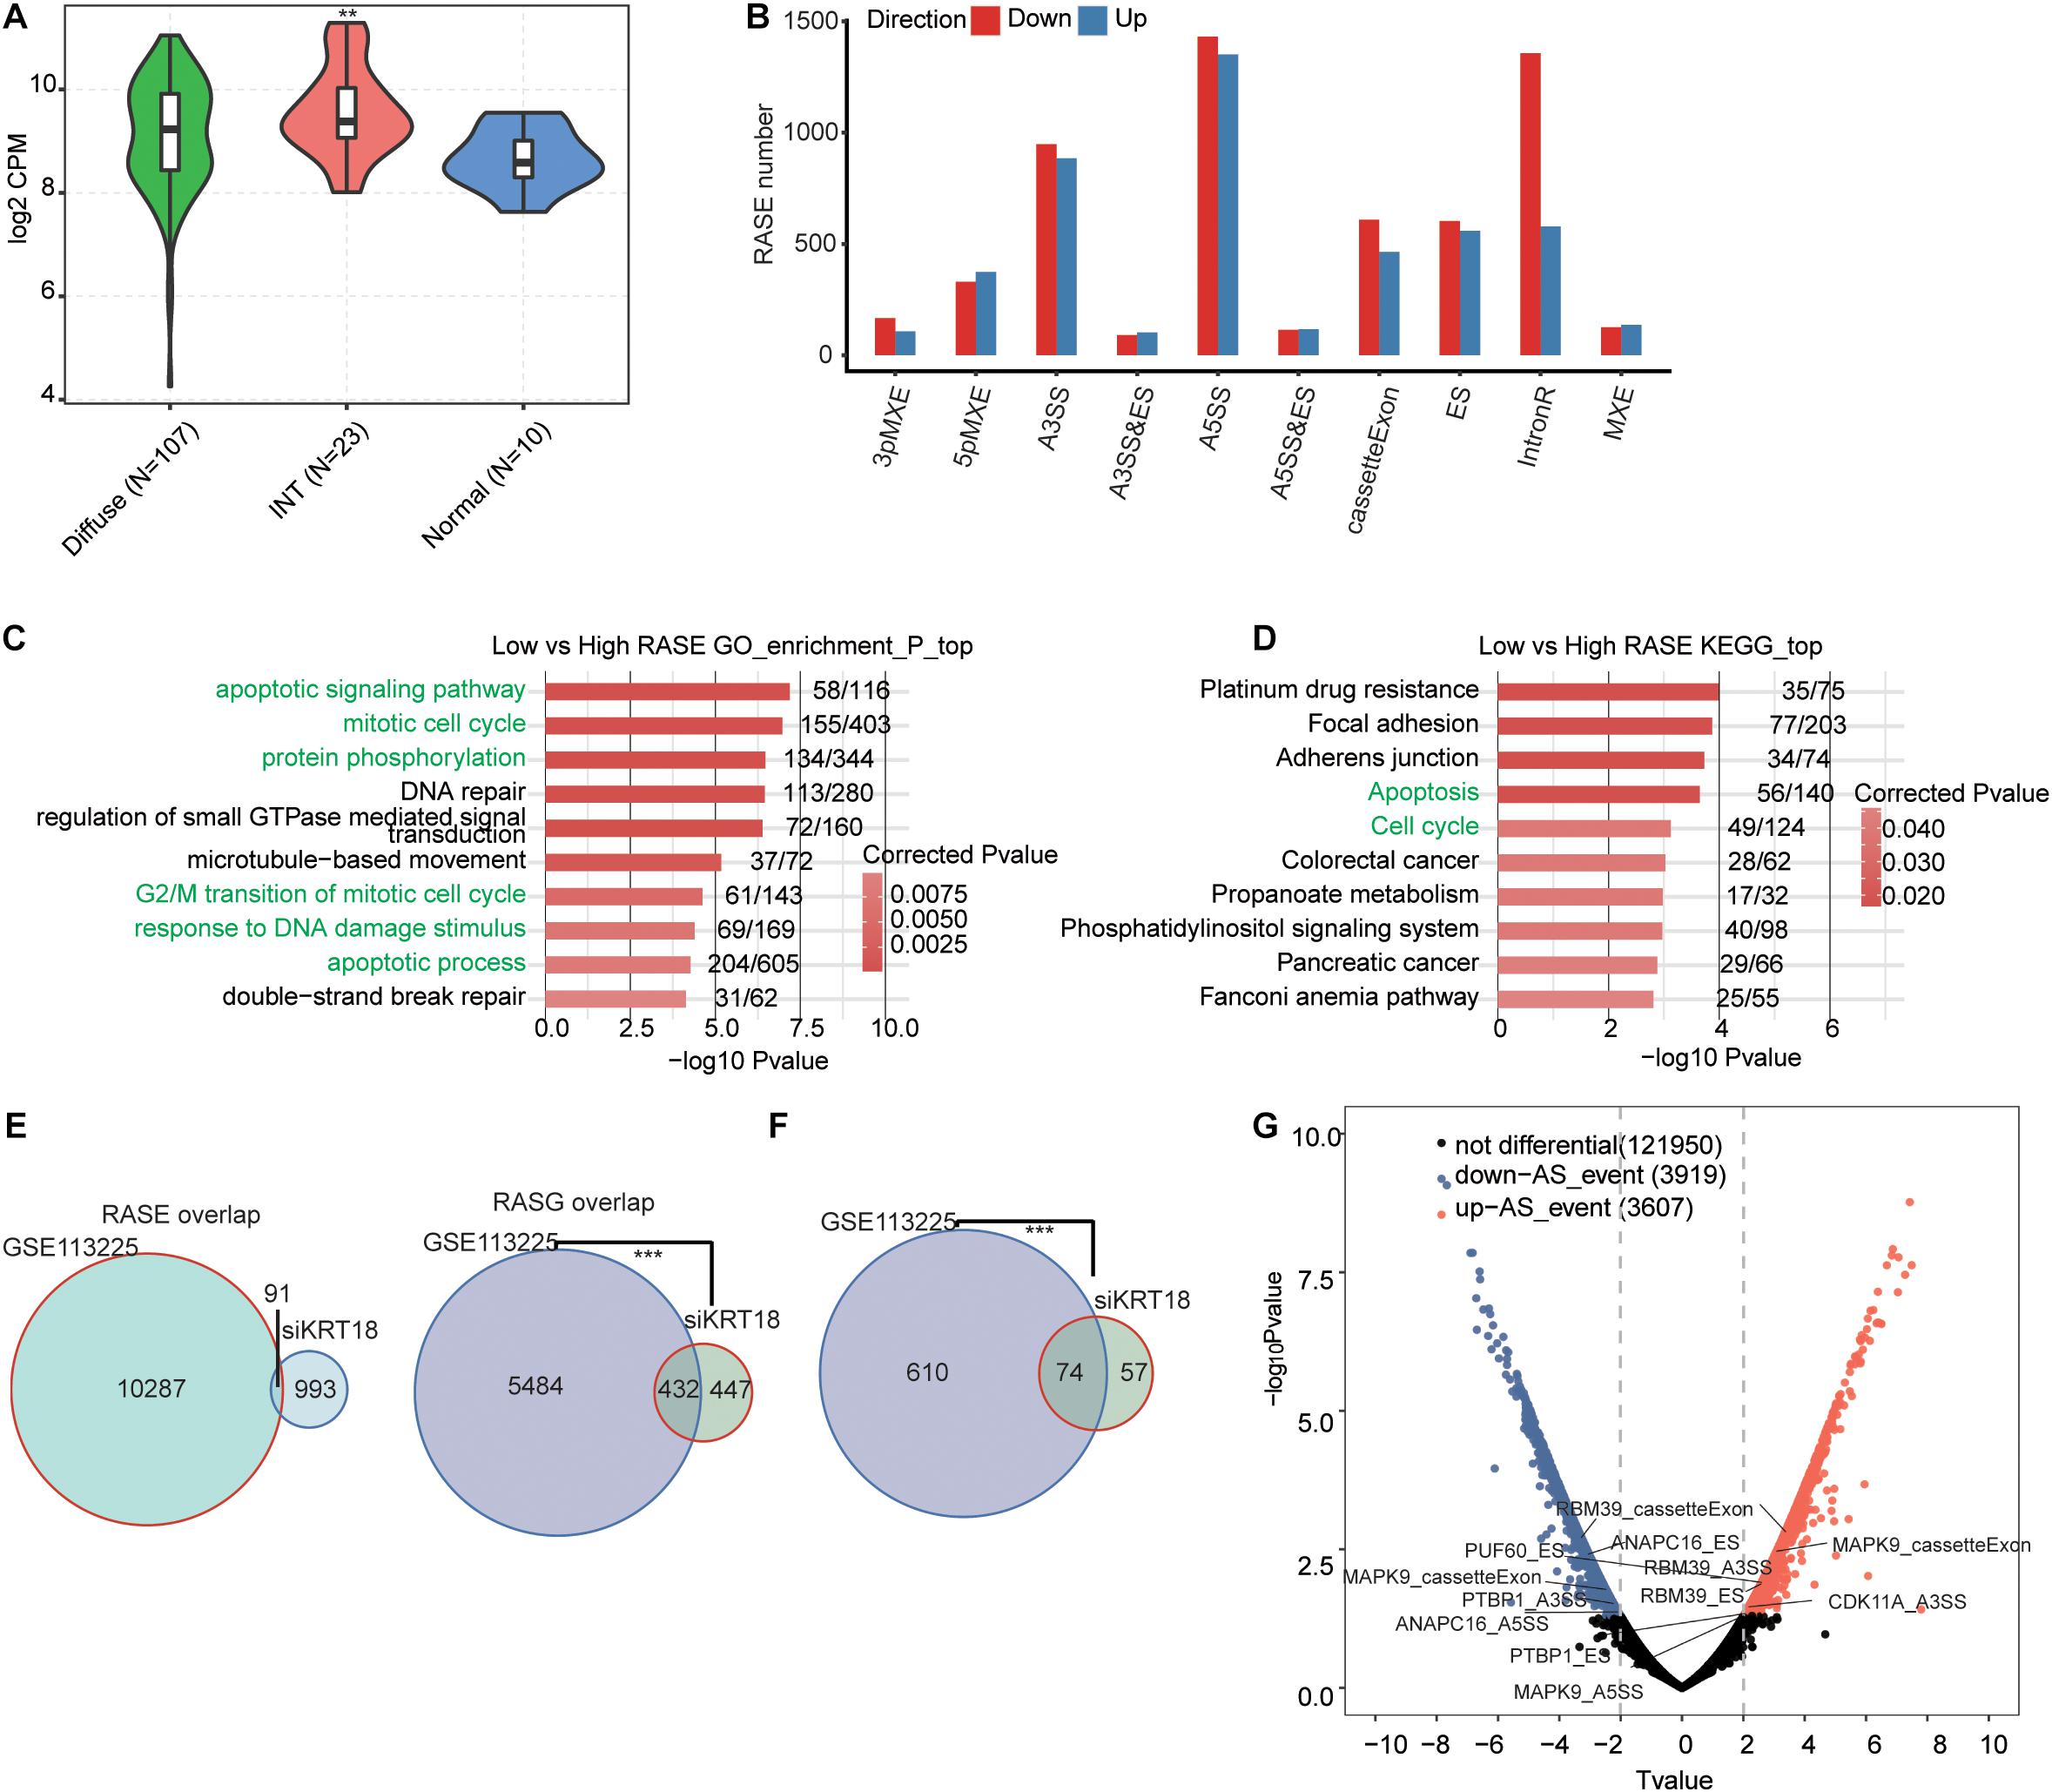
Figure 4. KRT18-regulated alternative spliced genes in AGS cells were similarly regulated in a KRT18-dependent manner in gastric cancer samples. (A) Violin plot of expression of KRT18 in 140 GC samples from GEO database (GSE113255), including 10 normal samples, 23 intestinal-type GC samples, and 107 diffuse-type GC samples. (B) Classification of deregulated alternative splicing events in gastric carcinoma samples with low expression of KRT18 (KRT18-low group) compared to KRT18 highly expressed samples (KRT18-high group). (C) The top 10 GO biological processes terms and (D) KEGG functional pathways of deregulated alternative spliced genes between KRT18-low and -high gastric carcinoma samples. (E) Venn diagram shows the overlapping of all RASEs and RASGs in AGS cells and GC samples. (F) Venn diagram shows the overlapping of selected cancer-related RASGs in AGS cells and GC samples. ***p < 0.001, Hypergeometric test. (G) The volcano plots of RASGs in GC samples, differentially up-regulated ASEs (T-value ≥ 2, p < 0.01) are labeled red, whereas differentially down-regulated ones (T ≤ 0.5, p < 0.01) are labeled blue.
To uncover the KRT18-associated ASEs in GC samples, we selected 50 GC samples, including 25 showing top high KRT18 expression (high group) and 25 showing bottom low (low group) from the 130 tumor tissue samples (Table 3). After aligning the filtered reads to human genome, an average of 9.7 ± 3 M junction reads per sample were identified (Supplementary Table 7). We then used the same pipeline to analyze ASEs and detected 37,120 known ASEs and 137,514 novel ASEs, among KRT18 differently expressed GC samples. By comparing ASEs of the low group to the high group with the stringent cutoff of p ≤ 0.05, changed AS ratio ≥ 0.2, we identified 10,447 RASEs in 5,916 genes (RASGs) that were associated with KRT18 expression change in these 50 GC samples, mainly A5SS, A3SS, CE, ES, and IR events (Figure 4B). These data suggested that KRT18 expression extensively affects ASEs in GC. RASGs were highly enriched (p ≤ 0.05) for apoptotic signaling pathway, mitotic cell cycle, protein phosphorylation, DNA repair, regulation of small GTPase-mediated signal transduction, microtubule-based movement, G2/M transition of mitotic cell cycle apoptotic process, response to DNA damage stimulus, and double-strand break repair in GO biological process term analysis (Figure 4C). Enriched KEGG pathways included platinum drug resistance, focal adhesion, apoptosis, cell cycle, colorectal cancer, phosphatidylinositol signaling system, and pancreatic cancer (Figure 4D; details can be found in Supplementary Table 8). The results indicate that the KRT18-associated RASGs play a role in gastric tumorigenesis in GC samples, in line with KRT18 regulation in AGS cells.
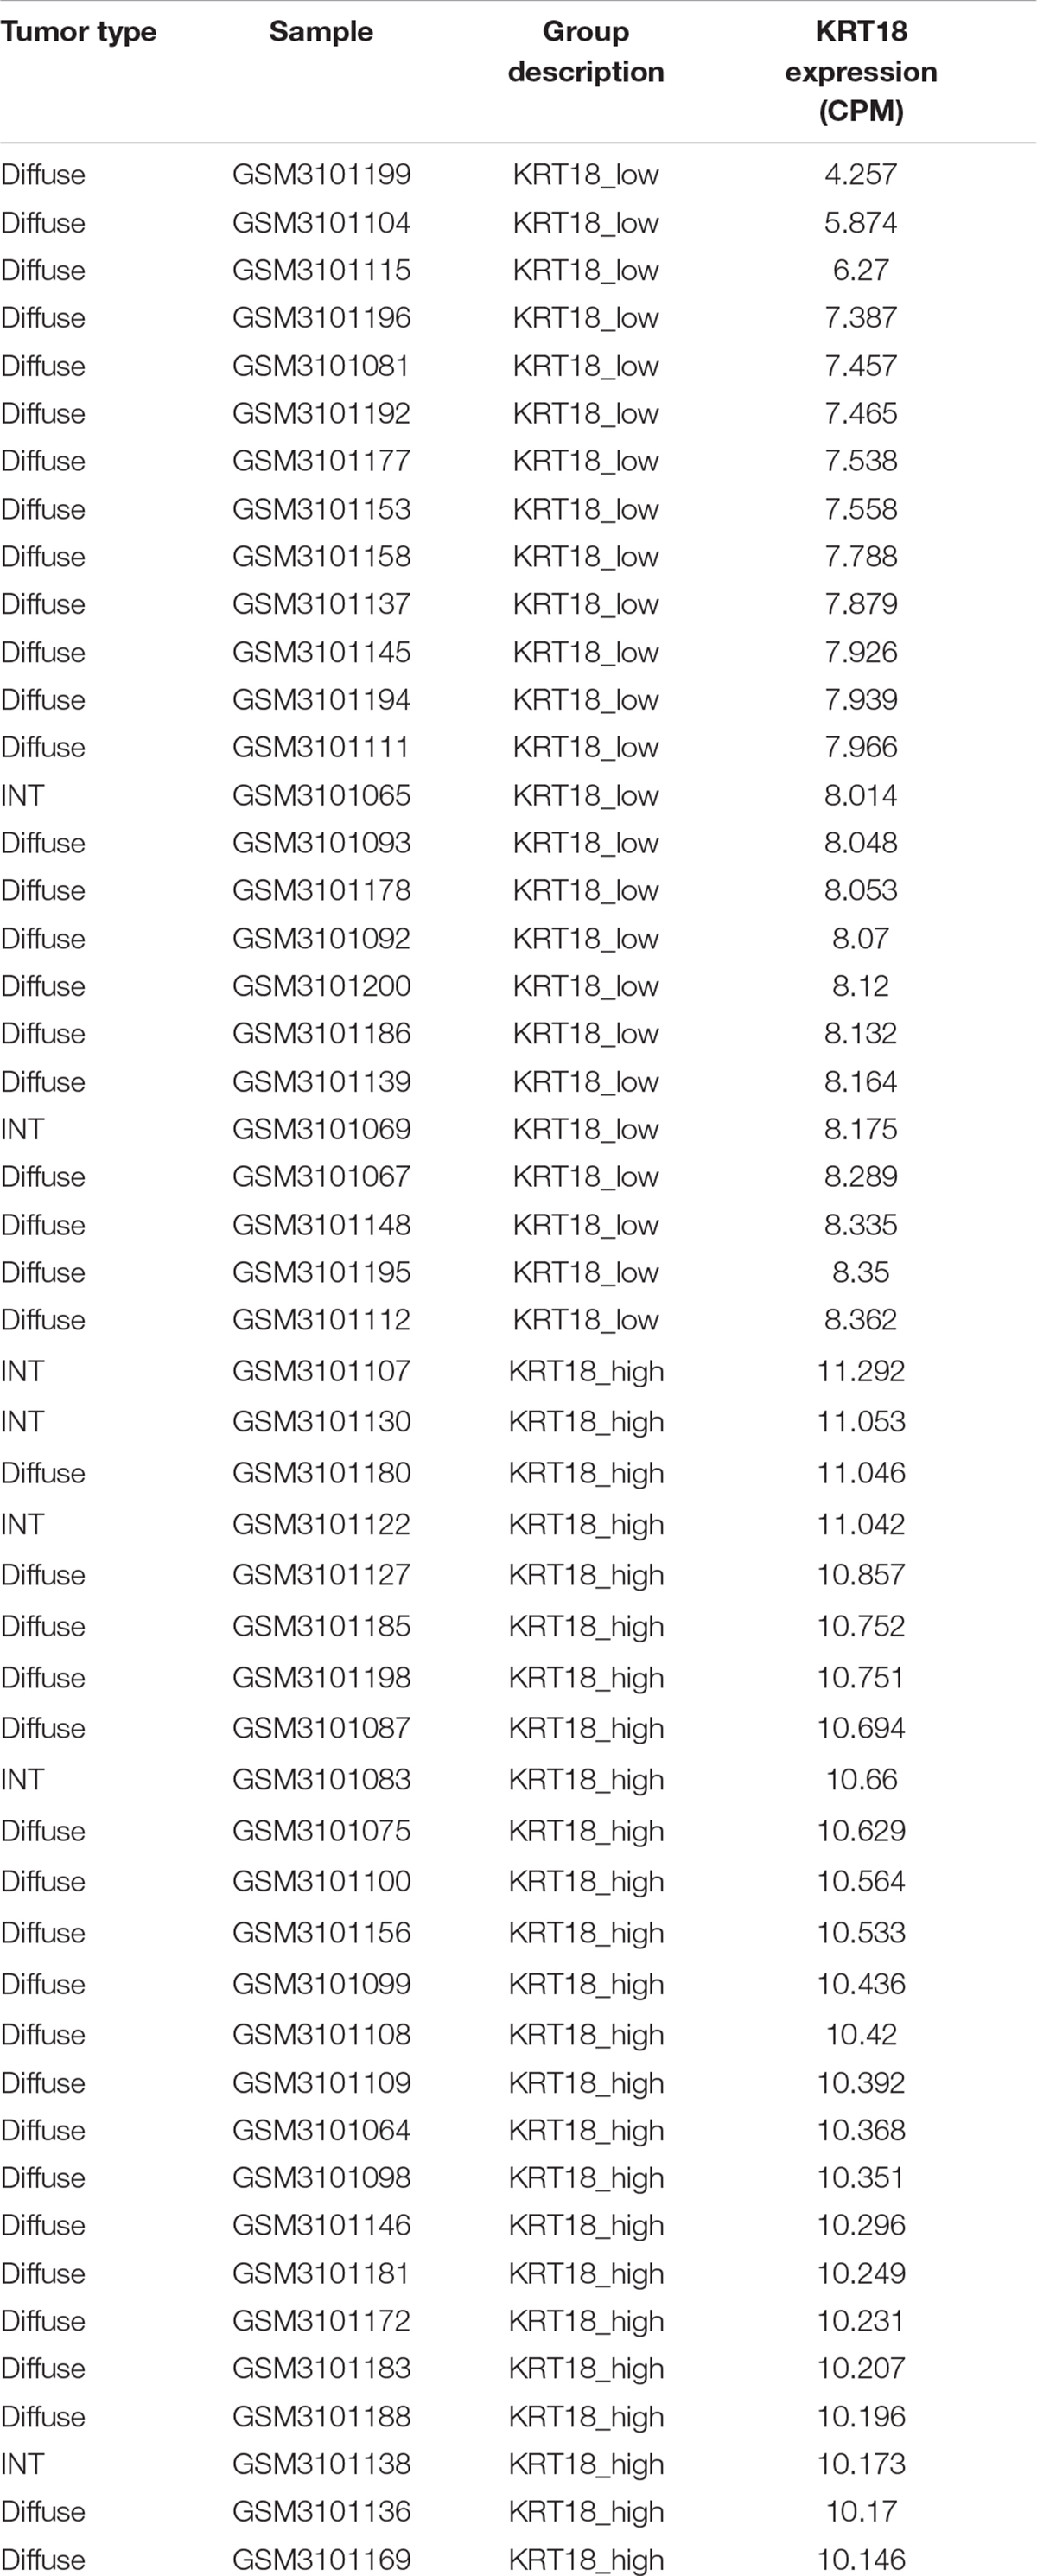
Table 3. The samples were grouped based on their KRT18 expression level regardless of tumor type.
Considering that tumor tissue is complicated in cell type and deregulated genes, these KRT18-dependent RASEs could be regulated by other factors. Then, we compared these RASEs and RASGs to those KRT18-affected in AGS cells and found that RASGs have a significant cooperation between gastric tissue samples and AGS cells, while it is not for RASEs (Figure 4E). This is also present in the RASGs enriched in cell proliferation, cell cycle, and apoptosis in GO biological process terms (Figure 4F). It is indicated that KRT18 may regulate similar genes, especially cell proliferation and apoptosis related, at the AS level in GC samples and cell lines, but not limited in the same splicing events. Besides, the validated RASGs in AGS cells were also significantly alternatively spliced in KRT18-high vs. KRT18-low GC tissue samples (Figure 4G).
KRT18 Affects Splicing Factors at Posttranscriptional Level in AGS Cells
With the purpose of preliminarily inquire the potential AS regulation mechanism of KRT18, a non-canonical RNA-binding protein, we analyzed the relationship between KRT18-mediated transcription changes and ASEs and SFs in RNA-seq data of AGS cells and GC tissue samples. By coexpression analysis, we identified 1,278 KRT18-coexpressed genes (correlation coefficient ≥ 0.6, p < 0.05) in GC samples. We found the 1,278 coexpressed genes had a significant overlap with RNA splicing–related genes (19 overlapped genes), suggesting the relationship between KRT18 and RNA splicing regulators at transcriptional level (Figure 5A). As for the posttranscriptional regulation related to KRT18, the RASGs in KRT18-high vs. 25 KRT18-low GC tissue samples also enriched in RNA splicing term (details can be found in Supplementary Table 8). These results indicated that KRT18 affects gene ASEs possibly by modulating the expression or AS of some SFs. We then constructed a network between KRT18-coexpressed SFs and affected ASEs by calculating the correlation coefficient between them. A total of 463 SF-ASE pairs were obtained (correlation > 0.7 and p < 0.01), including 10 SFs and 272 ASEs, suggesting the substantial relationship between SFs and ASEs. We then analyzed the enriched functions of genes from the 272 ASEs. The top 10 enriched GO BP terms showed specific enrichment in apoptotic process, RNA splicing, transcription, and mitosis (Figure 5C).
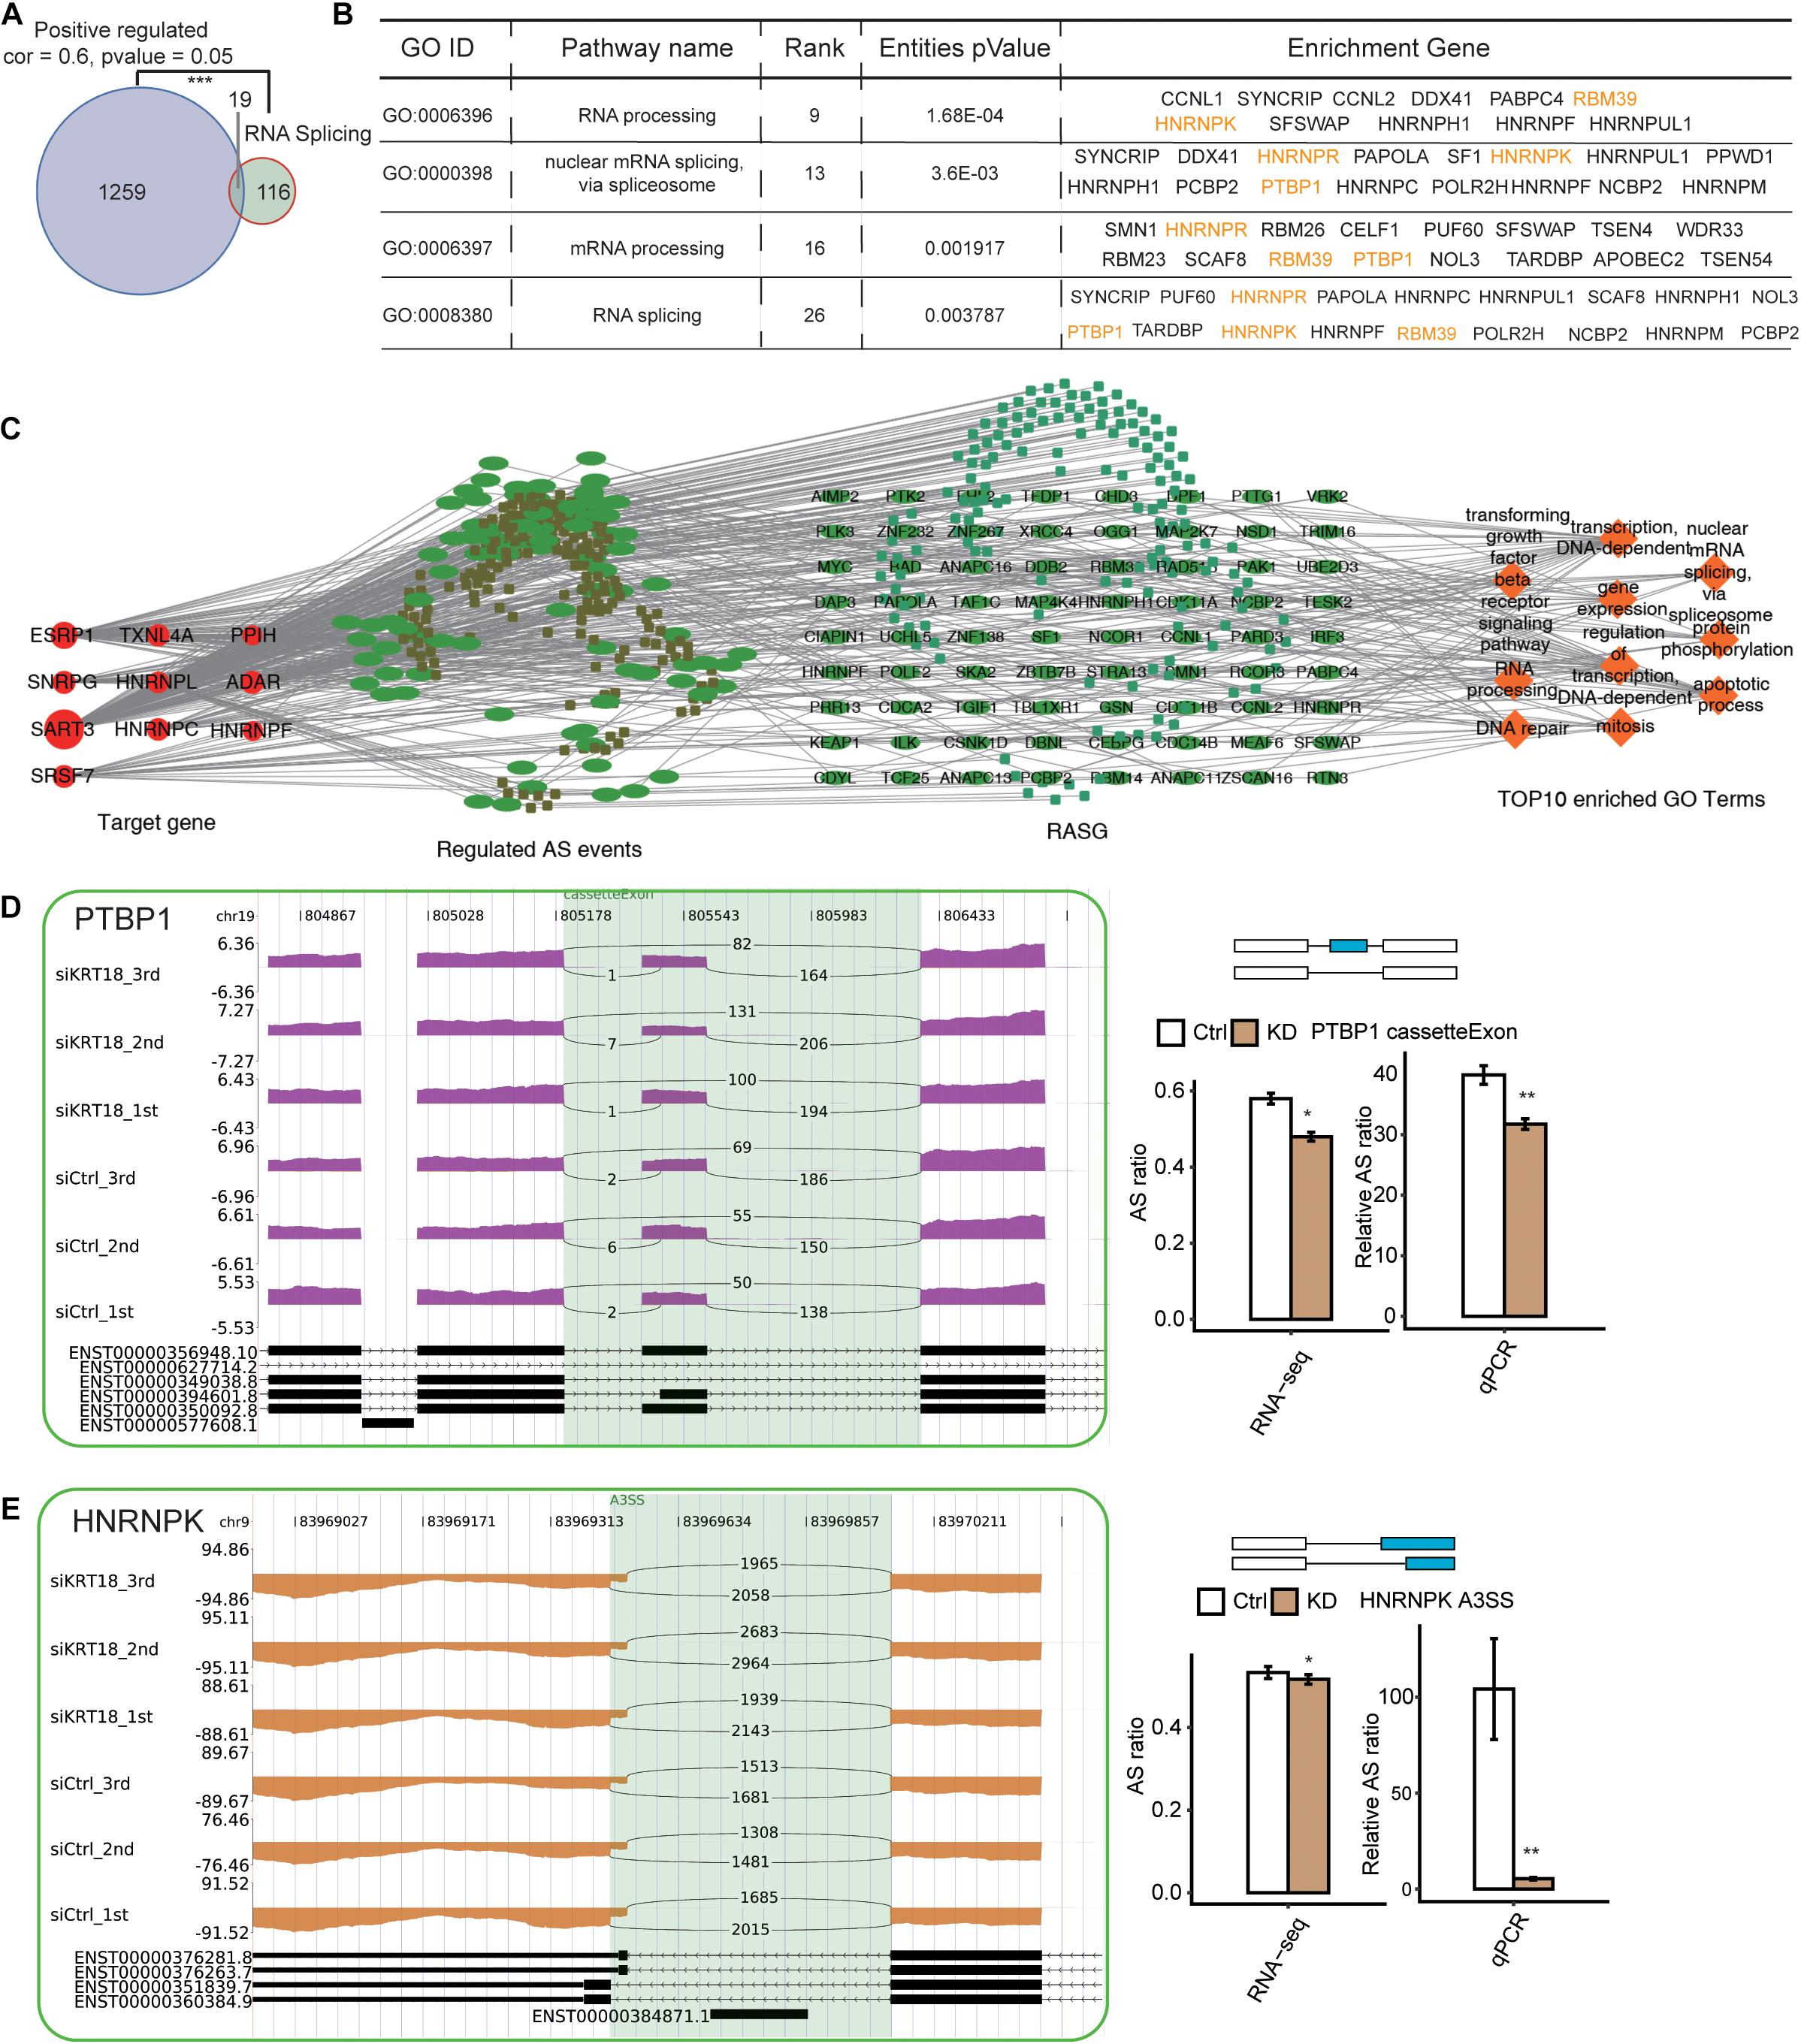
Figure 5. Deregulation of splicing factors by KRT18 in GC samples and AGS cells. (A) Venn diagram shows the overlapping between KRT18-coexpressed genes positively and genes in RNA splicing–related terms from GO database. ***p < 0.001, hypergeometric test. (B) RNA splicing–related terms in GO biological process analysis of the RASGs from RNA-seq data in AGS cells. Validated RASGs using RT-qPCR in AGS cells were labeled in yellow. (C) The coderegulation of alternative splicing network between top10 hub RBPs (the leftmost part and the size of the circle represented the number of connections) and RASEs (the middle left part, which includes only NIR RASEs). The top enriched GO biological process of codisturbed RASGs (the middle right part) was shown in orange (the rightmost part). (D,E) Validation of two RASEs, cassette exon in PTBP1 (C), and A3SS in HNRNPK (D), by RT-qPCR in AGS cells. IGV sashimi plots show ASE changes occurred in KRT18-KD cells and control (left panel), and the transcripts for the gene are shown below (right panel, top). The schematic diagrams (right panel, top) depict the structures of ASEs, AS (altered splicing events), and M (model splicing events) (alternative exon was labeled in blue). The exon sequences are denoted by boxes and intron sequences by the horizontal line. RNA-seq quantification and RT-qPCR validation of ASEs are shown in the bottom of right panel. The altered ratios of AS events in RNA-seq were calculated using the following formula: AS junction reads/(AS junction reads + M junction reads), whereas the altered ratios of AS events in RT-qPCR were calculated using the formula: AS transcripts level/M transcripts level. Error bars represent mean ± SEM. *p < 0.05, **p < 0.01, Student t-test.
Moreover, we found that KRT18-affected RASGs were significantly enriched in RNA processing and splicing (Figure 4B). Using RT-qPCR experiment, we verified the AS changes of four SFs (Figures 5D,E and Supplementary Figure 4), including PTBP1, HNRNPK, HNRNPR, and RBM39, identified from RNA-seq data in KRT18-KD and control AGS cells (primer details are shown in Supplementary Table 6). CE in PTBP1 (Figure 5D) and A3SS in HNRNPK (Figure 5E) were verified with significant change in KRT18-KD vs. control group, in agreement with the transcriptome analysis results of RNA-seq data. These results suggested that KRT18 could affect global AS profile by modulating expression and AS of key SFs.
Discussion
KRT18 is a cytokeratin in epithelial and endothelial cells reported to be aberrantly expressed and regarded as a biomarker and important regulator in many cancers, including GC (Yin et al., 2016; Zhang et al., 2016, 2019a; Bozza et al., 2018; Nagel et al., 2018; Golob-Schwarzl et al., 2019). In addition to be a biomarker in cancers, increasing evidences have suggested that KRT18 is an important regulator in many diseases, including cancer. It can impress cell migration, enhance drug sensitivity, and affect EMT process via signaling pathways in breast cancer or non–small cell lung carcinoma, as well as regulate FAS-mediated apoptotic pathway at transcriptional and AS levels in HeLa cells (Zhang et al., 2014, 2016; Jung et al., 2016; Cheng et al., 2019; Shi et al., 2019). In this study, we found KRT18-KD could inhibit cell proliferation and promote apoptosis in AGS cells. Nevertheless, it remains unclear for the regulation mechanism of cytokeratin proteins such as KRT18 on apoptosis process at transcriptional or posttranscriptional level in GC. In the present study, we performed experiments and bioinformatics analysis to identify what role KRT18 plays in GC and explore the potential regulatory mechanism.
We analyzed the expression level of KRT18 in 450 STAD tissue samples from TCGA database and 140 GC samples from GEO database and found a significant overexpression in gastric tumor samples (Figures 1A, 4A), consistent with the biomarker function of KRT18 in GC (Bilici, 2015; Nagel et al., 2018). We then explored the potential functions of KRT18 in GC AGS cells by silencing KRT18 with siRNA and unbiased RNA-seq analysis. Notably, KRT18 selectively affects the expression of genes enriched in cell proliferation, DNA-dependent transcription, and apoptotic process (Figures 1G,H), catering to the role of KRT18 in affecting EMT process and regulating apoptotic genes at transcriptional level (Jung et al., 2016; Cheng et al., 2019; Pastushenko and Blanpain, 2019). We found KRT18-KD promoted apoptosis and inhibited cell proliferation in AGS cells, but not in MKN-45 cells, which may be attributed to the insufficient knockdown efficiency in MKN-45 cells. We found that KRT18 up-regulated the expression of NFKB1 and IL1RN, whereas the FGF21, NUPR1, and ZNF616 were negatively regulated in AGS cells. KRT18-affected FGF21 was reported to activate the FGF signaling pathway by binding FGFR and have therapeutic potential in GC as a diagnostic and prognostic biomarker (Degirolamo et al., 2016; Zhang et al., 2019b). The transcription factor, NUPR1, can convert stress signals into a program of expression and participate in regulating cell cycle, apoptosis, autophagy, and DNA repair response processes (Chowdhury et al., 2009; Santofimia-Castano et al., 2018). It has been reported that NFKB1 was one of the five subunits of nuclear factor κB (NF-κB), which is widely implicated in carcinogenesis (Concetti and Wilson, 2018), and IL1RN was an angiogenesis inhibitor in GC (Gong et al., 2018). Further research can be carried out to study the regulatory mechanism of KRT18 on these genes.
In addition to expression regulation, bioinformatics analysis using RNA-seq data showed that KRT18 also modulates AS of many genes, which were enriched in mitosis, cell cycle, DNA repair, regulation of translation, TGF-β receptor signaling pathway, apoptotic process, transcription, and ERBB signaling pathway (Figures 2D,E). These functional pathways mostly reappeared in the analysis results of GC tissue samples (Figures 4C,D). The KRT18-affected RASGs in AGS cells and gastric samples were significantly overlapped, especially cell cycle and apoptosis genes, but not related to the same ASEs (Figures 4F,G), indicating that the effect of KRT18 on AS might be closely related to the development of GC. It was known that AS is tightly linked to tumors, which can produce different proteins with different structures and functions associated with carcinogenesis (Zhao et al., 2015; Sveen et al., 2016). Many studies have found that GC-related genes are differentially spliced (Li and Yuan, 2017), suggesting the important implication of AS in GC development.
Here we noted that validated ASEs regulated by KRT18 mostly located in genes related to mitosis, cell cycle, apoptotic process, and ERBB signaling pathway, including ANAPC16 (anaphase promoting complex subunit 16), APLP1 (amyloid beta precursor like protein 1), CDK11A (cyclin-dependent kinase 11A), DPF1 (double PHD fingers 1), SGOL1 (shugoshin 1), MAPK9 (mitogen-activated protein kinase 9), NCK2 (NCK adaptor protein 2), and STRA13 (stimulated by retinoic acid gene 13 protein, also known as DEC1). These AS genes were also validated in GC samples with differential KRT18 (Figure 4G). The occurrence and progression of cancers, including GC, are necessarily accompanied by the dysregulation of mitotic cell cycle and apoptotic process (Bonomi et al., 2013; Cress et al., 2017). KRT18-affected NCK2 and JNK2 at the AS level are related to ERBB/HER/EGFR signaling pathway. This signaling pathway activation is correlated with tumorigenesis, cancer metastasis, prognosis, and overall survival in many cancers (Wang, 2017). Especially, the amplification, overexpression, and various splices of ERBB2 are independent prognostic factors in GC (Volpi et al., 2019). NCK2 can modulate cell motility by interacting with focal adhesion through its SH3/SH2 domain (Goicoechea et al., 2002) and may influence tumor aggressiveness by mediating cell–extracellular matrix interactions in ovarian cancer (Fanelli et al., 2018) and promote melanoma progression in vitro and in vivo (Labelle-Cote et al., 2011). MAPK9 encodes a serine/threonine-protein kinase (also named JNK2), distributed in tissue broadly. The functions of JNK2 in regulation of cancer cell apoptosis and survival have been highlighted in previous study (Wu et al., 2019). Crosstalk between JNK and other pathways, such as NF-κB, p38, and their sharing common upstream activators, is critical for cancer programming and may act synergistically to regulate cancer cell survival (Svensson et al., 2011; Ruan et al., 2015). JNK2 has been reported to be a mediator of cell apoptosis and death (Arbour et al., 2002; Zhong et al., 2007) and also induce cell survival in the contrary (Hochedlinger et al., 2002; Liu et al., 2004), underlining that the functional mechanism of JNK2 in GC needs to be further investigated. So far, there are at least four known JNK2 transcript variants, related to the alternate selection between two middle exons and the alternate splicing at the C terminus, which show different substrate-binding and self- or substrate-phosphorylation activities and expression level (Kallunki et al., 1994; Dreskin et al., 2001). Moreover, the novel JNK2 transcript variants were shown to have different stimulation activities on AP-1, a regulator of cell proliferation and survival (Wang et al., 2010). This result indicates that KRT18 could contribute to tumorigenesis via regulating the AS of JNK2 or NCK2.
In addition, we found the significant coexpression between KRT18 and SFs in GC samples and KRT18-affected AS of SFs in AGS cells and GC samples (Figure 5 and Supplementary Table 8). By constructing the network between SFs and ASEs, we found 10 SFs were tightly related to the KRT18-affected ASEs. These interacted ASE genes were also enriched in apoptosis functional terms (Figure 5C), suggesting that the dysregulation of SFs at transcriptional or posttranscriptional levels may contribute to the result that KRT18 extensively regulates gene AS. The SF alternations, including somatic mutation, transcriptional alteration, and their functional impactions in human tumor development, have been extensively studied (Anczukow and Krainer, 2016; Rahman et al., 2020). Here PTBP1 and HNRNPK splicing patterns were both validated to be KRT18-dependent in AGS cells and GC samples. PTBP1 was originally identified as an SF and a promoter in multiple cancers by regulating oncogenes or tumor suppressors, including PKM2, MRP1, and FGFR1 (Wang et al., 2017; Georgilis et al., 2018). Similarly, HNRNPK has been reported to be multifunctional protein overexpressed in several human cancers, regulating both oncogenic and tumor-suppressive pathways through a bevy of chromatin-, DNA-, RNA-, and protein-mediated activation (Gallardo et al., 2016), such as inhibiting tumor growth through p53/p21/CCND1 axis in vivo (Huang et al., 2017), and promotes gastric tumorigenesis through regulating CD44E AS (Peng et al., 2019). Thus, KRT18 may regulate the expression and AS of these SFs to regulate many ASEs.
In this study, we have successfully demonstrated the KRT18 impaction on gene expression and AS in AGS cells and GC samples, possibly via affecting some key SFs. We, for the first time, constructed the interaction network between KRT18-coexpressed SFs and KRT18-affected ASEs, providing a novel mechanism how KRT18 affects AS in cells. The results that KRT18 affects proliferation and apoptotic genes, which is critical in tumorigenesis and cancer progression at transcriptional or posttranscriptional level, underline that the well-known caspase-cleaved cytokeratin KRT18 might conversely regulate proliferation and apoptotic pathways, which expands the functional importance of keratins in GC. Further study of KRT18-affected AS should contribute to a precise understanding of keratins directing tumorigenesis and potentially KRT18-targeted therapies.
Data Availability Statement
RNA-seq data in this publication have been deposited in NCBI’s Gene Expression Omnibus and are accessible through GEO series accession number GSE158242. The clinical samples data can be obtained from The Cancer Genome Atlas (TCGA) database and GEO database (GSE113225).
Author Contributions
W-GD and BC contributed to the study design. BC, XX, D-DL, and Y-TX prepared the experiments and data analysis. W-GD and BC wrote the manuscript. All authors read and approved the final manuscript.
Conflict of Interest
The authors declare that the research was conducted in the absence of any commercial or financial relationships that could be construed as a potential conflict of interest.
Acknowledgments
We are very grateful to the team memebers from ABLife Inc. in guidance and suggestions for the design and revision of the manuscript.
Supplementary Material
The Supplementary Material for this article can be found online at: https://www.frontiersin.org/articles/10.3389/fgene.2021.635429/full#supplementary-material
Supplementary Figure 1 | Analysis of KRT18 expression levels and prognostic in stomach adenocarcinoma (STAD) samples from TCGA database. (A) Distribution of expression levels of KRT18 in normal samples and different stages of STAD samples. Statistical analysis was performed by Student t-test: ∗∗p < 0.01, ∗∗∗p < 0.001. Stomach adenocarcinoma was staged according to standard of National Comprehensive Cancer Network (NCCN) stage. (B) Overall survival (OS) in STAD patients with top 50% versus bottom 50% of KRT18 expression.
Supplementary Figure 2 | The top 10 representative KEGG pathways of up- (A) and down-regulated genes (B).
Supplementary Figure 3 | Validation of DEGs (A) and RASEs (B) of genes related to cell cycle or apoptosis process by RT-qPCR in AGS cells. (A) Gene expression quantified by RNA sequencing data and qRT-PCR. FPKM values were calculated as explained in section “Materials and Methods.” (B) The schematic diagrams (top panel) depict the structures of ASEs, AS (altered splicing events), and M (model splicing events) (alternative exon was labeled in blue). The exon sequences are denoted by boxes and intron sequences by the horizontal line. RNA-seq quantification and RT-qPCR validation of ASEs are shown in the bottom panel. The altered ratio of AS events in RNA-seq were calculated using the formula: AS junction reads/(AS junction reads + M junction reads), whereas the altered ratios of AS events in RT-qPCR were calculated using the formula: AS transcripts level/M transcripts level. Error bars represent mean ± SEM. ∗p < 0.05, ∗∗p < 0.01, ∗∗∗p < 0.001, Student t-test. (C) Bar plot showing the apoptotic level (left panel) and proliferation level changes of MKN-45 cells after KRT18-KD. (D) Bar plot showing the G2/G1 ratio in KRT18-KD and control samples by cell cycle experiment. AGS cells (left panel) and MKN-45 cells (right panel) were shown.
Supplementary Figure 4 | Validation of RASEs in splicing factor genes, HNRNPR (A) and RBM39 (B), by RT-qPCR in AGS cells. IGV sashimi plots show ASE changes occurred in KRT18-KD cells and control (left panel), and the transcripts for the gene are shown below (right panel, top). The schematic diagrams (right panel, top) depict the structures of ASEs, AS (altered splicing events), and M (model splicing events) (alternative exon was labeled in blue). The exon sequences are denoted by boxes and intron sequences by the horizontal line. RNA-seq quantification and RT-qPCR validation of ASEs are shown in the bottom of right panel. Error bars represent mean ± SEM. ∗p < 0.05, ∗∗∗p < 0.001, Student t-test. The altered ratios of AS events in RNA-seq were calculated using the formula: AS junction reads/(AS junction reads + M junction reads), whereas the altered ratios of AS events in RT-qPCR were calculated using the formula: AS transcripts level/M transcripts level.
Abbreviations
KRT18, keratin 18; DEGs, differential expressed genes; AS, alternative splicing; ASEs, alternative splicing events; RASEs, KRT18-affected alternative splicing events; RASGs, KRT18-affected alternative spliced genes; SFs, splicing factors; TCGA, The Cancer Genome Atlas.
References
Amieva, M., and Peek, R. M. Jr. (2016). Pathobiology of Helicobacter pylori–induced gastric cancer. Gastroenterology 150, 64–78. doi: 10.1053/j.gastro.2015.09.004
Anczukow, O., and Krainer, A. R. (2016). Splicing-factor alterations in cancers. RNA 22, 1285–1301. doi: 10.1261/rna.057919.116
Arbour, N., Naniche, D., Homann, D., Davis, R. J., Flavell, R. A., and Oldstone, M. B. (2002). c-Jun NH(2)-terminal kinase (JNK)1 and JNK2 signaling pathways have divergent roles in CD8(+) T cell-mediated antiviral immunity. J. Exp. Med. 195, 801–810. doi: 10.1084/jem.20011481
Baralle, F. E., and Giudice, J. (2017). Alternative splicing as a regulator of development and tissue identity. Nat. Rev. Mol. Cell Biol. 18, 437–451. doi: 10.1038/nrm.2017.27
Bilici, A. (2015). Cytokeratin 18 for chemotherapy efficacy in gastric cancer. Transl. Gastrointest Cancer 4, 200–206. doi: 10.1007/s10120-014-0359-x
Bonomi, S., Gallo, S., Catillo, M., Pignataro, D., Biamonti, G., and Ghigna, C. (2013). Oncogenic alternative splicing switches: role in cancer progression and prospects for therapy. Int. J. Cell Biol. 2013:962038.
Bozza, W. P., Zhang, Y., and Zhang, B. (2018). Cytokeratin 8/18 protects breast cancer cell lines from TRAIL-induced apoptosis. Oncotarget 9, 23264–23273. doi: 10.18632/oncotarget.25297
Bradner, J. E., Hnisz, D., and Young, R. A. (2017). Transcriptional Addiction in Cancer. Cell 168, 629–643. doi: 10.1016/j.cell.2016.12.013
Chen, J., and Weiss, W. A. (2015). Alternative splicing in cancer: implications for biology and therapy. Oncogene 34, 1–14. doi: 10.1038/onc.2013.570
Cheng, Y., Qin, K., Huang, N., Zhou, Z., Xiong, H., Zhao, J., et al. (2019). Cytokeratin 18 regulates the transcription and alternative splicing of apoptotic-related genes and pathways in HeLa cells. Oncol. Rep. 42, 301–312.
Chowdhury, U. R., Samant, R. S., Fodstad, O., and Shevde, L. A. (2009). Emerging role of nuclear protein 1 (NUPR1) in cancer biology. Cancer Metastasis Rev. 28, 225–232. doi: 10.1007/s10555-009-9183-x
Chung, B. M., Rotty, J. D., and Coulombe, P. A. (2013). Networking galore: intermediate filaments and cell migration. Curr. Opin. Cell Biol. 25, 600–612. doi: 10.1016/j.ceb.2013.06.008
Climente-Gonzalez, H., Porta-Pardo, E., Godzik, A., and Eyras, E. (2017). The functional impact of alternative splicing in Cancer. Cell Rep. 20, 2215–2226. doi: 10.1016/j.celrep.2017.08.012
Concetti, J., and Wilson, C. L. (2018). NFKB1 and Cancer: friend or foe? Cells 7:133. doi: 10.3390/cells7090133
Corbett, A. H. (2018). Post-transcriptional regulation of gene expression and human disease. Curr. Opin. Cell Biol. 52, 96–104.
Coulombe, P. A., and Wong, P. (2004). Cytoplasmic intermediate filaments revealed as dynamic and multipurpose scaffolds. Nat. Cell Biol. 6, 699–706. doi: 10.1038/ncb0804-699
Cress, W. D., Yu, P., and Wu, J. (2017). Expression and alternative splicing of the cyclin-dependent kinase inhibitor-3 gene in human cancer. Int. J. Biochem. Cell Biol. 91, 98–101. doi: 10.1016/j.biocel.2017.05.013
da Cunha, C. B., Klumpers, D. D., Koshy, S. T., Weaver, J. C., Chaudhuri, O., Seruca, R., et al. (2016). CD44 alternative splicing in gastric cancer cells is regulated by culture dimensionality and matrix stiffness. Biomaterials 98, 152–162. doi: 10.1016/j.biomaterials.2016.04.016
Degirolamo, C., Sabba, C., and Moschetta, A. (2016). Therapeutic potential of the endocrine fibroblast growth factors FGF19. FGF21 and FGF23. Nat. Rev. Drug Discov. 15, 51–69. doi: 10.1038/nrd.2015.9
Diaz, P., Valenzuela Valderrama, M., Bravo, J., and Quest, A. F. G. (2018). Helicobacter pylori and gastric cancer: adaptive cellular mechanisms involved in disease progression. Front. Microbiol. 9:5. doi: 10.3389/fmicb.2018.00005
Dmello, C., Srivastava, S. S., Tiwari, R., Chaudhari, P. R., Sawant, S., and Vaidya, M. M. (2019). Multifaceted role of keratins in epithelial cell differentiation and transformation. J. Biosci. 44:33.
Dreskin, S. C., Thomas, G. W., Dale, S. N., and Heasley, L. E. (2001). Isoforms of Jun kinase are differentially expressed and activated in human monocyte/macrophage (THP-1) cells. J. Immunol. 166, 5646–5653. doi: 10.4049/jimmunol.166.9.5646
El Marabti, E., and Younis, I. (2018). The Cancer spliceome: reprograming of alternative splicing in Cancer. Front. Mol. Biosci. 5:80. doi: 10.3389/fmolb.2018.00080
Fanelli, M., Camperchioli, A., Petrella, L., Petrillo, M., Baranello, C., Baccaro, P., et al. (2018). Non-catalytic region of tyrosine kinase adaptor protein 2 (NCK2) pathways as factor promoting aggressiveness in ovarian cancer. Int. J. Biol. Markers 33, 124–131. doi: 10.5301/ijbm.5000264
Gallardo, M., Hornbaker, M. J., Zhang, X., Hu, P., Bueso-Ramos, C., and Post, S. M. (2016). Aberrant hnRNP K expression: all roads lead to cancer. Cell Cycle 15, 1552–1557. doi: 10.1080/15384101.2016.1164372
Georgilis, A., Klotz, S., Hanley, C. J., Herranz, N., Weirich, B., Morancho, B., et al. (2018). PTBP1-mediated alternative splicing regulates the inflammatory secretome and the pro-tumorigenic effects of senescent cells. Cancer Cell 34, 85–102.e9.
Goicoechea, S. M., Tu, Y., Hua, Y., Chen, K., Shen, T. L., Guan, J. L., et al. (2002). Nck-2 interacts with focal adhesion kinase and modulates cell motility. Int. J. Biochem. Cell Biol. 34, 791–805. doi: 10.1016/s1357-2725(02)00002-x
Golob-Schwarzl, N., Bettermann, K., Mehta, A. K., Kessler, S. M., Unterluggauer, J., Krassnig, S., et al. (2019). High Keratin 8/18 ratio predicts aggressive hepatocellular cancer phenotype. Transl. Oncol. 12, 256–268. doi: 10.1016/j.tranon.2018.10.010
Gong, Z., Ma, J., Su, H., Guo, T., Cai, H., Chen, Q., et al. (2018). Interleukin-1 receptor antagonist inhibits angiogenesis in gastric cancer. Int. J. Clin. Oncol. 23, 659–670. doi: 10.1007/s10147-018-1242-2
Gravalos, C., and Jimeno, A. (2008). HER2 in gastric cancer: a new prognostic factor and a novel therapeutic target. Ann. Oncol. 19, 1523–1529. doi: 10.1093/annonc/mdn169
Hartgrink, H. H., Jansen, E. P., van Grieken, N. C., and van de Velde, C. J. (2009). Gastric cancer. Lancet 374, 477–490.
Hesse, M., Magin, T. M., and Weber, K. (2001). Genes for intermediate filament proteins and the draft sequence of the human genome: novel keratin genes and a surprisingly high number of pseudogenes related to keratin genes 8 and 18. J. Cell Sci. 114, 2569–2575. doi: 10.1242/jcs.114.14.2569
Hochedlinger, K., Wagner, E. F., and Sabapathy, K. (2002). Differential effects of JNK1 and JNK2 on signal specific induction of apoptosis. Oncogene 21, 2441–2445. doi: 10.1038/sj.onc.1205348
Hu, T. Y., Fan, X. Q., Ma, L., Liu, J. Q., Chang, Y. L., Yang, P. C., et al. (2017). TIM4-TIM1 interaction modulates Th2 pattern inflammation through enhancing SIRT1 expression. Int. J. Mol. Med. 40, 1504–1510. doi: 10.3892/ijmm.2017.3150
Huang, H., Han, Y., Yang, X., Li, M., Zhu, R., Hu, J., et al. (2017). HNRNPK inhibits gastric cancer cell proliferation through p53/p21/CCND1 pathway. Oncotarget 8, 103364–103374. doi: 10.18632/oncotarget.21873
Jung, H., Kim, B., Moon, B. I., and Oh, E. S. (2016). Cytokeratin 18 is necessary for initiation of TGF-beta1-induced epithelial-mesenchymal transition in breast epithelial cells. Mol. Cell. Biochem. 423, 21–28. doi: 10.1007/s11010-016-2818-7
Kahles, A., Lehmann, K. V., Toussaint, N. C., Huser, M., Stark, S. G., Sachsenberg, T., et al. (2018). Comprehensive analysis of alternative splicing across tumors from 8,705 patients. Cancer Cell 34:e6.
Kallunki, T., Su, B., Tsigelny, I., Sluss, H. K., Derijard, B., Moore, G., et al. (1994). JNK2 contains a specificity-determining region responsible for efficient c-Jun binding and phosphorylation. Genes Dev. 8, 2996–3007. doi: 10.1101/gad.8.24.2996
Kim, D., Pertea, G., Trapnell, C., Pimentel, H., Kelley, R., and Salzberg, S. L. (2013). TopHat2: accurate alignment of transcriptomes in the presence of insertions, deletions and gene fusions. Genome Biol. 14:R36.
Kim, S. K., Kim, H. J., Park, J. L., Heo, H., Kim, S. Y., Lee, S. I., et al. (2020). Identification of a molecular signature of prognostic subtypes in diffuse-type gastric cancer. Gastric Cancer 23, 473–482. doi: 10.1007/s10120-019-01029-4
Kramer, G., Erdal, H., Mertens, H. J., Nap, M., Mauermann, J., Steiner, G., et al. (2004). Differentiation between cell death modes using measurements of different soluble forms of extracellular cytokeratin 18. Cancer Res. 64, 1751–1756. doi: 10.1158/0008-5472.can-03-2455
Labelle-Cote, M., Dusseault, J., Ismail, S., Picard-Cloutier, A., Siegel, P. M., and Larose, L. (2011). Nck2 promotes human melanoma cell proliferation, migration and invasion in vitro and primary melanoma-derived tumor growth in vivo. BMC Cancer 11:443. doi: 10.1186/1471-2407-11-443
Li, R. Z., Hou, J., Wei, Y., Luo, X., Ye, Y., and Zhang, Y. (2018). hnRNPDL extensively regulates transcription and alternative splicing. Gene 687, 125–134. doi: 10.1016/j.gene.2018.11.026
Liu, J., Minemoto, Y., and Lin, A. (2004). c-Jun N-terminal protein kinase 1 (JNK1), but not JNK2, is essential for tumor necrosis factor alpha-induced c-Jun kinase activation and apoptosis. Mol. Cell. Biol. 24, 10844–10856. doi: 10.1128/mcb.24.24.10844-10856.2004
Livak, K. J., and Schmittgen, T. D. (2001). Analysis of relative gene expression data using real-time quantitative PCR and the 2(-Delta Delta C(T)) method. Methods 25, 402–408. doi: 10.1006/meth.2001.1262
Loor, A., and Dumitrascu, D. L. (2016). Helicobacter pylori infection, gastric cancer and gastropanel. Rom J. Int. Med. 54, 151–156. doi: 10.1515/rjim-2016-0025
Mohme, M., Riethdorf, S., and Pantel, K. (2017). Circulating and disseminated tumour cells - mechanisms of immune surveillance and escape. Nat. Rev. Clin. Oncol. 14, 155–167. doi: 10.1038/nrclinonc.2016.144
Nagel, M., Schulz, J., Maderer, A., Goepfert, K., Gehrke, N., Thomaidis, T., et al. (2018). Cytokeratin-18 fragments predict treatment response and overall survival in gastric cancer in a randomized controlled trial. Tumour Biol. 40:1010428318764007.
Pan, Q., Shai, O., Lee, L. J., Frey, B. J., and Blencowe, B. J. (2008). Deep surveying of alternative splicing complexity in the human transcriptome by high-throughput sequencing. Nat. Genet. 40, 1413–1415. doi: 10.1038/ng.259
Pastushenko, I., and Blanpain, C. (2019). EMT transition states during tumor progression and metastasis. Trends Cell Biol. 29, 212–226. doi: 10.1016/j.tcb.2018.12.001
Peng, W.-Z., Liu, J.-X., Li, C.-F., Ma, R., and Jie, J.-Z. (2019). hnRNPK promotes gastric tumorigenesis through regulating CD44E alternative splicing. Cancer Cell Int. 19:335.
Rahman, M. A., Krainer, A. R., and Abdel-Wahab, O. (2020). SnapShot: splicing alterations in Cancer. Cell 180, 208–208.e1.
Rawla, P., and Barsouk, A. (2019). Epidemiology of gastric cancer: global trends, risk factors and prevention. Przeglad Gastroenterol. 14:26. doi: 10.5114/pg.2018.80001
Robinson, M. D., Mccarthy, D. J., and Smyth, G. K. (2010). edgeR: a Bioconductor package for differential expression analysis of digital gene expression data. Bioinformatics 26:139. doi: 10.1093/bioinformatics/btp616
Ruan, J., Qi, Z., Shen, L., Jiang, Y., Xu, Y., Lan, L., et al. (2015). Crosstalk between JNK and NF-kappaB signaling pathways via HSP27 phosphorylation in HepG2 cells. Biochem. Biophys. Res. Commun. 456, 122–128. doi: 10.1016/j.bbrc.2014.11.045
Santofimia-Castano, P., Lan, W., Bintz, J., Gayet, O., Carrier, A., Lomberk, G., et al. (2018). Inactivation of NUPR1 promotes cell death by coupling ER-stress responses with necrosis. Sci. Rep. 8:16999.
Schutte, B., Henfling, M., Kolgen, W., Bouman, M., Meex, S., Leers, M. P., et al. (2004). Keratin 8/18 breakdown and reorganization during apoptosis. Exp. Cell Res. 297, 11–26. doi: 10.1016/j.yexcr.2004.02.019
Sharma, P., Alsharif, S., Fallatah, A., and Chung, B. M. (2019). Intermediate filaments as effectors of cancer development and metastasis: a focus on keratins. Vimentin Nestin. Cells 8:497. doi: 10.3390/cells8050497
Shi, R., Wang, C., Fu, N., Liu, L., Zhu, D., Wei, Z., et al. (2019). Downregulation of cytokeratin 18 enhances BCRP-mediated multidrug resistance through induction of epithelial-mesenchymal transition and predicts poor prognosis in breast cancer. Oncol. Rep. 41, 3015–3026.
Sitarz, R., Skierucha, M., Mielko, J., Offerhaus, G. J. A., Maciejewski, R., and Polkowski, W. P. (2018). Gastric cancer: epidemiology, prevention, classification, and treatment. Cancer Manag. Res. 10:239. doi: 10.2147/cmar.s149619
Song, X., Zeng, Z., Wei, H., and Wang, Z. (2018). Alternative splicing in cancers: from aberrant regulation to new therapeutics. Semin. Cell Dev. Biol. 75, 13–22. doi: 10.1016/j.semcdb.2017.09.018
Sullivan, B. T., Cherry, J. A., Sakamoto, H., Henkes, L. E., Townson, D. H., and Rueda, B. R. (2010). Cytokeratin 18 expression inhibits cytokine-induced death of cervical cancer cells. Int. J. Gynecol. Cancer 20, 1474–1481.
Sveen, A., Kilpinen, S., Ruusulehto, A., Lothe, R. A., and Skotheim, R. I. (2016). Aberrant RNA splicing in cancer; expression changes and driver mutations of splicing factor genes. Oncogene 35, 2413–2427. doi: 10.1038/onc.2015.318
Svensson, C., Part, K., Kunnis-Beres, K., Kaldmae, M., Fernaeus, S. Z., and Land, T. (2011). Pro-survival effects of JNK and p38 MAPK pathways in LPS-induced activation of BV-2 cells. Biochem. Biophys. Res. Commun. 406, 488–492. doi: 10.1016/j.bbrc.2011.02.083
Thrift, A. P., and El-Serag, H. B. (2020). Burden of gastric cancer. Clin. Gastroenterol. Hepatol. 18, 534–542.
Van Cutsem, E., Bang, Y. J., Feng-Yi, F., Xu, J. M., Lee, K. W., Jiao, S. C., et al. (2015). HER2 screening data from ToGA: targeting HER2 in gastric and gastroesophageal junction cancer. Gastric Cancer 18, 476–484. doi: 10.1007/s10120-014-0402-y
Van Cutsem, E., Sagaert, X., Topal, B., Haustermans, K., and Prenen, H. (2016). Gastric cancer. Lancet 388, 2654–2664.
Volpi, C. C., Pietrantonio, F., Gloghini, A., Fuca, G., Giordano, S., Corso, S., et al. (2019). The landscape of d16HER2 splice variant expression across HER2-positive cancers. Sci. Rep. 9:3545.
Wang, K., Yuen, S. T., Xu, J., Lee, S. P., Yan, H. H., Shi, S. T., et al. (2014). Whole-genome sequencing and comprehensive molecular profiling identify new driver mutations in gastric cancer. Nat. Genet. 46, 573–582. doi: 10.1038/ng.2983
Wang, P., Xiong, Y., Ma, C., Shi, T., and Ma, D. (2010). Molecular cloning and characterization of novel human JNK2 (MAPK9) transcript variants that show different stimulation activities on AP-1. BMB Rep. 43, 738–743. doi: 10.5483/bmbrep.2010.43.11.738
Wang, Z. (2017). ErbB Receptors and Cancer. Methods Mol. Biol. 1652, 3–35. doi: 10.1007/978-1-4939-7219-7_1
Wang, Z. N., Liu, D., Yin, B., Ju, W. Y., Qiu, H. Z., Xiao, Y., et al. (2017). High expression of PTBP1 promote invasion of colorectal cancer by alternative splicing of cortactin. Oncotarget 8, 36185–36202. doi: 10.18632/oncotarget.15873
Wu, Q., Wu, W., Fu, B., Shi, L., Wang, X., and Kuca, K. (2019). JNK signaling in cancer cell survival. Med. Res. Rev. 39, 2082–2104. doi: 10.1002/med.21574
Xia, H., Dong, C., Wu, Q., Gang, W., Zhou, Y., Yi, Z., et al. (2017). CELF1 preferentially binds to exon-intron boundary and regulates alternative splicing in HeLa cells. Biochim. Biophys. Acta 1860, 911–921. doi: 10.1016/j.bbagrm.2017.07.004
Xie, C., Mao, X., Huang, J., Ding, Y., Wu, J., Dong, S., et al. (2011). KOBAS 2.0: a web server for annotation and identification of enriched pathways and diseases. Nucleic Acids Res. 39, 316–322.
Yin, B., Zhang, M., Zeng, Y., Li, Y., Zhang, C., Getzenberg, R. H., et al. (2016). Downregulation of cytokeratin 18 is associated with paclitaxelresistance and tumor aggressiveness in prostate cancer. Int. J. Oncol. 48, 1730–1736. doi: 10.3892/ijo.2016.3396
Zhang, B., Wang, J., Liu, W., Yin, Y., Qian, D., Zhang, H., et al. (2016). Cytokeratin 18 knockdown decreases cell migration and increases chemosensitivity in non-small cell lung cancer. J. Cancer Res. Clin. Oncol. 142, 2479–2487. doi: 10.1007/s00432-016-2253-x
Zhang, H., Chen, X., Wang, J., Guang, W., Han, W., Zhang, H., et al. (2014). EGR1 decreases the malignancy of human non-small cell lung carcinoma by regulating KRT18 expression. Sci. Rep. 4:5416.
Zhang, J., Hu, S., and Li, Y. (2019a). KRT18 is correlated with the malignant status and acts as an oncogene in colorectal cancer. Biosci. Rep. 39:BSR20190884.
Zhang, J., Tang, P. M. K., Zhou, Y., Cheng, A. S. L., Yu, J., Kang, W., et al. (2019b). Targeting the oncogenic FGF-FGFR axis in gastric carcinogenesis. Cells 8:637. doi: 10.3390/cells8060637
Zhao, Y. J., Han, H. Z., Liang, Y., Shi, C. Z., Zhu, Q. C., and Yang, J. (2015). Alternative splicing of VEGFA, APP and NUMB genes in colorectal cancer. World J. Gastroenterol. 21, 6550–6560. doi: 10.3748/wjg.v21.i21.6550
Keywords: KRT18, RNA-Seq, alternative splicing, cell cycle and apoptosis, gastric cancer
Citation: Chen B, Xu X, Lin D-d, Chen X, Xu Y-t, Liu X and Dong W-g (2021) KRT18 Modulates Alternative Splicing of Genes Involved in Proliferation and Apoptosis Processes in Both Gastric Cancer Cells and Clinical Samples. Front. Genet. 12:635429. doi: 10.3389/fgene.2021.635429
Received: 30 November 2020; Accepted: 26 February 2021;
Published: 05 July 2021.
Edited by:
Mohammadreza Hajjari, Shahid Chamran University of Ahvaz, IranReviewed by:
Oscar Gee Wan Wong, The University of Hong Kong, Hong KongBibo Tan, Fourth Hospital of Hebei Medical University, China
Copyright © 2021 Chen, Xu, Lin, Chen, Xu, Liu and Dong. This is an open-access article distributed under the terms of the Creative Commons Attribution License (CC BY). The use, distribution or reproduction in other forums is permitted, provided the original author(s) and the copyright owner(s) are credited and that the original publication in this journal is cited, in accordance with accepted academic practice. No use, distribution or reproduction is permitted which does not comply with these terms.
*Correspondence: Wei-guo Dong, dongweiguo@whu.edu.cn