 Y-h. Taguchi
 Turki Turki
- 1Department of Physics, Chuo University, Tokyo, Japan
- 2Department of Computer Science, King Abdulaziz University, Jeddah, Saudi Arabia
Gene expression profiles of tissues treated with drugs have recently been used to infer clinical outcomes. Although this method is often successful from the application point of view, gene expression altered by drugs is rarely analyzed in detail, because of the extremely large number of genes involved. Here, we applied tensor decomposition (TD)-based unsupervised feature extraction (FE) to the gene expression profiles of 24 mouse tissues treated with 15 drugs. TD-based unsupervised FE enabled identification of the common effects of 15 drugs including an interesting universal feature: these drugs affect genes in a gene-group-wide manner and were dependent on three tissue types (neuronal, muscular, and gastroenterological). For each tissue group, TD-based unsupervised FE enabled identification of a few tens to a few hundreds of genes affected by the drug treatment. These genes are distinctly expressed between drug treatments and controls as well as between tissues in individual tissue groups and other tissues. We also validated the assignment of genes to individual tissue groups using multiple enrichment analyses. We conclude that TD-based unsupervised FE is a promising method for integrated analysis of gene expression profiles from multiple tissues treated with multiple drugs in a completely unsupervised manner.
Background
Drug design is a time-consuming and expensive process. Multiple coordinated experimental efforts, involving large-scale trial-and-error methods, are required to investigate new compounds. In general, this is due to the inherent difficulties in identifying novel therapeutic targets such as genes that cause disease. Even where potential target genes are identified robustly, it is difficult to find drug candidate compounds that successfully bind to the proteins they encode.
Computer-based methods have been introduced in an attempt to shorten the period of drug development and to reduce the expenses involved. The two major computer-aided drug design strategies are ligand-based drug design (LBDD) and structure-based drug design (SBDD). LBDD has various advantages including less required computational resources and better success rates for drug design. However, it also has the disadvantage of limited ability to find drug candidate compounds with low structural similarity to known drugs. To compensate for the weaknesses of LBDD, SBDD shows a greater ability to find drug candidate compounds lacking in structural similarity with known drugs. This is because SBDD tries to screen drug candidate compounds by investigating whether these can bind to target proteins. The weak point of SBDD is that it requires massive computational resources, and this prevents its application to large-scale screening, in which candidate drug compounds often number several million.
Considering the relatively low cost of obtaining gene expression profiles, a third computer-aided strategy has been proposed: gene expression profile-based drug design. In this strategy, the gene expression profiles of tissues/cell lines treated with candidate drug compounds are collected. The collected profiles are then compared with those of tissues/cell lines treated with known drug compounds. If the candidate drug compounds share a gene expression profile to some extent with known drug compounds, they are identified as having therapeutic potential against target diseases/proteins.
Some databases have been established to assist gene expression profiling for drug design. For example, chemical checker (Duran-Frigola et al., 2020) includes gene expression in computer-aided drug design, whereas PharmacoDB (Smirnov et al., 2017) is fully implemented to consider the dose dependence of drug-treated cell lines for drug design. Many papers have been published on the use of gene expression profiles for computer-aided drug design (Chengalvala et al., 2007; Bates, 2011). For instance, Huang et al. (2019) used combinatorial analysis of drug-induced gene expression for cancer drugs, which were then experimentally confirmed in vitro. Lee et al. (2017) proposed DeSigN, a robust and useful method for identifying candidate drugs using an input gene signature obtained from gene expression analysis. Kim et al. (2019) performed computational drug repositioning for gastric cancer using reversal of gene expression profiles, and De Wolf et al. (2018) analyzed high-throughput gene expression profiles to identify similarities between drugs and to predict compound activity. Hodos et al. (2017) tried to fill in missing gene expression observations in cells treated with drugs by predicting cell-specific drug perturbation profiles using available expression data from related conditions. Pabon et al. (2018) predicted protein targets for drug-like compounds using transcriptomics. In contrast, Liu et al. (2017) performed comparative analysis of genes that are frequently regulated by drugs based on connectivity to map transcriptome data.
In contrast to these successful applications of gene expression profile analysis to computer-aided drug design, it is unclear how individual gene expression is affected by drug treatment. First, the number of genes expressed in a dose dependent-manner is as large as the number of genes expressed. Thus, it is not easy to invent a useful method to integrate and understand the dose dependent-genes pertaining to individual gene expression profiles. For example, Lukačišin and Bollenbach (2019) employed principal component analysis (PCA) to integrate the dose dependence of gene expression profiles upon combinatorial drug treatment. They reported a convex (not monotonic) dependence on dose density and identified this as evidence of the cooperative effects of dual drug treatments. Nevertheless, convex dependence on dose was reportedly observed in a single drug treatment if tensor decomposition (TD) was employed to integrate multiple gene expression profiles of cell lines treated with a single drug (Taguchi, 2019). Thus, it is primarily important to identify an effective method that can integrate numerous gene expression profiles of tissues/cell lines treated with drugs.
Recently, Kozawa et al. (2020) used the gene expression profiles of mouse tissues treated with drugs to predict human clinical outcomes. In this paper, we applied TD-based unsupervised feature extraction (FE) to the gene expression profiles used in their study and attempted to identify the changes in gene expression profiles of mouse tissues treated with individual drugs.
Methods and Materials
Figure 1 shows the flow chart of analysis.

Figure 1. Schematic of the analysis performed in this study.
Gene Expression Profiles
The gene expression profiles used in this study were downloaded from the gene expression omnibus (GEO) with GEO ID GSE142068. Twenty four profiles named “GSE142068_count_XXXXX.txt.gz” were downloaded, where “XXXXX” indicates one of the 24 tissues, i.e., AdrenalG, Aorta, BM (Bone marrow), Brain, Colon, Eye, Heart, Ileum, Jejunum, Kidney, Liver, Lung, Pancreas, ParotidG, PituitaryG, SkMuscle, Skin, Skull, Spleen, Stomach, Spleen, Thymus, ThyroidG, and WAT (white adipose tissue), which were treated with 15 drugs: Alendronate, Acetaminophen, Aripiprazole, Asenapine, Cisplatin, Clozapine, Clozapine, Empagliflozin, Lenalidomide, Lurasidone, Olanzapine, Evolocumab, Risedronate, Sofosbuvir, and Teriparatide, and Wild type (WT).
TD-Based Unsupervised FE
For applying TD-based unsupervised FE (Taguchi, 2020) to the downloaded gene expression profiles, they must be formatted as a tensor. In this analysis, they were formatted as tensor, , for N genes, 24 tissues, 18 drug treatments, and two replicates. Then, the HOSVD (Taguchi, 2020) algorithm was applied to xijkm and we obtained TD
where G ∈ ℝN× 24 × 18 × 2 is the core tensor, , ,, and , represents singular value matrices that are also orthogonal matrices. xijkm is considered to be standardized as and .
Mathematically, Equation (1) aims to decompose the dependence of xijkm upon i, j, k, m into a series of products among uℓ1j, uℓ2k, uℓ3m, and uℓ4i, each of which is supposed to represent the dependence on i, j, k, m. As it is unlikely that a single product of uℓ1j, uℓ2k, uℓ3m, and uℓ4i can reproduce xijkm, we need to consider various combinations of uℓ1j, uℓ2k, uℓ3m, and uℓ4i, where those associated with distinct ℓ1, ℓ2, ℓ3, ℓ4 are supposed to be associated with distinct dependence on i, j, k, m. Then, the products of uℓ1j, uℓ2k, uℓ3m, and uℓ4i, must be summed up with the weight of G to reproduce xijkm. Biologically, we cannot expect that uℓ1j, uℓ2k, uℓ3m, and uℓ4i can represent the biological aspect because Equation (1) is simply a mathematical hypothesis; therefore, their association with a biological aspect after performing TD needs to be validated.
To understand how gene expression profiles are altered by drug treatment in a tissue-group-wide manner, we first need to investigate uℓ1j, uℓ2k, and uℓ3m. After identifying which ℓ1, ℓ2, and ℓ3 are biologically interesting, we select ℓ4 associated with G(ℓ1, ℓ2, ℓ3, ℓ4) that have the largest absolute values with fixed ℓ1, ℓ2, and ℓ3, because uℓ4i associated with such ℓ4 is supposed to represent the weight of gene i that is expressed in association with j, k, m dependence represented by the selected uℓ1j, uℓ2k, uℓ3m.
Using the identified uℓ4i, the P-value, Pi, is attributed to gene i as
where is the cumulative probability of χ2 distribution and σℓ4 is the standard deviation. Here, we assume that uℓ4i obeys a Gaussian distribution with zero mean because . Pi is corrected via the BH criterion (Burgos et al., 2014) and I, a set of genes i associated with adjusted P-values less than 0.01, is selected. For a more detailed explanation of TD-based unsupervised FE, see the recently published monograph (Taguchi, 2020).
t-Test and Wilcoxon Test Applied to Sets of Genes Classified Based on Tissue Groups and Drugs Groups
In order to determine whether the selected set of genes, I, are expressed distinctly between the two assigned tissue groups, J, {xijkm|i ∈ I, j ∈ J}, and , , we applied a two-way t test and Wilcoxon test and computed the P-values. Similar analyses were done with two drug groups, K, {xijkm|i ∈ I, k ∈ K}, and , .
Enrichment Analysis
The selected genes (gene symbols) were uploaded to Enrichr (Kuleshov et al., 2016) and Metascape (Zhou et al., 2019) in order to validate the various biological functions of the selected genes.
Results
Figure 2 summarizes the results obtained in this study.
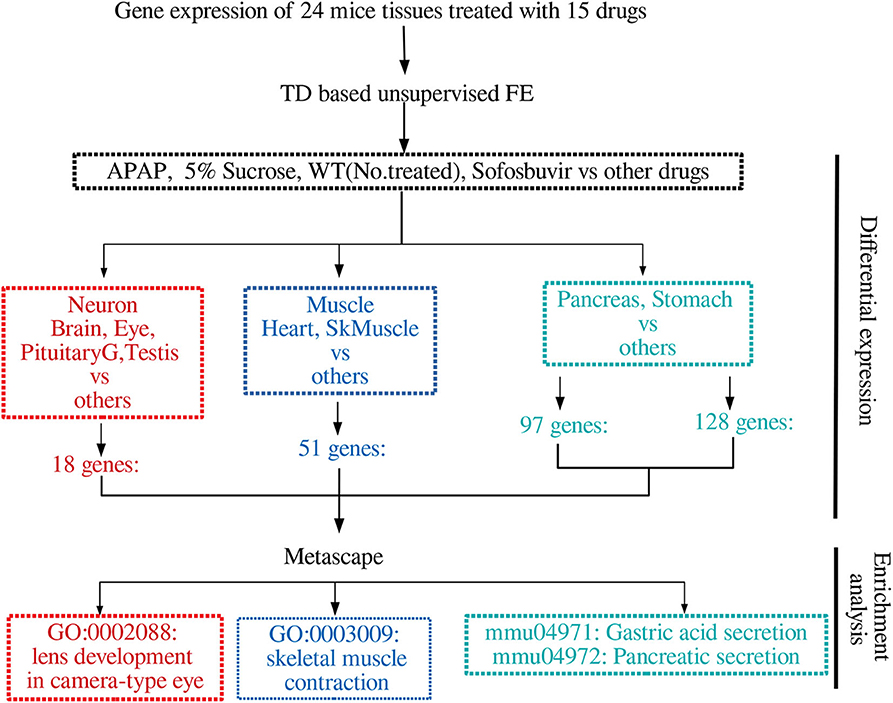
Figure 2. Summary of the results obtained in this study.
Drug Treatment Specificity
After obtaining the TD, Equation (1), we first investigated uℓ2k attributed to the kth drug. Although the number of drugs tested is as many as 15, the total number of drug treatments was considered to be 18 due to the testing of three additional conditions. Usually, the first singular value vectors represent uniform values (i.e., components that are not distinct between samples) (Taguchi, 2020). In this case, u1k does not represent any dependence on drug treatment. This is reasonable because the expression of most genes is unlikely to be affected by drug treatment. We thus considered the second and third singular value vectors, u2k and u3k, attributed to drug treatments (Figure 3). In contrast to expectations, the drug treatments were quite universal. Most of the drug treatments [other than (2), (9), (15), and (17)] were separated from the control treatments [(2), (9), (15), and (17)] along one direction (red arrow) whereas the diversity among drug treatments was spread perpendicular (blue arrow) to that direction, only among drug treatments. This suggests that the gene expression profiles are altered similarly, independently of the drug treatment.
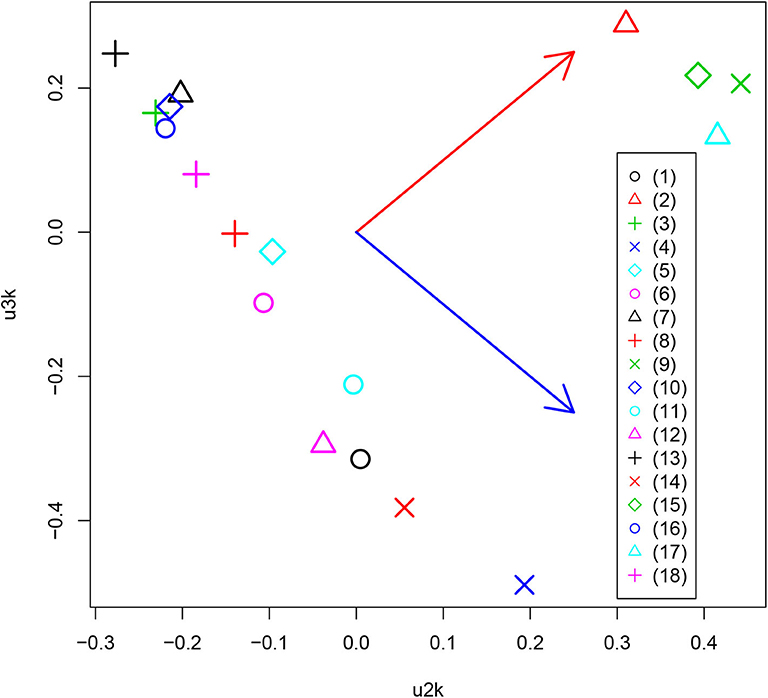
Figure 3. Scatter plot between u2k and u3k attributed to drug treatment. Red and blue arrows represent distinct controls and drug treatments, and diversity among drug treatments, respectively. (1) Alendronate, (2) APAP, (3) Aripiprazole, (4) Asenapine, (5) Cisplatin, (6) Clozapine, (7) Dox, (8) EMPA, (9) FivePercentSucrose, (10) Lenalidomide, (11) Lurasidone, (12) Olanzapine, (13) Repatha, (14) Risedronate, (15) Sofosbuvir, (16) Teriparatide, (17) WT.No.treated, (18) 5percentCMC0.25percentTween80.
Tissue-Specificity
We further studied the relationship of universal drug treatments with individual tissues. For this, we next investigated uℓ1j attributed to 24 tissues. We then found that several uℓ1j are expressed in a tissue-group wide manner (Figure 4). The tissue-wide expression pattern identified by singular value vectors is described as follows; As u1j does not express any tissue specificities, it is unlikely to exhibit tissue specificity; as u2j has larger absolute values for the brain, eye, pituitary, and testis, it is likely to represent neuronal tissue specificities; as u3j has larger absolute values only for the parotid, we did not consider it further; as u4j exhibits larger absolute values for the heart and SkMuscle, we considered that it exhibits muscle specificities; As u5j and u6j exhibit larger absolute values for the pancreas and stomach, we considered that it exhibits gastric tissue specificities. It is thus obvious that the combination of tissue specificity is quite reasonable biologically.
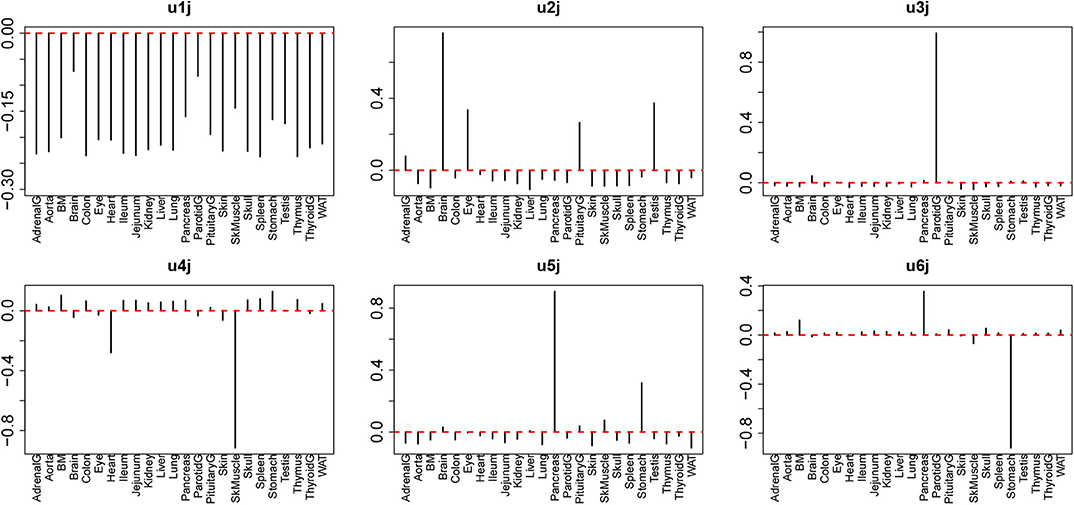
Figure 4. Singular value vectors, uℓ1j, attributed to tissues. u1j: no tissue specificity. u2j: Brain Eye, Pituitary, and Testis, thus mostly neuron-specific. u3j: Parotid-specific, u4j: Heart and SkMuscle, thus muscle-specific, u5j and u6j: stomach and pancreas, thus, gastrointestinal-specific.
Aiming to specify singular value vectors attributed to genes, uℓ4i, for gene selection, we then checked which of G(ℓ1, 2, 1, ℓ4) and G(ℓ1, 3, 1, ℓ4) have larger absolute values, as u1m always exhibits the same values between two replicates (Table 1).
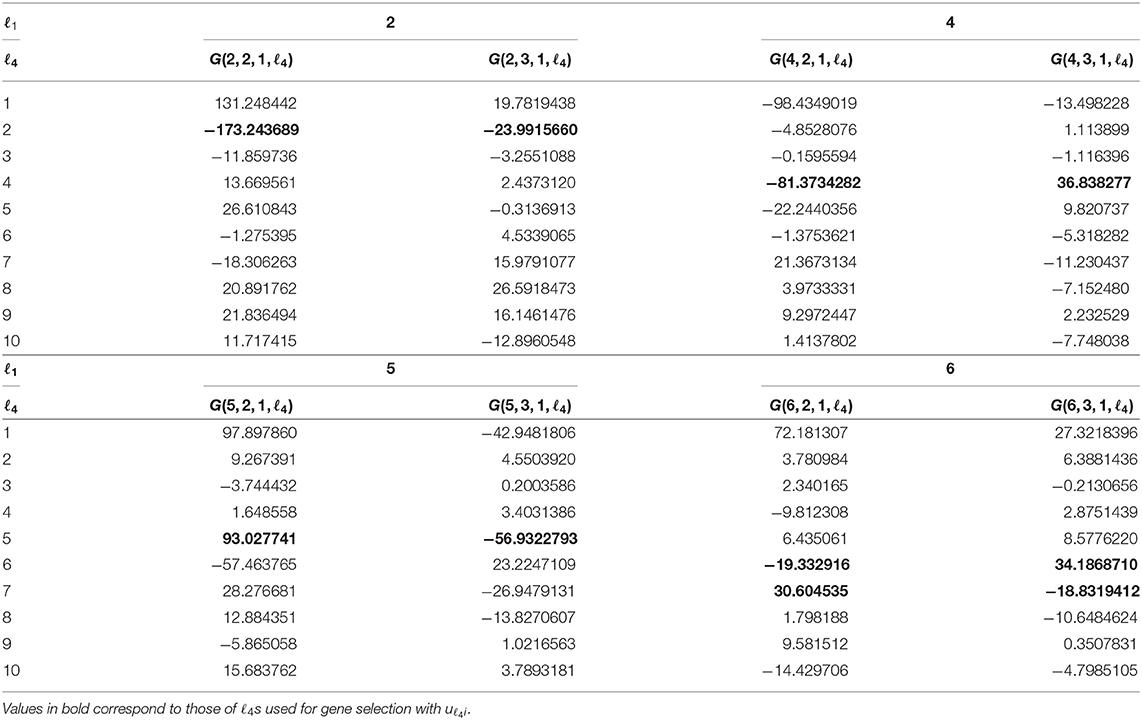
Table 1. G(ℓ1, 2, 1, ℓ4) and G(ℓ1, 3, 1, ℓ4) for ℓ1 = 2, 4, 5, 6.
For ℓ1 = 2, which is supposed to be attributed to neuron-specific tissues (u2j), Gs with ℓ4 = 2 have larger absolute values. Thus, u2i was employed for neuron-specific gene selection. For ℓ1 = 4, which is supposed to be attributed to muscle-specific tissues (u4j), Gs with ℓ4 = 4 have larger absolute values. Thus, u4i was employed for muscle-specific gene selection. For ℓ1 = 5, which is supposed to be attributed to gastrointestinal-specific tissues (u5j), Gs with ℓ4 = 5 have larger absolute values. Thus, u5i was employed for muscle-specific gene selection. For ℓ1 = 6, which is also supposed to be attributed to gastrointestinal-specific tissues (u6j), Gs with ℓ4 = 6, 7 have larger absolute values. Then, u6i and u7i were employed for muscle-specific gene selection.
After computing the adjusted P-values, Pi, attributed to the genes (see methods), the genes associated with adjusted Pi < 0.01 were selected (Table 2). The lists of selected genes can be found in supporting information (Additional File 1). Figure 5 shows a Venn diagram of the selected genes. As expected, two sets of genes, Gas1 and Gas2, which are supposed to be gastrointestinal-specific, are quite common. Other than these, the selected genes are quite distinct from one another. Thus, TD-based unsupervised FE successfully identified the genes whose expression was affected by the drugs in a tissue group-specific manner.
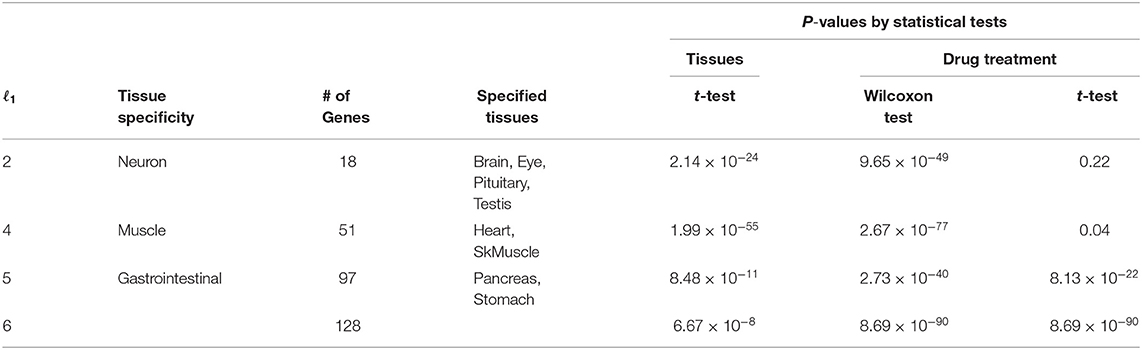
Table 2. Statistical tests for distinct expression between the specified tissues and other tissues, and between drug treatments and controls.
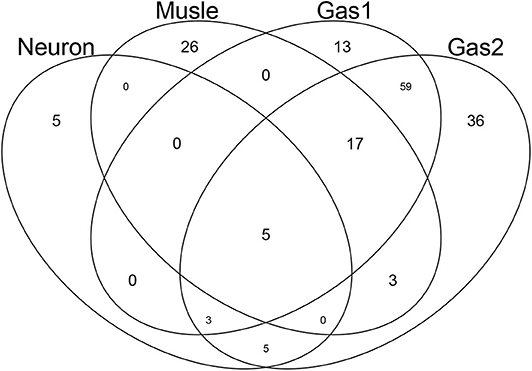
Figure 5. Venn diagram of genes selected by TD-based unsupervised FE. Neuron: genes associated with u2j, which is supposed to be neuron-specific. Muscle: genes associated with u4j, which is supposed to be muscle-specific. Gas1 and Gas2: genes associated with u5j and u6j, respectively, which are supposed to be gastrointestinal-specific.
Confirmation of Differential Expression
In order to check whether the selected genes are expressed distinctly between the specified tissues and other tissues, as well as between drug treatments and controls, we first applied statistical tests to the selected genes (Table 2). The data clearly showed that for all cases, gene expression was distinct between the specified tissues and other tissues as well as between drug treatments and controls. Thus, TD-based unsupervised FE allowed us to select the genes whose expression is coincident with uℓ2ks in Figure 3 and uℓ1js in Figure 4.
Biological Evaluation
Next, we evaluated the selected genes biologically. For this purpose, we first uploaded the genes to Metascape (Figure 6). Initially, we noticed that Gas1 and Gas2 largely shared the enriched terms as expected, even though these two gene sets were selected using distinct singular values (u5i and u6i, u7i, respectively). In particular, it is important to note that two KEGG terms, “mmu04971: Gastric acid secretion” and “mmu04972: Pancreatic secretion” are shared by Gas1 and Gas2, which are supposed to be Pancreas- and Stomach-specific. In contrast, various muscle-related terms are enriched in the Muscle gene set as expected, whereas “GO:0002088: lens development in camera-type eye” is enriched in the neuronal gene set. All of these results suggest that TD-based unsupervised FE selected the biologically reasonable genes.
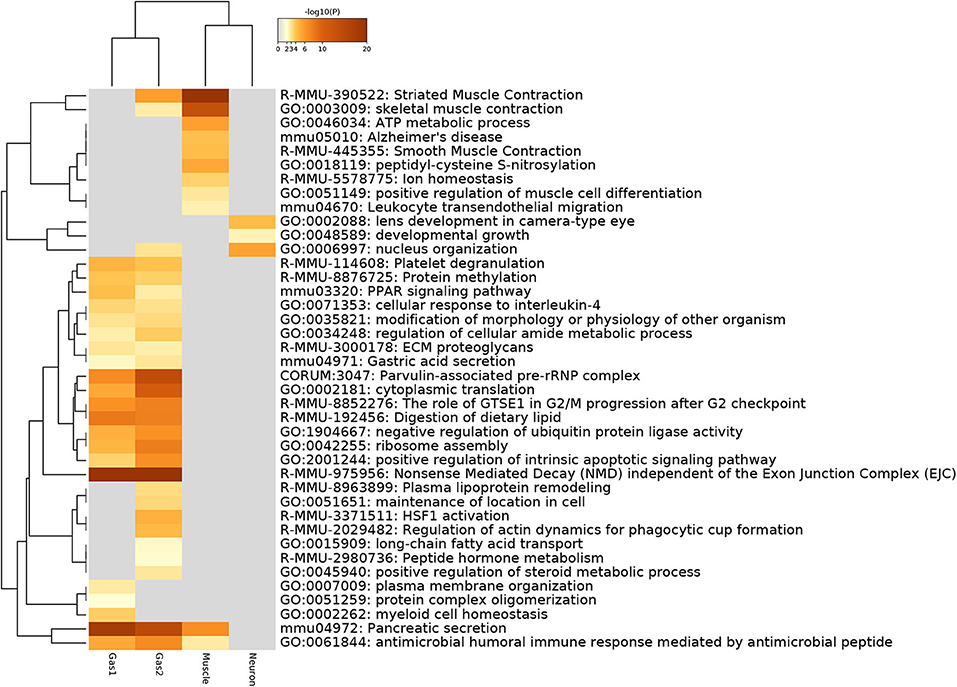
Figure 6. Heatmap of enrichment analysis provided by Metascape.
Figure 7 shows the protein-protein interaction (PPI) network provided by Metascape. A high degree of connectivity was obvious. Thus, TD-based unsupervised FE identified the sets of genes among which PPI is enriched. Moreover, Gas1 and Gas2 largely share the PPI network, whereas the neuronal and muscular gene sets form their own PPI network within which PPI is enriched. Thus, PPI analysis also indicated that TD-based unsupervised FE identified biologically reasonable genes.
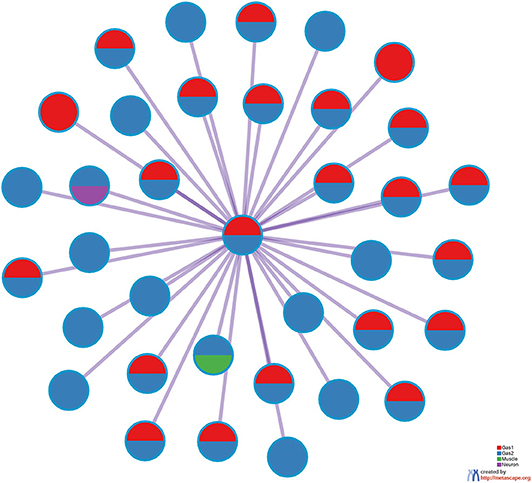
Figure 7. PPI network provided by Metascape. Red: Gas1, Blue: Gas2, Green: Muscle, Purple: Neuron.
To eliminate the possibility that our results were specific to the Metascape data set, we uploaded the genes selected by TD-based unsupervised FE to Enrichr (Table 3). With this data set, we observed clear detection of at least one tissue-related disease for four sets of tissue-specific genes, validating the Metascape-based results.
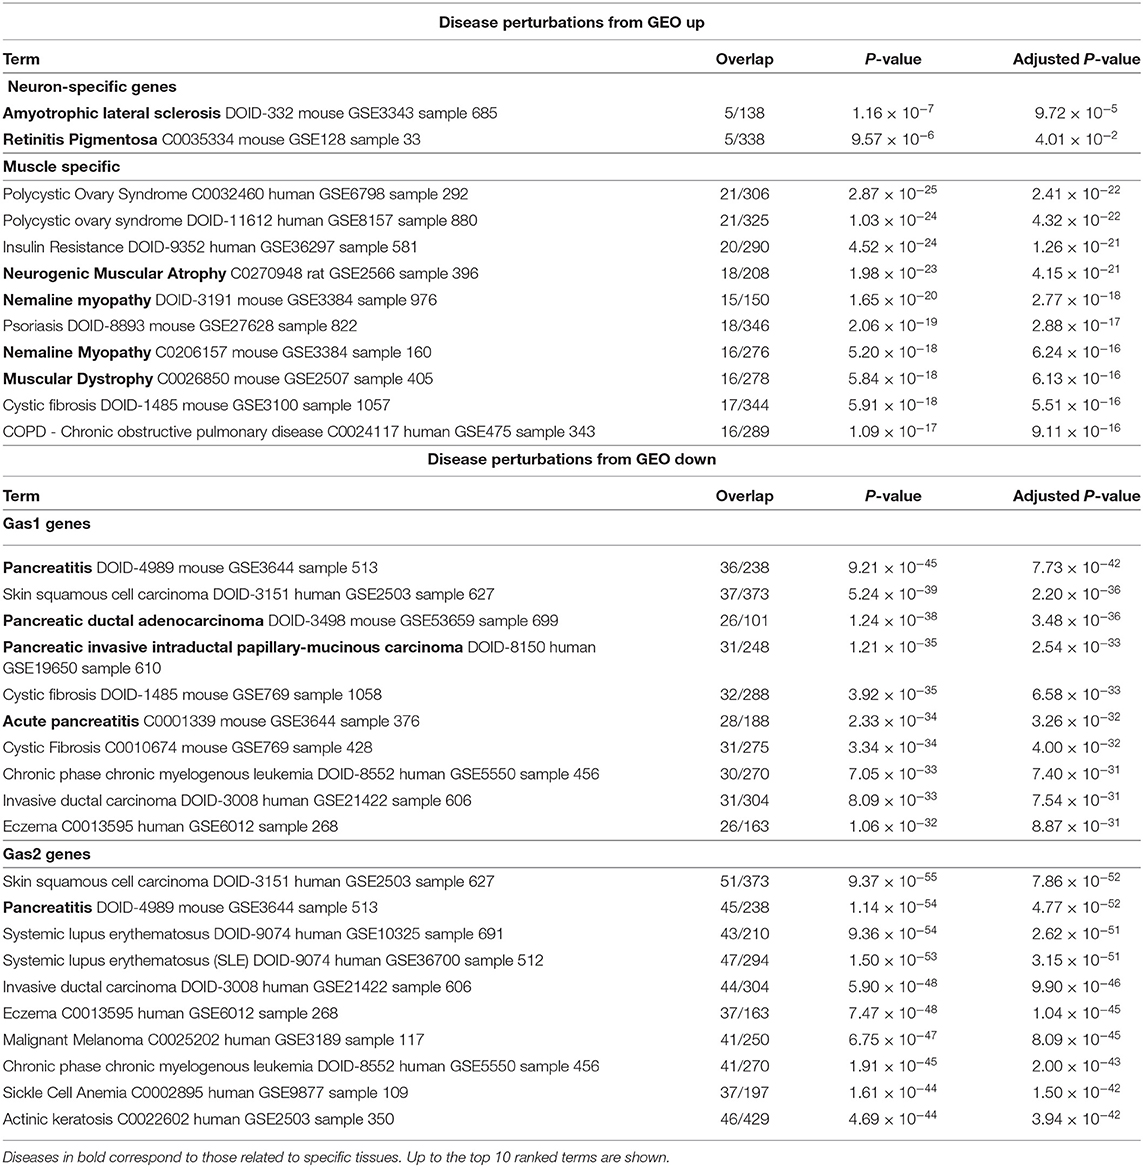
Table 3. Enrichment analysis for “Disease Perturbations from GEO up” and “Disease Perturbations from GEO down” by Enrichr.
Discussion
Although it is unclear why the 15 drugs affected the expression of many common genes, a detailed investigation can allow further interpretation. Table 4 shows the drugs' effects on neuronal, muscular, and pancreatic tissues. These data suggest that most drugs simultaneously affect these three groups of tissues.
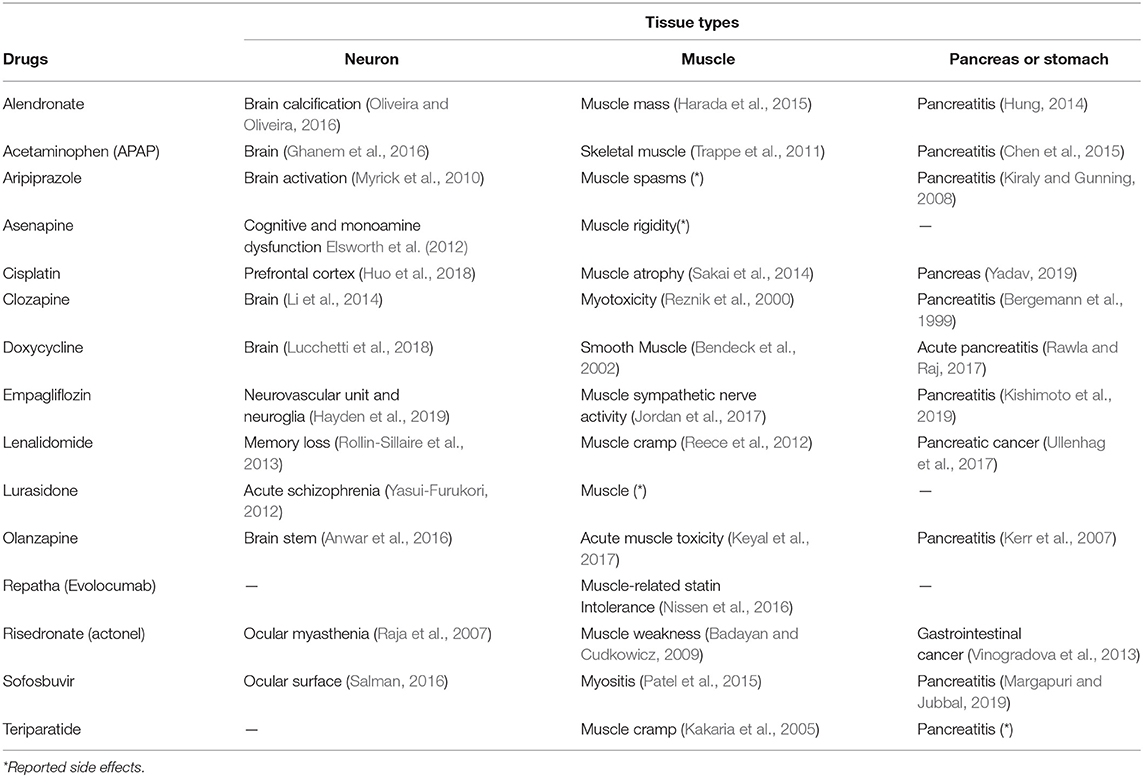
Table 4. Previously reported drug effects on neuron (brain and eye), muscle and pancreas tissues.
Our results are in contrast to the study that inspired our work (Kozawa et al., 2020), in which the authors employed a fully supervised approach requiring previous knowledge. Although Kozawa et al. (2020) also aimed to infer the therapeutic and side effects of drug treatments in humans based on gene expression in drug-treated tissues, their analysis required previous knowledge that is not needed for TD-based unsupervised FE. In this sense, our approach has distinct potential that the original study could not achieve.
In addition to the above-mentioned biological superiority of TD-based unsupervised FE, this approach also has some methodological advantages as follows. First, although we classified 24 tissues into two groups based on the observation of singular value vectors attributed to tissues, uℓ1j (Figure 4) prior to the identification of differentially expressed genes, it is computationally infeasible for other methods to classify 24 tissues into two groups before starting to seek differentially expressed genes, as there are no criteria on how to divide 24 tissues into two groups. It is thus practically impossible to analyze all possible divisions, as they number in the millions. The same advantage is observed when grouping 18 drug treatments into two. This may be much easier than classifying tissues, because some of the drug treatments are obviously controls. Nevertheless, based upon the second and third singular value vectors attributed to drug treatments, u2k and u3k (Figure 3), acetaminophen (APAP) and sofosbuvir are grouped together with two control treatments. Such a classification can never be proposed without TD. In this sense, there is no computationally feasible method that can compete with our method.
The biological basis for the two groups of drugs seen in Figure 3 may be questioned. To clarify this point, we uploaded two groups of drugs to DrugEnrichr (Kuleshov et al., 2020), which evaluates the coincidence of genes targeted by the uploaded drugs (Additional File 2). Based on the “Geneshot Predicted from Co-expression” category in DrugEnrichr, we found that there are at least as many as 164 genes targeted by two drugs (APAP and Sofosbuvir) in group1 whereas 213 genes are targeted by at least two drugs among as many as 13 drugs included in group2 (Alendronate, Aripiprazole, Asenapine, Cisplatin, Clozapine, Dox, EMPA, Lenalidomide, Lurasidone, Olanzapine, Repatha, Risedronate, Teriparatide). This suggests that these two groups of drugs are quite distinct because there are no common targeted genes between these 164 and 213 genes. Thus, the groups of drugs identified by TD based unsupervised FE are likely based on the genes that the drugs target.
In view of the two above-mentioned advantages, TD-based unsupervised FE might yield completely distinct outcomes that other supervised methods cannot, and it therefore represents a worthwhile primary or supplementary approach to gene-expression-based investigation of drug effects.
One might wonder if the results were confirmed only by single experiments. As the results shown in Table 3 indicate coincidence between the present result and other studies, the results derived in this study are not dependent on a single study, but are coincident with numerous studies in the public domain database.
Moreover, TD-based unsupervised FE is a very useful strategy for repositioning known drugs. As shown in Figure 3, TD-based unsupervised FE can determine the effective tissue. Furthermore, as indicated in Table 3, the genes selected by TD-based unsupervised FE can indicate the diseases for which the drugs have potential effectiveness. Therefore, applying TD-based unsupervised FE to gene expression profiles altered by drug treatments can be a promising strategy to repurpose known drugs for new diseases.
Conclusions
In this paper, we applied TD-based unsupervised FE (Taguchi, 2020) to the gene expression profiles of 24 mouse tissues treated with 15 drugs. Integrated analysis allowed us to identify the universal nature of drug treatments in a tissue-group-wide manner, which is generally impossible to identify using any other supervised strategy that requires prior information.
Data Availability Statement
All datasets analyzed in this study were obtained from GEO: GSE142068.
Author Contributions
Y-hT planned and performed the study. Y-hT and TT discussed the results and wrote the paper. All authors contributed to the article and approved the submitted version.
Funding
This study was supported by KAKENHI 19H05270, 20K12067, and 20H04848. This project was also funded by the Deanship of Scientific Research (DSR) at King Abdulaziz University, Jeddah, under grant no. KEP-8-611-38. The authors, therefore, acknowledge DSR with thanks for providing technical and financial support.
Conflict of Interest
The authors declare that the research was conducted in the absence of any commercial or financial relationships that could be construed as a potential conflict of interest.
Acknowledgments
The authors would like to thank the reviewers for very constructive comments and thoughtful suggestions. This manuscript has been released as a pre-print at BioRxiv (Taguchi and Turki, 2020).
Supplementary Material
The Supplementary Material for this article can be found online at: https://www.frontiersin.org/articles/10.3389/fgene.2020.00695/full#supplementary-material
Additional File 1. List of genes selected by TD-based unsupervised FE. List of genes shown in Table 2 (xlsx).
Additional File 2. List of genes predicted by DrugEnrichr, whose expression is likely affected by the drugs investigated in this study. List of genes (xlsx).
References
Anwar, I. J., Miyata, K., and Zsombok, A. (2016). Brain stem as a target site for the metabolic side effects of olanzapine. J. Neurophysiol. 115, 1389–1398. doi: 10.1152/jn.00387.2015
Badayan, I., and Cudkowicz, M. E. (2009). Profound muscle weakness and pain after one dose of Actonel. Case Rep. Med. 2009:693014. doi: 10.1155/2009/693014
Bates, S. (2011). The role of gene expression profiling in drug discovery. Curr. Opin. Pharmacol. 11, 549–556. doi: 10.1016/j.coph.2011.06.009
Bendeck, M. P., Conte, M., Zhang, M., Nili, N., Strauss, B. H., and Farwell, S. M. (2002). Doxycycline modulates smooth muscle cell growth, migration, and matrix remodeling after arterial injury. Am. J. Pathol. 160, 1089–1095. doi: 10.1016/S0002-9440(10)64929-2
Bergemann, N., Ehrig, C., Diebold, K., Mundt, C., and Einsiedel, R. (1999). Asymptomatic pancreatitis associated with clozapine. Pharmacopsychiatry 32, 78–80. doi: 10.1055/s-2007-979197
Burgos, K., Malenica, I., Metpally, R., Courtright, A., Rakela, B., Beach, T., et al. (2014). Profiles of extracellular miRNA in cerebrospinal fluid and serum from patients with Alzheimer's and Parkinson's diseases correlate with disease status and features of pathology. PLoS ONE 9:e94839. doi: 10.1371/journal.pone.0094839
Chen, S.-J., Lin, C.-S., Hsu, C.-W., Lin, C.-L., and Kao, C.-H. (2015). Acetaminophen poisoning and risk of acute pancreatitis. Medicine 94:e1195. doi: 10.1097/MD.0000000000001195
Chengalvala, M. V., Chennathukuzhi, V. M., Johnston, D. S., Stevis, P. E., and Kopf, G. S. (2007). Gene expression profiling and its practice in drug development. Curr. Genomics 8, 262–270. doi: 10.2174/138920207781386942
De Wolf, H., Cougnaud, L., Van Hoorde, K., De Bondt, A., Wegner, J. K., Ceulemans, H., et al. (2018). High-throughput gene expression profiles to define drug similarity and predict compound activity. ASSAY Drug Dev. Technol. 16, 162–176. doi: 10.1089/adt.2018.845
Duran-Frigola, M., Pauls, E., Guitart-Pla, O., Bertoni, M., Alcalde, V., Amat, D., et al. (2020). Extending the small molecule similarity principle to all levels of biology with the Chemical Checker. Nat. Biotechnol. 34:591. doi: 10.1038/s41587-020-0564-6
Elsworth, J. D., Groman, S. M., Jentsch, J. D., Valles, R., Shahid, M., Wong, E., et al. (2012). Asenapine effects on cognitive and monoamine dysfunction elicited by subchronic phencyclidine administration. Neuropharmacology 62, 1442–1452. doi: 10.1016/j.neuropharm.2011.08.026
Ghanem, C. I., Pérez, M. J., Manautou, J., and Mottino, A. D. (2016). Acetaminophen from liver to brain: new insights into drug pharmacological action and toxicity. Pharmacol. Res. 109, 119–131. doi: 10.1016/j.phrs.2016.02.020
Harada, A., Ito, S., Matsui, Y., Sakai, Y., Takemura, M., Tokuda, H., et al. (2015). Effect of alendronate on muscle mass: Investigation in patients with osteoporosis. Osteopor. Sarcopen. 1, 53–58. doi: 10.1016/j.afos.2015.07.005
Hayden, M. R., Grant, D. G., Aroor, A. R., and DeMarco, V. G. (2019). Empagliflozin ameliorates type 2 diabetes-induced ultrastructural remodeling of the neurovascular unit and neuroglia in the female db/db mouse. Brain Sci. 9:57. doi: 10.3390/brainsci9030057
Hodos, R., Zhang, P., Lee, H.-C., Duan, Q., Wang, Z., Clark, N. R., et al. (2017). “Cell-specific prediction and application of drug-induced gene expression profiles,” in Biocomputing 2018, eds R. B. Altman, A. K. Dunker, L. Hunter, M.D. Ritchie, T. Murray, and T. E. Klein (Kohala Coast, HI: World Scientific), 32–43.
Huang, C.-T., Hsieh, C.-H., Chung, Y.-H., Oyang, Y.-J., Huang, H.-C., and Juan, H.-F. (2019). Perturbational gene-expression signatures for combinatorial drug discovery. iScience 15, 291–306. doi: 10.1016/j.isci.2019.04.039
Hung, W. Y. (2014). Contemporary review of drug-induced pancreatitis: A different perspective. World J. Gastrointest. Pathophysiol. 5:405. doi: 10.4291/wjgp.v5.i4.405
Huo, X., Reyes, T. M., Heijnen, C. J., and Kavelaars, A. (2018). Cisplatin treatment induces attention deficits and impairs synaptic integrity in the prefrontal cortex in mice. Sci. Rep. 8:17400. doi: 10.1038/s41598-018-35919-x
Jordan, J., Tank, J., Heusser, K., Heise, T., Wanner, C., Heer, M., et al. (2017). The effect of empagliflozin on muscle sympathetic nerve activity in patients with type II diabetes mellitus. J. Am. Soc. Hypertens. 11, 604–612. doi: 10.1016/j.jash.2017.07.005
Kakaria, P. J., Nashel, D. J., and Nylen, E. S. (2005). Debilitating muscle cramps after teriparatide therapy. Ann. Intern. Med. 142:310. doi: 10.7326/0003-4819-142-4-200502150-00023
Kerr, T. A., Jonnalagadda, S., Prakash, C., and Azar, R. (2007). Pancreatitis following olanzapine therapy: a report of three cases. Case Rep. Gastroenterol. 1, 15–20. doi: 10.1159/000104222
Keyal, N., Shrestha, G., Pradhan, S., Maharjan, R., Acharya, S., and Marhatta, M. (2017). Olanzapine overdose presenting with acute muscle toxicity. Int. J. Crit. Illness Inj. Sci. 7, 69–71. doi: 10.4103/2229-5151.201962
Kim, I.-W., Jang, H., Kim, J. H., Kim, M. G., Kim, S., and Oh, J. M. (2019). Computational drug repositioning for gastric cancer using reversal gene expression profiles. Sci. Rep. 9:2660. doi: 10.1038/s41598-019-39228-9
Kiraly, B., and Gunning, K. (2008). A case of pancreatitis associated with aripiprazole in the absence of hyperglycemia. Prim. Care Compan. J. Clin. Psychiatry 10, 484–485. doi: 10.4088/PCC.v10n0612e
Kishimoto, M., Yamaoki, K., and Adachi, M. (2019). Combination therapy with empagliflozin and insulin results in successful glycemic control: A case report of uncontrolled diabetes caused by autoimmune pancreatitis and subsequent steroid treatment. Case Rep. Endocrinol. 2019:9415347. doi: 10.1155/2019/9415347
Kozawa, S., Sagawa, F., Endo, S., Almeida, G. M. D., Mitsuishi, Y., and Sato, T. N. (2020). Predicting human clinical outcomes using mouse multi-organ transcriptome. iScience 23:100791. doi: 10.1016/j.isci.2019.100791
Kuleshov, M., Kropiwnicki, E., and Ma'ayan, A. (2020). Drugenrichr. Available online at: https://amp.pharm.mssm.edu/DrugEnrichr/
Kuleshov, M. V., Jones, M. R., Rouillard, A. D., Fernandez, N. F., Duan, Q., Wang, Z., et al. (2016). Enrichr: a comprehensive gene set enrichment analysis web server 2016 update. Nucleic Acids Res. 44, W90–W97. doi: 10.1093/nar/gkw377
Lee, B. K. B., Tiong, K. H., Chang, J. K., Liew, C. S., Rahman, Z. A. A., Tan, A. C., et al. (2017). DeSigN: connecting gene expression with therapeutics for drug repurposing and development. BMC Genomics 18:934. doi: 10.1186/s12864-016-3260-7
Li, C. H., Stratford, R. E., de Mendizabal, N. V., Cremers, T. I., Pollock, B. G., Mulsant, B. H., et al. (2014). Prediction of brain clozapine and norclozapine concentrations in humans from a scaled pharmacokinetic model for rat brain and plasma pharmacokinetics. J. Transl. Med. 12:203. doi: 10.1186/1479-5876-12-203
Liu, X., Zeng, P., Cui, Q., and Zhou, Y. (2017). Comparative analysis of genes frequently regulated by drugs based on connectivity map transcriptome data. PLoS ONE 12:e179037. doi: 10.1371/journal.pone.0179037
Lucchetti, J., Fracasso, C., Balducci, C., Passoni, A., Forloni, G., Salmona, M., et al. (2018). Plasma and brain concentrations of doxycycline after single and repeated doses in wild-type and APP23 mice. J. Pharmacol. Exp. Therap. 368, 32–40. doi: 10.1124/jpet.118.252064
Lukačišin, M., and Bollenbach, T. (2019). Emergent gene expression responses to drug combinations predict higher-order drug interactions. Cell Syst. 9, 423–433.e3. doi: 10.1016/j.cels.2019.10.004
Margapuri, J., and Jubbal, S. (2019). 902: Acute pancreatitis following treatment with ledipasvir/sofosbuvir for hepatitis virus infection. Crit. Care Med. 47:430. doi: 10.1097/01.ccm.0000551651.45733.80
Myrick, H., Li, X., Randall, P. K., Henderson, S., Voronin, K., and Anton, R. F. (2010). The effect of aripiprazole on cue-induced brain activation and drinking parameters in alcoholics. J. Clin. Psychopharmacol. 30, 365–372. doi: 10.1097/JCP.0b013e3181e75cff
Nissen, S. E., Stroes, E., Dent-Acosta, R. E., Rosenson, R. S., Lehman, S. J., Sattar, N., et al. (2016). Efficacy and tolerability of evolocumab vs. ezetimibe in patients with muscle-related statin intolerance: the GAUSS-3 randomized clinical trial. JAMA 315, 1580–1590. doi: 10.1001/jama.2016.3608
Oliveira, J. R. M., and Oliveira, M. F. (2016). Primary brain calcification in patients undergoing treatment with the biphosphanate alendronate. Sci. Rep. 6:22961. doi: 10.1038/srep22961
Pabon, N. A., Xia, Y., Estabrooks, S. K., Ye, Z., Herbrand, A. K., Evelyn, S., et al. (2018). Predicting protein targets for drug-like compounds using transcriptomics. PLoS Comput. Biol. 14:e1006651. doi: 10.1371/journal.pcbi.1006651
Patel, S., Trakroo, S., Sanaka, S., and Qureshi, K. (2015). Severe myositis with the use of Sofosbuvir/Ledipasvir for Hepatitis C infection: a case of unexpected interactions. Am. J. Gastroenterol. 110:S333. doi: 10.14309/00000434-201510001-00761
Raja, V., Sandanshiv, P., and Neugebauer, M. (2007). Risedronate induced transient ocular myasthenia. J. Postgrad. Med. 53:274. doi: 10.4103/0022-3859.37525
Rawla, P., and Raj, J. P. (2017). Doxycycline-induced acute pancreatitis: a rare adverse event. Gastroenterol. Res. 10, 244–246. doi: 10.14740/gr838w
Reece, D., Kouroukis, C. T., LeBlanc, R., Sebag, M., Song, K., and Ashkenas, J. (2012). Practical approaches to the use of lenalidomide in multiple myeloma: a canadian consensus. Adv. Hematol. 2012:621958. doi: 10.1155/2012/621958
Reznik, I., Volchek, L., Mester, R., Kotler, M., Sarova-Pinhas, I., Spivak, B., et al. (2000). Myotoxicity and neurotoxicity during clozapine treatment. Clin. Neuropharmacol. 23, 276–280. doi: 10.1097/00002826-200009000-00007
Rollin-Sillaire, A., Delbeuck, X., Pollet, M., Mackowiak, M.-A., Lenfant, P., Noel, M.-P., et al. (2013). Memory loss during lenalidomide treatment: a report on two cases. BMC Pharmacol. Toxicol. 14:41. doi: 10.1186/2050-6511-14-41
Sakai, H., Sagara, A., Arakawa, K., Sugiyama, R., Hirosaki, A., Takase, K., et al. (2014). Mechanisms of cisplatin-induced muscle atrophy. Toxicol. Appl. Pharmacol. 278, 190–199. doi: 10.1016/j.taap.2014.05.001
Salman, A. G. (2016). Ocular surface changes with sofosbuvir in egyptian patients with Hepatitis C virus infection. Cornea 35, 323–328. doi: 10.1097/ICO.0000000000000736
Smirnov, P., Kofia, V., Maru, A., Freeman, M., Ho, C., El-Hachem, N., et al. (2017). PharmacoDB: an integrative database for mining in vitro anticancer drug screening studies. Nucleic Acids Res. 46, D994–D1002. doi: 10.1093/nar/gkx911
Taguchi, Y-h. (2019). Drug candidate identification based on gene expression of treated cells using tensor decomposition-based unsupervised feature extraction for large-scale data. BMC Bioinformatics 19:388. doi: 10.1186/s12859-018-2395-8
Taguchi, Y-h. (2020). Unsupervised Feature Extraction Applied to Bioinformatics: A PCA Based and TD Based Approach. Switzerland: Springer International Publishing.
Taguchi, Y-h., and Turki, T. (2020). Universal nature of drug treatment responses in drug-tissue-wide model-animal experiments using tensor decomposition-based unsupervised feature extraction. bioRxiv 2020.03.08.982405. doi: 10.1101/2020.03.08.982405
Trappe, T. A., Carroll, C. C., Dickinson, J. M., LeMoine, J. K., Haus, J. M., Sullivan, B. E., et al. (2011). Influence of acetaminophen and ibuprofen on skeletal muscle adaptations to resistance exercise in older adults. Am. J. Physiol. Regul. Integr. Compar. Physiol. 300, R655–R662. doi: 10.1152/ajpregu.00611.2010
Ullenhag, G. J., Mozaffari, F., Broberg, M., Mellstedt, H., and Liljefors, M. (2017). Clinical and immune effects of lenalidomide in combination with gemcitabine in patients with advanced pancreatic cancer. PLoS ONE 12:e169736. doi: 10.1371/journal.pone.0169736
Vinogradova, Y., Coupland, C., and Hippisley-Cox, J. (2013). Exposure to bisphosphonates and risk of common non-gastrointestinal cancers: series of nested case–control studies using two primary-care databases. Br. J. Cancer 109, 795–806. doi: 10.1038/bjc.2013.383
Yadav, Y. C. (2019). Effect of cisplatin on pancreas and testies in wistar rats: biochemical parameters and histology. Heliyon 5:e02247. doi: 10.1016/j.heliyon.2019.e02247
Yasui-Furukori, N. (2012). Update on the development of lurasidone as a treatment for patients with acute schizophrenia. Drug Design Dev. Ther. 6, 107–115. doi: 10.2147/DDDT.S11180
Keywords: tensor decomposition, unsupervised learning, gene expression profiles, gene selection, drug treatment
Citation: Taguchi Yh and Turki T (2020) Universal Nature of Drug Treatment Responses in Drug-Tissue-Wide Model-Animal Experiments Using Tensor Decomposition-Based Unsupervised Feature Extraction. Front. Genet. 11:695. doi: 10.3389/fgene.2020.00695
Received: 20 March 2020; Accepted: 05 June 2020;
Published: 20 August 2020.
Edited by:
Yang Yang, Shanghai Jiao Tong University, ChinaReviewed by:
Mohit Kumar Jolly, Indian Institute of Science (IISc), IndiaVishal Acharya, Institute of Himalayan Bioresource Technology (CSIR), India
Copyright © 2020 Taguchi and Turki. This is an open-access article distributed under the terms of the Creative Commons Attribution License (CC BY). The use, distribution or reproduction in other forums is permitted, provided the original author(s) and the copyright owner(s) are credited and that the original publication in this journal is cited, in accordance with accepted academic practice. No use, distribution or reproduction is permitted which does not comply with these terms.
*Correspondence: Y-h. Taguchi, tag@granular.com