 Fangtang Yu
 Chuan Qiu
 Chao Xu1
 Hong-Wen Deng
- 1Center for Bioinformatics and Genomics, Department of Global Biostatistics and Data Science, School of Public Health and Tropical Medicine, Tulane University, New Orleans, LA, United States
- 2School of Basic Medical Science, Central South University, Changsha, China
Osteoporosis is mainly characterized by low bone mineral density (BMD) and is an increasingly serious public health concern. DNA methylation is a major epigenetic mechanism that may contribute to the variation in BMD and may mediate the effects of genetic and environmental factors of osteoporosis. In this study, we performed an epigenome-wide DNA methylation analysis in peripheral blood monocytes of 118 Caucasian women with extreme BMD values. Further, we developed and implemented a novel analytical framework that integrates Mendelian randomization with genetic fine mapping and colocalization to evaluate the causal relationships between DNA methylation and BMD phenotype. We identified 2,188 differentially methylated CpGs (DMCs) between the low and high BMD groups and distinguished 30 DMCs that may mediate the genetic effects on BMD. The causal relationship was further confirmed by eliminating the possibility of horizontal pleiotropy, linkage effect and reverse causality. The fine-mapping analysis determined 25 causal variants that are most likely to affect the methylation levels at these mediator DMCs. The majority of the causal methylation quantitative loci and DMCs reside within cell type-specific histone mark peaks, enhancers, promoters, promoter flanking regions and CTCF binding sites, supporting the regulatory potentials of these loci. The established causal pathways from genetic variant to BMD phenotype mediated by DNA methylation provide a gene list to aid in designing future functional studies and lead to a better understanding of the genetic and epigenetic mechanisms underlying the variation of BMD.
Introduction
Osteoporosis is a disease that is clinically characterized by an increased risk for fracture due to reduced bone mineral density (BMD) and deterioration of bone quality (Kanis et al., 1994). Osteoporotic fractures represent a major public health problem. Approximately 2 million osteoporotic fractures occur per year in the United States, incurring 17 billion US dollars in direct costs annually, and the burden is estimated to increase by 50% by 2025 (Brent Richards et al., 2012). BMD has a high heritability (50%-85%) as shown in twin and family studies (Arden et al., 2009). Over the past 10 years, numerous genome-wide association studies (GWAS) have identified over 500 genetic loci associated with BMD and other osteoporosis (OP)-related traits (Brent Richards et al., 2012; Estrada et al., 2012; Kemp et al., 2017; Sabik and Farber, 2017; Al-Barghouthi and Farber, 2019; Morris et al., 2019). Although GWAS have been successful in identifying genetic loci for BMD, translating the genetic association findings into knowledge of the underlying biological mechanisms of bone biology and OP remains challenging, primarily due to the fact that most associations are from noncoding variation, the lack of bone-specific-omics resources, and the difficulties in establishing causality between variants, genes, and traits.
DNA methylation is an epigenetic regulation mechanism that plays a key role in many biological processes and disease susceptibility (Grundberg et al., 2013; Gaunt et al., 2016). DNA methylation also affects the differentiation and activities of bone cells (Marini et al., 2016) and contributes to the pathogenesis of OP (van Meurs et al., 2019). Epigenome-wide association studies (EWAS) have been applied to investigate the association between DNA methylation and BMD. The largest EWAS of BMD in bone specimens was performed in 84 postmenopausal women and identified 63 differentially methylated CpGs (DMCs) between healthy and osteoporotic women at a 10% false discovery rate after limiting the association analyses to CpG sites in the top 100 genes whose bone transcripts were previously associated with BMD (Reppe et al., 2017). Due to the difficulties inherent in acquiring bone samples from human subjects, some recent EWAS used whole blood DNA as a proxy to assess the association. The largest EWAS for BMD in whole blood assessed DNA methylation at over 450,000 CpG sites with 5,515 subjects across five cohorts but failed to identify strong consistent association signal at any of the tested CpG sites (Morris et al., 2017). The finding of no significant associations was further substantiated by another independent EWAS of BMD comparing the whole blood DNA methylation of 32 primary OP patients with 16 controls (Fernandez-Rebollo et al., 2018), suggesting that the DNA methylation profile in whole blood may not accurately reflect the epigenomic status of bone cells. Moreover, although EWAS have extensively investigated the associations of DNA methylation and BMD, they were not able to elucidate the role of DNA methylation along the etiology pathway of the genetic variants to OP.
Recent studies suggest that DNA methylation modification could reside along the causal pathway between genetic variation and disease, either as the mediating factor contributing to the trait (Richardson et al., 2017) or as a consequence of the trait (Wahl et al., 2017). Identifying the role of epigenetic markers for disease risk along the causal pathway could be valuable in understanding the pathogenic mechanisms of OP. Mendelian randomization (MR) is a statistical method for dealing with this problem. It uses genetic variants robustly associated with modifiable exposures as instrumental variables to infer the causal relationship between the exposure and outcome variable (Davey Smith and Ebrahim, 2003; Davey Smith and Hemani, 2014). Generally, the observed association between a risk factor and an outcome trait can be explained in four kinds of causal pathways: causality, linkage, horizontal pleiotropy and reverse causality (Figure 1). Using an MR framework, we can investigate whether DNA methylation resides along the causal pathway to disease (Relton and Davey Smith, 2012). Such an effect is sometimes referred to as “mediation,” as DNA methylation is mediating the effects from genetic variants to phenotype along the same biological pathway. Like other risk factors, DNA methylation is also vulnerable to confounding and reverse causality (Relton and Davey Smith, 2012), but some recently developed methods can help to mitigate these problems. A bidirectional MR framework can distinguish causality from reverse causality (Figures 1D and 2) (Vimaleswaran et al., 2013), a fine-mapping and colocalization framework can identify whether the causal variants are in linkage (Figures 1D and 2), and using multiple correlated instrumental variables (IVs) can distinguish causality from horizontal pleiotropy (Figures 1C and 2) (Burgess et al., 2016; Zhu et al., 2016).
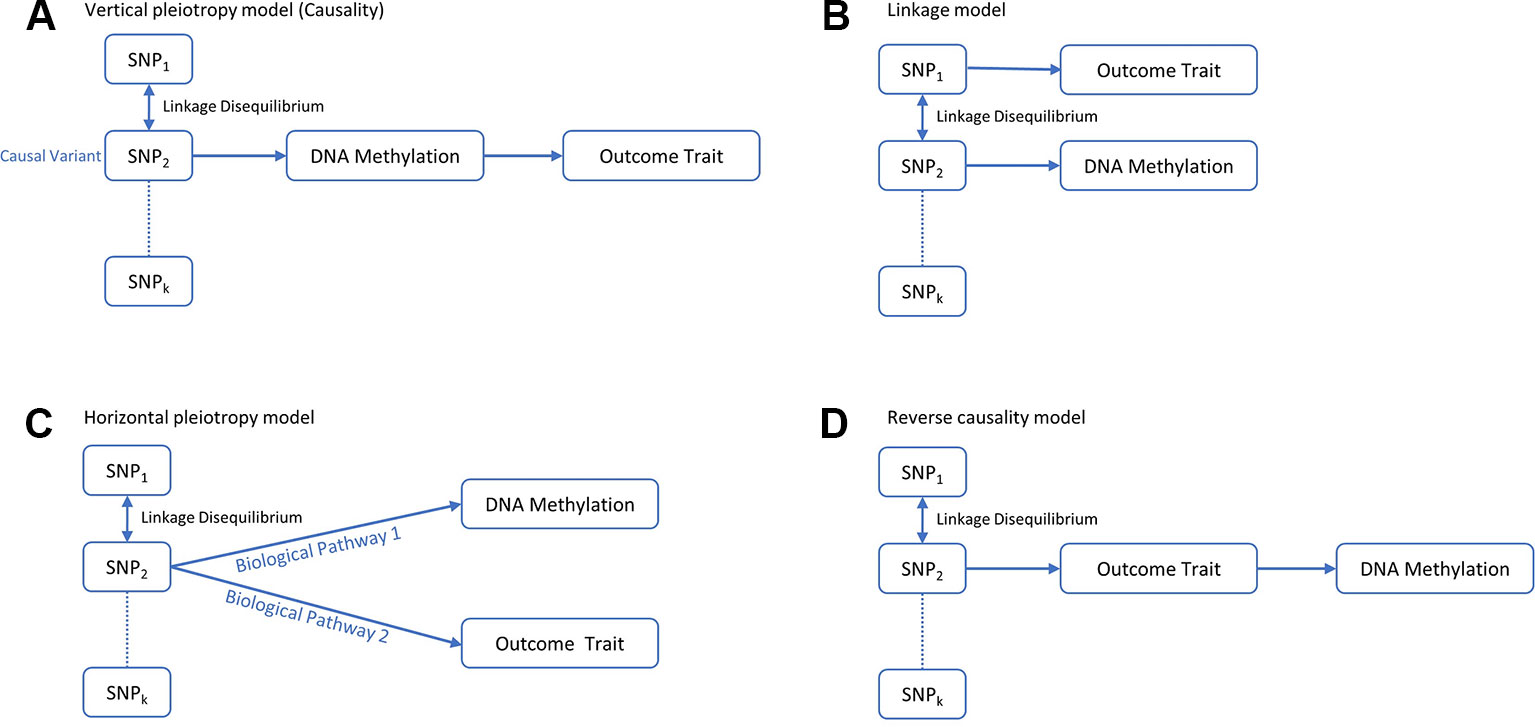
Figure 1 Four possible models for an observed association between a trait and genetic variants through DNA methylation. (A) The genetic variant has an effect on the phenotype, mediated through DNA methylation. (B) The genetic variant that influences DNA methylation and the variant that influences the associated trait are in LD with each other. (C) The genetic variant influences both DNA methylation and phenotype by two independent biological pathways. (D) The genetic variant has an effect on the phenotype which then has a downstream effect on DNA methylation at this locus.
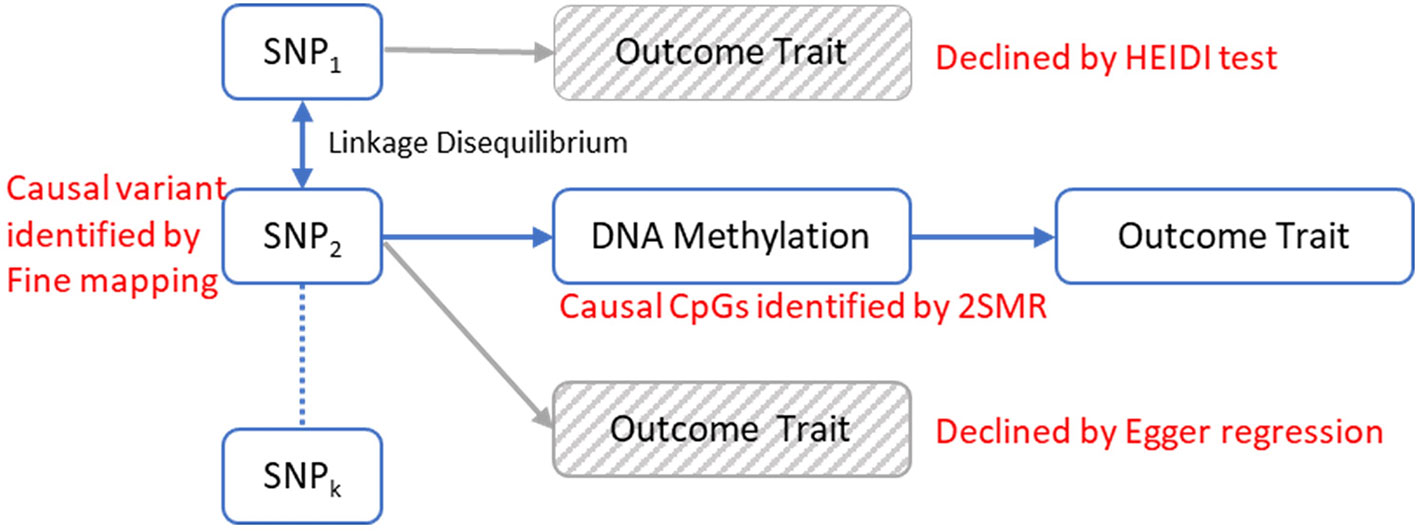
Figure 2 The analytical framework to evaluate the possible models for observed associations between a trait and genetic variants through DNA methylation. The causal relationship between DNA methylation and the trait is established by 2-sample Mendelian randomization (2SMR) with Egger regression to evaluate the horizontal pleiotropy effect. The causal mQTL is identified by fine mapping. The possibility of linkage model is declined by HEIDI test.
In this study, we built a comprehensive MR framework to evaluate the mediation effect of DNA methylation for genetic influences on traits and applied our framework to discover the genetic causal pathways of OP (Figure 2). In our analysis, we first identified the DMCs and methylation quantitative loci (mQTLs) in peripheral blood monocytes (PBMs) from 118 Caucasian women with divergent BMD values and then implemented the MR framework to infer the causal pathways mediated by DMCs. PBMs can serve as circulating precursors of osteoclasts, the bone-resorbing cells (Xing et al., 2005), and produce various cytokines that have profound effects on osteoclast differentiation, activation, and apoptosis (Zhou et al., 2015). Due to the close biological relevance of PBM and bone metabolism, it has been widely utilized as a working cell model for studying the pathogenesis of OP (Liu et al., 2005; Nose et al., 2009; Cao et al., 2014; Deng et al., 2014; Kim et al., 2014) and other skeletal disorders (Nagy et al., 2008; Kwok et al., 2012). We successfully identified 30 CpG sites in PBMs that may reside along the causal pathway from gene to OP and further ascertained 25 genetic loci that have potential causal effects on the change of DNA methylation at those CpG sites by fine mapping.
Materials and Methods
Human Subjects and Phenotype
A total of 118 Caucasian women between 20 and 40 years of age were recruited from the subjects participating in our Louisiana Osteoporosis Study, a cross-sectional study with ongoing recruitment to build a large sample pool (~20,000 subjects) and database for research studies of OP and other musculoskeletal diseases/traits (He et al., 2016; Du et al., 2017). The 118 subjects included 64 with relatively high BMD and 54 with relatively low BMD, corresponding to hip BMD Z scores ≥0.8 and ≤−0.8, respectively. Hip BMD was determined as the combined BMD of the femoral neck, trochanter, and intertrochanteric region measured by Hologic Discovery-A DXA (dual energy X-ray absorptiometry) machines (model number: 010-0575, Hologic Inc., Bedford, MA, USA) (Kim et al., 2002). The DXA machine was calibrated daily, and the coefficient of variation (CV) value of the DXA measurements at total hip on Hologic Discovery-A was 1.0%. The BMD Z score was defined as the number of standard deviations a subject's BMD differed from the mean BMD of their age-, gender-, and ethnicity-matched population. The Z-score was reported directly by the Hologic DXA machine which has incorporated the National Health and Nutrition Examination Survey whole body bone data as reference in the system (Kelly et al., 2009; Fan et al., 2014). For each study subject, weight and height were measured using standard procedures, and lifestyle factors (e.g. exercise, alcohol consumption, smoking, etc.) and medical history were assessed by questionnaires. A set of stringent exclusion criteria (Deng et al., 2002) were adopted to minimize potential confounding effects of nongenetic influence (by physiological and pharmacological conditions) on BMD variation and alteration in PBM DNA methylation profile. The detailed characteristics of the study subjects are shown in Table 1.
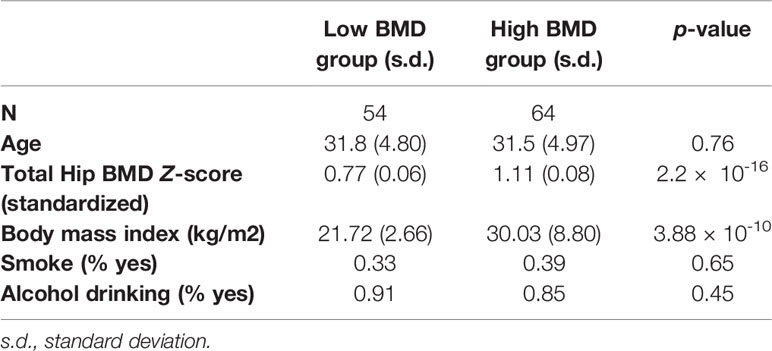
Table 1 Baseline characteristics of subjects from the low and high BMD group.
PBM Isolation
Sixty milliliters of peripheral blood were collected from each subject by a certificated phlebotomist. The fresh blood samples were immediately processed for PBM isolation. First, peripheral blood mononuclear cells (PBMCs) were isolated from whole blood using density gradient centrifugation with Histopaque-1077 (Sigma-Aldrich, USA). Then, PBMs were isolated from PBMCs using Monocyte Isolation Kit II (Miltenyi Biotec Gmbh, Bergisch Glagbach, Germany) according to the manufacturer's protocol. The kit contains a highly optimized antibody mix and blocking reagent to deplete T cells, B cells, and natural killer cells from PBMCs, leaving monocytes untouched and free of surface-bound antibody and beads with minimum disturbance. The purity of PBMs isolated using this method was 86% ± 3%. Genomic DNA was extracted from the freshly isolated PBMs with the AllPrep DNA/RNA/miRNA Universal Kit (Qiagen, Inc., Valencia, CA), following the manufacturer's protocol and stored at −80°C until further use.
Whole-Genome Sequencing Assay
Genomic DNA samples extracted from the whole blood were sequenced to 30x coverage on Illumina HiSeq X-Ten with 150 bp paired-end reads. Data quality check was performed on the Illumina sequencing analysis viewer (SAV). Sequence reads were trimmed using Cutadapt (version 1.11) (Martin, 2011), aligned to GRCh37 (hg19) using BWA-MEM (version 0.7.12-r1039) (Li and Durbin, 2010), duplicates marked with Picard (version 1.129, http://picard.sourceforge.net), and coordinates sorted using Samtools (version 1.3) (Li et al., 2009). SNPs were detected by a dual calling strategy using qSNP (Kassahn et al., 2013) and GATK HaplotypeCaller (McKenna et al., 2010). Variants were annotated with Ensembl v75 gene feature information. Variants were considered “called” and used in the subsequent analysis if they passed the following filters: a minimum read depth of eight reads in each dataset; at least four reads containing the variant where the variant was identified on both strands and not within the first or last five bases. Variants that did not pass these filters were considered “low evidence”.
Epigenome-Wide DNA Methylation Assay and Data Processing
Epigenome-wide DNA methylation profiles were determined by reduced representation bisulfite sequencing (RRBS) according to previously published protocols (Meissner et al., 2005). Briefly, 100 ng genomic DNA from PBMs were digested overnight with MspI restriction enzyme (Thermo Scientific, USA) and then subjected to library construction using the NEXTflex Bisulfite-Seq Library Prep Kit and NEXTflex Bisulfite-Seq Barcodes (BioO Scientific, USA) with a modification of bead size selection to capture MspI fragments of 40–220 bp size. The resulting libraries were bisulfite converted by the EZ DNA Methylation-Gold kit (Zymo Research Corp, USA) and amplified by 20 cycles of PCR using the NEXTflex Bisulfite-Seq U+PCR Master Mix and NEXTflex Primer Mix (BioO Scientific, USA). The bisulfite conversion rate of the EZ DNA Methylation-Gold Kit is ≥99% according to the manufacturer's specifications. Different adaptors were used for multiplexing samples into one lane. Library concentrations and quality were measured by Qubit ds DNA HS Assay kit (Life Technologies, USA) and Agilent Bioanalyzer (Agilent, USA). Purified and quantified libraries were pooled at six samples per lane for sequencing and read by 1 × 50 bp on Illumina HiSeq3000. Data quality check was done on Illumina SAV. De-multiplexing was performed with Illumina Bcl2fastq2 v2.17 program and standard FASTQ files were trimmed with Cutadapt v1.3 (Martin, 2011). The trimmed reads were mapped to the human reference genome (hg19) and converted to methylation values on the 0–1 scale using Bismark v0.10.0 (Krueger and Andrews, 2011). Only CpG sites with ≥3-fold coverage in at least 30 subjects in each BMD group were included in the subsequent analysis.
Control for Potential Cell Admixture
As is true for most tissues, the PBM contains a mixture of several subtypes of cells (Wong et al., 2011). This may cause false positives in association analysis if 1) the methylation pattern of subcell types differs and 2) the relative abundance of cell types is correlated with the outcome variable of interest (Houseman et al., 2012). We adopted a principal component (PC) analysis approach to alleviating the risk of false positive discoveries (Sun et al., 2010; Liu et al., 2013; McClay et al., 2015). The underlying assumption is that subjects with similar cell type compositions will have more similar multi-locus methylation patterns and these patterns can be captured by the PCs. By including the PCs of methylation data as covariates in the association analysis, the potential effects of cell mixture can be regressed out (Sun et al., 2010; Liu et al., 2013; McClay et al., 2015). Similarly, the PC could also help adjust the batch effect and other unmeasured confounders (Price and Robinson, 2018). To obtain the PCs, the methylation data were first normalized by the inverse quantile transformation of the ranked values, which is a robust approach that can reduce the effect of outliers (Wright et al., 2014). Based on the variance explained (Figure S1, Table S1), the first PC, explaining 26.95% of the methylation variance, was included as a covariate in the following regression analysis.
Epigenome-Wide Association Analysis
Differential methylation analyses were carried out by using R package methylKit (Akalin et al., 2012) with the following logistic regression model at each CpG site for subject i = 1,…,n
where n is the total number of subjects, Pi is the proportion of methylated cytosines, Xi denotes the BMD group (= 0 for subjects in the low BMD group and = 1 for subjects in the high BMD group), β0 denotes the log odds of the control group, and β1 denotes the log odds ratio between the high and low BMD groups. Covariates in the model included age, body mass index, drinking status, smoking status, and 1st PC of methylation. We include the PC for methylation for batch effect and cell-type adjustment. The p-values for testing the null hypothesis H0: β1 = 0 were adjusted by Bonferroni correction to account for multiple testing problems. We performed simulation analyses to calculate the power of detecting methylation difference using logistic regression at different settings of mean sequencing coverage and probability of methylation in the low BMD group (details see Supplementary File Part 1).
mQTL Analysis
Autosomal analysis was applied to 9,265,832 SNPs with a minor allele frequency > 0.01, genotype hard call rate > 0.95, and Hardy–Weinberg p > 1 × 10⁻⁶. The first PC of SNPs, which explains 46% of the variance (Figure S2, Table S2), was included as a covariate in the association analysis to control for ancestry and population stratification (Price et al., 2006). To increase the computation speed, we split the SNP and methylation data by chromosome and performed association analysis for each SNP-DMC pair on the same chromosome to identify both cis- and trans-mQTLs using R package matrixEQTL. The SNP was defined cis if the distance between SNP and CpG was <1 Mb and trans otherwise. p-values were corrected by the Bonferroni approach using the total number of tests of cis and trans effects (Table S3) separately to account for the multiple testing problem. SNPs that have a significant (Bonferroni adjusted p-value ≤ 0.05) association with DMCs were defined as mQTLs.
MR Analysis
The DMCs were further analyzed by MR to estimate the potential mediation effects of DNA methylation on BMD. Considering the lack of power for detecting association due to the limited sample size (N = 118) of our study cohort, we undertook a two-sample MR (2SMR) approach with estimated effects between genetic variants and BMD from published studies (Burgess et al., 2015). We used DMCs as the exposure and its associated mQTLs as the instrument variables (IVs). The effects of mQTLs on BMD variation were extracted from the GWAS summary statistics for femoral neck BMD from the GEnetic Factors for OSteoporosis Consortium 2015 data release (Zheng et al., 2015). The mQTL SNPs were further pruned by linkage disequilibrium (LD) correlation. Only SNPs with low LD (r2 < 0.2) were retained to ensure the independence of IVs. If there was only one remaining SNP, we used the Wald ratio test to assess the causal effect of DNA methylation. If there were two or more remaining SNPs, we used inverse-variance weighted (IVW) regression (Burgess et al., 2013) along with sensitivity analysis by Egger's regression (Bowden et al., 2015) to assess the causal relationship. We performed the MR analysis iteratively through all the DMCs. The DMCs that achieved FDR corrected significance level in the Wald ratio test or IVW regression were defined as mediator DMCs, i.e. methylation at these CpG sites with mediation effects for genetic influences on BMD. The 2SMR was implemented by R package MR-Base (Hemani et al., 2018).
We also performed reverse MR analysis to evaluate the potential reverse causation (i.e. BMD causes altered DNA methylation at the CpG site of interest) for the mediator DMCs detected in the MR analysis. Because of the limited power to identify SNPs significantly associated with BMD using our study cohort here, the IVs for this analysis were identified with relevant GWAS for BMD reported on the NHGRI-EBI GWAS catalog (MacArthur et al., 2017).
Fine Mapping
In 2SMR, a set of SNPs that are significantly associated with methylation at a CpG site was required to estimate the causal effect of the methylation. To distinguish the genetic variants with a high probability of causality among all genetic variant associated with a DMC, we performed fine mapping analysis with PAINTOR software (Kichaev et al., 2014; Kichaev et al., 2017). The major advantage of the PAINTOR algorithm is that it incorporates functional annotation information of the genetic variant with the association and LD information to calculate a posterior probability for each SNP to be causal across a locus. Previous simulations have shown that compared to other fine-mapping approaches, PAINTOR has much higher accuracy to select the causal SNPs with annotation information available (Kichaev et al., 2014). LD matrix of the pairwise correlations between SNPs was calculated with PLINK software using our own sample of 118 Caucasian women. Functional annotation included in the analysis were gene elements form GenCode (eight annotations) and chromatin states of monocytes computed from the 15-state hidden Markov model built by NIH Roadmap Epigenomics Project (Roadmap Epigenomics Consortium et al., 2015). The annotation files were downloaded from the PAINTOR website (https://github.com/gkichaev/PAINTOR_V3.0/wiki/2b.-Overlapping-annotations). We set the maximum number of causal variants in a locus to be two based on our computational capability. The mQTLs that have the largest posterior probability as computed by the PAINTOR algorithm were defined as causal mQTLs.
Test of Pleiotropy Effect
The observation of the mediation effect of DNA methylation in the 2SMR analysis does not necessarily mean that both DNA methylation and BMD are affected by the same causal variant identified by fine mapping (pleiotropy effect). It is possible that different SNPs that are in high LD causally affect DNA methylation and BMD, respectively (linkage effect, Figure 1B). Hence, for mediator DMCs, we tested the heterogeneity in the bxy values estimated for multiple SNPs in the cis-eQTL region using the heterogeneity in dependent instruments (HEIDI) method to distinguish pleiotropy from linkage with multiple SNPs in cis-region. Under the null hypothesis of the HEIDI test which assumes pleiotropy, the estimated effect size of DNA methylation on BMD (bxy) calculated for any SNPs in LD with the causal variant will be identical. Therefore, testing against the null hypothesis is equivalent to testing whether there is heterogeneity in the bxy values estimated for the causal variant and all other SNPs in the cis-mQTL region. In the HEIDI test, we only included SNPs in moderate LD with the causal cis-mQTL (0.05 < r2 < 0.9) which was inferred by the population in our study. We also removed SNPs in the cis-mQTL region with an mQTL p-value > 1.6 × 10⁻³ to avoid weak instrumental bias which was the default setting of the SMR software (Zhu et al., 2016). p-value threshold was adjusted by Bonferroni correction using the total number of identified causal mQTLs.
Functional Annotation for DMC, Mediator DMC, and Causal mQTLs
To test for functional enrichment of the DMCs, we annotate them to seven regulatory categories, including three general regulatory categories (genic regions, CpG islands, and binding sites of CTCF) and fore cell-type specific regulatory categories of CD14+ monocyte (histone marks, DNaseI signal peak, chromatin states from the NIH Roadmap Epigenomics Project (Roadmap Epigenomics Consortium et al., 2015), and monocyte differentially expressed enhancers from Fantom5 (Lizio et al., 2017)). We mapped each DMC to the annotation categories and recorded overlap at each DMC as a binary variable. To determine whether enrichment occurred more frequently than by chance, we randomly generated 1,000 sets of CpGs (sample size = number of DMCs) from all the input CpGs for differential methylation analysis. For each epigenetic mark, we then calculated the proportion of overlapping CpGs among the DMCs (observed) and that of 1,000 simulated sets of CpGs (expected). We calculated the fold enrichment as observed/expected proportion values and obtained an empirical p value from the distribution of expected proportion values.
We investigated the biological meaning of the DMCs by analyzing the annotations of the nearby genes. We used the Genomic Regions Enrichment of Annotations Tool (GREAT) v3.0.0 to evaluate whether the nearby genes of DMCs are enriched in any gene and human phenotypes ontology terms. To better understand the functional mechanism of the identified causal mQTLs, we annotated each of them to the genic region of specific genes and the regulatory categories as we did for DMC annotation. We use the VEP tool (McLaren et al., 2016) for gene annotation and prediction of their functional consequences. In addition, we used the Core Expression Analysis function in the Ingenuity Pathway Analysis software (IPA, QIAGEN Redwood City, www.qiagen.com/ingenuity) to identify overrepresented canonical pathways, diseases, or disorders and molecular and cellular functions for the nearest genes of causal mQTLs. The experimentally observed molecules and relationships in the IPA Knowledge Base for mammal (humans, mouse, or rat) were used. p-values of the right-tailed Fisher exact test were calculated by IPA to assess the enrichment. We also performed gene pathway enrichment analyses using Metascape (Zhou Y. et al., 2019), in which the following ontology sources were used: KEGG Pathway, GO Biological Processes, Reactome Gene Sets, Canonical Pathways and CORUM. All genes in the genome were used as the enrichment background. Terms with a p-value < 0.01, a minimum count of 3, and an enrichment factor > 1.5 (the enrichment factor is the ratio between the observed counts and the counts expected by chance) were collected and grouped into clusters based on their membership similarities. The most statistically significant term within a cluster was chosen to represent the cluster (Zhou Y. et al., 2019).
Results
Differentially Methylated CpG Sites
A total of 17,462,566 CpG sites were measured in 54 subjects in the low BMD group and 64 subjects from the high BMD group, of which 1,267,919 CpG sites that were measured with adequate sequencing coverage (N ≥ 3) in more than 30 subjects in each BMD group were used for differential methylation analysis. The mean sequencing coverage of the tested CpGs was 46.52 (95% CI: 22.95~62.09) fold. We identified 6,149 DMCs significantly associated with BMD at Pp < 3.94 × × 10-8 (Bonferroni correction 0.05/1,267,919), including 2,188 DMCs with an absolute difference in methylation values > 0.05 and 693 DMC with absolute difference ≥ 0.1 between the low and high BMD groups (Table S4 and Figure S3). Among the 2,188 DMCs with an absolute difference in methylation values > 0.05, 1,601 (74%) DMCs had mean sequencing coverage >10 and 1,161 (53%) had mean coverage >30 (Figure S4). We estimated that our sample size has approximately 80% power to detect a 0.05 gross difference (total difference caused by methylation and other covariates) at the mean coverage of 30-fold (Figure S5). We used relatively moderate thresholds for the sequencing coverage and methylation difference in DMC analyses in order to provide a large set of candidates for the downstream analyses.
The GREAT analysis shows that the nearby genes of DMCs with difference >0.05 are enriched in association with a bone-related human phenotype term, elevated alkaline phosphatase of bone origin (Figure 3). To evaluate whether our findings are consistent with previous studies, we checked the overlap of DMCs with the significant signals in three previous EWAS of OP (Delgado-Calle et al., 2013; Reppe et al., 2017; Morris et al., 2017). For each DMC identified by our study, we found the nearest signals identified in previous EWAS and calculated the distance between the DMC and the EWAS signals (Tables S5 and S6). Twelve DMCs are located within 1,000 bp from the previously identified EWAS signals by Delgado-Calle et al. (Delgado-Calle et al., 2013). The low overlap rate between our results and that of Delgado-Calle's study is likely due to the very limited overlap of the tested CpG sites between the two studies, and the difference in the studied sample cohorts. Specifically, although we tested 1,267,919 CpGs measured by RRBS, only 33,345 (2.6%) of the tested CpGs were mapped to within 1,000 bp from the CpGs measured by the Illumina 27K array, which was used in the study by Delgado-Calle et al. In addition, our study was perform in PBMs from women aged between 20 and 40 years, whereas the study by Delgado-Calle et al. studied trabecular bone specimens from women aged 59–85 years, with 26 had osteoarthritis and 27 had OP fractures.
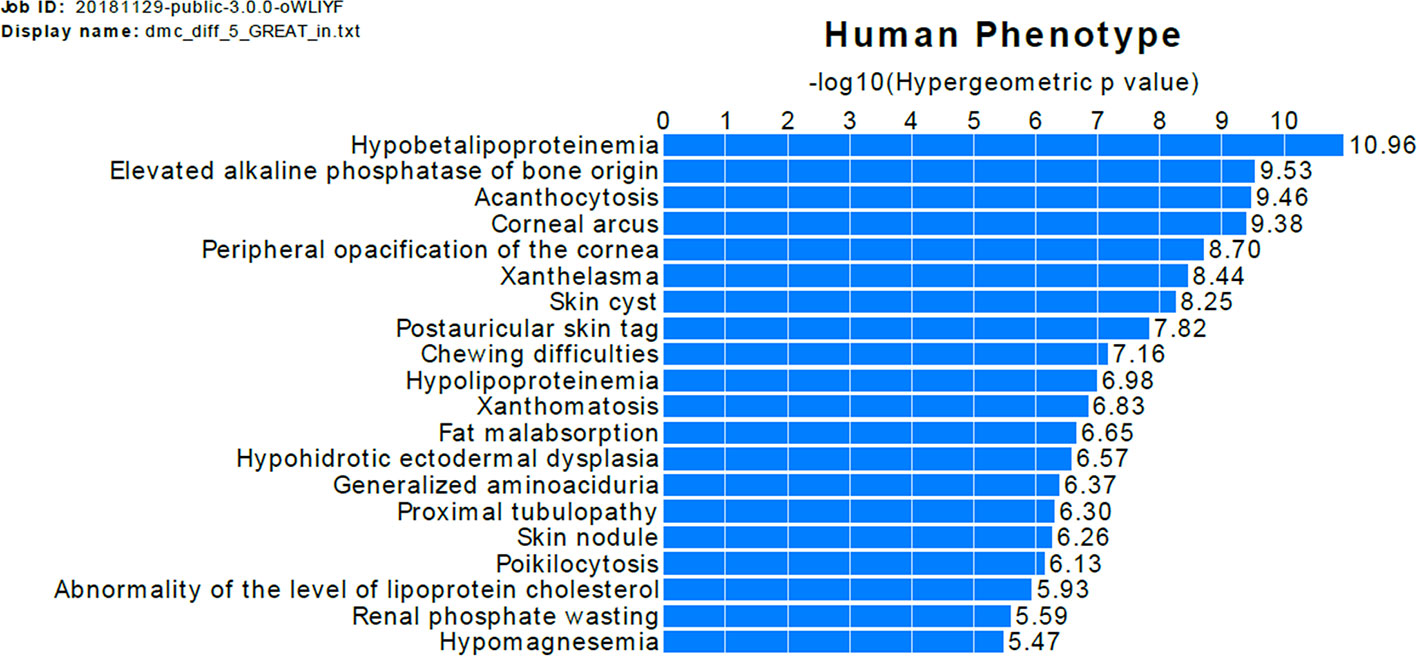
Figure 3 Functional annotation of DMCs with difference >0.05. The bars represent the top 20 categories in the human phenotype ontology enriched genes near the DMCs. The length of the bars corresponds to values on the x-axis, which are hypergeometric (uncorrected) p-values.
Construction of Causal Paths: mQTLs, Mediator DMCs and Causal mQTLs
As we were particularly interested in DMCs where the DNA methylation may mediate the genetic risk for OP, we applied 2SMR analysis on the 6,149 DMCs. First, we identified 115,727 significant cis-DMC-mQTL pairs with Pp < 1.08 × × 10-9 (Bonferroni correction 0.05/46,331,365) and 79,188 significant trans-DMC-mQTL pairs with Pp < 1.83 × × 10-11 (Bonferroni correction 0.05/2,736,230,941), including 125,409 unique mQTLs and 2,618 unique DMCs.
Next, by using mQTLs as the instrumental variables, DNA methylation at DMCs as potential mediators, and BMD groups as the outcome, we found 30 significant mediator DMCs in the 2SMR analysis (Table 2), among which 11 mediator DMCs showed a positive relationship between DNA methylation and BMD and 19 showed a negative relationship based on the estimated effect sizes. The minimum absolute differences in methylation values of the mediator DMCs is 1.6% between the high versus low BMD groups, while half of mediator DMCs have methylation difference greater than 5% (Table 2).
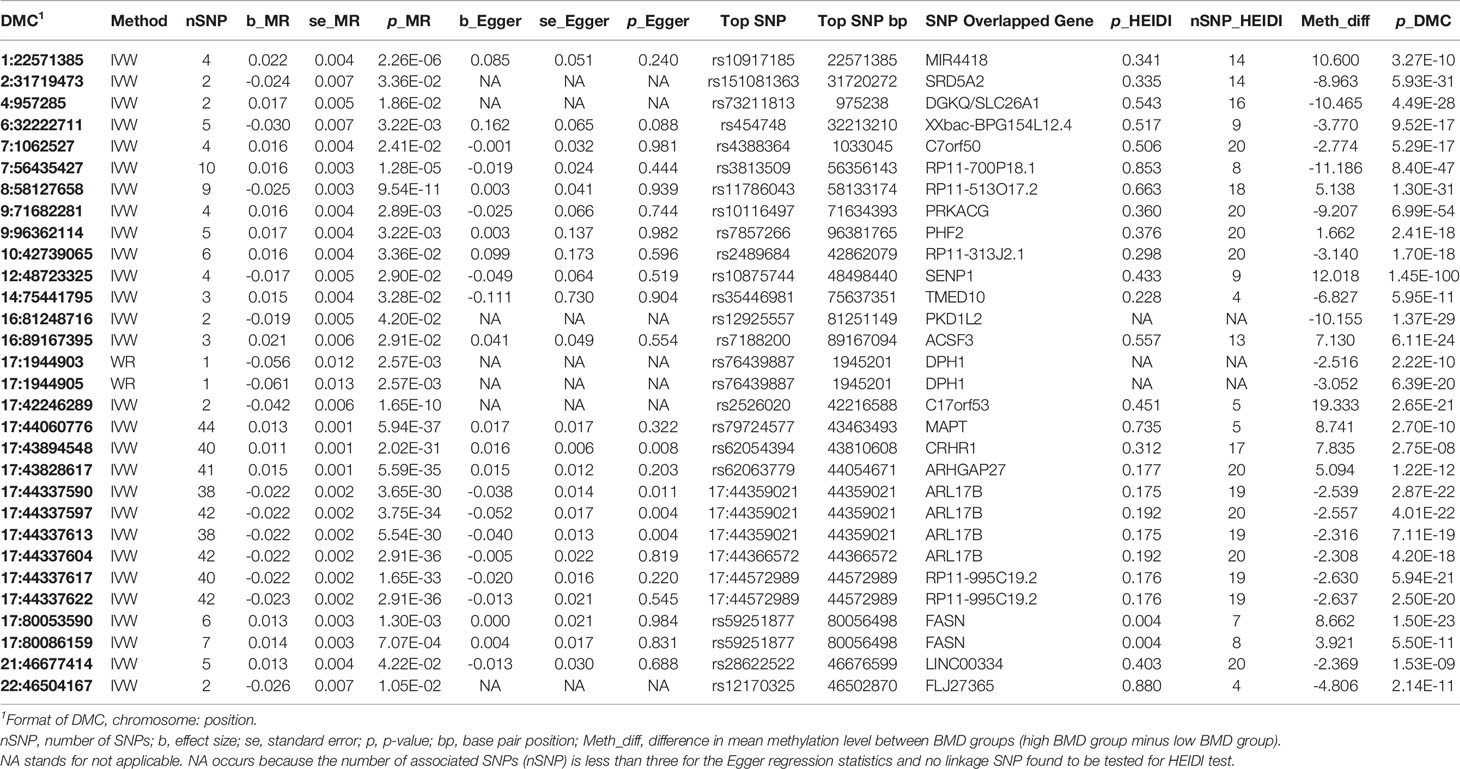
Table 2 Results of Mendelian randomization analysis.
To evaluate the potential reverse causation between BMD and methylation at the 30 DMCs, we also carried out reverse 2SMR analysis by using SNPs associated with BMD as the instrumental variables, BMD as the potential mediators, and DNA methylation at DMCs as the outcome. None of the 30 mediator DMCs showed significant evidence of reverse causality after multiple testing correction (Table S7). Two DMCs (Chr16:89167395 and Chr2:31719473) reached the nominal significance level (0.05) for both the two-stage least square (2SLS) method with multiple linear regression and 2SLS with logistic regression (Table S8), which further supports the existence of mediation effect at these CpG sites.
The 30 mediator DMCs were fine mapped to 25 causal mQTLs (Table 2). None of the causal mQTLs has a HEIDI test p-value past the threshold 0.001 (0.05/30) after Bonferroni adjustment, suggesting it is unlikely that the SNPs in LD with these causal mQTLs affect BMD.
Biological Significance of the Causal Paths
The mediator DMC–causal mQTL pairs were mapped to 25 unique genes (the nearest genes of causal mQTLs), of which eight genes have been associated with bone-related phenotype in previous GWAS studies (Table 3). Three causal mQTLs are in high LD with BMD-associated SNPs reported in GWAS catalog: rs2526020 (in LD with rs227584, r2 = 0.8913), rs62054394 (in LD with rs1864325, r2 = 1), rs62063779 (in LD with rs1864325, r2 = 1). Four causal mQTLs were shared by more than one mediator DMC (rs76439887, 17:44359021, 17:44572989, and rs59251877), which may point to the location of some harbor genes. By overlapping the causal mQTLs and the mediator CpGs with regulatory categories, we found that 10 out of 25 causal mQTLs and 25 out of 30 mediator DMCs reside within cell type-specific histone mark peaks, enhancers, promoters, promoter flanking regions and CTCF binding sites (Tables S9 and S10), supporting the regulatory potential of these loci.
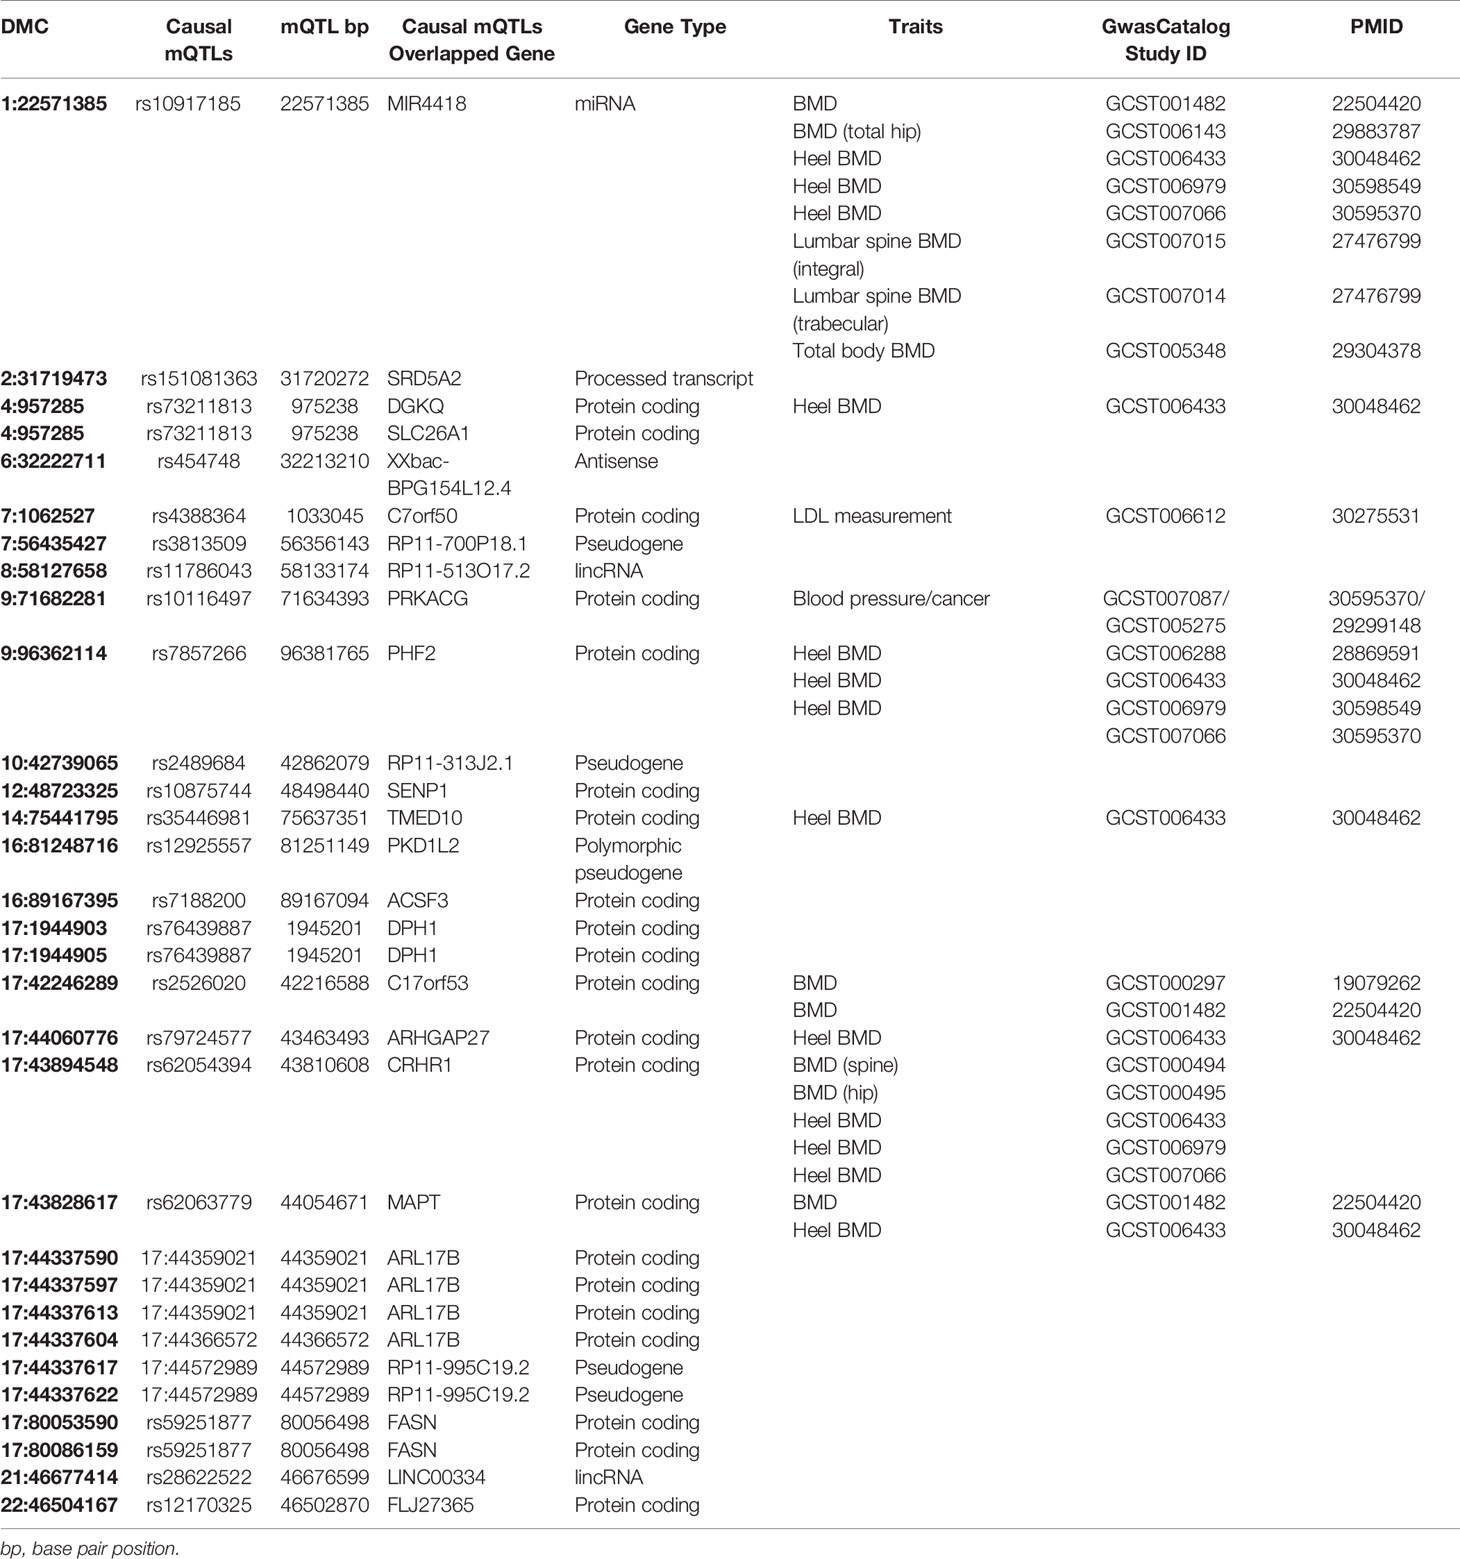
Table 3 Gene annotation of causal mQTLs.
Using IPA software, we identified the top canonical pathways related to the causal mQTLs, shown in Table 4. In our result, we didn't find the most well-known signaling pathways related to bone metabolism, like the Wnt and BMPs (bone morphogenetic proteins) (Shahi et al., 2017). However, it has been established that OP and cardiovascular disease are functionally interwoven and share some common risk factors like hyperlipidemia (Parhami et al., 2000). The identification of ‘Fatty Acid Biosynthesis Initiation II’ in the top canonical pathways, ‘Lipid Metabolism’ in the top molecular and cellular functions and ‘Cardiovascular disease’ in the top diseases and disorders (Table 4) may indicate that lipid metabolism has more important effects on BMD than previously understood. We also performed gene pathway enrichment analysis using Metascape (Zhou Y. et al., 2019). A GO biological process term related to lipid metabolism (steroid biosynthetic process) showed significant enrichment (p-value = 1.45 × × 10-4) in genes mapped to causal mQTLs which further supported our findings by IPA (Figure S6 and Table S13). Finally, we provided a network graph for the genes near the identified causal mQTLs (Figure 4), which elucidates the interaction between the identified genes in more detail and may facilitate researchers to discover new drug targets or disease mechanisms.
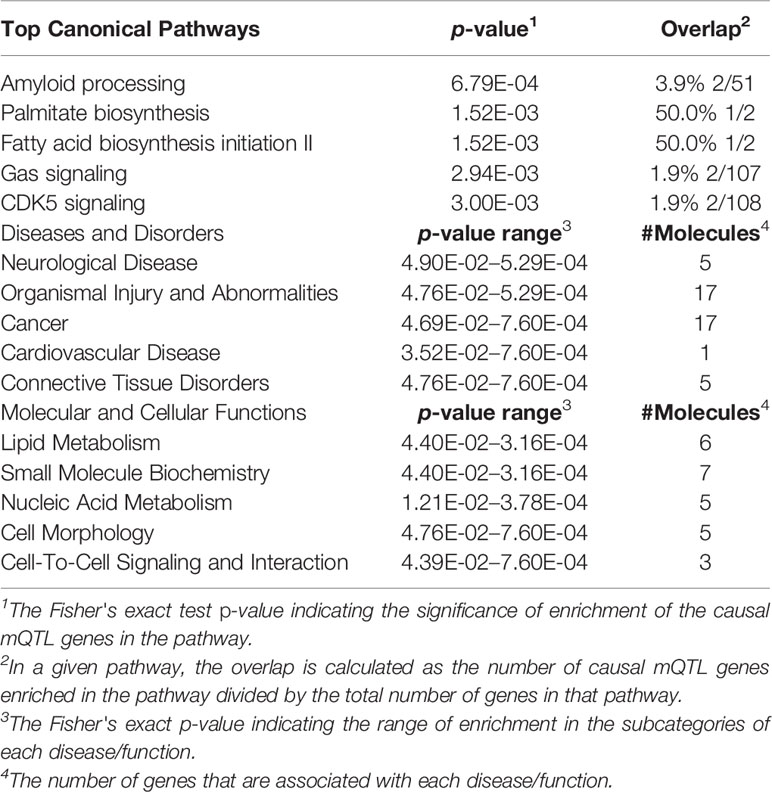
Table 4 Canonical pathways, diseases, and molecular and cellular functions significantly enriched in genes mapped to causal mQTLs.
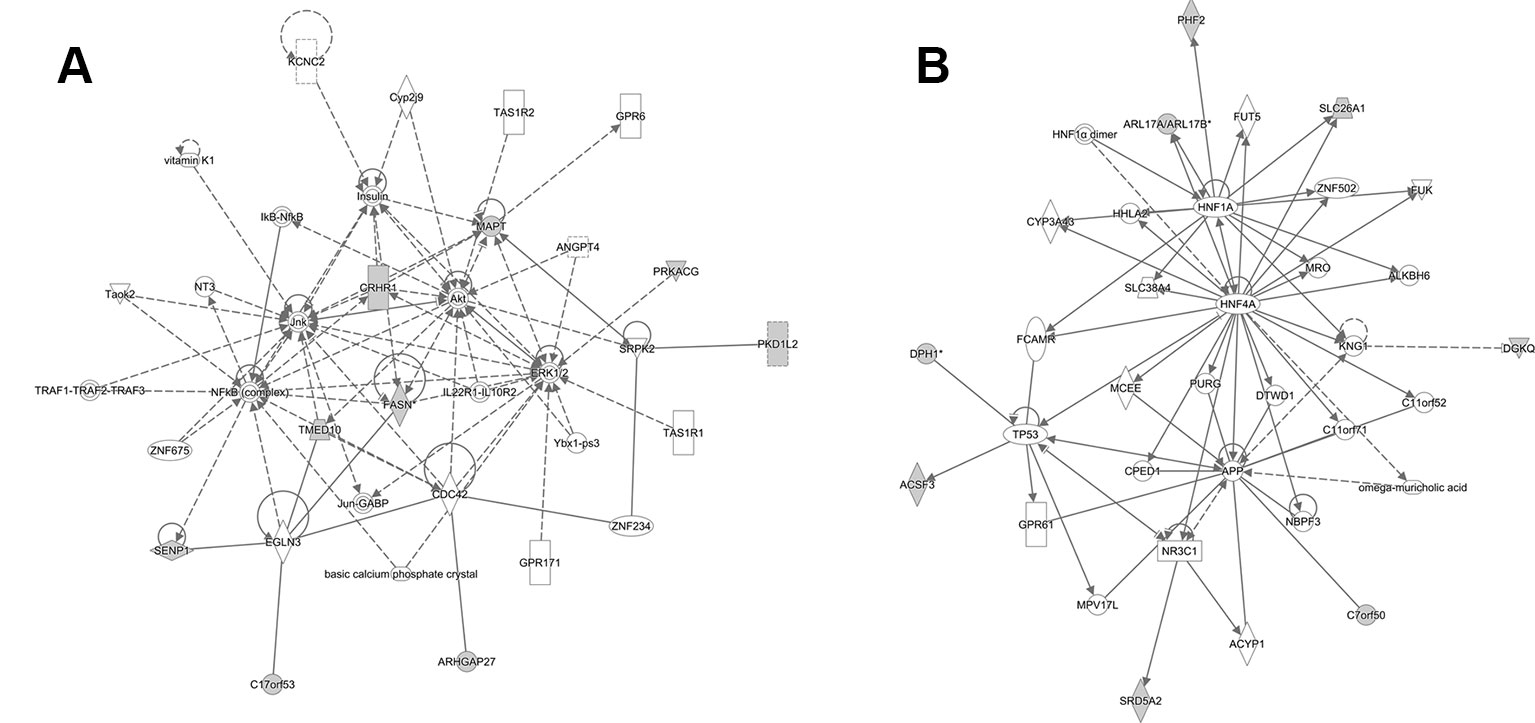
Figure 4 Two predicted nondirectional interaction map of causal mQTL annotated gene by IPA. (A) Top mapped disease or functions: cell-to-cell signaling and interaction, cellular assembly, and organization and cellular function and maintenance. (B) Top mapped disease or functions: endocrine system disorders, gastrointestinal disease, hereditary disorder. The shaded nodes are gene identified by our analysis. And others are genes/molecules from the Knowledge Base added to the network to fill or join areas lacking connectivity by IPA. Highly interconnected networks are likely to represent significant biological function. For detailed legend see IPA Legend page: http://qiagen.force.com/KnowledgeBase/articles/BasicTechnicalQA/Legend.
Discussion
In this article, we developed a framework for evaluating the causal effect of DNA methylation on a complex trait. This framework combines the MR method with fine mapping and colocalization so that it can distinguish causal relationship from reverse causality, linkage and horizontal pleiotropy (Figure 1). Using this framework, we successfully identified 30 causal pathways from genetic variant to BMD phenotype mediated by DNA methylation. Among the 25 corresponding causal genes that we identified, eight genes (MIR4418, TMED10, C17orf53, CRHR1, ARHGAP27, MAPT, DGKQ, and PHF2) have been reported to be associated with BMD in previous GWAS (Table 3).
The CRHR1 gene was first reported to be significantly associated with BMD in a large-scale meta-analysis of GWAS in 19,195 adults of Northern European descent (Rivadeneira et al., 2009), and this association was also replicated in East Asian populations (Styrkarsdottir et al., 2010). CRHR1 encodes a G-protein coupled receptor that binds with the neuropeptides of the corticotropin-releasing hormone family, a major regulator of the hypothalamic-pituitary-adrenal pathway with important effects on bone turnover (Ralston and Uitterlinden, 2010). We identified six causal CpGs located in a CpG island (chr17:44337401-44337926) near the 5'UTR region of the CRHR1 gene, of which five are hypo-methylated in the low BMD group and one is hypermethylated. The hypomethylation in the promoter region of CRHR1 has the potential role of increasing CRHR1 expression as was identified in a case-control study of panic disorder (Schartner et al., 2017). In addition, depression, anxiety, and stress have been found to be negatively correlated with BMD (Erez et al., 2012). These findings suggested a potential epigenetic regulatory mechanism between hypomethylation of CRHR1 promoter and low BMD through the regulation of CRHR1 gene expression.
C17orf53 gene was associated with BMD and fracture risk in a large genome-wide meta-analysis study, including 17 GWAS and 32,961 individuals of European and East Asian ancestry (Estrada et al., 2012). A recent study investigated the molecular and cellular functions of a specific BMD-associated SNP (rs227584) in C17orf53 gene using osteoblastic cells and demonstrated that the SNP rs227584 may alter substrate‐kinase interaction between protein C17orf53 and NEK2 and subsequently regulate osteoblast growth and activity (Zhou X. et al., 2019). Our findings complement the previous results and provide further supporting evidence for the significance of C17orf53 gene on regulating BMD variation and OP risk.
The analytical framework we developed in this study has several prominent strengths. First, we used multiple IVs in the MR analysis, which can offset the low power problem induced by small sample size (Palmer et al., 2012) and allow for a causal estimate of greater precision than the estimate from any of the individual variants (Pierce et al., 2011).
Secondly, using multiple independent IVs made it possible to perform sensitivity analysis to assess the bias of the MR results when the IV assumptions are prone to be violated. Horizontal pleiotropy is one of the major potential violations and occurs when the variant influences other traits outside of the pathway of the exposure of interest and has an impact on the target outcome or when the variant has a direct effect on the target outcome. The assumption of no horizontal pleiotropy in classic MR methods is hard to establish unequivocally. Thus, we performed MR analysis by IVW regression alongside the sensitivity analysis by Egger regression to allow for the potential existence of horizontal pleiotropy. IVW will return an unbiased estimate if the horizontal pleiotropy is balanced, that is, the deviation from the mean estimate is independent of all other effects. In addition, Egger regression further relaxes the assumption to the InSIDE (Instrument Strength Independent of Direct Effect) condition (Bowden et al., 2015), where the instrument-exposure and pleiotropic effects are uncorrelated. The method returns an unbiased causal effect under the InSIDE condition even if the vertical pleiotropy assumption is violated for all SNPs (Hemani et al., 2018). We identified mediator DMCs primarily based on the test statistics of IVW regression because the Egger regression has very limited power to detect causal effects compared with IVW regression (Bowden et al., 2015). The Egger regression p-values of some mediator DMCs are large, suggesting that the IVW estimate might be biased. However, the causal effects were also assessed by IVW with fixed effects, IVW with multiplicative random effect (IVW-MRE), weighted median and maximum likelihood method. The estimates from other MR methods were consistent with those from the IVW regression in general (Table S11). Moreover, both the IVW-MRE and weighted median estimates are robust to the existence of horizontal pleiotropy (Bowden et al., 2016; Bowden et al., 2017). Thus, we are confident about the estimated effects and the statistical inference of our results. Further research could be done under our analytical framework substituting IVW regression with the recently published MR-PRESSO method that can test and correct the bias caused by horizontal pleiotropy (Verbanck et al., 2018).
Thirdly, our approach has increased power to detect genetic heritability that could be missing in traditional GWAS. The causal mQTLs annotated to those genes associated with bone-related phenotypes in our analysis do not show genome-wide significance in association with BMD (Table S12). They were not reported to be associated with BMD as we searched in the GWAS catalog database. This phenomenon can be explained by the biological interaction of genetic and epigenetic modification. As the causal mQTLs can only influence the trait via the mediation effect of methylation, the causal effect of mQTLs on BMD might be offset and not observed in GWAS without controlling for the mediation effect of DNA methylation. The 2SMR method alone can only give us inferences about the mediator CpGs, not the causal variants. Our analytical framework further incorporates fine mapping of mQTLs and uncovered heritable genetic variants contributing to BMD that are invisible to conventional GWAS by leverage methylation data.
It should be noted that some of the identified DMCs should be treated with caution because of relatively low sequencing coverage, zero-inflated methylation data, and/or relatively high over-dispersion levels (Tables S4 and S14). Low sequencing coverage affects both sensitivity and specificity in DMC identification depending on the sample size (Ziller et al., 2015). In addition, an excessive number of zeros in the data might cause extra variance that is difficult for the logistic regression to handle (Sweeney et al., 2014). Although a few statistical approaches (e.g. the zero-inflated binomial model (Hall, 2000)) haven proposed for handling zero-inflated data, however, these approaches have not yet been systemically evaluated for the analysis of DNA methylation data. A comprehensive simulation study is necessary to benchmark the performance of these approaches in DNA methylation analysis, which might be a future extension for us to track. Over-dispersion is another problem likely to happen fitting the methylation data with logistic regression. It refers to a problem of more variability in the data than assumed by the distribution and usually occurs when the observed data does not come from iid (independent and identically distributed) distribution (Hilbe, 2009). It is realistic to model the observed RRBS data yi at a CpG site by binomial distribution with subject-specific parameter Ni and group-specific parameter p, where Ni represents the sequencing coverage of the subject i and p represents the probability of methylation. However, the logistic regression method assumes Ni were the same for all subjects, thus may produce inflated association signals for differential methylation analysis (Klein and Hebestreit, 2016). We estimated the over-dispersion scalar for a DMC as the ratio of the observed over the expected variance of methylation value (Tables S4 and S14). The level of over-dispersion induced inflation of association in differential methylation analysis has not been systematically investigated and is out of the scope of this study. MethylKit updated its user's guide very recently and is expected to bring up a function for over-dispersion correction by McCullagh and Nelder's approach (McCullagh, 2019). This new feature could benefit future studies for differential methylation analysis by logistic regression.
The scope of this analysis is to identify the causal paths that are most likely to have a real biological effect on BMD. The causal effect of genetic variants or mediation effect of CpGs should be validated with functional experiments instead of a purely statistical approach. We hope that the identified causal mQTL and mediation CpGs can help to narrow down and prioritize the gene list for potential follow-up biological studies for further validating whether they truly have any functional or pathological significance.
In summary, we demonstrated the value of integration of MR, fine mapping and colocalization analyses in uncovering the causal mechanisms across multi-omics. This approach allowed us to identify CpGs that have mediation influences on genetic variants as well as the proximal causal SNPs that affect the methylation levels at those CpGs. Our results provided novel insights into the genetic and epigenetic mechanisms underlying OP. The identified causal mQTLs and mediation CpGs warrant further functional studies in cell and animal models.
Data Availability Statement
The genomic sequencing data generated for this study can be found in the NIH dbGaP repository. The dbGaP accession number is phs001960.v1.p1.
Ethics Statement
The studies involving human participants were reviewed and approved by Tulane University School of Public Health and Tropical Medicine in the United States (IRB #: 10-184088). The patients/participants provided their written informed consent to participate in this study.
Author Contributions
FY and HS conceived the study. FY, CQ and CX analyzed the data. L-JZ and LW recruited subjects and collected samples. CQ coordinated and performed DNA extraction experiments for sequencing. QT provide database support. FY prepared the manuscript. HS and H-WD contributed to manuscript preparation and feedback. All authors read and approved the manuscript.
Funding
This study was partially supported or benefited by grants from the National Institutes of Health [R01AR069055, R01MH104680, R01AR059781, R01AG061917, U19AG055373, and P20GM109036], and the Edward G. Schlieder Endowment and the Drs. W. C. Tsai and P. T. Kung Professorship in Biostatistics from Tulane University.
Conflict of Interest
The authors declare that the research was conducted in the absence of any commercial or financial relationships that could be construed as a potential conflict of interest.
Acknowledgments
This research was supported in part using high-performance computing resources and services provided by Technology Services at Tulane University, New Orleans, LA. We acknowledge Ms. Loula Burton from Tulane University Office of Research for English editing.
Supplementary Material
The Supplementary Material for this article can be found online at: https://www.frontiersin.org/articles/10.3389/fgene.2020.00060/full#supplementary-material
References
Akalin, A., Kormaksson, M., Li, S., Garrett-Bakelman, F. E., Figueroa, M. E., Melnick, A., et al. (2012). MethylKit: a comprehensive R package for the analysis of genome-wide DNA methylation profiles. Genome Biol. 13 (10), R87. doi: 10.1186/gb-2012-13-10-r87
Al-Barghouthi, B. M., Farber, C. R. (2019). Dissecting the genetics of osteoporosis using systems approaches. Trends In Genet. 35 (1), 55–67. doi: 10.1016/j.tig.2018.10.004
Arden, N. K., Baker, J., Hogg, C., Baan, K., Spector, T. D. (2009). The heritability of bone mineral density, ultrasound of the calcaneus and hip axis length: a study of postmenopausal twins. J. Bone Miner Res. 11 (4), 530–534. doi: 10.1002/jbmr.5650110414
Bowden, J., Smith, G. D., Burgess, S. (2015). Mendelian randomization with invalid instruments: effect estimation and bias detection through Egger regression. Int. J. Epidemiol. 44 (2), 512–525. doi: 10.1093/ije/dyv080
Bowden, J., Davey Smith, G., Haycock, P. C., Burgess, S. (2016). Consistent estimation in mendelian randomization with some invalid instruments using a weighted median estimator. Genet. Epidemiol. 40 (4), 304–314. doi: 10.1002/gepi.21965
Bowden, J., Del Greco, M. F., Minelli, C., Davey Smith, G., Sheehan, N., Thompson, J. (2017). A framework for the investigation of pleiotropy in two-sample summary data Mendelian randomization. Stat. Med. 36 (11), 1783–1802. doi: 10.1002/sim.7221
Brent Richards, J., Zheng, H. F., Spector, T. D. (2012). Genetics of osteoporosis from genome-wide association studies: advances and challenges. Nat. Rev. Genet. 13 (8), 576–588. doi: 10.1038/nrg3228
Burgess, S., Butterworth, A., Thompson, S. G. (2013). Mendelian randomization analysis with multiple genetic variants using summarized data. Genet. Epidemiol. 30 (7), 543–552. doi: 10.1002/gepi.21758
Burgess, S., Scott, R. A., Timpson, N. J., Smith, G. D., Thompson, S. G. (2015). Using published data in Mendelian randomization: a blueprint for efficient identification of causal risk factors. Eur. J. Epidemiol. 35 (11), 1880–1906. doi: 10.1007/s10654-015-0011-z
Burgess, S., Dudbridge, F., Thompson, S. G. (2016). Combining information on multiple instrumental variables in Mendelian randomization: comparison of allele score and summarized data methods. Stat. Med. 35 (11), 1880–1906. doi: 10.1002/sim.6835
Cao, Z., Moore, B. T., Wang, Y., Peng, X. H., Lappe, J. M., Recker, R. R., et al. (2014). MiR-422a as a potential cellular microRNA biomarker for postmenopausal osteoporosis. PloS One. 9 (5), e97098. doi: 10.1371/journal.pone.0097098
Davey Smith, G., Ebrahim, S. (2003). “Mendelian randomization”: can genetic epidemiology contribute to understanding environmental determinants of disease? Int. J. Epidemiol. 32 (1), 1–22. doi: 10.1093/ije/dyg070
Davey Smith, G., Hemani, G. (2014). Mendelian randomization: genetic anchors for causal inference in epidemiological studies. Hum. Mol. Genet. 23(R1), R89–R98. doi: 10.1093/hmg/ddu328
Delgado-Calle, J., Fernández, A. F., Sainz, J., Zarrabeitia, M. T., Sañudo, C., García-Renedo, R., et al. (2013). Genome-wide profiling of bone reveals differentially methylated regions in osteoporosis and osteoarthritis. Arthritis Rheumatol. 65 (1), 197–205. doi: 10.1002/art.37753
Deng, H. W., Shen, H., Xu, F. H., Deng, H. Y., Conway, T., Zhang, H. T., et al. (2002). Tests of linkage and/or association of genes for vitamin D receptor, osteocalcin, and parathyroid hormone with bone mineral density. J. Bone Miner Res. 17 (4), 678–686. doi: 10.1359/jbmr.2002.17.4.678
Deng, F. Y., Zhu, W., Zeng, Y., Zhang, J. G., Yu, N., Liu, Y. Z., et al. (2014). Is GSN significant for hip BMD in female Caucasians? Bone. 63, 69–75. doi: 10.1016/j.bone.2014.02.015
Du, Y., Zhao, L.-J., Xu, Q., Wu, K. H., Deng, H.-W. (2017). Socioeconomic status and bone mineral density in adults by race/ethnicity and gender: the Louisiana osteoporosis study. Osteoporos Int. 28 (5), 1699–1709. doi: 10.1007/s00198-017-3951-1
Erez, H. B., Weller, A., Vaisman, N., Kreitler, S. (2012). The relationship of depression, anxiety and stress with low bone mineral density in post-menopausal women. Arch. Osteoporos. 7 (1–2), 247–255. doi: 10.1007/s11657-012-0105-0
Estrada, K., Styrkarsdottir, U., Evangelou, E., Hsu, Y. H., Duncan, E. L., Ntzani, E. E., et al. (2012). Genome-wide meta-analysis identifies 56 bone mineral density loci and reveals 14 loci associated with risk of fracture. Nat. Genet. 44 (5), 491–501. doi: 10.1038/ng.2249
Fan, B., Shepherd, J. A., Levine, M. A., Steinberg, D., Wacker, W., Barden, H. S., et al. (2014). National health and nutrition examination survey whole-body dual-energy X-Ray absorptiometry reference data for GE lunar systems. J. Clin. Densitom. 17(3), 344–377. doi: 10.1016/j.jocd.2013.08.019
Fernandez-Rebollo, E., Eipel, M., Seefried, L., Hoffmann, P., Strathmann, K., Jakob, F., et al. (2018). Primary osteoporosis is not reflected by disease-specific DNA methylation or accelerated epigenetic age in blood. J. Bone Miner Res. 33(2), 356–361. doi: 10.1002/jbmr.3298
Gaunt, T. R., Shihab, H. A., Hemani, G., Min, J. L., Woodward, G., Lyttleton, O., et al. (2016). Systematic identification of genetic influences on methylation across the human life course. Genome Biol. 17, 61. doi: 10.1186/s13059-016-0926-z
Grundberg, E., Meduri, E., Sandling, J. K., Hedman, ÅK, Keildson, S., Buil, A., et al. (2013). Global analysis of DNA methylation variation in adipose tissue from twins reveals links to disease-associated variants in distal regulatory elements. Am. J. Hum. Genet. 93 (5), 876–890. doi: 10.1016/j.ajhg.2013.10.004
Hall, D. B. (2000). Zero-inflated poisson and binomial regression with random effects: a case study. Biometrics. 56 (4), 1030–1039. doi: 10.1111/j.0006-341X.2000.01030.x
He, H., Liu, Y., Tian, Q., Papasian, C. J., Hu, T., Deng, H. W. (2016). Relationship of sarcopenia and body composition with osteoporosis. Osteoporos Int. 27 (2), 473–482. doi: 10.1007/s00198-015-3241-8
Hemani, G., Zheng, J., Elsworth, B., Wade, K. H., Haberland, V., Baird, D., et al. (2018). The MR-Base platform supports systematic causal inference across the human phenome. Elife. 7, e34408. doi: 10.7554/eLife.34408
Hilbe, J. M. (2009). Logistic regression models. (Boca Raton, Forida, USA: Chapman and hall/CRC). doi: 10.1201/9781420075779
Houseman, E. A., Accomando, W. P., Koestler, D. C., Christensen, B. C., Marsit, C. J., Nelson, H. H., et al. (2012). DNA methylation arrays as surrogate measures of cell mixture distribution. BMC Bioinf. 13, 86. doi: 10.1186/1471-2105-13-86
Kanis, J. A., Melton, L. J., Christiansen, C., Johnston, C. C., Khaltaev, N. (1994). The diagnosis of osteoporosis. J. Bone Miner Res. 9 (8), 1137–1141. doi: 10.1002/jbmr.5650090802
Kassahn, K. S., Holmes, O., Nones, K., Patch, A. M., Miller, D. K., Christ, A. N., et al. (2013). Somatic point mutation calling in low cellularity tumors. PloS One. 8 (11), e74380. doi: 10.1371/journal.pone.0074380
Kelly, T. L., Wilson, K. E., Heymsfield, S. B. (2009). Dual energy X-ray absorptiometry body composition reference values from NHANES. PloS One. 4(9), e7038. doi: 10.1371/journal.pone.0007038
Kemp, J. P., Morris, J. A., Medina-Gomez, C., Forgetta, V., Warrington, N. M., Youlten, S. E., et al. (2017). Identification of 153 new loci associated with heel bone mineral density and functional involvement of GPC6 in osteoporosis. Nat. Genet. 49 (10), 1468–1475. doi: 10.1038/ng.3949
Kichaev, G., Yang, W. Y., Lindstrom, S., Hormozdiari, F., Eskin, E., Price, A. L., et al. (2014). Integrating functional data to prioritize causal variants in statistical fine-mapping studies. PloS Genet. 10 (10), e1004722. doi: 10.1371/journal.pgen.1004722
Kichaev, G., Roytman, M., Johnson, R., Eskin, E., Lindström, S., Kraft, P., et al. (2017). Improved methods for multi-trait fine mapping of pleiotropic risk loci. Bioinformatics. 33 (2), 248–255. doi: 10.1093/bioinformatics/btw615
Kim, J., Wang, Z., Heymsfield, S. B., Baumgartner, R. N., Gallagher, D. (2002). Total-body skeletal muscle mass: estimation by a new dual-energy X-ray absorptiometry method. Am. J. Clin. Nutr. 76 (2), 378–383. doi: 10.1093/ajcn/76.2.378
Kim, S., Chen, Z., Chamberlain, N. D., Essani, A. B., Volin, M. V., Amin, M. A., et al. (2014). Ligation of TLR5 promotes myeloid cell infiltration and differentiation into mature osteoclasts in rheumatoid arthritis and experimental arthritis. J. Immunol. 193 (8), 3902–3913. doi: 10.4049/jimmunol.1302998
Klein, H. U., Hebestreit, K. (2016). An evaluation of methods to test predefined genomic regions for differential methylation in bisulfite sequencing data. Brief Bioinform. 17 (5), 796–807. doi: 10.1093/bib/bbv095
Krueger, F., Andrews, S. R. (2011). Bismark: a flexible aligner and methylation caller for Bisulfite-Seq applications. Bioinformatics. 27 (11), 1571–1572. doi: 10.1093/bioinformatics/btr167
Kwok, S. K., Cho, M. L., Park, M. K., Oh, H. J., Park, J. S., Her, Y. M., et al. (2012). Interleukin-21 promotes osteoclastogenesis in humans with rheumatoid arthritis and in mice with collagen-induced arthritis. Arthritis Rheumatol. 64(3), 740–750. doi: 10.1002/art.33390
Li, H., Durbin, R. (2010). Fast and accurate long-read alignment with Burrows-Wheeler transform. Bioinformatics. 26 (5), 589–595. doi: 10.1093/bioinformatics/btp698
Li, H., Handsaker, B., Wysoker, A., Fennell, T., Ruan, J., Homer, N., et al. (2009). The sequence alignment/map format and SAMtools. 25 (16), 2078–2079. Bioinformatics. doi: 10.1093/bioinformatics/btp352
Liu, Y. Z., Dvornyk, V., Lu, Y., Shen, H., Lappe, J. M., Recker, R. R., et al. (2005). A novel pathophysiological mechanism for osteoporosis suggested by an in vivo gene expression study of circulating monocytes. J. Biol. Chem. 280 (32), 29011–29016. doi: 10.1074/jbc.M501164200
Liu, Y., Aryee, M. J., Padyukov, L., Fallin, M. D., Hesselberg, E., Runarsson, A., et al. (2013). Epigenome-wide association data implicate DNA methylation as an intermediary of genetic risk in rheumatoid arthritis. Nat. Biotechnol. 31 (2), 142–147. doi: 10.1038/nbt.2487
Lizio, M., Harshbarger, J., Abugessaisa, I., Noguchi, S., Kondo, A., Severin, J., et al. (2017). Update of the FANTOM web resource: high resolution transcriptome of diverse cell types in mammals. Nucleic Acids Res. 45 (D1), D737–D743. doi: 10.1093/nar/gkw995
MacArthur, J., Bowler, E., Cerezo, M., Gil, L., Hall, P., Hastings, E., et al. (2017). The new NHGRI-EBI Catalog of published genome-wide association studies (GWAS Catalog). Nucleic Acids Res. 45 (D1), D896–D901. doi: 10.1093/nar/gkw1133
Marini, F., Cianferotti, L., Brandi, M. L. (2016). Epigenetic mechanisms in bone biology and osteoporosis: can they drive therapeutic choices? Int. J. Mol. Sci. 17 (8), E1329. doi: 10.3390/ijms17081329
Martin, M. (2011). Cutadapt removes adapter sequences from high-throughput sequencing reads. EMBnet. J. 17 (1), 10. doi: 10.14806/ej.17.1.200
McClay, J. L., Shabalin, A. A., Dozmorov, M. G., Adkins, D. E., Kumar, G., Nerella, S., et al. (2015). High density methylation QTL analysis in human blood via next-generation sequencing of the methylated genomic DNA fraction. Genome Biol. 16, 291. doi: 10.1186/s13059-015-0842-7
McCullagh, P. (2019). Generalized linear models. (Abingdon, UK: Routledge). doi: 10.1201/9780203753736
McKenna, A., Hanna, M., Banks, E., Sivachenko, A., Cibulskis, K., Kernytsky, A., et al. (2010). The genome analysis toolkit: a MapReduce framework for analyzing next-generation DNA sequencing data. Genome Res. 20 (9), 1297–1303. doi: 10.1101/gr.107524.110
McLaren, W., Gil, L., Hunt, S. E., Riat, H. S., Ritchie, G. R. S., Thormann, A., et al. (2016). The ensembl variant effect predictor. Genome Biol. 17, 122. doi: 10.1186/s13059-016-0974-4
Meissner, A., Gnirke, A., Bell, G. W., Ramsahoye, B., Lander, E. S., Jaenisch, R. (2005). Reduced representation bisulfite sequencing for comparative high-resolution DNA methylation analysis. Nucleic Acids Res. 33 (18), 5868–5877. doi: 10.1093/nar/gki901
Morris, J. A., Tsai, P. C., Joehanes, R., Zheng, J., Trajanoska, K., Soerensen, M., et al. (2017). Epigenome-wide association of DNA methylation in whole blood with bone mineral density. J. Bone Miner Res. 32 (8), 1644–1650. doi: 10.1002/jbmr.3148
Morris, J. A., Kemp, J. P., Youlten, S. E., Laurent, L., Logan, J. G., Chai, R. C., et al. (2019). An atlas of genetic influences on osteoporosis in humans and mice. Nat. Genet. 51 (2), 258–266. doi: 10.1038/s41588-018-0302-x
Nagy, Z. B., Gergely, P., Donáth, J., Borgulya, G., Csanád, M., Poór, G. (2008). Gene expression profiling in Paget's disease of bone: upregulation of interferon signaling pathways in pagetic monocytes and lymphocytes. J. Bone Miner Res. 23 (2), 253–259. doi: 10.1359/jbmr.071021
Nose, M., Yamazaki, H., Hagino, H., Morio, Y., Hayashi, S. I., Teshima, R. (2009). Comparison of osteoclast precursors in peripheral blood mononuclear cells from rheumatoid arthritis and osteoporosis patients. J. Bone Miner Metab. 27 (1), 57–65. doi: 10.1007/s00774-008-0011-0
Palmer, T. M., Lawlor, D. A., Harbord, R. M., Sheehan, N. A., Tobias, J. H., Timpson, N. J., et al. (2012). “Using multiple genetic variants as instrumental variables for modifiable risk factors,” Statistical Methods in Medical Research. 21 (3), 223–242. doi: 10.1177/0962280210394459
Parhami, F., Garfinkel, A., Demer, L. L. (2000). Role of lipids in osteoporosis. Arteriosclerosis Thrombosis Vasc. Biol. 20 (11), 2346–2348. doi: 10.1161/01.ATV.20.11.2346
Pierce, B. L., Ahsan, H., Vanderweele, T. J. (2011). Power and instrument strength requirements for Mendelian randomization studies using multiple genetic variants. Int. J. Epidemiol. 40 (3), 740–752. doi: 10.1093/ije/dyq151
Price, E. M., Robinson, W. P. (2018). Adjusting for batch effects in DNA methylation microarray data, a lesson learned. Front. Genet. 16 (9), 83. doi: 10.3389/fgene.2018.00083
Price, A. L., Patterson, N. J., Plenge, R. M., Weinblatt, M. E., Shadick, N. A., Reich, D. (2006). Principal components analysis corrects for stratification in genome-wide association studies. Nat. Genet. 38 (8), 904–909 doi: 10.1038/ng1847
Ralston, S. H., Uitterlinden, A. G. (2010). Genetics of osteoporosis. Endocr. Rev. 31 (5), 629–662. doi: 10.1210/er.2009-0044
Relton, C. L., Davey Smith, G. (2012). Two-step epigenetic mendelian randomization: a strategy for establishing the causal role of epigenetic processes in pathways to disease. Int. J. Epidemiol. 41 (1), 161–176. doi: 10.1093/ije/dyr233
Reppe, S., Lien, T. G., Hsu, Y. H., Gautvik, V. T., Olstad, O. K., Yu, R., et al. (2017). Distinct DNA methylation profiles in bone and blood of osteoporotic and healthy postmenopausal women. Epigenetics. 12 (8), 647–687. doi: 10.1080/15592294.2017.1345832
Richardson, T. G., Zheng, J., Davey Smith, G., Timpson, N. J., Gaunt, T. R., Relton, C. L., et al. (2017). Mendelian randomization analysis identifies CpG sites as putative mediators for genetic influences on cardiovascular disease risk. Am. J. Hum. Genet. 101 (4), 590–602. doi: 10.1016/j.ajhg.2017.09.003
Rivadeneira, F., Styrkársdottir, U., Estrada, K., Halldórsson, B. V., Hsu, Y. H., Richards, J. B., et al. (2009). Twenty bone-mineral-density loci identified by large-scale meta-analysis of genome-wide association studies. Nat. Genet. 41(11), 1199–1206. doi: 10.1038/ng.446
Roadmap Epigenomics Consortium, Kundaje, A., Meuleman, W., Ernst, J., Bilenky, M., Yen, A., et al. (2015). Integrative analysis of 111 reference human epigenomes. Nature 518 (7539), 317–29. doi: 10.1038/nature14248
Sabik, O. L., Farber, C. R. (2017). Using GWAS to identify novel therapeutic targets for osteoporosis. Trans. Res. 181, 15–26. doi: 10.1016/j.trsl.2016.10.009
Schartner, C., Ziegler, C., Schiele, M. A., Kollert, L., Weber, H., Zwanzger, P., et al. (2017). CRHR1 promoter hypomethylation: an epigenetic readout of panic disorder? Eur. Neuropsychopharmacol. 27 (4), 360–371. doi: 10.1016/j.euroneuro.2017.01.005
Shahi, M., Peymani, A., Sahmani, M. (2017). Regulation of bone metabolism. Rep. Biochem. Mol. Biol. 5 (2), 73–82.
Styrkarsdottir, U., Halldorsson, B. V., Gudbjartsson, D. F., Tang, N. L. S., Koh, J. M., Xiao, S. M., et al. (2010). European bone mineral density loci are also associated with BMD in East-Asian populations. PloS One. 5 (10), e13217. doi: 10.1371/journal.pone.0013217
Sun, Y. V., Turner, S. T., Smith, J. A., Hammond, P. I., Lazarus, A., Van De Rostyne, J. L., et al. (2010). Comparison of the DNA methylation profiles of human peripheral blood cells and transformed B-lymphocytes. Hum. Genet. 127 (6), 651–658. doi: 10.1007/s00439-010-0810-y
Sweeney, J., Haslett, J., Parnell, A. C. (2014). The zero & $ N $-inflated binomial distribution with applications. arXiv Prepr arXiv14070064.
van Meurs, J. B. J., Boer, C. G., Lopez-Delgado, L., Riancho, J. A. (2019). Role of epigenomics in bone and cartilage disease. J. Bone Miner Res. 34 (2), 215–230. doi: 10.1002/jbmr.3662
Verbanck, M., Chen, C. Y., Neale, B., Do, R. (2018). Detection of widespread horizontal pleiotropy in causal relationships inferred from Mendelian randomization between complex traits and diseases. Nat. Genet. 50 (5), 693–698. doi: 10.1038/s41588-018-0099-7
Vimaleswaran, K. S., Berry, D. J., Lu, C., Tikkanen, E., Pilz, S., Hiraki, L. T., et al. (2013). Causal relationship between obesity and vitamin D status: bi-directional mendelian randomization analysis of multiple cohorts. PloS Med. 10 (2), e1001383 doi: 10.1371/journal.pmed.1001383
Wahl, S., Drong, A., Lehne, B., Loh, M., Scott, W. R., Kunze, S., et al. (2017). Epigenome-wide association study of body mass index, and the adverse outcomes of adiposity. Nature. 541 (7635), 81–86. doi: 10.1038/nature20784
Wong, K. L., Tai, J. J. Y., Wong, W. C., Han, H., Sem, X., Yeap, W. H., et al. (2011). Gene expression profiling reveals the defining features of the classical, intermediate,and nonclassical human monocyte subsets. Blood. 118(5), e16–e31. doi: 10.1182/blood-2010-12-326355
Wright, F. A., Sullivan, P. F., Brooks, A. I., Zou, F., Sun, W., Xia, K., et al. (2014). Heritability and genomics of gene expression in peripheral blood. Nat. Genet. 46 (5), 430–437. doi: 10.1038/ng.2951
Xing, L., Schwarz, E. M., Boyce, B. F. (2005). Osteoclast precursors, RANKL/RANK, and immunology. Immunol. Rev. 208 (1), 19–29. doi: 10.1111/j.0105-2896.2005.00336.x
Zheng, H., Forgetta, V., Hsu, Y., Estrada, K., Rosello-Diez, A., Leo, P. J., et al. (2015). Whole-genome sequencing identifies EN1 as a determinant of bone density and fracture. Nature 526 (7571), 112–117. doi: 10.1038/nature14878
Zhou, Y., Deng, H. W., Shen, H. (2015). Circulating monocytes: an appropriate model for bone-related study. Osteoporosis Int. 26 (11), 2561–2572 doi: 10.1007/s00198-015-3250-7
Zhou, Y., Zhou, B., Pache, L., Chang, M., Khodabakhshi, A. H., Tanaseichuk, O., et al. (2019). Metascape provides a biologist-oriented resource for the analysis of systems-level datasets. Nat. Commun. 10 (1), 1523. doi: 10.1038/s41467-019-09234-6
Zhou, X., Qiu, Y. H., He, P., Jiang, F., Wu, L. F., Lu, X., et al. (2019). Why SNP rs227584 is associated with human BMD and fracture risk? A molecular and cellular study in bone cells. J. Cell Mol. Med. 23 (2), 898–907. doi: 10.1111/jcmm.13991
Zhu, Z., Zhang, F., Hu, H., Bakshi, A., Robinson, M. R., Powell, J. E., et al. (2016). Integration of summary data from GWAS and eQTL studies predicts complex trait gene targets. Nat. Genet. 48 (5), 481–487. doi: 10.1038/ng.3538
Keywords: osteoporosis, bone mineral density, causal inference, Mendelian randomization, DNA methylation, epigenome-wide association
Citation: Yu F, Qiu C, Xu C, Tian Q, Zhao L-J, Wu L, Deng H-W and Shen H (2020) Mendelian Randomization Identifies CpG Methylation Sites With Mediation Effects for Genetic Influences on BMD in Peripheral Blood Monocytes. Front. Genet. 11:60. doi: 10.3389/fgene.2020.00060
Received: 14 October 2019; Accepted: 17 January 2020;
Published: 28 February 2020.
Edited by:
Hui Guo, University of Manchester, United KingdomReviewed by:
Fengbiao Mao, University of Michigan, United StatesXiaojian Shao, National Research Council Canada (NRC-CNRC), Canada
Copyright © 2020 Yu, Qiu, Xu, Tian, Zhao, Wu, Deng and Shen. This is an open-access article distributed under the terms of the Creative Commons Attribution License (CC BY). The use, distribution or reproduction in other forums is permitted, provided the original author(s) and the copyright owner(s) are credited and that the original publication in this journal is cited, in accordance with accepted academic practice. No use, distribution or reproduction is permitted which does not comply with these terms.
*Correspondence: Hui Shen, hshen3@tulane.edu