The effects of displaying availability sections of an automated driving function
 Simon Danner
 Alexander Feierle
 Sebastian Gary
 Klaus Bengler
- 1Chair of Ergonomics, Technical University of Munich, Garching, Germany
- 2Department of Psychology, University of Würzburg, Würzburg, Germany
So far, there has been little research into displaying the availability of a higher-level automated driving system. The benefits of presenting availability times while driving automatically have already been discussed, but there are no findings on giving information on all availability sections (operational design domains) independent of the current state of the automated driving system. This work aims to close this gap by conducting a driving simulator study with N = 54 participants to verify whether an overview display of all the road sections on which automated driving is possible has a positive effect on the participants’ acceptance, usability, workload, and task performances. Results showed that the presentation of this additional information had a significantly positive influence on both acceptance and task performance. The outcomes of this work indicate that the required transparency-creating information of the automated driving system should not be limited to safety-related information or the phases of automated driving itself.
Highlights
• Displaying the availability sections of an ADS improves the acceptance ratings of the system significantly.
• Displaying the availability sections of an ADS does not affect usability and workload ratings.
• Displaying the availability sections of an ADS improves the task performance in NDRAs significantly.
1 Introduction
With the introduction of SAE Level 3 automated driving system (ADS), users will have the possibility to conduct non-driving related activities (NDRAs) since they are no longer obligated to observe the system and the environment (SAE, 2021). Several studies have investigated people’s expectations and attitudes towards ADS. Regarding negative expectations, study participants seem to fear ambiguous liability matters, feelings of loss of control, security compromises, and problems with data protection and privacy (Howard and Dai, 2013). Higher costs for purchasing vehicles equipped with an ADS might also reduce the perceived benefit of this technology (Fagnant and Kockelman, 2015). On the other hand, positive expectations include increased traffic safety and improved comfort (Howard and Dai, 2013), greater efficiency (Schoettle and Sivak, 2014), the possibility of conducting NDRAs (Howard and Dai, 2013; Pfleging et al., 2016; Nielsen et al., 2018), and arriving relaxed at the destination (Nielsen et al., 2018). However, before these benefits of such systems can be realised, they must be accepted and exploited. Therefore, users need to understand these systems in order to accept them (Adell et al., 2018), since wrong assumptions on ADS and its limitations might result in critical driving situations or could even prevent users from activating the system (Josten et al., 2018). Hence, it is important to know users’ information needs regarding an ADS.
Several studies have been carried out to collect or evaluate information needs (Beggiato et al., 2015; Feierle et al., 2020a), but mainly focusing on the period of automated driving and safety or driving-related information. Since Level 3 and Level 4 automated driving require certain conditions to be met before an ADS can be activated (SAE, 2021), there will always be sections of the journey where ADS is not available and manual driving is required. Nevertheless, information needs regarding ADS during manual driving have hardly been investigated so far. One exploratory study (Danner et al., 2020b) consisting of a focus group discussion with automated driving experts and a driving simulator study with laypersons collected information on this topic, leading to the results that future users might need information on the availability duration of the ADS when it is available but still not activated. Furthermore, when the ADS is not available, information on the reasons for non-availability and the duration until the ADS is available might be helpful. Therefore, an overview of all availability sections on the own route should be displayed in any system state, i.e., when ADS is not available or when it is available but not activated or activated. In this work, the information regarding the availability sections was evaluated. Tests were performed to see whether the presentation of the sections improved the system’s subjective ratings and whether the planning ability or the performance concerning NDRAs was increased by displaying this information.
1.1 Acceptance and usefulness of ADS
The postulated advantages of ADS, such as increased convenience or usefulness due to the possibility of executing NDRAs (König and Neumayr, 2017), can only come to fruition if the system is used (Naujoks et al., 2017a). Unfortunately, since ADSs with SAE Level 3 or 4 (SAE, 2021) are not yet commercially available and thus no data on usage is present, it is impossible to measure the usage behaviour of these systems in dependency of certain variables. However, some models can predict the use of technical innovations. One of these is the Technology Acceptance Model by Davis, which consists of two factors, perceived ease of use (PEoU) and perceived usefulness (PU), predicting behavioural intention (BI) and thus actual system usage (Davis, 1989). Acceptance is defined as the willingness to use technological systems when available (Adell et al., 2018). The effects of PEoU and PU on BI were found to be significant (Roberts et al., 2012) in a driving simulator experiment exploring acceptance towards advanced driving assistance systems (ADAS). In another study, the TAM constructs accounted for 82% of the variance in intentions to use ADAS (Rahman et al., 2017) and are thus suitable for investigating the acceptance of an ADS (Buckley et al., 2018).
Conducting NDRAs seems to be one of the main reasons for using an ADS. In an exploratory study, it was shown that study participants would be most likely to activate an ADS to perform NDRAs, while the main reason for choosing manual driving seems to be the ability to drive faster than the ADS would (Danner et al., 2020b). Another study showed that conducting NDRAs is the second most important advantage of an ADS, with the most important one being the enhanced mobility access for the disabled and elderly (König and Neumayr, 2017). According to one survey, typical NDRAs while driving automatically could be watching the road, reading, texting, watching movies, and playing games (Pfleging et al., 2016). Similar activities were conducted in a driving simulator study exploring NDRAs (Hecht et al., 2020b). Participants watched videos or movies, looked at their surroundings, used their smartphones or laptops, and read. It became apparent that these activities can take up different amounts of time. Watching videos, for example, took an average of about 18 min, while cell phone usage had an average duration of about 2 minutes. Furthermore, factors such as privacy, comfort, travel purpose, age and trip duration were found to influence the perceived attractiveness of certain NDRAs during an automated ride (Hecht et al., 2020a).
Since the possibility of conducting NDRAs is one of the most important advantages of ADS, the usefulness and acceptance (Venkatesh et al., 2000) of such systems might depend on how satisfactorily and easily such activities can be pursued during automated driving. Furthermore, the fact that different NDRAs vary in terms of duration (Hecht et al., 2020b) and that the ADSs of SAE Level 3 and 4 only are available if all conditions are met (SAE, 2021), it might be necessary for users to be informed about the availability duration of the ADS so that they can plan their NDRAs accordingly.
1.2 Human-machine interfaces regarding the availability of ADS
At this time, few studies have developed and tested human-machine interface (HMI) concepts that addressed the availability of an ADS. However, Richardson et al. (2018) compared the effects of three HMIs on acceptance using the van der Laan acceptance scale (van der Laan et al., 1997) in an experiment where truck drivers were the participants. The display concepts differed in terms of availability information. There was no additional information in the first concept; in the second concept, the remaining availability was displayed in minutes and in the third concept it was displayed in kilometres. The concepts providing additional information were rated significantly better than the first concept regarding satisfaction, one dimension of the van der Laan acceptance scale (van der Laan et al., 1997). The same results were found for usefulness, the other dimension of the van der Laan acceptance scale (van der Laan et al., 1997), with the difference that there was also an effect for the comparison between the second and third concept, with the concept using time for displaying the availability being rated significantly more useful (Richardson et al., 2018).
Wandtner et al. (2018) were able to show that an overview display of ADS availabilities led to far fewer tasks being begun before participants had to resume the driving task. In another study (Hecht et al., 2020c), it was found out that the frequency of transitions between automated and manual driving had a negative effect on workload and acceptance and that the display of remaining availability in automated driving had no effect on acceptance. In this study, ADS availability was only displayed when the ADS was active. In contrast, a further study (Danner et al., 2020a) showed that displaying the availability duration of the ADS when it was available—but not active—improved acceptance, usability, and workload. Moreover, when the ADS was unavailable, displaying the duration until it became available increased the perceived system understanding (Danner et al., 2021). Finally, regarding the method of presenting the ADS availability time, a dynamic time bar was shown to lead to significantly more usability than a countdown (Holländer and Pfleging, 2018).
1.3 Displaying availability sections to improve acceptance, usability, workload, and task performance
In order to avoid automation surprises, which means the vehicle’s actions are inconsistent with the user’s expectations, an SAE Level 3 and 4 system needs to inform the user of sections where it cannot cope and even provide a preview of the upcoming route, including system limitations (Carsten and Martens, 2018). Furthermore, the discrepancy between users’ mental models and the system’s behaviour—the gulf of evaluation (Norman, 2013)—can lead to a reduction in trust (Lee and See, 2004), while trust is seen as a precondition of the intention to use automation and ADS (Parasuraman and Riley, 1997; Choi and Ji, 2015). Furthermore, the additional information on the availability sections should help users plan and perform their NDRAs, which could improve the usefulness and ease of use of the system, both being dimensions of acceptance (Davis, 1989). Therefore, the following hypothesis was tested in this study.H1: Participants rate acceptance of the ADS higher when the availability sections of the ADS are displayed.
Displaying the availability of an ADS before activation and providing information on the remaining availability duration during automatic driving increases usability (Holländer and Pfleging, 2018; Danner et al., 2020a). Usability is the extent to which a user can perform a specific task with effectiveness, satisfaction and efficiency (ISO 9241-11, 2018). The presentation of the availability sections should help the participants use the automation HMI (Bengler et al., 2020) for planning and conducting their NDRAs, and hence the following hypothesis was investigated.H2: Participants rate the usability of the HMI of the ADS higher when the availability sections of the ADS are displayed.
The discrepancy between the users’ expectations and reality increases the mental workload since the mental models have to be adapted to information perceived from the system and the environment (Beggiato and Krems, 2013). Moreover, it could be shown that inexperienced users mistakenly tend to expect constant availability (Danner et al., 2020b), while presenting the availability duration before activation can reduce workload (Danner et al., 2020a). Consequently, the following was hypothesised.H3: Participants rate the workload lower when the availability sections of the ADS are displayed.
Since displaying the availability sections of the ADS informs the participants about when and how long NDRAs can be conducted, the task performance of activities with a specific and known duration should be increased, especially since this knowledge could help prevent interruptions, which can worsen performance and lead to decreased task duration (Bailey and Konstan, 2006).H4: Participants score higher in NDRAs when the availability sections of the ADS are displayed.
Furthermore, it was investigated whether the way in which the availability sections are displayed influences the measures from hypotheses one to four. As most drivers today are familiar with map displays in the CID, participants might prefer the MC. Nonetheless, the AC was developed to be clearer and faster to retrieve information from, and therefore the following non-directed hypothesis was tested.H5: The way of displaying the availability section (AC vs. MC) influences the subjective ratings as well as the task performance in NDRAs.
2 Materials and methods
2.1 Study design
A between-subject design was chosen to test the hypotheses. Three different HMI concepts served as the between-factor, and therefore, every study participant experienced only one concept during the study. The concepts differed only regarding the information on the availability of the ADS. One concept, the baseline concept, did not contain any information on the availability sections’ distribution. The second displayed the availability sections in an abstract time bar, and the third displayed the sections directly on the navigation map. In all concepts, the participants were given information about the duration of the current section, i.e., about the duration of availability and non-availability. Participants were instructed to follow the traffic rules and to activate the ADS when it was available. The participants were asked to complete various tasks displayed on a 12-inch tablet installed in the centre console when the ADS was active. When a task had been completed, the participants received points, but they did not when a task was not completed. The participants were informed that their goal was to collect as many points as possible in this study. Each task was given an estimated time duration, which could be compared with the availability times of the ADS. Therefore, participants were able to anticipate whether they can finish a task without being interrupted or not. The tasks were shown in an overview display on the tablet. This enabled participants to choose which tasks they would complete and when. Apart from the objective of working through the tasks when the ADS was activated, participants were allowed a free highway drive of about 50, 34 mins of which were with automated driving.
2.2 Driving simulator
The study took place on a fixed-base driving simulator at AUDI AG consisting of a full car mock-up and several screens for the front view (see Figure 1). The mirrors were also equipped with displays to simulate the rear view. The Virtual Test Drive software application was used to program the roads and the environment.
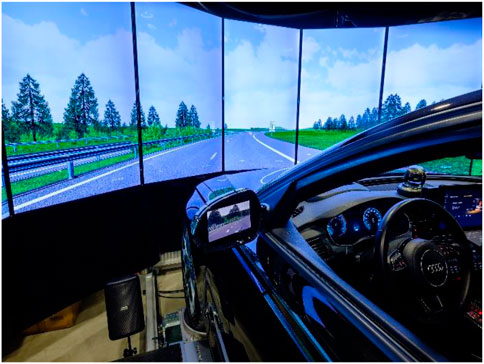
FIGURE 1. Static driving simulator.
2.3 Human-machine interface
Three HMI concepts were created, serving as a between-factor. The baseline concept (BC) contained information in the instrument cluster (IC), such as velocity, RPM, and whether the ADS was unavailable, available, or active, using an icon symbolizing automated driving. When the ADS was unavailable, the time when it would become available was shown. Likewise, the duration of availability was displayed when the ADS was available or active. In the central information display (CID), a virtual map indicating the road course was shown independent of the condition. The BC did not contain any further information and its respective CID is depicted in Figure 2.
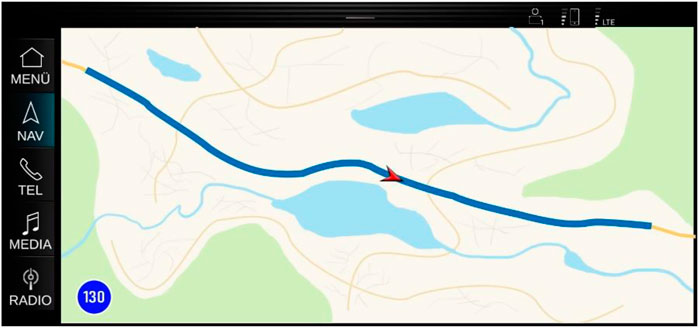
FIGURE 2. Baseline concept, providing no information on the availability sections.
In the second HMI concept (see Figure 3), an additional abstract time bar was displayed in the CID, providing information on the availability (abstract concept; AC) sections. Its design was mainly influenced by the HMI evaluated in Wandtner et al. (2018) where a similar color separated bar was used for displaying ODDs. A legend was presented next to the availability bar indicating that white rectangles presented availability periods and grey rectangles periods where participants could not use the ADS. The IC contained the same information as in the BC.
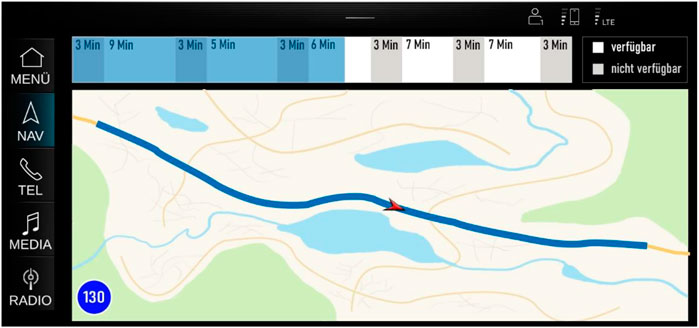
FIGURE 3. AC, providing information on the availability sections in an abstract time bar.
In the third concept (see Figure 4), the information on the availability sections was directly shown on the map (map concept; MC) with the same colour coding of the availability sections as in the AC. The design of MC was chosen as a more intuitive approach to the same information since most drivers are familiar with the presentation of driving sections in the navigation system. The aim was to investigate whether the content of the HMI leads to a better understanding of the availability and this way the risk of participants not understanding the concepts was minimized. Figure 5 shows a graphical presentation of how the different displays were arranged in the cockpit.
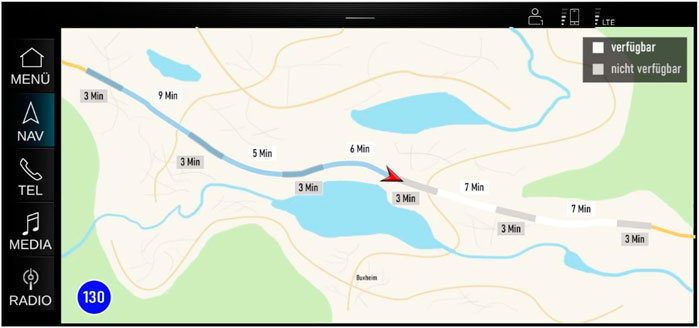
FIGURE 4. MC, providing information on the availability sections on the map.

FIGURE 5. Graphical presentation of the cockpit. Display 1 is the IC and display 2 the CID.
2.4 Non-driving related activity
An app was developed for the NDRA using Python. This application consisted of a start screen (see Figure 6, the language of the app was German in the study), giving an overview of all the tasks that could be conducted, along with an estimated duration for each task. Participants were instructed to collect as many points as possible but not to conduct any NDRAs while driving manually. Furthermore, they were instructed to finish started activities since points were only awarded for completed tasks. Interrupting an NDRA and finishing it during the next availability section was allowed. The points were calculated based on the duration of each task, meaning that a 6-min task accounted for six points. The points gained were displayed on the start screen.
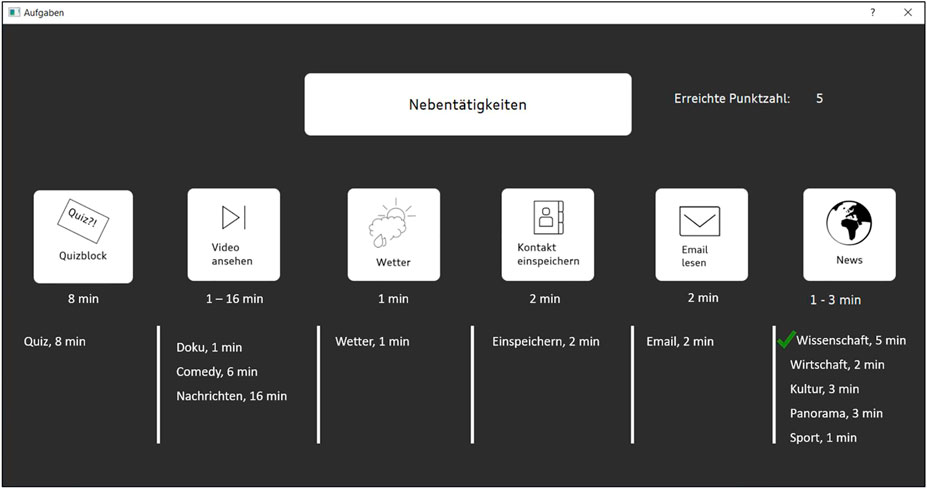
FIGURE 6. Overview screen of the NDRA application.
The tasks chosen for this study were derived from studies investigating potential NDRAs while driving automatically (Hecht et al., 2020b) and thus work-related and entertainment-related activities were available. The participants could choose to take part in quizzes, watch videos, read an e-mail, check the weather, save a contact from a displayed business card and read news articles. The videos, for example, were viewed as completed when the whole duration had been watched; fast-forward or skipping was not possible. After reading e-mails, checking the weather, and reading the news articles, questions were asked to assure that participants had actually performed the task. Points were given when the questions were answered correctly. The points for saving the contact were earned depending on the correctness of the input. There were more tasks to perform than the total availability duration would allow, giving the participants the freedom to choose those tasks they wanted to conduct most.
All the answers were saved and the points were calculated in more detail while analysing the data. Participants were given ten points towards the total for each task for each correct answer or input. This sum was then scaled so that the maximum points attainable were the task duration times ten. Participants received as many points as the video lasted (in minutes times ten) for each finished video. This way, it was possible to calculate the correct points for tasks where the number of inputs was not the same as the number of minutes.
2.5 Procedure
Participants were welcomed and taught about the purpose of the study and any privacy-related issues. The pre-experience and demographic questionnaire were completed once written consent to participate in the study had been given. Then, participants underwent a 10-min familiarisation drive in the driving simulator in which they experienced the manual drive, automated drive, activation of the ADS, and Requests to Intervene (RtIs). They were also able to try the NDRAs on a trial basis to get used to the tablet and navigate through the app. The familiarisation drive was followed by the experimental drive, in which participants experienced one of the concepts described and conducted the NDRAs. The experimental drive took about 52 mins with 34 mins of available automation and only short interruptions of about 3 mins between the sections where automated driving was possible. Figures 3, 4 show how the availability was distributed.
After completing the experimental drive, the participants filled out the questionnaires and were subjected to a brief qualitative interview. At the end of the study, participants were shown all three concepts and asked to state which of the concepts they liked the most. Furthermore, they were asked to explain their preference.
2.6 Study sample
A total of N = 54 participants (24 of them female) took part in the study, but one test person had to be excluded for technical reasons. The mean age was M = 37.6 years (SD = 14.4 years); all the participants had a valid driver’s licence. The mean annual mileage was M = 18.365 km (SD = 13.318.2 km); forty-five (83%) of the participants had already taken part in one or more driving simulator studies. Five (9%) of the participants worked in an occupation related to automated driving. The mean age for the BC group was M = 34.94 (SD = 14.30) and it consisted of ten men and eight women. The mean annual mileage was M = 2,311 km (SD = 18642.5 km). The mean age in the AC group was M = 39.50 (SD = 12.82) and it consisted of nine men and nine women. The annual mileage was M = 17027.8 km (SD = 9419.9 km). The mean age in the MC group was M = 38.24 (SD = 18.36) and it consisted of ten men and seven women. The annual mileage was M = 14531.3 km (SD = 5702.2 km). Most of the participants (85.9%) have already taken part in one or more driving simulator studies and 9.4% stated to work or have worked in automated driving. The participants were recruited by an external, independent company and were compensated with 70 € for taking part in this study.
2.7 Measures
Van der Laan’s acceptance scale (van der Laan et al., 1997) with semantic differential was used to test the system’s acceptability; participants rated nine items on a 5-point rating scale (from pleasant to unpleasant), with the scale ranging from −2 to 2. The acceptability scale consists of two dimensions—usefulness and satisfaction. Before completing this questionnaire, the participants were instructed to rate the ADS as they have experienced it, and not only the HMI-concept.
Usability was tested using the System Usability Scale (Brooke, 1996), which consists of ten items rated on a 5-point Likert scale (e.g., “I think I would like to use this system frequently”). The single answers were summed to create a usability score ranging from 0–100. The participants were asked to rate the usability of the respective HMI-concept and not of the ADS in total.
To measure the subjective workload, we used the NASA-rTLX (Hart, 2006), the revised version of the NASA-TLX. This questionnaire consists of six items rated on a scale, with 21 response options ranging from 0 to 20. The questionnaire also comprises the dimensions of mental demand, physical demand, temporal demand, overall performance, effort, and frustration.
Task performance was determined by assigning points for task completion in the NDRA app. The longer the task duration was indicated, the greater the maximum number of points to be scored. Points were not awarded until an activity had been completed. Furthermore, points were deducted for errors. If participants had used every minute of the automated driving segments to perform and complete NDRAs, the maximum score achievable would have been 340.
2.8 Statistical analysis
For testing directed hypotheses, a priori contrast analyses were calculated using R. This tool allows combined and straightforward comparisons between groups, while more statistical power is achieved than with an analysis of variances (ANOVA) (Field et al., 2013). The contrast weights were defined as orthogonal, as shown in Table 1. The first contrast is a combined comparison between BC and the concepts providing information on the availability sections and the second contrast compares group two and group three—therefore, AC versus MC. An ANOVA was calculated for non-directed hypotheses. The assumption of normal distribution was not tested since ANOVA is viewed as robust against violations of this prerequisite (Blanca et al., 2017). The critical alpha value tested against was set at 0.05.
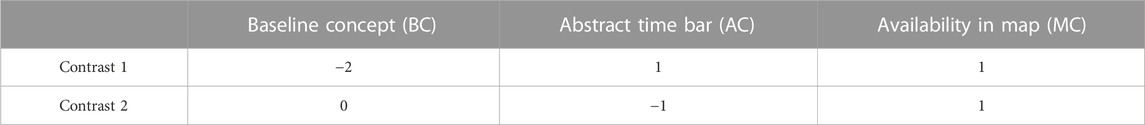
TABLE 1. Orthogonal contrasts used for contrast analysis.
3 Results
3.1 Acceptance
A planned contrast analysis with orthogonal contrasts was conducted to test H1. Before that, the assumption of variance homogeneity was tested, and the Levene test did not show any violations (p > 0.05). Internal consistency reliability was calculated using McDonald’s ω with a point estimate of ω = 0.74 and 0.54 as the lower and 0.84 as the upper bound of the 95% confidence interval.
The contrast analysis showed a significant effect for the first contrast that compared BC (M = 1.16, SD = 0.41) with the two concepts providing information on the availability sections combined (M = 1.38, SD = 0.36), p = 0.02, with a moderate effect size (d = 0.58). The descriptive values can be found in Table 2. On the other hand, no significant effects were found for the second contrast comparing the AC (M = 1.33, SD = 0.40) and the MC (M = 1.44, SD = 0.32), p = 0.39 (see Figure 7).
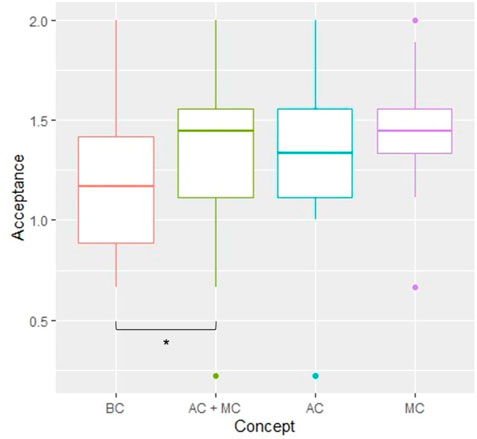
FIGURE 7. Boxplots for the acceptance scores dependent on the HMI concepts. * marks significant differences.
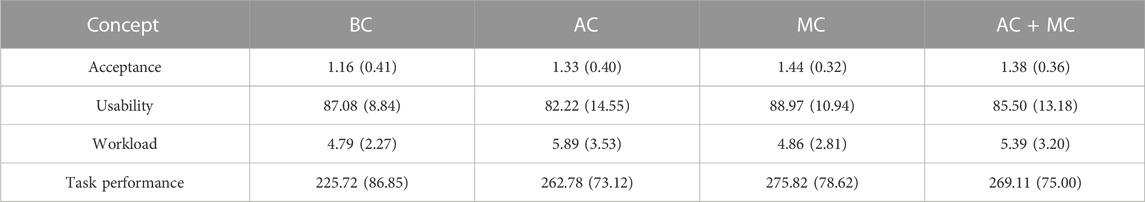
TABLE 2. Descriptive statistics M(SD).
3.2 Usability
H2 was also tested using planned contrasts after checking that the assumed homogeneity of variances was not violated (p > 0.05). Internal consistency reliability was calculated with a result of McDonald’s ω = 0.82, with a lower bound of the 95% confidence interval of 0.67 and an upper bound of 0.89. No significant effects were found for the first contrast comparing the BC (M = 87.08, SD = 8.84) with the two other concepts combined (M = 85.50, SD = 13.18), p = 0.33. Furthermore, no significant effect was found to compare the AC (M = 82.22, SD = 14.55) and the MC (M = 88.97, SD = 10.94), p = 0.09 (see Figure 8).
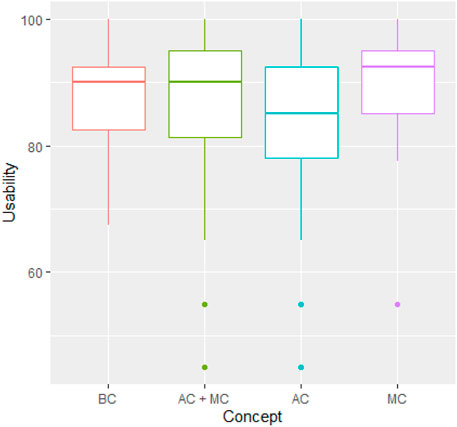
FIGURE 8. Boxplots for the usability scores depending on the HMI concepts.
3.3 Workload
The contrasts presented were used to test H3 (see Table 1). The results of the contrast analysis can be interpreted since the Levene test did not reveal any violation of the homogeneity of variances (p > 0.05). Internal consistency reliability was calculated with a result of McDonald’s ω = 0.83, with a lower bound of the 95% confidence interval of 0.73 and an upper bound of 0.90. No significant effects were found for the first contrast (BC: M = 4.79, SD = 2.27; AC + MC: M = 5.39, SD = 3.20), p = 0.49. Furthermore, no effect was revealed for comparing AC (M = 5.89, SD = 3.52) and MC (M = 4.86, SD = 2.81), p = 0.30 (see Figure 9).
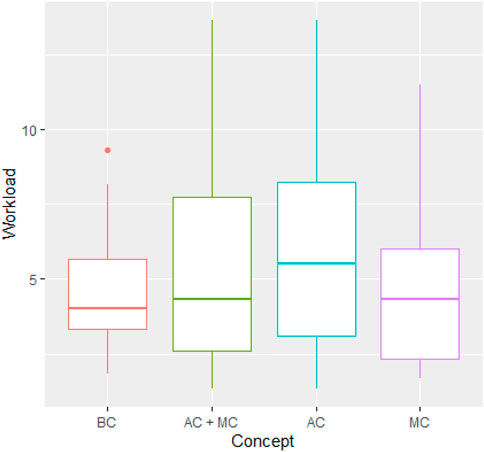
FIGURE 9. Boxplots for the workload scores depending on the HMI concepts.
3.4 Task performance
It was hypothesised that task performance is increased by providing information on the availability section. No violation of variance homogeneity was found (p = 0.05), so the contrast analysis was calculated. The first contrast revealed a significant effect for comparing BC (M = 225.72, SD = 86.85) and the combined values of AC and MC (M = 269.11, SD = 75.00), p = 0.03, d = 0.55. No significant effect was found for comparing AC (M = 262.78, SD = 73.12) and MC (M = 275.82, SD = 78.62), p = 0.78 (see Figure 10).
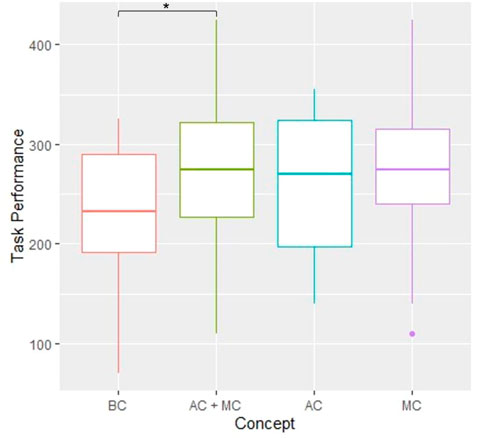
FIGURE 10. Boxplots for the task performance depending on the HMI concepts. * marks significant differences.
3.5 Qualitative ratings of the concepts
After finishing the experimental drive and completing all questionnaires, the participants were shown all three HMI-concepts and asked, which one they would prefer and why. The MC was preferred by 54.9% of the participants, 50.0% of whom stated they preferred this concept because all information was at one place. Other reasons mentioned by participants were that this concept was clearer, that the presentation resembled current navigation systems, and that they frequently used maps which made this concept more intuitive.
The AC received the second highest rating with 39.2% of the participants preferring this concept, 75.0% of whom stated that they preferred this concept to due its clarity. Other participants mentioned that this display was better for planning NDRAs or that it was less distracting as information on availability could be retrieved faster than when using the MC.
Only 5.9% of the customers preferred the BC. All of them stated that the information in the IC was already sufficient.
4 Discussion
The study aimed to investigate the effects of displaying all the SAE Level 3 ADS availability sections on one’s route on acceptance, usability, workload and task performance. Additionally, the method for displaying this information was tested using a between-subjects design with different HMI concepts.
The results indicate that providing information on availability sections increases the acceptance of the ADS, while the display method has no effects. Since one of the main reasons for automated driving is the opportunity to conduct NDRAs (König and Neumayr, 2017; Danner et al., 2020b), the information on availability increasing the planning ability might explain the increased acceptance since the usefulness of ADS is increased—especially in terms of the conduct of NDRAs. Furthermore, no significant effects were found to compare different ways of displaying the availability sections. Therefore, it can be concluded that the information itself and not, for example, the changed design leads to increased acceptance.
No significant effects were discovered regarding usability, neither for the information content nor for the form of displaying the information. There is a tendency towards lower usability in the AC condition in comparison to BC and MC conditions, which the novelty of this display could explain. The BC and MC concepts both display only a navigation map, one without and the other with information on availability, and this kind of presentation should be known to most of the participants and could positively influence the perceived usability.
A similar pattern was found for the results of the workload questionnaire. No significant effects were present but a small tendency towards higher workload for the AC condition, which might again result from the novelty of the display. Another reason could be that participants wanted to map the availability sections from the bar to the route course, which could have needed a greater effort. Nonetheless, the non-existent significance indicates that the additional information does not negatively influence cognitive workload. On the other hand, in this study, the information did not decrease the workload, which might be explained by the availability information in the IC, which was presented in every condition. Here, the duration of the current phase was given, i.e., the remaining availability duration or the duration until the automation was available. Consequently, the increased foresight induced by the AC and MC did not decrease the workload as the information on the current availability phase presented in all conditions might have prevented unexpected interruptions of the NDRAs, which in turn could have led to an increase in workload (Naujoks et al., 2017b; Weigl et al., 2012).
One significant effect was found regarding the information content for the dependent variable task performance. Participants who experienced AC or MC achieved significantly more points in the NDRA than participants who experienced BC. However, no difference was found for the comparison between AC and MC. These results indicate that participants can perform non-driving related tasks more efficiently when they know about all the availability sections on the route. This is especially interesting since all the participants knew the availability duration for the existing section, even in the BC condition.
Most of the participants stated they would have preferred the MC, followed by the AC. This is in accordance with the slightly better average scores in the subjective questionnaires of the MC, even though these differences were not significant.
4.1 Conclusion
This work gives valuable insights into the users’ information needs relating to ADS. Thus far, several information needs for highly automated driving and the means of displaying them have been investigated. These include ambient lights (Feierle et al., 2020b), system status, speed, speed limits, navigation information (Feierle et al., 2020a), manoeuvres and reasons for manoeuvres (Feierle et al., 2020a; Beggiato et al., 2015). Furthermore, information on the remaining automated driving time (Naujoks et al., 2017b; Holländer and Pfleging, 2018; Hecht et al., 2020c) and on the duration of the automated drive before activation of the ADS (Danner et al., 2020a) were shown to help study participants. This study contributes to the literature on HMIs regarding ADSs by adding one important information need to the list of requirements when designing display concepts for automated vehicles. As it could be shown, creating transparency regarding the functionality of an ADS by presenting an overview of the availability on the driver’s own route is a new approach that could increase acceptance, associated with actual usage behaviour (Venkatesh et al., 2003) and NDRA performance. Considering the importance of NDRAs for the usefulness of ADS (König and Neumayr, 2017; Danner et al., 2020b), the latter insight is of particular importance.
Even though some significant effects were found, generalizing the results should be done with caution since a very specific situation was tested in this study with participants having a number of different tasks to complete in restricted amounts of time, which will not always be the case when using ADSs in reality. In the next section, the limitations of this work are discussed and suggestions for future studies are made.
4.2 Limitations and future studies
The study was conducted in a driving simulator, and therefore the results cannot be readily generalised. The participants might have acted differently in actual driving environments. In addition, the study director observed the participants, so it cannot be ruled out that they would have behaved differently in a private, unobserved setting. Nonetheless, it seems that subjective ratings between naturalistic automated driving studies and those conducted in driving simulators do not differ significantly (Eriksson and Stanton, 2017). Furthermore, the NDRAs used in this study were artificial, and therefore future studies should investigate how displaying the availability sections influences the performance in tasks participants actually want or need to conduct. Moreover, analysing the results of this study would have profited of detailed information on which NDRA was conducted for how long as well as of eye-tracking data. Future studies should include objective data like these.
Additionally, safety related data would have been interesting and important when it comes to evaluate the adequacy of the HMI displays. Future studies should consider measures like take-over time or general take-over performance as well as manual driving performance after using the ADS along with the respective HMI concepts. This way it could be tested if one of the HMI-concepts negatively influences the ability to operate the system or the vehicle.
This study did not investigate the technical feasibility of the concepts and solely focused on the prototypical HMI design and the impact of additional information on participants’ ratings of the system and task performance in NDRAs. Future studies should investigate which technical criteria must be fulfilled for displaying this information. The design of the MC might have also been a limitation in this study since the “bird view” chosen in this experiment is not necessarily the kind of map display drivers are used to in current navigation systems.
Data availability statement
The raw data supporting the conclusion of this article will be made available by the authors, without undue reservation.
Ethics statement
The studies involving human participants were reviewed and approved by Ethics commission of the Technical University of Munich. The patients/participants provided their written informed consent to participate in this study.
Author contributions
SD: conceptualization; data curation; formal analysis; methodology; writing—original draft; writing—review and editing. AF: conceptualization; writing—original draft; writing—review and editing. SG: conceptualization; methodology; investigation; software. KB: funding acquisition; project administration; supervision; writing—review and editing.
Funding
The authors declare that this study received funding from AUDI AG. The funder was not involved in the study design, collection, analysis, interpretation of data, the writing of this article, or the decision to submit it for publication. Open access publication is funded by the library of the Technical University of Munich.
Conflict of interest
The authors declare that the research was conducted in the absence of any commercial or financial relationships that could be construed as a potential conflict of interest.
Publisher’s note
All claims expressed in this article are solely those of the authors and do not necessarily represent those of their affiliated organizations, or those of the publisher, the editors and the reviewers. Any product that may be evaluated in this article, or claim that may be made by its manufacturer, is not guaranteed or endorsed by the publisher.
References
Adell, E., Várhelyi, A., and Nilsson, L. (2018). “The definition of acceptance and acceptability,” in Driver acceptance of new technology. Editors M. A. Regan, T. Horberry, and A. Stevens (Boca Raton, Florida: CRC Press), 11–22.
Bailey, B. P., and Konstan, Joseph A. (2006). On the need for attention-aware systems: Measuring effects of interruption on task performance, error rate, and affective state. Comput. Hum. Behav. 22 (4), 685–708. doi:10.1016/j.chb.2005.12.009
Beggiato, M., and Krems, J. F. (2013). The evolution of mental model, trust and acceptance of adaptive cruise control in relation to initial information. Transp. Res. Part F Traffic Psychol. Behav. 18, 47–57. doi:10.1016/j.trf.2012.12.006
Beggiato, M., Hartwich, F., Schleinitz, K., Krems, J., Othersen, I., and Petermann-Stock, I. (2015). “What would drivers like to know during automated driving? Information needs at different levels of automation,” in 7th conference on driver assistance. doi:10.13140/RG.2.1.2462.6007
Bengler, K., Rettenmaier, M., Fritz, N., and Feierle, A. (2020). From HMI to HMIs: Towards an HMI framework for automated driving. Information 11 (2), 61. doi:10.3390/info11020061,info11020061
Blanca, M. J., Alarcón, R., Arnau, J., Bono, R., and Bendayan, R. (2017). Non-normal data: Is ANOVA still a valid option? Psicothema 29 (4), 552–557. psicothema2016.383. doi:10.7334/psicothema2016.383
Brooke, J. (1996). “SUS: A "quick and dirty" usability scale,” in Usability evaluation in industry. Editors Patrick W. Jordan, B. Thomas, and I. L. McClelland (Boca Raton: Chapman and Hall, CRC).
Buckley, L., Kaye, S. A., and Pradhan, A. K. (2018). Psychosocial factors associated with intended use of automated vehicles: A simulated driving study. Accid. analysis Prev. 115, 202–208. doi:10.1016/j.aap.2018.03.021
Carsten, O., and Martens, M. H. (2018). How can humans understand their automated cars? HMI principles, problems and solutions. Cognition, Technol. Work 29 (6), 3–20. doi:10.1007/s10111-018-0484-0
Choi, J. K., and Ji, Y. G. (2015). Investigating the importance of trust on adopting an autonomous vehicle. Int. J. Human-Computer Interact. 31 (10), 692–702. doi:10.1080/10447318.2015.1070549
Danner, S., Hecht, T., Steidl, B., and Bengler, K. (2021). “Why is the automation not available and when can I use it?,” in Proceedings of the 21st congress of the international ergonomics association (IEA 2021). Editors N. L. Black, W. P. Neumann, and I. Noy (Cham: Springer International Publishing), 623–632.
Danner, S., Pfromm, M., and Bengler, K. (2020a). Does information on automated driving functions and the way of presenting it before activation influence users’ behavior and perception of the system? Information 11 (1), 54. doi:10.3390/info11010054,info11010054
Danner, S., Pfromm, M., Limbacher, R., and Bengler, K. (2020b). “Information needs regarding the purposeful activation of automated driving functions - an exploratory study,” in Proceedings of the human factors and ergonomics society europe chapter 2019 annual conference, HFES europe, nantes, FR. Editors D. de Waard, A. Tofetti, and L. Pietrantoni.
Davis, F. D. (1989). Perceived usefulness, perceived ease of use, and user acceptance of information technology. MIS Q. 13 (3), 319. doi:10.2307/249008.2307.249008
Eriksson, A., and Stanton, N. A. (2017). Takeover time in highly automated vehicles: Noncritical transitions to and from manual control. Hum. Factors J. Hum. Factors Ergonomics Soc. 59 (4), 689–705. doi:10.1177/0018720816685832
Fagnant, D. J., and Kockelman, K. (2015). Preparing a nation for autonomous vehicles: Opportunities, barriers and policy recommendations. Transp. Res. Part A Policy Pract. 77, 167–181. doi:10.1016/j.tra.2015.04.003
Feierle, A., Danner, S., Steininger, S., and Bengler, K. (2020a). Information needs and visual attention during urban, highly automated driving—an investigation of potential influencing factors. Information 11 (2), 62. doi:10.3390/info11020062
Feierle, A., Holderied, M., and Bengler, K. (2020b). “Evaluation of ambient light displays for Requests to Intervene and minimal risk maneuvers in highly automated urban driving,” in 2020 IEEE 23rd International Conference on Intelligent Transportation Systems (ITSC), 2020 IEEE 23rd International Conference on Intelligent Transportation Systems (ITSC), Rhodes, Greece, 20-23 September 2020, 1–8.
Field, A., Miles, J., and Field, Z. (2013). Discovering statistics using R. Los Angeles, California: Sage.
Hart, S. G. (2006). Nasa-task load index (NASA-TLX); 20 Years later. Proc. Hum. Factors Ergonomics Soc. Annu. Meet. 50 (50), 904–908. doi:10.1177/154193120605000909
Hecht, T., Darlagiannis, E., and Bengler, K. (2020a). “Non-driving related activities in automated driving – an online survey investigating user needs,” in Human systems engineering and design II. Editors T. Ahram, W. Karwowski, and S. Pickl (Cham: Springer International Publishing), 182–188.
Hecht, T., Feldhütter, A., Draeger, K., and Bengler, K. (2020b). “What do you do? An analysis of non-driving related activities during a 60 minutes conditionally automated highway drive,” in Human interaction and emerging technologies. Editors T. Ahram, R. Taiar, and S. Colson (Cham: Springer International Publishing), 28–34.
Hecht, T., Kratzert, S., and Bengler, K. (2020c). The effects of a predictive HMI and different transition frequencies on acceptance, workload, usability, and gaze behavior during urban automated driving. Information 11 (2), 73. doi:10.3390/info11020073
Holländer, K., and Pfleging, B. (2018). “Preparing drivers for planned control transitions in automated cars,” in Proceedings of the 17th international conference on mobile and ubiquitous multimedia - MUM 2018, the 17th international conference, cairo, Egypt, 25.11.2018 - 28.11.2018. Editors Slim Abdennadher,, and Florian Alt (New York, New York, USA: ACM Press), 83–92.
Howard, D., and Dai, D. (2013). Public perceptions of self-driving cars. California: The Case of Berkeley. Paper presented at the 93rd Annual Meeting TRB.
ISO 9241-11 (2018). Ergonomics of human-system interaction — Part 11: Usability: Definitions and concepts.
Josten, J., Schmidt, T., Philipsen, R., Eckstein, L., and Ziefle, M. (2018). “What to expect of automated driving: Expectations and anticipation of system behavior,” in Advances in human aspects of transportation. Editor N. A. Stanton (Cham: Springer International Publishing), 606–617.
König, M., and Neumayr, L. (2017). Users’ resistance towards radical innovations: The case of the self-driving car. Transp. Res. Part F Traffic Psychol. Behav. 44, 42–52. doi:10.1016/j.trf.2016.10.013
Lee, J. D., and See, K. A. (2004). Trust in automation: Designing for appropriate reliance. Hum. factors 46 (1), 50–80. doi:10.1518/hfes.46.1.50.30392
Naujoks, F., Forster, Y., Wiedemann, K., and Neukum, A. (2017a). Improving usefulness of automated driving by lowering primary task interference through HMI design. J. Adv. Transp. 2017 (3), 1–12. doi:10.1155/2017/6105087
Naujoks, F., Wiedemann, K., and Schömig, N. (2017b). “The importance of interruption management for usefulness and acceptance of automated driving,” in Proceedings of the 9th international conference on automotive user interfaces and interactive vehicular applications - AutomotiveUI '17, the 9th international conference, oldenburg, Germany, 24.09.2017 - 27.09.2017. Editors S. Boll, P. Bastian, and I. Politis (New York, New York, USA: ACM Press), 254–263.
Nielsen, T., Alexander, S., and Haustein, S. (2018). On sceptics and enthusiasts: What are the expectations towards self-driving cars? Transp. Policy 66, 49–55. doi:10.1016/j.tranpol.2018.03.004
Parasuraman, R., and Riley, V. (1997). Humans and automation: Use, misuse, disuse, abuse. Hum. Factors J. Hum. Factors Ergonomics Soc. 39 (2), 230–253. doi:10.1518/001872097778543886
Pfleging, B, Rang, M, and Broy, N. (2016). “Investigating user needs for non-driving-related activities during automated driving,” in Proceedings of the 15th international conference on mobile and ubiquitous multimedia - MUM '16, the 15th international conference, rovaniemi, Finland, 12.12.2016 - 15.12.2016. Editors J. Häkkila,, and T. Ojala (New York, New York, USA: ACM Press), 91–99.
Rahman, M., Lesch, M. F., Horrey, W. J., and Strawderman, L. (2017). Assessing the utility of TAM, TPB, and UTAUT for advanced driver assistance systems. Accid. analysis Prev. 108, 361–373. doi:10.1016/j.aap.2017.09.011
Richardson, N. T., Flohr, L., and Michel, B. (2018). Takeover Requests in highly automated truck driving: How do the amount and type of additional information influence the driver–automation interaction? Multimodal Technol. Interact. 2 (4), 68–10. doi:10.3390/mti2040068.3390
Roberts, S. C., Ghazizadeh, M., and Lee, J. D. (2012). Warn me now or inform me later: Drivers' acceptance of real-time and post-drive distraction mitigation systems. Int. J. Human-Computer Stud. 70 (12), 967–979. doi:10.1016/j.ijhcs.2012.08.002
SAE (2021). Taxonomy and definitions for terms related to driving automation systems for on-road motor vehicles (J3016_201806). Warrendale, PA: Society for Automotive Engineers.
Schoettle, B., and Sivak, M. (2014). Public opinion about self-driving vehicles in China, India, Japan, the US, the UK, and Australia. Michigan: The University of Michigan Transportation Research Institute.
van der Laan, J. D., Heino, A., and Waard, D. (1997). A simple procedure for the assessment of acceptance of advanced transport telematics. Transp. Res. - Part C Emerg. Technol. 5 (5), 1–10. doi:10.1016/s0968-090x(96)00025-3
Venkatesh, V., Morris, M. G., Davis, G. B., and Davis, F. D. (2003). User acceptance of information technology: Toward a unified view. MIS Q. 27 (3), 425. doi:10.2307/30036540
Wandtner, B., Schömig, N., and Schmidt, G. (2018). Secondary task engagement and disengagement in the context of highly automated driving. Transp. Res. Part F Traffic Psychol. Behav. 58, 253–263. doi:10.1016/j.trf.2018.06.001
Keywords: automated driving, driving simulator study, information needs, human-machine interface, automation availability
Citation: Danner S, Feierle A, Gary S and Bengler K (2023) The effects of displaying availability sections of an automated driving function. Front. Future Transp. 4:1153599. doi: 10.3389/ffutr.2023.1153599
Received: 29 January 2023; Accepted: 11 April 2023;
Published: 28 April 2023.
Edited by:
Zheng Wang, The University of Tokyo, JapanReviewed by:
Nichole L. Morris, University of Minnesota Twin Cities, United StatesYi-Ching Lee, George Mason University, United States
Lee Skrypchuk, Jaguar Land Rover, United Kingdom
Copyright © 2023 Danner, Feierle, Gary and Bengler. This is an open-access article distributed under the terms of the Creative Commons Attribution License (CC BY). The use, distribution or reproduction in other forums is permitted, provided the original author(s) and the copyright owner(s) are credited and that the original publication in this journal is cited, in accordance with accepted academic practice. No use, distribution or reproduction is permitted which does not comply with these terms.
*Correspondence: Simon Danner, simon.danner@tum.de