11C-Autoradiographs to Image Phloem Loading
 Michiel Hubeau1†
  Jens Mincke1,2†
  Christian Vanhove2
  Anaïs Pasiphaé Gorel3 Adeline Fayolle3
  Jackie Epila1
  Olivier Leroux4 Stefaan Vandenberghe2
  Kathy Steppe1*
- 1Laboratory of Plant Ecology, Department of Plants and Crops, Faculty of Bioscience Engineering, Ghent University, Ghent, Belgium
- 2Medical Imaging and Signal Processing-Innovative Flemish in-vivo Imaging Technology, Department of Electronics and Information Systems, Faculty of Engineering and Architecture, Ghent University, Ghent, Belgium
- 3Agro-Bio Tech Department Biosystem Engineering (BIOSE), University of Liege, Gembloux, Belgium
- 4Department of Biology, Faculty of Sciences, Ghent University, Ghent, Belgium
Generally, tree species load photoassimilates passively into the phloem, while herbaceous species load actively. These phloem loading strategies have implications for phloem sugar concentration and growth potential. Whereas, in previous research, phloem loading identification was performed with 14C-autoradiography, we suggest 11C-autoradiography, because of its compatibility with plant-PET (positron emission tomography) scans. Because 11C-autoradiography has been hardly used in plant sciences so far, it was tested in contrasting plant species: one temperate tree species, Populus tremula L., three tropical tree species, Erythrophleum suaveolens (Guill. & Perr.) Brenan, E. ivorense A. Chev., and Maesopsis eminii Engl., and two herbaceous crop species Solanum lycopersicum L. and S. tuberosum L. Our results confirmed that P. tremula is a passive loader, and Solanum spp. are active loaders. Erythrophleum spp. and young leaves of M. eminii showed the expected passive loading strategy, but the mature leaves of M. eminii showed an uncommon pattern. Images corrected for leaf tissue thickness supported that mature leaves of M. eminii used active phloem loading, which is linked to continuous investment in growth and new leaves, supporting the lower carbon storage levels often observed in tropical tree species. With this study, we demonstrate that 11C-autoradiography is a powerful tool to acquire detailed tracer distribution in leaves to typify phloem loading strategies in plant species.
Introduction
Leaves are designed as little factories in which mass production of photoassimilates takes place by the photosynthesis process. After production, the logistics need to be taken care of, and this is where phloem tissue comes into play. Phloem tissue enables the plant to load photoassimilates and transport it over long distances to regions of the plant where photoassimilates are required (Van Bel, 2003; Turgeon and Wolf, 2009; De Schepper et al., 2013). Plants have developed several ways to load photoassimilates into the phloem, with or without expenditure of energy (Figure 1) (Rennie and Turgeon, 2009; Turgeon, 2010; Fu et al., 2011; De Schepper et al., 2013). While most plant species produce sucrose as photoassimilate, some may assimilate other polymers such as raffinose or stachyose, or sugar alcohols, such as mannitol or sorbitol (Reidel et al., 2009; Rennie and Turgeon, 2009). Plants use one or multiple ways of phloem loading (Slewinski et al., 2013), which are classified in three strategies: (i) passive symplastic (Figures 1A,D), (ii) polymer trapping (Figures 1B,E), and (iii) active apoplastic (Figures 1C,F). Studies have shown that trees generally show passive loading of sugars into the phloem (strategy i), that both herbaceous species and trees apply polymer trapping (strategy ii) and that most herbaceous species have active apoplastic loading (strategy iii) (Rennie and Turgeon, 2009; Turgeon, 2010; Davidson et al., 2011; Fu et al., 2011). Passive loading means that leaf mesophyll and phloem are symplastically connected via plasmodesmata and that sugars flow into the phloem according to a governing gradient inside the leaf (Figure 1A) (Turgeon, 1996, 2010; Rennie and Turgeon, 2009; Fu et al., 2011; De Schepper et al., 2013). During active loading, energy is spent to increase sugar concentration inside the phloem (Figures 1E,F). In case of polymer trappers, photoassimilates flow passively from mesophyll to companion cells, where they are converted into oligosaccharides (such as raffinose and stachyose) (Figure 1B) (Rennie and Turgeon, 2009; De Schepper et al., 2013). These relatively larger molecules can still pass through plasmodesmata between companion cells and sieve elements, but they cannot flow back through plasmodesmata from companion cells to mesophyll cells. Inside the companion cells, the concentration of primary photoassimilates remains low and passive influx continues. This way, polymer trapping makes use of a size-exclusion strategy to increase the concentration of oligosaccharides inside the phloem at the expense of energy to convert the sugars. In case of apoplastic loading, active pumping is required to load sucrose into the phloem (Figure 1C). Apoplastic loaders have very few plasmodesmata between mesophyll cells and sieve element companion cell complexes (SECCC), and are practically symplastically isolated from each other (Turgeon, 1996; Rennie and Turgeon, 2009; De Schepper et al., 2013). The only way for sugars to enter the SECCC is to enter the apoplast and then being actively pumped into the symplast of the SECCC by sucrose/H+ co-transporters. To create the required proton motive force, protons are pumped by proton-ATPase against their concentration gradient at the expense of the energy carrier ATP (Lemoine, 2000; Williams et al., 2000; De Schepper et al., 2013).
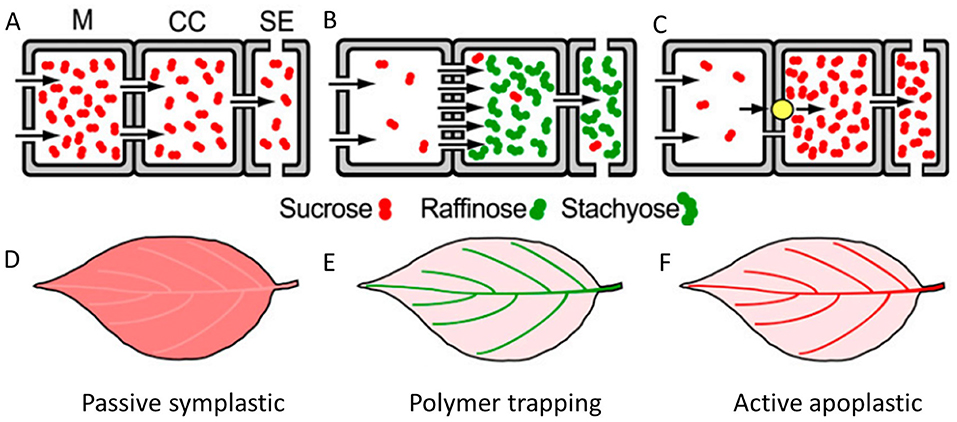
Figure 1. Plants use passive or active strategies to load sugars into the phloem. (A) In passive loading sucrose diffuses through many present plasmodesmata according to a gradient in concentration, which is higher in the mesophyll (M), and smaller in the companion cells (CC), and sieve elements (SE). (B) Polymer trapping is an active loading strategy in which sucrose from the mesophyll enters the companion cells through plasmodesmata and is converted into a polymer such as raffinose and stachyose at the expense of energy. These molecules are too large to pass through plasmodesmata back into the mesophyll but fit the plasmodesmata connecting the companion cell to the sieve element and are loaded into the sieve element according to a concentration gradient. (C) In active apoplastic loading, almost no plasmodesmata connect mesophyll to companion cells, which requires an apoplastic route to load the companion cells. Loading occurs with a sucrose/H+ co-transporter (yellow bullet), which consumes ATP and thus costs energy. (D) Passive loading follows a concentration gradient from higher sugar concentration in the mesophyll to lower concentration in the major veins (indicated by lighter color). (E,F) Active loading occurs against a concentration gradient, which is visualized by higher concentrations in major veins (indicated by brighter colors) compared to mesophyll. This material is adapted from Turgeon (2010) with the permission of the copyright holder Copyright Clearance Center.
Evolution has led to different loading strategies because using either an active or a passive loading strategy is the result of a trade-off. Active loaders do not need a high sugar concentration in the mesophyll to load sugar into the phloem (Figures 1E,F). No or very little negative feedback signals will be sent to the photosynthetic apparatus, which reduces its activity when mesophyll sugar concentrations are high (Körner et al., 1995; Turgeon, 2010; De Schepper et al., 2013). Phloem photoassimilate concentration is higher in active loaders, which increases the gradient in hydrostatic pressure between production (source) and consumption (sink) site, maximizing sugar transport efficiency (Jensen et al., 2013; Savage et al., 2016). Generally, active loaders maintain low leaf carbon inventories and continuously grow new leaves, leading to fast growth. Because their growth potential is higher, active loading is advantageous for herbaceous species, as they invest in year-round growth (Turgeon, 2010). Also, many herbs have a short life span and need to invest in growth as much and quick as possible. The drawback of high investment in growth is that less carbon is allocated to storage. In trees, this drawback is critical and the main reason why trees in general are passive loaders. As trees have a longer lifespan than herbaceous species, they need to be able to survive less favorable circumstances, and thus need higher amounts of storage to rely on (Turgeon, 2010; Sala et al., 2012). Also, they typically do not continuously invest in leaf growth, but rather in flushes, during which a high portion of storage is mobilized (Turgeon, 2010). This is only possible when there has been a sufficient investment in storage.
In their review, Savage et al. (2016) call for more research to acquire a comprehensive picture of sugar distribution in plants. Moreover, the coupling between xylem and phloem is important, but still far from being fully understood (Hölttä et al., 2006; Windt et al., 2006; Mencuccini and Hölttä, 2010; Sevanto et al., 2011; Ryan and Asao, 2014; Hubeau and Steppe, 2015; Steppe et al., 2015; Savage et al., 2016). Not only growth strategies are dependent on how phloem is loaded, but also the response to environmental challenges such as climate change may be different (Savage et al., 2016; Ainsworth and Lemonnier, 2018). How plants cope with, for instance, drought will become increasingly important (Wullschleger et al., 2002; IPCC, 2014; Sevanto, 2014; Allen et al., 2015; Teskey et al., 2015; Hubeau et al., 2019). Active loaders maintain higher solute concentrations in their phloem tissue (Figures 1E,F), which results in a higher osmotic potential and thus a stronger pull on available water (Sevanto et al., 2011). Also, to accommodate the need of water in the phloem, the xylem water potential should not be too negative, as this will cause water to flow from phloem to xylem, ceasing phloem transport (Sevanto et al., 2011, 2014; Sevanto, 2014). Alternatively, high solute concentration inside the phloem will draw water into the phloem, increasing tension on the xylem water column and resulting in more embolism formation. In case of limited water availability, phloem solute concentration will up-concentrate, potentially resulting in a too syrupy stream with a viscosity that high that transport will come to a stop (Sevanto, 2014).
Because phloem tissue is very sensitive to perturbations non-invasive methods are best suited to image phloem transport, for example by using isotopes (Van Bel, 2003). Autoradiography is based on the detection of radioactive decay of unstable atoms. In the study of phloem loading in plant leaves, 14C is commonly used. 14C is a β−-emitter that can be detected in autoradiography and has a high half-life time of 5,730 years. Back in the 1970s, autoradiography in combination with [14C]sucrose was used to study transport and loading of sugars in phloem (Geiger, 1975; Giaquinta, 1976). Turgeon and Wimmers (1988) delivered the first proof of different loading pathways using [14C]sucrose-autoradiography. Surprisingly and despite being the simplest loading strategy, it was not until the 14C-autoradiography studies of Eschrich and Fromm (1994) and Turgeon and Medville (1998) that passive loading was discovered. Later, Rennie and Turgeon (2009) and Fu et al. (2011) performed large multi-species (45 species) studies in which they assessed the uptake and distribution of [14C]sucrose, [14C]mannitol, and [14C]sorbitol to investigate whether study species increased sugar concentration in the veins and if they used either sugar alcohols or sucrose. Most 14C-autoradiographic research has been performed by floating small cut leaf discs in a solution containing [14C]sugars to bring the labeled sugar in contact with the loading sites of the phloem, which are typically located in the minor veins (De Schepper et al., 2013). Higher tracer intensities were found in veins of active loaders, while no clear difference in tracer intensity was found in passive loaders (Reidel et al., 2009; Rennie and Turgeon, 2009; Fu et al., 2011).
In this study, we propose 11C-autoradiography as powerful tool to assess in vivo carbon distributions and phloem loading strategies after exposing attached leaves to gaseous 11CO2. As 11C is a short-lived isotope with a half-life of 20.4 min, samples cannot be pre-processed (i.e., dried to remove water as water has high stopping power for the emitted radiation), and annihilation will occur when β+ radiation (positron) is emitted and travels through the hydrated tissue (i.e., aqueous medium). This process of annihilation means that a positron collides with an electron so that all mass is converted to two opposed 511 keV photons. This process prevents the positron from being detected by the autoradiographic plate and has a much higher probability to occur in an aqueous medium (Levin and Hoffman, 1999; Jødal et al., 2012). In 14C-autoradiography, leaves are typically freeze-dried to prevent that emitted radiation travels through aqueous tissue and undergoes interactions (Turgeon, 2010; Fu et al., 2011). When dried, the lower energy of the emitted β− of a 14C isotope (relative to the energy of the β+ energy of 11C) can easily reach the autoradiographic plate. Due to the rapid decay of 11C, there is no time for drying and thickness of the tissue is therefore of importance and needs to be taken into account (Levin and Hoffman, 1999; Jødal et al., 2012).
Six contrasting plant species, ranging from temperate and tropical tree species to herbaceous crops, were examined to investigate whether 11C-autoradiographs yield valid results to quantify phloem loading strategies. In that case, this technique is well-suited to be used in combination with plant-PET (positron emission tomography) scanning, an emerging technology to unravel phloem dynamics (Hubeau and Steppe, 2015; Hubeau et al., 2019).
Materials and Methods
Plant Material
We assessed 11C-autoradiography as method to characterize carbon distribution and phloem loading in six contrasting plant species. Trees were expected to show a passive loading strategy and herbaceous species an active loading strategy. Therefore, we selected four tree species including one widely distributed temperate species, Populus tremula L. (common aspen), and three tropical species, Erythrophleum suaveolens (Guill. & Perr.) Brenan, Erythrophleum ivorense A. Chev. (both tali), and Maesopsis eminii Engl. (umbrella tree) (Table 1). E. suaveolens occurs widely spread in both moist forests and gallery forests in savannah area, while E. ivorense's distribution is restricted to wet forests along the Guinean coast (Gorel et al., 2015). In case differences in carbon distribution and loading exist, this might be related to their difference in habitat. Maesopsis eminii is a pioneer species of African tropical rainforest and has been the subject of other studies in which it showed interesting leaf behavior (Epila et al., 2017a,b, 2018; Van Camp et al., 2018). Two herbaceous crop species, Solanum lycopersicum L. (tomato) and Solanum tuberosum L. (potato), were measured with S. lycopersicum being interesting for its fruits and S. tuberosum for its tubers (Table 1). All experiments were conducted on plants under well-watered and unstressed conditions.
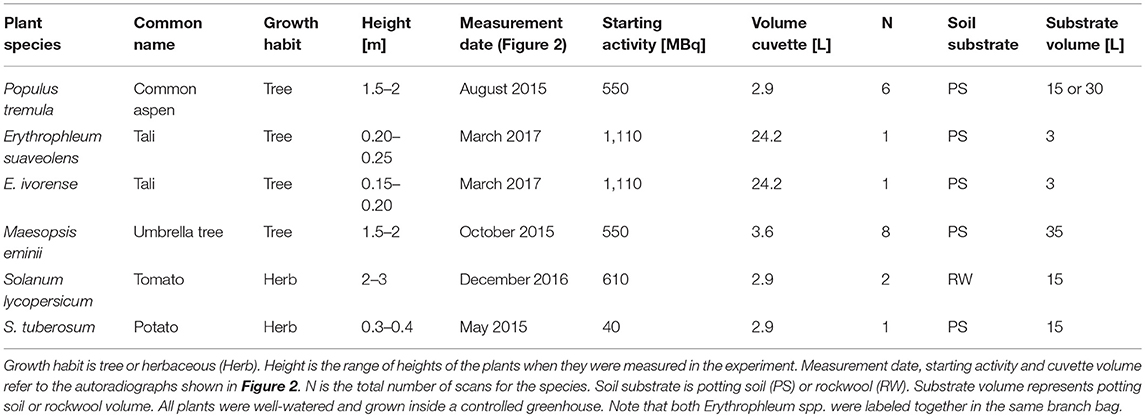
Table 1. Summary of the study species and experimental details.
Measurements were performed on 4-month-old leaves of P. tremula trees during their second growing season. These trees were grown in cylindrical pots filled with a commercial potting soil and slow-releasing nutrient grains under controlled greenhouse conditions and watered by trickle drip irrigation in order to maintain constant soil water content. Average daytime and nighttime temperature were 19° and 15°C, respectively, relative humidity was 70% and average daytime photosynthetic active radiation (PAR) was 531 μmol m−2 s−1. Plants of both Erythrophleum spp. were grown from seeds in cubical pots containing commercial potting soil. They were grown under well-watered conditions and at temperature, relative humidity and PAR mimicking tropical growing conditions by moisturizing the air and providing additional light. Temperature was set at 25°C during a 12-h daylight scheme and at 22°C during 12-h of night. Relative humidity and PAR were not measured. Plants were measured at an age of 15 months. Three-year-old M. eminii trees were grown in cylindrical pots containing peat soil and were irrigated with nutrient-enriched water on a flood-table system. Tropical conditions were mimicked by controlling air temperature, ranging from 18° to 35°C, relative humidity, set at 70%, and by providing additional PAR (from 7 to 21 h), resulting in a daytime average of 708 μmol m−2 s−1. S. lycopersicum plants were sown on rockwool slabs in a greenhouse with controlled temperature (24°C during daytime and 20°C during nighttime), relative humidity (ranging from 65 to 80%) and additional lighting, resulting in a daytime average PAR of 400 μmol m−2 s−1. Measurements were performed on leaves closest to the third tomato truss of 6-month-old plants. Trickle irrigation was used to provide a nutrient solution with an electrical conductivity of 2.7 mS cm−1. Plants were grown along support wires and standard greenhouse practices were applied. S. tuberosum was grown from tubers in cylindrical pots filled with commercial potting soil and slow-releasing nutrient grains in a greenhouse with ambient temperature averaging 24°C, and naturally governed relative humidity and light conditions (these were not measured). Leaves of 3-month-old fully-grown plants were used for the measurements.
For each species (apart from S. tuberosum), at least five mature leaves (or leaflets in case of Solanum species) were sampled and additionally young leaves of M. eminii were sampled.
Exposure to Gaseous 11CO2
Across 2015–2017, intact and attached leaves of contrasting plant species were exposed to gaseous 11CO2 to assess carbon distribution patterns and phloem loading strategies. Attached leaves or distal parts of attached branches (in case of Solanum spp. this was one leaf consisting of several leaflets) enclosed in a cuvette (both hard plexiglass and flexible branch bag cuvettes were used) were exposed to 11CO2. For safety reasons at any time, any contamination of the room air with airborne radioactive molecules was prevented by constructing an airtight seal with putty (Opstosil Putty, Kulzer, Hanau, Germany), adhesive (Teroson Terostat-IX, Henkel, Düsseldorf, Germany), and grease (Vacuum Grease, Dow Corning, Auburn, MI, USA). A controlled flow of air was sent in and out of the cuvettes to maintain stable atmospheric conditions in the cuvette. Inflowing ambient air was controlled at a CO2 concentration of 400 ppm. Temperature of this air was kept constant by air cooling units. Flow rate was adjusted to cuvette volume (Table 1) in order to refresh one cuvette volume every 5 min.
11CO2 was administered to the cuvette via a pulse, through a thin tube, while the constant controlled flow of air was maintained. A CO2 scrubber was used to capture the remaining activity of the outflow, before releasing it back into the air. To ensure photosynthetic activity during the experiments, a light source (red and blue LED-light GreenPower LED string, Philips, Amsterdam, The Netherlands), except for S. tuberosum which was exposed to a combination of white LED-light (PH1LP Teaching Photosynthesis, Qubit Systems, Kingston, Canada) and fiber-optic light (Model FL-4000, Walz Mess und Regeltechnik, Effeltrich, Germany) was positioned above the labeled leaves, yielding between 200 and 250 μmol PAR m−2 s−1 at leaf surface. Leaves were left in the cuvette for one hour after pulse-labeling and the branch was then cut at a distance of 10 cm from the labeled region and removed from the cuvette. After cutting, phloem transport and movement of tracer are expected to slow down and eventually stop (Van Bel, 2003; Turgeon and Wolf, 2009). The cut branch was then exposed to the autoradiographic phosphor plates. Exposed parts were hence allowed to take up, metabolize and transport tracer for one hour, which has been considered a good exposure time to investigate phloem loading (Rennie and Turgeon, 2009; Fu et al., 2011). In general, species were labeled separately, with the exception of the Erythrophleum spp., which were labeled together in one large branch bag.
Autoradiography
The autoradiographic phosphor plates used in this study consisted of BaFBr: crystals and were 25.2 × 12.5 cm in size (MultiSensitive, PerkinElmer, Waltham, MA, USA). The cut branch with attached leaves was placed on a thin layer of cellophane and then covered with another layer to prevent contamination of the plates, and leaves were separated by small pieces of translucent tape to limit overlap. The phosphor plates were put on top of the adaxial sides of the leaves inside an autoradiographic cassette, which pressed the plates onto the leaves, ensuring a tight contact. Contact time was optimized to have sufficient activity captured by the phosphor plate and typically lasted for 10 min (being about 30% of remaining activity from the leaf given the exponential decay with a half-life of 20.4 min). Autoradiographic exposure took place after about one hour of labeling time and 20 min of handling and preparing for autoradiography. This means that the amount of radiation taken up by the leaves decayed to about 6.6% of the initial activity. After these 10 min of exposure, the crystals of the phosphor plates that were excited by the radiation energy were scanned by a laser and digitized in a Cyclone Plus Phosphor imager in OptiQuant software (Perkin Elmer, Waltham, MA, USA). These images were further processed with Fiji, an image processing software (Schindelin et al., 2012).
Crystals of the phosphor plates will be excited principally by positron radiation. However, when a positron is traveling through matter, it will lose energy due to collisions and scattering until it reaches a low enough energy to annihilate, this process resulting in two antiparallel γ-rays, which have a much lower probability of exciting a crystal of the phosphor plate (Bailey et al., 2005). The distance traveled from the point of initial decay before annihilation, which is characterized by many deflections, is called positron range (Levin and Hoffman, 1999; Jødal et al., 2012), and consists of a probability distribution (Levin and Hoffman, 1999; Jødal et al., 2012). In water or hydrated tissue, the mean positron range of 11C is about 1.13 mm, with a maximum of 4.46 mm, while in air, the positron range becomes very large, in the range of several meters (Levin and Hoffman, 1999; Alexoff et al., 2011; Jødal et al., 2012). Typically, major veins (midvein, first-, and second-order veins) are specialized in transport of carbon and water, and are thickest parts of the leaf lamina (Sack and Scoffoni, 2013). Depending on where in the vein the vascular bundle is positioned, the range a positron will travel through matter and the density of this matter will vary, as well as the probability to annihilate and be left undetected.
Vein Anatomy
Anatomical cross-sections were prepared when required for specific pattern recognition in Maesopsis eminii. To this end, stored leaf segments were rehydrated overnight in 1% (v/v) Aerosol OT (Cytec, USA) and 25% (v/v) methanol. They were excised in such a way that sections perpendicular to the veins of the first, second and third order could be produced. After rinsing in demineralised water, samples were embedded in 7% (w/v) agarose (Sigma Aldrich, USA). Blocks of agarose containing leaf segments were glued onto the vibratome stage using superglue (Roticoll, Carl Roth, Germany). Fourty micrometers of thick sections, prepared with a vibrating microtome (HM 650V, ThermoScientific, Germany), were stained with 0.5% w/v astra blue, 0.5% w/v chrysoidine, and 0.5% w/v acridine red and mounted in Euparal after dehydration in isopropyl alcohol. Slides were observed with a Nikon Ni-U microscope and images were recorded using a Nikon DS-Fi1c camera. Length measurements on the cross-section were performed with Fiji (Schindelin et al., 2012), and expressed as average values with standard error.
Results
A compilation of 11C-autoradiographs illustrates different tracer distributions in leaves of contrasting trees and crops (Figure 2, Figure S1). Across leaves or leaflets of the same plant species, similar patterns were found. Overall, images showed a close agreement with leaf venation, and mainly major veins showed a different intensity of detected signal. Uneven lighting and mutual shading during 11C exposure caused the observed leaf patchiness in the images.
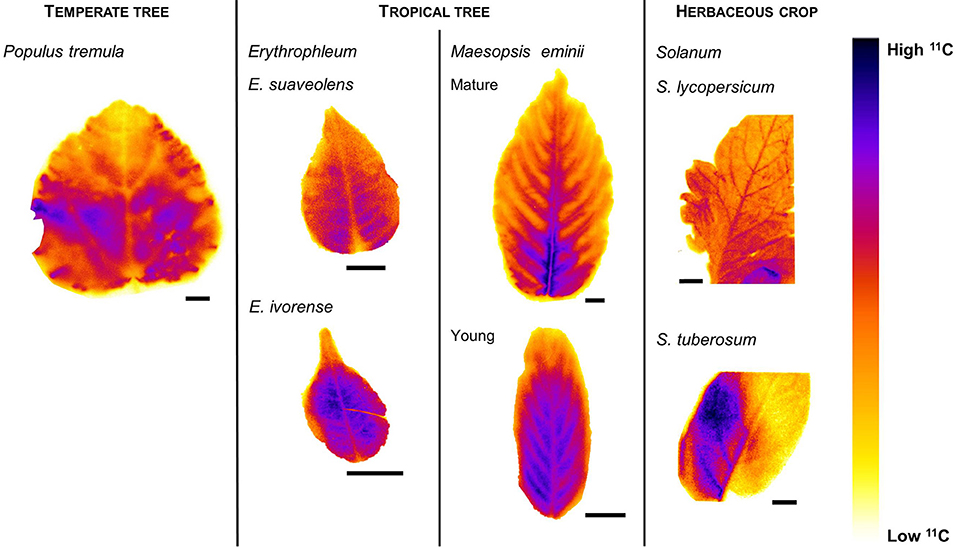
Figure 2. Compilation of typical autoradiographs displaying 11C tracer intensities in leaves of contrasting plant species. Populus tremula is a known passive loader, illustrating lower tracer intensities in major veins compared to mesophyll. Erythrophleum spp. are tropical tree species, both showing the projected passive loading strategy with lower activities measured in the major veins. Young Maesopsis eminii leaves showed lower intensities in major veins compared to mesophyll indicating passive loading, but their mature counterparts showed highest tracer intensities around the major veins. Solanum spp. are known to be active loaders and showed higher intensities in major veins than in mesophyll. Scale bars are 1 cm.
In P. tremula and the Erythrophleum spp., midvein and secondary veins were the regions with lower 11C activity. Also young leaves of M. eminii showed a lower activity in midvein and secondary veins compared to mesophyll. In the older leaves, however, a different pattern was observed, with tracer signal accumulating around primary and secondary veins, while inside the veins registered activities were lower.
In S. lycopersicum, a clear distribution was imaged with higher 11C activity in midvein and secondary veins of the leaflets compared to mesophyll. Also in S. tuberosum, the midvein and some secondary veins showed higher activities, while in other parts of the leaflet a less clear distribution and lower intensity of the carbon tracer was detected, probably because of leaf shading and the relatively low starting activity (Table 1) resulting in a lower resolution.
Thickness of overlying tissue can affect the signal strength in autoradiography. In S. lycopersicum and S. tuberosum, major veins in leaflets are typically structured in a thickened part extending in abaxial direction (Hayward, 1951; McCauley and Evert, 1988a,b). Tissue thickness between the vascular bundles and the adaxial leaflet surface is thus larger than lamina thickness, implying that measured tracer activity in the major veins is an underestimation of the actual activity.
As only the mature leaves of M. eminii showed an uncommon tracer distribution pattern, their anatomy was further investigated (Figure 3). Vascular tissue in the midvein and secondary veins was located just above halfway the leaf cross-section, whereas tertiary veins were found just below halfway the section. Leaf thickness was measured to assess the effect of increased probability of positron annihilation when moving from smaller to larger veins. Distances were measured between points in the vascular bundle and the adaxial side of the leaf (i.e., the side that was exposed to the autoradiographic phosphor plates) to derive average distances that positrons had to travel before reaching the phosphor plates. These distances were 206 ± 23, 88.0 ± 5.4, and 67.41 ± 0.92 μm (N = 8 each) for the midvein, secondary and tertiary veins, respectively. Thickness of the leaf lamina was on average 123 ± 14 μm (N = 12). In mesophyll, it is difficult to assess where 11C is mainly present. Probably, most of the tracer will be present in the photosynthetically most active palisade cells close to the adaxial side. Average distance between palisade cells and the adaxial side of the leaf was 28.0 ± 2.4 μm (N = 8). If we assume 11C tracer to be located in the palisade tissue when in the mesophyll and in the vascular tissue when in the veins, we can quantify the reduction in positron escape according to Jødal et al. (2012), and thus associated reduction in detected signal on the phosphor plates. A reduction of 3, 4, and 12% due to overlying tissue in tertiary, secondary and midveins, respectively, was calculated.
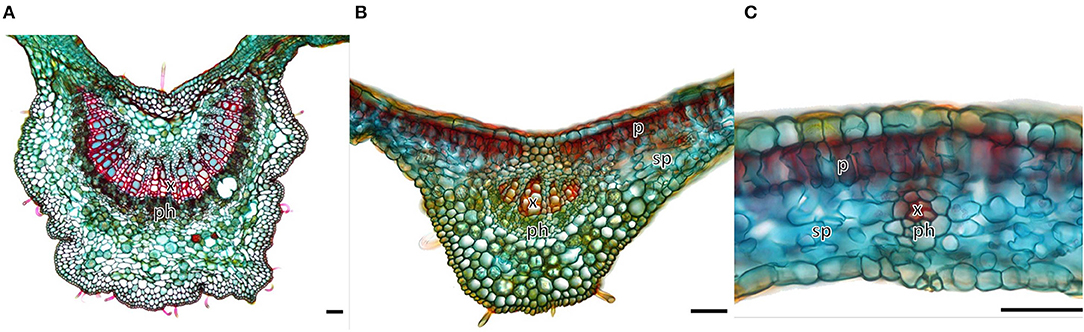
Figure 3. Transverse cross-section through (A) the major vein, (B) a secondary vein, and (C) a tertiary vein of a mature leaf of Maesopsis eminii. Notations on the micrographs are xylem (x), phloem (ph), spongy parenchyma (sp), palisade parenchyma (p), with sp + p representing the mesophyll. Micrographs were used to determine the distance between the phloem in the vascular bundle and the adaxial surface of the leaf (top of the image), which was exposed to the phosphor plates for autoradiography. This allowed calculating a correction factor for the positron range. Scale bars are 50 μm. Figure adapted from Epila et al. (2018) and distributed under the Creative Commons Attribution License.
In P. tremula, positron range associated correction factors were also calculated from vein thickness measurements along the midvein. Correction factors ranged from 25% in the thickest part to 11% in the thinner endings of the midvein. These correction factors were applied across the center of the midvein, and half of the correction was applied at the edges of the midvein as an estimate to account for the cylindrical vein shape. When correcting midvein values for these percentages, tracer activity in the midvein in P. tremula increased and almost equalled measured intensities in the mesophyll, whereas in M. eminii accumulation of tracer occurred toward the midvein (Figure 4). Furthermore, the apparent drop in tracer activity in the midvein of M. eminii was almost entirely eliminated after correction. Tracer activity in the midvein was about as high as in the surrounding mesophyll. These corrections are indicatively but demonstrate that in mature leaves of M. eminii active loading occurs.

Figure 4. Leaf 11C-autoradiographs of Populus tremula and Maesopsis eminii. Correction is illustrated for the midvein, with the region enclosed by a black line corrected using the approach of Jødal et al. (2012). The profile plots show how the measured tracer intensity varies in and around the midvein, when corrected (red line) and uncorrected (green line). Tracer activity is expressed in arbitrary units (a.u.) with 1 the maximum intensity measured in the profile. Scale bars are 1 cm.
Also both Solanum spp., which are known active loaders, were corrected with correction factors ranging from 49 to 14% in S. lycopersicum, and from 62 to 31% in S. tuberosum (Figure 5). These larger correction factors are due to relatively thick midveins in Solanum spp. leaflets. After correction, the small peaks of the uncorrected images in the midveins are much more pronounced, and corrected images clearly point toward active loading.
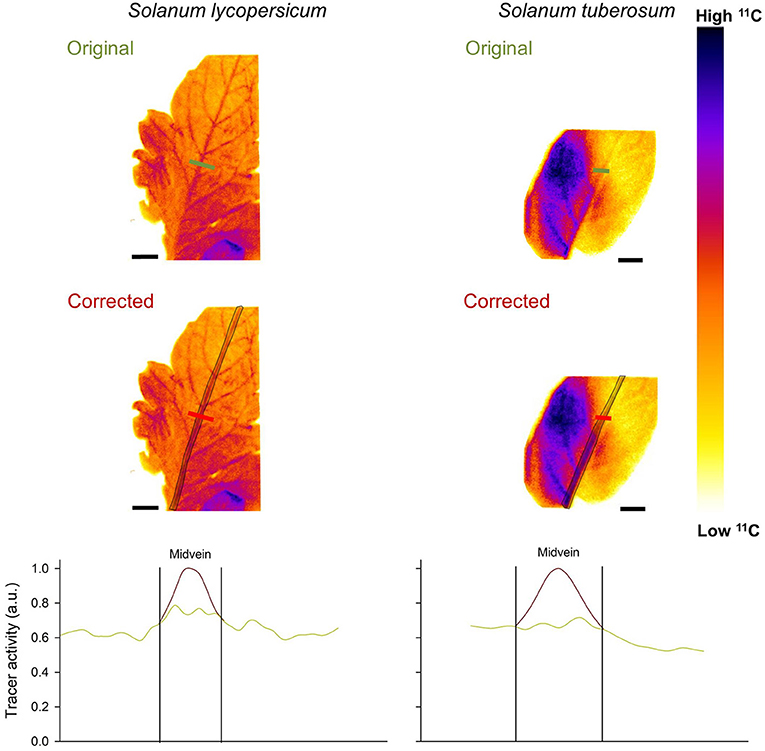
Figure 5. Leaf 11C-autoradiographs of Solanum lycopersicum and S. tuberosum. Correction is illustrated for the midvein, with the region enclosed by a black line corrected using the approach of Jødal et al. (2012). The profile plots show how the measured tracer intensity varies in and around the midvein, when corrected (red line) and uncorrected (green line). Tracer activity is expressed in arbitrary units (a.u.) with 1 the maximum intensity measured in the profile. Scale bars are 1 cm.
Discussion
Carbon Export Requirement When Imaging 11C Distribution During Phloem Loading
To identify a plant's phloem loading strategy with 11C-autoradiography, relatively constant export rates of carbon out of the leaf are required between the time of pulse-labeling and imaging. If this steady-state requirement is met, relative differences in tracer accumulation characterize how carbon is distributed in the leaf after uptake. We measured tracer distribution after one hour of 11C exposure, which is comparable with 14C-autoradiography studies (Turgeon and Medville, 1998; Rennie and Turgeon, 2009; Zavaliev et al., 2010; Fu et al., 2011). In their study with scintillation detectors, Jahnke et al. (1998) showed a continuous and relatively constant export rate of carbon tracer out of the leaves for at least 2 h on young Fraxinus excelsior L. and Sorbus aucuparia L. trees using 11CO2 pulse-labeling. Also, export rates of carbon in leaves of Triticum aestivum cv. Consort remained high and relatively constant for about 2 h, based on 14CO2 pulse-labeling measurements (Dilkes et al., 2004). We therefore assumed a steady-state of phloem loading one hour after labeling.
11C-Autoradiography as Valuable Tool to Define and Understand Loading Strategies in Leaves
The 11C-autoradiographs of P. tremula leaves pointed to a passive phloem loading strategy (Figures 1D, 2, 4). Passive loading was expected, as P. tremula is a tree species and also previous measurements (anatomical, genetical, and 14C-autoradiography) in other Populus spp. indicated a passive phloem loading strategy, which can be defined as a family trait (Gamalei, 1989; Turgeon, 2010; Fu et al., 2011; Jensen et al., 2013; Zhang et al., 2014). The 11C-autoradiography method to define loading strategies was further validated for Solanum spp., which are described in literature as active apoplastic loaders (Fu et al., 2011) and were identified as active loaders on the 11C-autoradiographs (Figures 1F, 2, 5).
All 11C-autoradiographs (Figure 2) showed differences in 11C intensity between the major veins, where transport phloem is located, and the mesophyll. This is similar to 14C-autoradiographs where differences between minor veins and mesophyll are measured to distinguish between passive and active loaders (Reidel et al., 2009; Rennie and Turgeon, 2009; Fu et al., 2011). In the passive loaders, 11C intensities in the midvein and secondary veins were lower than in the surrounding mesophyll (Figure 2). Based on leaf and vein thickness measurements and the positron range probability relations of Jødal et al. (2012), corrected tracer intensities in major veins and the leaf lamina in P. tremula leaves were nearly equal (Figure 4). This corresponds with the findings of Rennie and Turgeon (2009) and Fu et al. (2011), who reported lower or equal intensities of 14C tracer inside the veins of passive loaders. In the active loaders, an increase in 11C activity was found in midvein and secondary veins (Figure 2). Taking into account that overlying tissue in major veins was thicker than the leaf lamina, the high activities measured in midvein and secondary veins underestimated the actual ones. After correction higher activity in the midveins was found (Figures 4, 5), and clearly showed Solanum spp. to be active loaders (Figure 5). The images led us to conclude that after 1 h of exposure to 11CO2, much of the tracer had been loaded into the phloem to be transported out of the leaf. This higher tracer intensities in major veins also corresponds to the earlier 14C findings of Rennie and Turgeon (2009) and Fu et al. (2011) in active loaders.
Recently, Epila et al. (2018) concluded that M. eminni is an active loader, based on the 11C measurements presented here. Although active phloem loading is less common in a woody tree species, it is certainly not impossible (Fu et al., 2011; Thoms et al., 2017). In contrast, leaves of both Erythrophleum spp. and young leaves of M. eminii showed the expected passive phloem loading strategy (Figure 2).
Meta-studies on phloem loading strategies revealed that hardly any data is available for tropical species (Rennie and Turgeon, 2009; Fu et al., 2011; Jensen et al., 2013). Anatomical studies by Gamalei (1989, 1991) demonstrated that tropical tree species typically have open cell types (with many plasmodesmata), which is associated with passive loading, while a follow-up study by Davidson et al. (2011) found no clear link between climate zone and loading type. The Gamalei studies classified phloem loading cells of the family Rhamnaceae (of which M. eminii is a member) as an intermediate type, between open (passive loading) and closed (with few plasmodesmata, active loading) (Gamalei, 1989). This type of cells can be found in tree and herbaceous species, and has been related to both active and passive loading (Gamalei, 1989; Reidel et al., 2009; Davidson et al., 2011; Fu et al., 2011). For a better understanding of tropical tree species, it would be interesting to expand the existing anatomical studies with studies like ours directly visualizing phloem loading in tropical species.
11C- vs. 14C-Autoradiography
We have successfully used 11C-autoradiography to assess carbon tracer distribution and phloem loading strategies in leaves of contrasting plant species. Compared to 14C, working with 11C as a tracer results in autoradiographs with lower resolution, because the higher energy of the emitted 11C positrons ionizes more crystals in the phosphor plate. In contrast to 14C-autoradiography, there is no time to freeze-dry in 11C-autoradiography, which would prevent the issue of positron range, because in dry matter the probability of annihilation is negligible. With 14C, the activity will hardly reduce over the course of this drying period because of its half-life of 5,730 years. The half-life of 11C however is 20.4 min, which does not allow an extensive processing period (such as freeze-drying) before autoradiography. Taking the 11C-autoradiograph after, for instance, half a day drying will reduce 11C activity inside the samples below the detection limit. Because freeze-drying is not an option in 11C-autoradiography, we resolved the overlying tissue issue on reduced tracer detection by correcting for tissue thickness using anatomical information. These corrections can be further improved by using detailed 2-D or even 3-D scans, which could be acquired with 3-D laser or CT scanning, if technological challenges are overcome (Dhondt et al., 2010; Dupuis et al., 2017). Despite the challenges regarding overlying tissue effects, tracer distribution differences in 11C-autoradiographs were sufficiently large to ensure a reliable assessment of passive and active phloem loading strategies in leaves of contrasting species.
An advantage of using 11C, over 14C, as a tracer is that 11C is a positron emitter, and can thus be used in PET scanners (Hubeau and Steppe, 2015; Hubeau et al., 2019). A combination of carbon transport dynamics in 3-D with PET complemented with a 2-D higher-resolution 11C-autoradiograph of resulting carbon distribution contributes to the call for and suit of new methodologies to establish a more comprehensive picture of sugar distribution in plants (Savage et al., 2016; Ainsworth and Lemonnier, 2018; Hubeau et al., 2019).
Taken together, we demonstrated that 11C-autoradiography is a powerful tool to identify phloem loading strategies in leaves of contrasting species. Although 11C has a too short half-life to freeze-dry samples, corrections for leaf and tissue thickness were adequate to classify species as either active or passive loaders. As 11C is also compatible with plant-PET scanners carbon distribution, loading and transport dynamics can be imaged and analyzed together, which contributes to the need of new methods to acquire a more comprehensive picture of phloem dynamics and carbon regulation.
Author Contributions
MH, CV, AF, SV, and KS designed the research. MH, JM, AG, JE, OL, and CV performed the measurements. MH, JM, OL, and KS analyzed and interpreted the data. MH and KS wrote the manuscript. MH, AG, AF, and JE provided the plant material of different species. All authors critically reviewed the manuscript.
Funding
This project was supported by the research program G.0319.13N from the Research Foundation Flanders (FWO) granted to KS, and the SB fellowship 1S37716N granted to JM. The authors also wish to thank the Flanders Innovation & Entrepreneurship Agency for the Ph.D. funding granted to MH (141660).
Conflict of Interest Statement
The authors declare that the research was conducted in the absence of any commercial or financial relationships that could be construed as a potential conflict of interest.
Acknowledgments
Without the practical and technical assistance of Geert Favyts and Philip Deman the creation of this set-up would not have been possible. Many thanks to Benedicte Descamps for the continuous support during 11C measurements at Infinity and to Jan Courtyn for allowing us access to 11C production from the Cyclotron at Ghent University Hospital.
Supplementary Material
The Supplementary Material for this article can be found online at: https://www.frontiersin.org/articles/10.3389/ffgc.2019.00020/full#supplementary-material
References
Ainsworth, E. A., and Lemonnier, P. (2018). Phloem function: a key to understanding and manipulating plant responses to rising atmospheric [CO2]? Curr. Opin. Plant Biol. 43, 50–56. doi: 10.1016/j.pbi.2017.12.003
Alexoff, D. L., Dewey, S. L., Vaska, P., Krishnamoorthy, S., Ferrieri, R., Schueller, M., et al. (2011). PET imaging of thin objects: measuring the effects of positron range and partial-volume averaging in the leaf of Nicotiana tabacum. Nucl. Med. Biol. 38, 191–200. doi: 10.1016/j.nucmedbio.2010.08.004
Allen, C. D., Breshears, D. D., and McDowell, N. G. (2015). On underestimation of global vulnerability to tree mortality and forest die-off from hotter drought in the Anthropocene. Ecosphere 6, 1–55. doi: 10.1890/ES15-00203.1
Bailey, D., Karp, J., and Surti, S. (2005). “Physics and instrumentation in PET,” in Positron Emission Tomography, eds D. Bailey, D. Townsend, P. Valk, and M. Maisey (London: Springer), 13–39. doi: 10.1007/1-84628-007-9_2
Davidson, A., Keller, F., and Turgeon, R. (2011). Phloem loading, plant growth form, and climate. Protoplasma 248, 153–163. doi: 10.1007/s00709-010-0240-7
De Schepper, V., De Swaef, T., Bauweraerts, I., and Steppe, K. (2013). Phloem transport: a review of mechanisms and controls. J. Exp. Bot. 16, 4839–4850. doi: 10.1093/jxb/ert302
Dhondt, S., Vanhaeren, H., Van Loo, D., Cnudde, V., and Inzé, D (2010). Plant structure visualization by high-resolution X-ray computed tomography. Trends Plant Sci. 15, 419–422. doi: 10.1016/j.tplants.2010.05.002
Dilkes, N. B., Jones, D. L., and Farrar, J. (2004). Temporal dynamics of carbon partitioning and rhizodeposition in wheat. Plant Physiol. 134:706–715. doi: 10.1104/pp.103.032045
Dupuis, J., Holst, C., and Kuhlmann, H. (2017). Measuring leaf thickness with 3D close-up laser scanners: possible or not? J. Image 3:22. doi: 10.3390/jimaging3020022
Epila, J., De Baerdemaeker, N. J. F., Vergeynst, L. L., Maes, W. H., Beeckman, H., and Steppe, K. (2017a). Capacitive water release and internal leaf water relocation delay drought-induced cavitation in African Maesopsis eminii. Tree Physiol. 37, 481–490. doi: 10.1093/treephys/tpw128
Epila, J., Hubeau, M., and Steppe, K. (2018). Drought effects on photosynthesis and implications of photoassimilate distribution in 11C-labeled leaves in the African tropical tree species Maesopsis eminii. Engl. For. 9, 109. doi: 10.3390/f9030109
Epila, J., Maes, W. H., Verbeeck, H., Van Camp, J., Okullo, J. B. L., and Steppe, K. (2017b). Plant measurements on African tropical Maesopsis eminii seedlings contradict pioneering water use behaviour. Environ. Exp. Bot. 135, 27–37. doi: 10.1016/j.envexpbot.2016.12.006
Eschrich, W., and Fromm, J. (1994). Evidence for two pathways of phloem loading. Physiol. Plant. 90, 699–707. doi: 10.1111/j.1399-3054.1994.tb02526.x
Fu, Q., Cheng, L., Guo, Y., and Turgeon, R. (2011). Phloem loading strategies and water relations in trees and herbaceous plants. Plant Physiol. 157, 1518–1527. doi: 10.1104/pp.111.184820
Gamalei, Y. (1989). Structure and function of leaf minor veins in trees and herbs. Trees 3, 96–110. doi: 10.1007/BF01021073
Gamalei, Y. (1991). Phloem loading and its development related to plant evolution from trees to herbs. Trees 5, 50–64. doi: 10.1007/BF00225335
Geiger, D. B. (1975). “Phloem loading and associated processes,” in Phloem Transport eds S. Aronoff, J. Dainty, P. R. Gorham, L. M. Srivastava, and C. A. (Boston, MA: Swanson; Springer), 251–295. doi: 10.1007/978-1-4684-8658-2_8
Giaquinta, R. (1976). Evidence for phloem loading from the apoplast: chemical modification of membrane sulfhydryl groups. Plant Physiol. 57, 872–875. doi: 10.1104/pp.57.6.872
Gorel, A. P., Fayolle, A., and Doucet, J. L. (2015). Ecology and management of the multipurpose Erythrophleum species (Fabaceae-Caesalpinioideae) in Africa. A review. Biotechnol. Agron. Soc. Environ. 19, 415–429. Available online at: http://hdl.handle.net/2268/188870
Hölttä, T., Vesala, T., Sevanto, S., Perämäki, M., and Nikinmaa, E. (2006). Modeling xylem and phloem water flows in trees according to cohesion theory and Münch hypothesis. Trees 20, 67–78. doi: 10.1007/s00468-005-0014-6
Hubeau, M., Mincke, J., Vanhove, C., Courtyn, J., Vandenberghe, S., and Steppe, K. (2019). Plant-PET to investigate phloem vulnerability to drought in Populus tremula under changing climate regimes. Tree Physiol. 39, 211–221. doi: 10.1093/treephys/tpy131
Hubeau, M., and Steppe, K. (2015). Plant-PET scans: in vivo mapping of xylem and phloem functioning. Trends Plant Sci. 20, 676–685. doi: 10.1016/j.tplants.2015.07.008
IPCC (2014). Climate Change 2014: Synthesis Report. Contribution of Working Groups I, II and III to the fifth assessment report of the Intergovernmental Panel on Climate Change. Cambridge University Press, United Kingdom and New York, NY, USA.
Jahnke, S., Schlesinger, U., Feige, G. B., and Knust, E. J. (1998). Transport of photoassimilates in young trees of fraxinus and sorbus: measurement of translocation in vivo. Bot. Acta 111, 307–315. doi: 10.1111/j.1438-8677.1998.tb00714.x
Jensen, K. H., Savage, J. A., and Holbrook, N. M. (2013). Optimal concentration for sugar transport in plants. J. R. Soc. Interface 10:20130055. doi: 10.1098/rsif.2013.0055
Jødal, L., Le Loirec, C., and Champion, C. (2012). Positron range in PET imaging: an alternative approach for assessing and correcting the blurring. Phys. Med. Biol. 57:3931. doi: 10.1088/0031-9155/57/12/3931
Körner, C. H., Pelaez-Riedl, S., and Van Bel, A. J. E. (1995). CO2 responsiveness of plants: a possible link to phloem loading. Plant Cell Environ. 18, 595–600. doi: 10.1111/j.1365-3040.1995.tb00560.x
Lemoine, R. (2000). Sucrose transporters in plants: update on function and structure. Biochim. Biophys. Acta 1465, 246–262. doi: 10.1016/S0005-2736(00)00142-5
Levin, C. S., and Hoffman, E. J. (1999). Calculation of positron range and its effect on the fundamental limit of positron emission tomography system spatial resolution. Phys. Med. Biol. 44, 781. doi: 10.1088/0031-9155/44/3/019
McCauley, M. M., and Evert, R. F. (1988a). The anatomy of the leaf of potato, Solanum tuberosum L. 'Russet Burbank'. Bot. Gaz. 149, 179–195. doi: 10.1086/337706
McCauley, M. M., and Evert, R. F. (1988b). Morphology and vasculature of the leaf of potato (Solanum tuberosum). Am. J. Bot. 75, 377–390. doi: 10.1002/j.1537-2197.1988.tb13452.x
Mencuccini, M., and Hölttä, T. (2010). The significance of phloem transport for the speed with which canopy photosynthesis and belowground respiration are linked. N. Phytol. 185, 189–203. doi: 10.1111/j.1469-8137.2009.03050.x
Reidel, E. J., Rennie, E. A., Amiard, V., Cheng, L., and Turgeon, R. (2009). Phloem loading strategies in three plant species that transport sugar alcohols. Plant Physiol. 149, 1601–1608. doi: 10.1104/pp.108.134791
Rennie, E. A., and Turgeon, R. (2009). A comprehensive picture of phloem loading strategies. Proc. Natl. Acad. Sci. U.S.A. 106, 14162–14167. doi: 10.1073/pnas.0902279106
Ryan, M. G., and Asao, S. (2014). Phloem transport in trees. Tree Physiol. 34, 1–4. doi: 10.1093/treephys/tpt123
Sack, L., and Scoffoni, C. (2013). Leaf venation: structure, function, development, evolution, ecology and applications in the past, present and future. N. Phytol. 198, 983–1000. doi: 10.1111/nph.12253
Sala, A., Woodruff, D. R., and Meinzer, F. C. (2012). Carbon dynamics in trees: feast or famine? Tree Physiol. 32, 764–775. doi: 10.1093/treephys/tpr143
Savage, J. A., Clearwater, M. J., Haines, D. F., Klein, T., Mencuccini, M., Sevanto, S., et al. (2016). Allocation, stress tolerance and carbon transport in plants: how does phloem physiology affect plant ecology? Plant Cell Environ. 39, 709–725. doi: 10.1111/pce.12602
Schindelin, J., Arganda-Carreras, I., Frise, E., Kaynig, V., Longair, M., Pietzsch, T., et al. (2012). Fiji: an open-source platform for biological-image analysis. Nat. Methods 9, 676–682. doi: 10.1038/nmeth.2019
Sevanto, S. (2014). Phloem transport and drought. J. Exp. Bot. 65, 1751–1759. doi: 10.1093/jxb/ert467
Sevanto, S., and Holbrook, N. M. (2011). Effects of the hydraulic coupling between xylem and phloem on diurnal phloem diameter variation. Plant Cell Environ. 34, 690–703. doi: 10.1111/j.1365-3040.2011.02275.x
Sevanto, S., McDowell, N. G., Dickman, L. T., Pangle, R., and Pockman, W. T. (2014). How do trees die? A test of the hydraulic failure and carbon starvation hypotheses. Plant Cell Environ. 37, 153–161. doi: 10.1111/pce.12141
Slewinski, T. L., Zhang, C., and Turgeon, R. (2013). Structural and functional heterogeneity in phloem loading and transport. Front. Plant Sci. 4:244. doi: 10.3389/fpls.2013.00244
Steppe, K., Sterck, F., and Deslauriers, A. (2015). Diel growth dynamics in tree stems: linking anatomy and ecophysiology. Trends Plant Sci. 20, 335–343. doi: 10.1016/j.tplants.2015.03.015
Teskey, R., Wertin, T., Bauweraerts, I., Ameye, M., McGuire, M. A., and Steppe, K. (2015). Responses of tree species to heat waves and extreme heat events. Plant Cell Environ. 38, 1699–1712. doi: 10.1111/pce.12417
Thoms, R., Köhler, M., Gessler, A., and Gleixner, G. (2017). Above and below ground carbohydrate allocation differs between ash (Fraxinus excelsior L.) and beech (Fagus sylvatica L.). PLoS ONE 12:e0184247. doi: 10.1371/journal.pone.0184247
Turgeon, R. (1996). Phloem loading and plasmodesmata. Trends Plant Sci. 1, 418–423. doi: 10.1016/S1360-1385(96)10045-5
Turgeon, R. (2010). The role of phloem loading reconsidered. Plant Physiol. 152, 1817–1823. doi: 10.1104/pp.110.153023
Turgeon, R., and Medville, R. (1998). The absence of phloem loading in willow leaves. Proc. Natl. Acad. Sci. U.S.A. 95, 12055–12060. doi: 10.1073/pnas.95.20.12055
Turgeon, R., and Wimmers, L. E. (1988). Different patterns of vein loading of exogenous [14C]sucrose in leaves of Pisum sativum and Coleus blumei. Plant Physiol. 87, 179–182. doi: 10.1104/pp.87.1.179
Turgeon, R., and Wolf, S. (2009). Phloem transport: cellular pathways and molecular trafficking. Ann. Rev. Plant Biol. 60, 207–221. doi: 10.1146/annurev.arplant.043008.092045
Van Bel, A. J. E. (2003). The phloem, a miracle of ingenuity. Plant Cell Environ. 26, 125–149. doi: 10.1046/j.1365-3040.2003.00963.x
Van Camp, J., Hubeau, M., Van den Bulcke, J., Van Acker, J., and Steppe, K. (2018). Cambial pinning relates wood anatomy to ecophysiology in the African tropical tree Maesopsis eminii. Tree Physiol. 38, 232–242. doi: 10.1093/treephys/tpx151
Williams, L. E., Lemoine, R., and Sauer, N. (2000). Sugar transporters in higher plants - a diversity of roles and complex regulation. Trends Plant Sci. 5, 283–290. doi: 10.1016/S1360-1385(00)01681-2
Windt, C. W., Vergeldt, F. J., De Jager, P. A., and Van As, H. (2006). MRI of long-distance water transport: a comparison of the phloem and xylem flow characteristics and dynamics in poplar, castor bean, tomato and tobacco. Plant Cell Environ. 29, 1715–1729. doi: 10.1111/j.1365-3040.2006.01544.x
Wullschleger, S. D., Tschaplinski, T. J., and Norby, R. J. (2002). Plant water relations at elevated CO2 - implications for water-limited environments. Plant Cell Environ. 25, 319–331. doi: 10.1046/j.1365-3040.2002.00796.x
Zavaliev, R., Sagi, G., Gera, A., and Epel, B. L. (2010). The constitutive expression of Arabidopsis plasmodesmal-associated class 1 reversibly glycosylated polypeptide impairs plant development and virus spread. J. Exp. Bot. 61, 131–142. doi: 10.1093/jxb/erp301
Keywords: autoradiography, carbon-11 (11C), phloem loading, carbon distribution, Populus tremula L., Erythrophleum spp., Maesopsis eminni Engl., Solanum spp.
Citation: Hubeau M, Mincke J, Vanhove C, Gorel AP, Fayolle A, Epila J, Leroux O, Vandenberghe S and Steppe K (2019) 11C-Autoradiographs to Image Phloem Loading. Front. For. Glob. Change 2:20. doi: 10.3389/ffgc.2019.00020
Received: 20 December 2018; Accepted: 25 April 2019;
Published: 10 May 2019.
Edited by:
Sanna Sevanto, Los Alamos National Laboratory (DOE), United StatesReviewed by:
Robert Turgeon, Cornell University, United StatesWakana Azuma, Kyoto University, Japan
Copyright © 2019 Hubeau, Mincke, Vanhove, Gorel, Fayolle, Epila, Leroux, Vandenberghe and Steppe. This is an open-access article distributed under the terms of the Creative Commons Attribution License (CC BY). The use, distribution or reproduction in other forums is permitted, provided the original author(s) and the copyright owner(s) are credited and that the original publication in this journal is cited, in accordance with accepted academic practice. No use, distribution or reproduction is permitted which does not comply with these terms.
*Correspondence: Kathy Steppe, kathy.steppe@UGent.be
†These authors have contributed equally to this work