Drone-Based Assessment of Canopy Cover for Analyzing Tree Mortality in an Oil Palm Agroforest
 Watit Khokthong1*
  Delphine Clara Zemp2
  Bambang Irawan3
  Leti Sundawati4
  Holger Kreft2,5 Dirk Hölscher1,5
- 1Tropical Silviculture and Forest Ecology, University of Goettingen, Goettingen, Germany
- 2Biodiversity, Macroecology and Biogeography, University of Goettingen, Goettingen, Germany
- 3Faculty of Forestry, University of Jambi, Jambi, Indonesia
- 4Faculty of Forestry, Bogor Agricultural University, Bogor, Indonesia
- 5Centre of Biodiversity and Sustainable Land Use, University of Goettingen, Goettingen, Germany
Oil palm monocultures are highly productive, but there are widespread negative impacts on biodiversity and ecosystem functions. Some of these negative impacts might be mitigated by mixed-species tree interplanting to create agroforestry systems, but there is little experience with the performance of trees planted in oil palm plantations. We studied a biodiversity enrichment experiment in the lowlands of Sumatra that was established in a 6- to 12-year-old oil palm plantation by planting six tree species in different mixtures on 48 plots. Three years after tree planting, canopy cover was assessed by drone-based photogrammetry using the structure-from-motion technique. Drone-derived canopy cover estimates were highly correlated with traditional ground-based hemispherical photography along the equality line, indicating the usefulness and comparability of the approach. Canopy cover was further partitioned between oil palm and tree canopies. Thinning of oil palms before tree planting created a more open and heterogeneous canopy cover. Oil palm canopy cover was then extracted at the level of oil palms and individual trees and combined with ground-based mortality assessment for all 3,819 planted trees. For three tree species (Archidendron pauciflorum, Durio zibethinus, and Shorea leprosula), the probability of mortality during the year of the study was dependent on the amount of oil palm canopy cover. We regard the drone-based method for deriving and partitioning spatially explicit information as a promising way for many questions addressing canopy cover in ecological applications and the management of agroforestry systems.
Introduction
The area of oil palm (Elaeis guineensis) cultivation has strongly increased over the past decades (FAO, 2016; Vijay et al., 2016), and its cultivation generates high economic returns (Rist et al., 2010; Clough et al., 2016; Euler et al., 2016). In conventional plantations, oil palm is usually grown in monocultures (Azhar et al., 2017). In comparison with other land use systems, and in particular with forests, such plantations present severely reduced biodiversity and impaired ecosystem functions (Foster et al., 2011; Barnes et al., 2014; Drescher et al., 2016; Dislich et al., 2017). Agroforestry systems that combine agricultural crops and trees often harbor higher biodiversity and provide more diverse ecosystem functions than mono-agricultural land uses (Bhagwat et al., 2008; Jose, 2012; Tscharntke et al., 2012; Barrios et al., 2017; Ashraf et al., 2018). Including agroforestry zones and also forest reserves in oil palm-dominated landscapes has been proposed as a way to better balance economic and ecologicalg needs (Koh et al., 2009). However, there is very little experience with the management of oil palm agroforestry.
Planting multiple native tree species into existing oil palm plantations may be one option for the establishment of such agroforestry systems (Teuscher et al., 2016). Mature oil palms possess a height advantage and would likely be less affected by competition from planted trees (Gérard et al., 2017). The trees, thus, need to cope with the light conditions beneath the oil palm canopy, which, however, could be influenced by thinning. In the evaluation of planted tree performance, mortality is a central variable, but light requirements differ between tree species (Davidson et al., 2002). A heterogeneous oil palm canopy cover may offer varied light conditions that may meet the light requirements of different species. So far, knowledge on species-specific site matching under such conditions is limited.
Canopy cover of oil palms is usually strongly related to the height of the oil palm stand, and this has been used to predict aboveground carbon (Nunes et al., 2017) and animal abundance of the oil palm plantation (Konopik et al., 2014). In the context of an oil palm agroforest, dense canopy cover of oil palm could reduce the light intensity received by understory trees passing through canopy layers (Prastyaningsih and Azwin, 2017). For an adequate assessment of oil palm canopy cover, ground-based methods such as a Cajanus sighting tube and line canopy edges intersect by tape-measures could be used (Jennings et al., 1999; Korhonen et al., 2006; Ma et al., 2017). Other well-established methods include measurements of leaf area index, e.g., with instruments like the LAI-2000 plant canopy analyzer (Awal and Wan Ishak, 2008), and hemispherical photography with fisheye lens camera (Awal et al., 2010; Mailly, 2017). However, these ground-based methods are usually time-consuming or impractical over the large area of an oil palm plantation.
Drone-based surveys of canopy cover offer new opportunities and are capable of producing results from multiplot assessment (Shin et al., 2018). Sensors may include light detection and ranging (LiDAR) techniques (Guo et al., 2017) or multispectral imaging capturing red, green, and blue (RGB) spectral information (Nevalainen et al., 2017). RGB images are useful to estimate vegetation canopy cover from a canopy height model (CHM) (Zhang et al., 2016) and for image classification through a photogrammetric approach using the structure-from-motion (SfM) technique (Torres-Sánchez et al., 2014; Chianucci et al., 2016; Banu et al., 2017; Ivosevic et al., 2017). Based on the segmentation method, using a normalized difference vegetation index and CHM, a 10-m resolution of a canopy cover map could be produced (Shin et al., 2018). LiDAR processing workflows, in conjunction with SfM point clouds derived from RGB images, should be sufficient to generate a canopy cover map (Wallace et al., 2016).
The present study was conducted in an experimental oil palm agroforest in the lowlands of Sumatra, Indonesia, where oil palm monocultures have expanded rapidly over the last decades (Drescher et al., 2016). Within such a monocultural landscape, a biodiversity enrichment experiment (EFForTS-BEE) was established in 2013 by planting six native tree species within 6- to 12-year-old oil palm stands, usually after thinning oil palms in the planting area (Teuscher et al., 2016). In the first years of the experiment, initial results of the thinning oil palm experiment showed that the net oil palm yield at plot level did not change or even increased and that tree planting did not impair oil palm yield (Gérard et al., 2017). In contrast, tree growth was negatively affected by the proximity to oil palms (Zemp et al., unpublished data). In 2016, we applied a drone-based photogrammetric approach to the study area, using a low-flying octocopter equipped with an RGB camera, in order to analyze the canopy cover. The main objectives were (1) to generate high-resolution maps of canopy cover, (2) to partition the canopy into oil palm and tree components, and (3) to apply the methodology to compare oil palm canopy conditions of thinned and non-thinned plots as well as to analyze the effect of oil palm canopy cover on tree mortality. We expect that such a drone-based approach offers a new way of analyzing the canopy cover in agroforestry systems.
Materials and Methods
Study Site
The study was conducted in the lowlands of Jambi in Sumatra, Indonesia, on the land of the company PT. Humusindo Makmur Sejati (01.95°S and 103.25°E). The mean annual precipitation in the region is 2,235 mm/annum, and the mean annual temperature is 26.7°C (Drescher et al., 2016). The main soil type is loamy Acrisol (Allen et al., 2015), and the average altitude at the study site is 47 m above sea level (a.s.l.) Teuscher et al., 2016). In 2013, the biodiversity enrichment experiment (EFForTS-BEE) was established in 6- to 12-year-old oil palm plantations with a mean palm density of 143 palms per hectare (Teuscher et al., 2016). The experiment comprises 56 plots distributed over 150 ha. Trees were planted in 48 plots of variable sizes (25, 100, 400, and 1,600 m2). Before planting, oil palm stand density was thinned by 40%, excluding plots of 25 m2 area that remained unthinned (Teuscher et al., 2016). Six native multipurpose tree species were planted: Archidendron pauciflorum, Durio zibethinus, Dyera polyphylla, Parkia speciosa, Peronema canescens, and Shorea leprosula (Table 1). Trees were planted at a distance of 2 m by 2 m and in different biodiversity levels of one, two, three, and six species per plot (Supplementary Table 1). At the time of the study, the average height of the oil palm meristems was 536 cm, and the average tree height per species ranged from 88 cm in D. polyphylla to 403 cm in P. canescens.
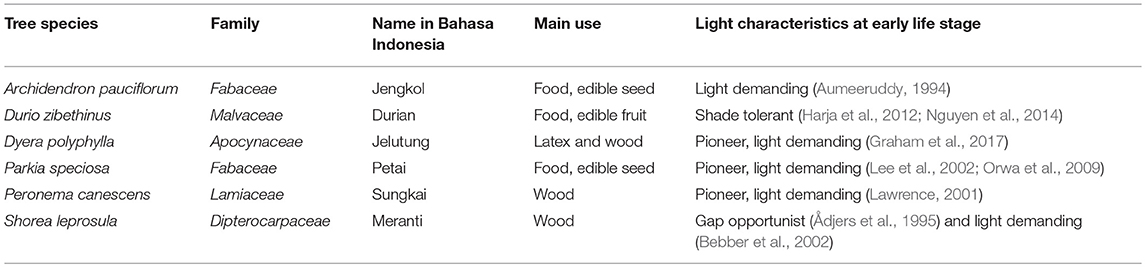
Table 1. Planted tree species and some main ecological characteristics and purpose of uses.
Drone Missions and Photography
From September to October 2016, the 56 plots were assessed with an octocopter drone (MikroKopter OktoXL; Mikrokopter, Inc., Germany) equipped with an RGB camera (Nikon D5100, lens AF-S DX NIKKOR 35 mm; Nikon, Japan). The camera was mounted on a gimbal stabilized platform (MK HiSight SLR1; Mikrokopter, Inc., Germany). The optical parameters, such as white balance and focus, were set as automatic mode with an image resolution of 4,928 × 3,624 pixels. The software Mikrokopter-Tool (version 2.14b) was used for planning the drone flight patterns. All missions took place at an altitude of 35 to 40 m above ground, i.e., ~25 m above the canopies, and were implemented in automatic waypoint mode with a velocity of 2 m per second and a camera shutter interval of 1 per second in automatic trigger mode. All images were captured with 70% overlap (end and forward). The drone was set to follow two different flight patterns: one circular and one grid pathway. Two circular flights were conducted with a difference in diameter of 10 m; the radius varied between 26 and 40 m, with the plot center as the central point (Supplementary Figure 1 and Supplementary Table 2). Within the circular pathway, the camera was automatically pointed 45° from the nadir angle to the plot center. After completing the circular pathway, the drone automatically flew in the grid pathway, and the camera angle was set to the nadir angle (Supplementary Figure 1). After landing, all recorded images were quality checked, and unfocused images were deleted. Flight-geo data (GPX-Log files) were processed in the GPX Viewer software (version 0.66) and exported as compatible photo-log files with drone images.
Raster Datasets and Canopy Cover Generation
The Agisoft Photoscan Professional software (version 1.2.6) was used for orthophoto generation, geo-referencing, and point cloud construction through the SfM photogrammetric approach. In each plot, images with their corresponding photo-log file were processed following standardized steps [including image alignment, building dense point clouds, digital surface model (DSM), and orthophoto generation]. The ground control points were used to measure the accuracy of the orthophoto by geo-referencing (Supplementary Table 2). Subsequently, the RGB orthophoto and DSM were exported in the geo-TIFF (Tagged Image File Format), whereas the SfM point clouds were exported in the LASer (LAS) format (Agisoft, 2016). This SfM technique provided RGB point clouds with an average density of 2,750 points per m2 (standard deviation, SD ±1,320).
The LiDAR360 software (version 2.1, GreenValley International lnc, 2018) was used to compute canopy cover metrics. We derived canopy cover from SfM point clouds. In order to obtain the canopy cover of each plot, we first classified SfM point clouds as “ground” (class 2) and “never-classified” (class 0) with the Classify Ground tool. The never-classified points were expressed as vegetation (Mathews and Jensen, 2013). Then, we used the ground points to generate a digital terrain model (DTM) by combining building size, maximum terrain, iteration angle, and distance. After that, all the classified point clouds were normalized by DTM. Furthermore, canopy cover was computed from the normalized point clouds at 1-m height threshold to distinguish vegetation parts from ground areas in the package Forest Stat as Equation 1. Finally, a CHM was resampled by subtracting different elevations (m) between DSM and DTM. All raster file outputs were saved in TIFF format with 1-m spatial resolution. We followed these workflows for all 56 plots. We calculated canopy cover with the equation of the LiDAR first return point clouds as:
with N vegetation = number of point clouds intersecting the vegetation above the height threshold, and N total = total number of point clouds (Morsdorf et al., 2006; Ma et al., 2017).
Hemispherical Photography
Ground-based hemispherical photographs were captured at the center of the 56 plots (Figure 1A). Coordinates of plot centers were taken by the Garmin GPS (Global Positioning System) device (GPSmap 62; Garmin International, Inc., USA). The circular fisheye lens (SIGMA 4.5 mm F2.8 EX DC HSM, field of view 180°) and camera (Nikon D5100) were set on a tripod at 1.2-m height, with the lens pointing exactly zenith. The flash socket was always positioned to the north using a compass (Beaudet and Messier, 2002). To avoid overestimation of the canopy gap fraction caused by overexposure from auto-exposed photographs, we progressively reduced exposure values incrementally by 0.3 until no overexposed pixels presented in the camera screen (Beckschäfer et al., 2013). The selected non-overexposed photographs were processed in Can_Eye software (version 6.47) to identify the vegetation cover fraction in vertical projection as canopy cover (Weiss and Baret, 2016). The standard canopy cover was determined using a two-classes method (vegetation and sky without mixed pixels) with zenith angles 60° (Weiss and Baret, 2016).
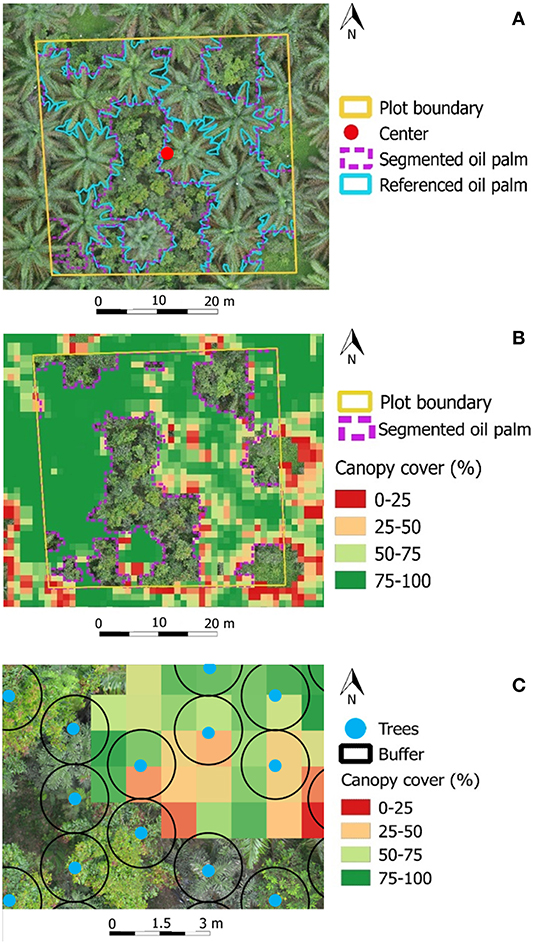
Figure 1. Overview of the biodiversity enrichment experiment (EFForTS-BEE) experimental plot number 23 (six planted tree species, 40 m × 40 m): (A) RGB orthophoto map (5-mm pixel size) overlaid by oil palm canopy segmentations and referenced oil palm. The plot center is shown, where the ground-based hemispherical photograph was taken. (B) Oil palm canopy cover at 1-m resolution; higher values indicate more close canopy, while lower values indicate more open canopy. (C) Extraction of oil palm canopy cover at single-tree level with buffers (2-m diameter).
Validation of Canopy Cover
Drone-derived vegetation canopy cover in each plot was compared with its respective ground-based hemispherical photograph. We considered that tree and oil palm height could affect the size of view of the fisheye images. The average tree and oil palm heights from the CHMs differed (Supplementary Table 2). Thus, we estimated the radius (r) of the fisheye images from average-height CHM with buffer in 10-m diameter, θ = zenith angles 60° as Equation 2 (Riaño et al., 2004; Leblanc and Fournier, 2017).
In each plot, the circular buffer area (πr2) of drone-derived canopy cover was calculated. We assumed that sampling size between the canopy cover from the drone and hemispherical photographs in each plot were equal. The weighted average was used for extracting pixel values of drone-derived canopy cover (Fieber et al., 2015). The association of drone-derived canopy cover estimates with canopy cover estimates from hemispherical photography was tested using the Pearson correlation coefficient (R) and comparing the estimates to the equality line using coefficient of determination (R2) (Figure 2). Finally, the significant difference between means of canopy cover from two methods was evaluated using the paired two-sample t-test. All raster calculations were done in R program (R Development Core Team, 2016), with the libraries raster (Hijmans, 2016), and rgdal (Bivand et al., 2017).
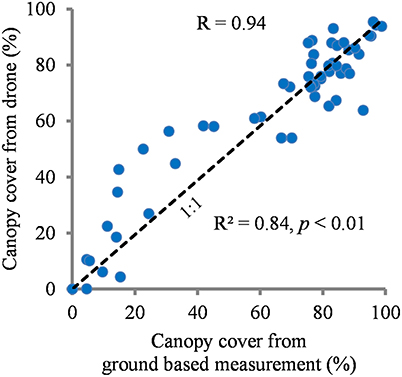
Figure 2. Drone-derived canopy cover compared to ground-based hemispherical photography at plot center (N = 56 plots) with a correlation coefficient (R) = 0.94, RMSE = 10.83%. The equality line (black dashed line) indicates 1:1 relationship with R2 = 0.84, p < 0.01.
Oil Palm Canopy Segmentation
In each plot, CHM at 1-m spatial resolution was used for oil palm canopy segmentation. We followed the local maximum algorithm with a fixed window size. First, the CHM was smoothed by a Gaussian filter with smoothing-window size at 3 × 3 pixels using the FindTreesCHM function in the library rLiDAR (Silva et al., 2017), using the library raster (Hijmans, 2016), and rgeos (Bivand and Rundel, 2017). Then, a fixed window size at 5 × 5 pixels, a specified height threshold at 1 m, and a maximum crown radius at 12 m were applied in order to retrieve automatically delineated crown polygons with the function ForestCAS in the library rLiDAR (Silva et al., 2017). All steps were conducted in R program (R Development Core Team, 2016).
We partitioned oil palm canopy from other tree canopies by manually selecting the oil palm crown polygons within the RGB orthomosaic overlay, following semi-individual tree-crown approach (Breidenbach et al., 2010). All selected polygons were merged and categorized as segmented oil palm canopy (Figure 1A), and the other polygons were categorized as tree canopy and open area. The accuracy was assessed using Equations 3–5 after matching objects with manual-referenced oil palm polygons using the Intersect tool in ArcGIS (version 10.4) (Clinton et al., 2010; Kumar, 2012). Moreover, oil palm canopy covers from thinned and non-thinned plots were compared by quantifying the frequency of pixels within an interval of 20% for oil palm canopy cover classes (0–20, 20–40, 40–60, 60–80, and 80–100%; Figure 3).
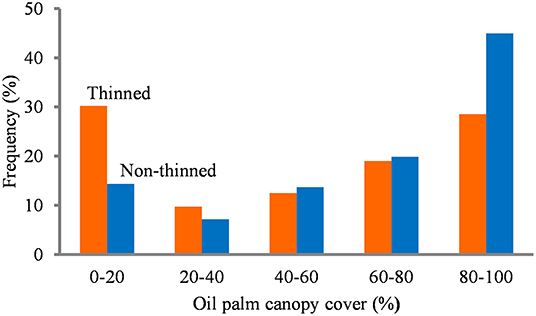
Figure 3. Distribution of oil palm canopy cover in thinned and non-thinned plots where trees were planted (N thinned = 24,870 pixels and N non−thinned = 307 pixels, in 48 plots).
Oil Palm Canopy Cover Extraction at Individual Tree Level
We manually co-registered the coordinates of living trees from 2016 within their corresponding RGB orthophoto. For each living tree, we systematically designed circular buffers of 2-m diameter, consistent with the initial distances between planted trees, as sampling area for oil palm canopy cover extraction (Figure 1C). The mean value of oil palm canopy cover was quantified for each living tree. Due to the shape of the circular buffers, raster cells on edges were not totally covered by polygons; a weighted function was then used to calculate the mean value proportionally (Fieber et al., 2015). Data processing was done in the R program (R Development Core Team, 2016) in library raster (Hijmans, 2016) and rgdal (Bivand et al., 2017).
Tree Mortality Assessments
Living trees were recorded in the 48 plots by annual field inventory in January 2016, and again in January 2017. Mortality was monitored by bark scratching and visual inspection. Erroneous mortality diagnostics revealed from the inventory conducted in 2018 were corrected (30 trees in total). The total number of living trees in 2016 was 3,819 (Supplementary Tables 1, 3), and number of trees that died between 2016 and 2017 was 507 (Supplementary Table 1). The percentage of 1-year species mortality (2016–2017) in each oil palm canopy cover class “s” was calculated as Equation 6.
where “s” indicates canopy cover class, N_dead = number of trees that died, and N_alive = number of trees that survived between 2016 and 2017.
The dependency of tree mortality on oil palm canopy cover class could not be tested using a standard contingency test because tree mortality in many classes was too low (see Figure 4). We, thus, used Fisher's exact and pairwise tests to address the dependency between oil palm canopy cover class and the number of trees that died and survived between 2016 and 2017. The null hypothesis is that the proportion of trees that died and survived is independent of oil palm canopy cover class.
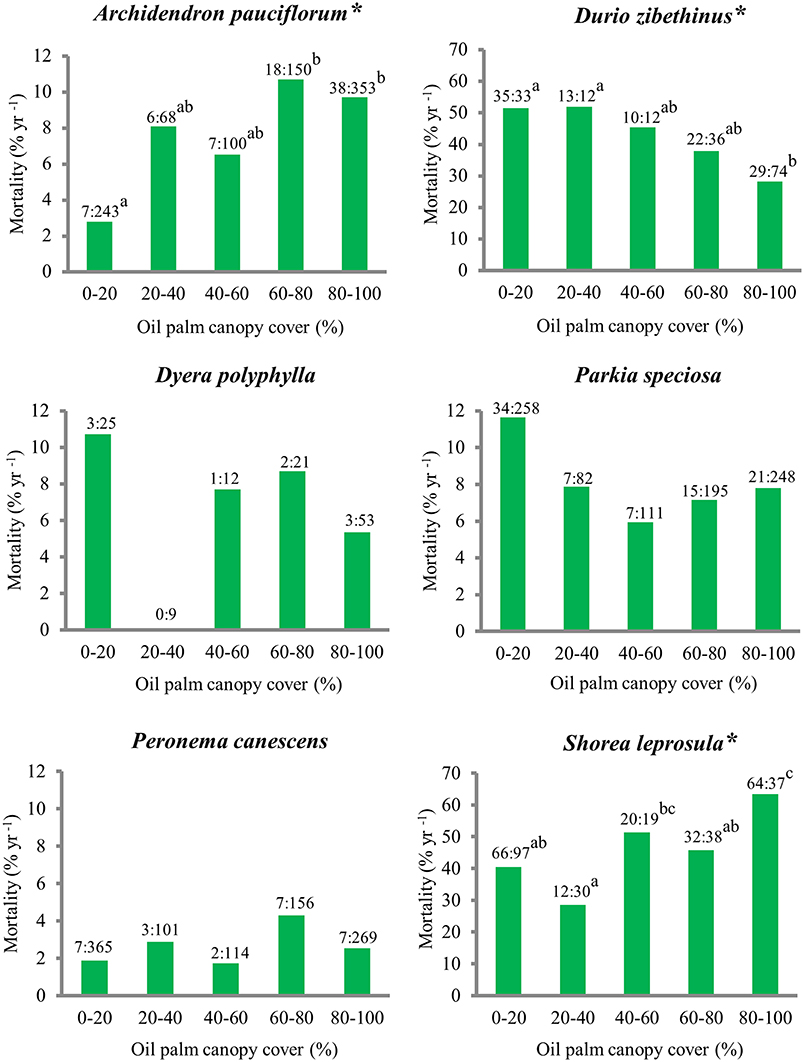
Figure 4. Tree mortality (% yr −1) between January 2016 and January 2017 within oil palm canopy cover. “*” indicates tree species with proportions of trees that died and survived between 2016 and 2017 depending on oil palm canopy cover class (two-tailed p < 0.05, Fisher's exact test). The numbers of trees that died (N_dead) and survived (N_alive) are indicated above the bars (N_dead:N_alive), and the letters represent differences among oil palm canopy cover classes (p < 0.05, pairwise test of independence). The total number of living trees in 2016 and the number of dead trees in 2017 were 3,819 and 507, respectively (Supplementary Table 4).
Results
Canopy Cover Estimation at Plot Level
At the plot center, canopy cover derived from drone-based point clouds ranged from 0 to 99% across the 56 experimental plots (Figure 2). Drone-derived canopy cover estimates (y) were highly correlated with ground-based hemispherical photography (x) with R = 0.94 (p < 0.01). The equality line (y = x) fitted well to the data (R2 = 0.84, p < 0.01), and no significant differences were found between the two estimates (t-value = −0.05, p > 0.05) with root mean square error (RMSE) = 10.83%. However, there was a deviation between low to mid ranges of canopy cover (20 to 50%), where the drone-based method estimated higher canopy cover than the ground-based estimation (Figure 2).
Based on drone estimates with a resolution scale of 1 m covering 48 agroforestry plots, the mean vegetation canopy cover was 70% (SD ±11%). The canopy cover from the oil palms was 56% (SD ±17%), and the canopy cover from the planted trees was 15% (SD ±13%). The accuracy of oil palm canopy segmentation is estimated to be 91% (SD ±5%). The frequency of pixels across canopy cover classes followed a U-shape distribution in both thinned and non-thinned plots (Figure 3). Pixels with 0 to 20% of oil palm canopy cover were twice more frequent in thinned plots than in non-thinned plots (Figure 3). On the other hand, pixels with dense oil palm canopy cover 80–100% were 37% less frequent in non-thinned plots than in thinned plots (Figure 3).
Oil Palm Canopy Cover Related to Tree Mortality
Field-based inventory indicated that the overall mortality of the six tree species between 2016 and 2017 was 13% but differed significantly among species. D. zibethinus and S. leprosula had high mortality rates (39 and 47% yr−1, respectively), while A. pauciflorum, D. polyphylla, P. speciosa, and P. canescens had low mortality rates (<10% yr−1; Supplementary Table 3).
The proportion of trees that died and survived for the three tree species, A. pauciflorum, D. zibethinus, and S. leprosula, was dependent on oil palm canopy cover class (Figure 4), whereas no significant dependency was detected for the other three tree species (Fisher's exact test, two-tailed p > 0.05). A. pauciflorum and S. leprosula presented higher mortality rates with increasing oil palm canopy cover, while D. zibethinus presented decreasing mortality rates with increasing oil palm canopy cover (Figure 4).
Discussion
We generated canopy cover maps at a high spatial resolution in oil palm agroforests using drone-based photogrammetry (Figure 1B), partitioned canopy cover into oil palms and trees, and analyzed the relationship between oil palm canopy cover and tree mortality.
We integrated different flight patterns and camera angles to generate high-density point clouds following a well-documented photogrammetry procedure (Cunliffe et al., 2016; Vacca et al., 2017). The employed SfM technique resulted in a very high density of photogrammetric point clouds (mean = 2,750 points per m2). In a previous study observing canopy cover with LiDAR point clouds, the density of 10 points per m2 already yielded reasonable results when compared with ground-based measurements using a Cajanus sighting tube (Ma et al., 2017). Therefore, it is clear that point cloud density from the SfM technique is high enough to derive reliable canopy cover estimates.
We found a high correlation between drone-derived canopy cover and ground-based hemispherical photography. Despite the high correlation, drone-derived canopy cover estimates were higher than ground-based estimates at 20 to 50% of canopy cover (Figure 2). The SfM point clouds resulted in overestimated canopy cover compared to the LiDAR point clouds estimates probably due to limited penetration ability; however, mean canopy cover derived from the two different methods did not differ significantly (99% confidence level) in a previous study (Jayathunga et al., 2018) and in our own. A similar deviation was observed by Chianucci et al. (2016), who found that canopy cover from drone-based RGB image classification was higher than ground-based photography estimation. We assume that small canopy gaps might be undetectable from SfM point clouds, as it was also the case in canopy analyses from LiDAR point clouds (Vaccari et al., 2013). A single picture of the aerial photography may potentially have similar resolution as the ground-based pictures, but the SfM approach includes numerous pictures from different angles with a certain overlap. Such methodological differences might explain the observed difference in estimations at low to intermediate canopy cover. Nevertheless, the high correlation between the SfM technique and the ground-based hemispherical photography strongly suggests comparability of our approach.
Based on semi-individual tree-crown approach (Breidenbach et al., 2010), the oil palm canopy segmentation is a crucial step to partition the canopy cover into oil palms by overlaying oil palm crown polygons with RGB orthophotos. This procedure resulted in useful and precise data but leaves room for further optimization, because using only the automatic crown segmentation of the CHM did not always differentiate oil palm canopy from trees. Furthermore, in order to improve the accuracy of crown segmentation, different window sizes relative to image resolutions and varying tree-crown sizes could be tested (Wulder et al., 2000; Silva et al., 2016; Mohan et al., 2017). One advantage of our method was that we could retrieve oil palm canopy cover at the level of individual trees using their spatial coordinates, and this was possible even when planted trees were invisible from RGB images because they grew under neighbor trees and oil palm canopies.
An analysis of our map of oil palm canopy cover suggests that thinning oil palms created more variable canopy cover conditions. Specifically, thinned plots presented twice as many pixels in open areas (0 to 20% oil palm canopy cover class) and 37% less pixels in shaded areas (80 to 100% oil palm canopy cover) compared to non-thinned plots.
The probability of mortality rates of A. pauciflorum, D. zibethinus, and S. leprosula depended on the amount of oil palm canopy cover (Figure 4). The relationship between oil palm canopy cover and mortality can be related to light requirements of each species (Table 1); however, a clear relationship between oil palm shading and tree mortality was not present for other tree species. Long-term monitoring of tree mortality may be required to elucidate relationship for these remaining species. Moreover, further analysis of other potentially important control factors affecting mortality should be conducted. For example, planted trees might have also suffered from the extreme drought period associated with the El Niño event in 2015 (Meijide et al., 2018), even though the drought ended several months before our study period (Nieuwstadt and Sheil, 2005).
Oil palm companies have only begun to utilize remote sensing monitoring technology for developing more sustainable management schemes (Chong et al., 2017). Our drone-based methods efficiently differentiated oil palm from tree canopies and clearly depicted the canopy structure of dominant oil palms. Furthermore, we were able to show with our method that thinning created heterogeneous oil palm canopy cover and that oil palm canopy conditions partly influenced mortality of some tree species in the biodiversity enrichment experiment.
Conclusion
Drone-based photogrammetry and subsequent partitioning of dominant oil palm canopies present advantages in canopy cover analyses of oil palm agroforestry. In the case of transforming oil palm monocultures into agroforestry systems, drone-derived canopy cover can be utilized to address many other questions with respect to agroforestry system management and ecological study.
Author Contributions
All authors contributed to the biodiversity enrichment experiment (EFForTS-BEE). WK collected and processed the drone and data and wrote the first version of the manuscript. DCZ provided tree mortality and position data. DCZ and DH contributed to the conceptual development, editing, and revisions of the manuscript. All authors helped and approved the final manuscript.
Funding
This study was funded in part by the Deutsche Forschungsgemeinschaft (DFG, German Research Foundation)—project number 192626868—SFB 990 in the framework of the collaborative German–Indonesian research project CRC990. WK received a Ph.D. fellowship from the Royal Government of Thailand within the Development and Promotion of Science and Technology Talents Project (DPST). We acknowledge support by Open Access Publication Fund of University of Goettingen.
Conflict of Interest Statement
The authors declare that the research was conducted in the absence of any commercial or financial relationships that could be construed as a potential conflict of interest.
Acknowledgments
We would like to thank Joshua André Erkelenz, Juliandi, and Zulfi Kamal for help in the field, Benjamin Wagner for suggesting R libraries for canopy segmentation, and Peter Pütz for valuable suggestions regarding the statistical tests.
Supplementary Material
The Supplementary Material for this article can be found online at: https://www.frontiersin.org/articles/10.3389/ffgc.2019.00012/full#supplementary-material
References
Ådjers, G., Hadengganan, S., Kuusipalo, J., Nuryanto, K., and Vesa, L. (1995). Enrichment planting of dipterocarps in logged-over secondary forests: effect of width, direction and maintenance method of planting line on selected Shorea species. For. Ecol. Manage. 73, 259–270. doi: 10.1016/0378-1127(94)03488-I
Agisoft (2016). Agisoft PhotoScan User Manual: Professional Edition, Version 1.2. Available online at: http://www.agisoft.com/pdf/photoscan-pro_1_2_en.pdf (accessed August 25, 2016).
Allen, K., Corre, M. D., Tjoa, A., and Veldkamp, E. (2015). Soil nitrogen-cycling responses to conversion of lowland forests to oil palm and rubber plantations in Sumatra, Indonesia. PLoS ONE 10:0133325. doi: 10.1371/journal.pone.0133325
Ashraf, M., Zulkifli, R., Sanusi, R., Tohiran, K. A., Terhem, R., Moslim, R., et al. (2018). Alley-cropping system can boost arthropod biodiversity and ecosystem functions in oil palm plantations. Agri. Ecosyst. Environ. 260, 19–26. doi: 10.1016/j.agee.2018.03.017
Aumeeruddy, Y. (1994). “Local representations and management of agroforests on the periphery of Kerinci Seblat national park, Sumatra, Indonesia,” in People and Plants Working Paper 3. Paris: The United Nations Educational, Scientific and Cultural Organization.
Awal, M. A., and Wan Ishak, W. I. (2008). Measurement of oil palm LAI by manual and LAI-2000 method. Asian J. Sci. Res. 1, 49–56. doi: 10.3923/ajsr.2008.49.56
Awal, M. A., Wan Ishak, W. I., and Bockari-Gevao, S. M. (2010). Determination of leaf area index for oil palm plantation using hemispherical photography technique. Pertanika J. Sci. Technol. 18, 23–32. Available online at: https://www.semanticscholar.org/paper/Determination-of-Leaf-Area-Index-for-Oil-Palm-Using-Awal-Ishak/fe54f1f4183413d9cdd73f99ad2a54a9d853f111#extracted
Azhar, B., Saadun, N., Prideaux, M., and Lindenmayer, D. B. (2017). The global palm oil sector must change to save biodiversity and improve food security in the tropics. J. Environ. Manage. 203, 457–466. doi: 10.1016/j.jenvman.2017.08.021
Banu, T. P., Borlea, G. F., and Banu, C. (2017). Determination of the forest canopy cover using a low-cost commercial drone in a turkey oak and durmast oak stand in the Zarand Mountains, Romania. Res. J. Agric. Sci. 49, 12–17.
Barnes, A. D., Jochum, M., Mumme, S., Haneda, N. F., Farajallah, A., Widarto, T. H., et al. (2014). Consequences of tropical land use for multitrophic biodiversity and ecosystem functioning. Nat. Commun. 5:6351. doi: 10.1038/ncomms6351
Barrios, E., Valencia, V., Jonsson, M., Brauman, A., Hairiah, K., Mortimer, P. E., et al. (2017). Contribution of trees to the conservation of biodiversity and ecosystem services in agricultural landscapes. Int. J. Biodivers. Sci. Ecosyst. Serv. Manag. 14, 1–16. doi: 10.1080/21513732.2017.1399167
Beaudet, M., and Messier, C. (2002). Variation in canopy openness and light transmission following selection cutting in northern hardwood stands: an assessment based on hemispherical photographs. Agri. For. Meteorol. 110, 217–228. doi: 10.1016/S0168-1923(01)00289-1
Bebber, D., Brown, N., Speight, M., Moura-Costa, P., and Wai, Y. S. (2002). Spatial structure of light and dipterocarp seedling growth in a tropical secondary forest. For. Ecol. Manage. 157, 65–75. doi: 10.1016/S0378-1127(00)00659-9
Beckschäfer, P., Seidel, D., Kleinn, C., and Xu, J. (2013). On the exposure of hemispherical photographs in forests. IForest 6, 228–237. doi: 10.3832/ifor0957-006
Bhagwat, S. A., Willis, K. J., Birks, H. J., and Whittaker, R. J. (2008). Agroforestry: a refuge for tropical biodiversity? Trends Ecol. Evol. 23, 261–267. doi: 10.1016/j.tree.2008.01.005
Bivand, R., Keitt, T., and Rowlingson, B. (2017). Rgdal: Bindings for the 'Geospatial' Data Abstraction Library. R Package Version 1.2-16. Available online at: https://CRAN.R-project.org/package=rgdal.
Bivand, R., and Rundel, C. (2017). Rgeos: Interface to Geometry Engine - Open Source ('GEOS'). R Package Version 0.3-26. Available online at: https://CRAN.R-project.org/package=rgeos.
Breidenbach, J., Næsset, E., Lien, V., Gobakken, T., and Solberg, S. (2010). Prediction of species specific forest inventory attributes using a nonparametric semi-individual tree crown approach based on fused airborne laser scanning and multispectral data. Remote Sens. Environ. 114, 911–924. doi: 10.1016/j.rse.2009.12.004
Chianucci, F., Disperati, L., Guzzi, D., Bianchini, D., Nardino, V., Lastri, C., et al. (2016). Estimation of canopy attributes in beech forests using true color digital images from a small fixed-wing UAV. Int. J. Appl. Earth Obs. Geoinf. 47, 60–68. doi: 10.1016/j.jag.2015.12.005
Chong, K. L., Kanniah, K. D., Pohl, C., and Tan, K. P. (2017). A review of remote sensing applications for oil palm studies. Geo-Spatial Inf. Sci. 20, 184–200. doi: 10.1080/10095020.2017.1337317
Clinton, N., Holt, A., Scarborough, J., Yan, L., and Gong, P. (2010). Accuracy assessment measures for object-based image segmentation goodness. Photogramm. Eng. Remote Sens. 76, 289–299. doi: 10.14358/PERS.76.3.289
Clough, Y., Krishna, V. V., Corre, M. D., Darras, K., Denmead, L. H., Meijide, A., et al. (2016). Land-use choices follow profitability at the expense of ecological functions in Indonesian smallholder landscapes. Nat. Commun. 7:13137. doi: 10.1038/ncomms13137
Cunliffe, A. M., Brazier, R. E., and Anderson, K. (2016). Ultra-fine grain landscape-scale quantification of dryland vegetation structure with drone-acquired structure-from-motion photogrammetry. Remote Sens. Environ. 183, 129–143. doi: 10.1016/j.rse.2016.05.019
Davidson, R., Mauffette, Y., and Gagnon, D. (2002). Light requirements of seedlings: a method for selecting tropical trees for plantation forestry. Basic Appl. Ecol. 3, 209–220. doi: 10.1078/1439-1791-00098
Dislich, C., Keyel, A. C., Salecker, J., Kisel, Y., Meyer, K. M., Auliya, M., et al. (2017). A review of the ecosystem functions in oil palm plantations, using forests as a reference system. Biol. Rev. 92, 1539–1569. doi: 10.1111/brv.12295
Drescher, J., Rembold, K., Allen, K., Beckschäfer, P., Buchori, D., Clough, Y., et al. (2016). Ecological and socio-economic functions across tropical land use systems after rainforest conversion. Philos. Trans. R. Soc. B Biol. Sci. 371, 1–7. doi: 10.1098/rstb.2015.0275
Euler, M., Schwarze, S., Siregar, H., and Qaim, M. (2016). Oil palm expansion among smallholder farmers in Sumatra, Indonesia. J. Agric. Econ. 67, 658–676. doi: 10.1111/1477-9552.12163
FAO (2016). FAOSTAT Online Statistical Service. Available online at: http://faostat.fao.org (accessed May 31, 2018).
Fieber, K. D., Davenport, I. J., Tanase, M. A., Ferryman, J. M., Gurney, R. J., Becerra, V. M., et al. (2015). Validation of canopy height profile methodology for small-footprint full-waveform airborne LiDAR data in a discontinuous canopy environment. ISPRS J. Photogramm. Remote Sens. 104, 144–157. doi: 10.1016/j.isprsjprs.2015.03.001
Foster, W. A., Snaddon, J. L., Turner, E. C., Fayle, T. M., Cockerill, T. D., Ellwood, M. D., et al. (2011). Establishing the evidence base for maintaining biodiversity and ecosystem function in the oil palm landscapes of South East Asia. Philos. Trans. R. Soc. B Biol. Sci. 366, 3277–3291. doi: 10.1098/rstb.2011.0041
Gérard, A., Wollni, M., Hölscher, D., Irawan, B., Sundawati, L., Teuscher, M., et al. (2017). Oil-palm yields in diversified plantations: initial results from a biodiversity enrichment experiment in Sumatra, Indonesia. Agri. Ecosyst. Environ. 240, 253–260. doi: 10.1016/j.agee.2017.02.026
Graham, L. L. B., Giesen, W., and Page, S. E. (2017). A common-sense approach to tropical peat swamp forest restoration in Southeast Asia. Restor. Ecol. 25, 312–321. doi: 10.1111/rec.12465
GreenValley International lnc (2018). LiDAR360 User Guide, Version 2.0. Available at: http://www.greenvalleyintl.com (accessed January 25, 2018).
Guo, Q., Su, Y., Hu, T., Zhao, X., Wu, F., Li, Y., et al. (2017). An integrated UAV-borne LiDAR system for 3D habitat mapping in three forest ecosystems across China. Int. J. Remote Sens. 38, 2954–2972. doi: 10.1080/01431161.2017.1285083
Harja, D., Vincent, G., Mulia, R., and van Noordwijk, M. (2012). Tree shape plasticity in relation to crown exposure. Trees 26, 1275–1285. doi: 10.1007/s00468-012-0703-x
Hijmans, R. J. (2016). Raster: Geographic Data Analysis and Modeling. R Package Version 2.8-4. Available online at: https://CRAN.R-project.org/package=raster.
Ivosevic, B., Han, Y. G., and Kwon, O. (2017). Calculating coniferous tree coverage using unmanned aerial vehicle photogrammetry. J. Ecol. Environ. 41, 4–11. doi: 10.1186/s41610-017-0029-0
Jayathunga, S., Owari, T., and Tsuyuki, S. (2018). Evaluating the performance of photogrammetric products using fixed-wing UAV imagery over a mixed conifer–broadleaf forest: comparison with airborne laser scanning. Remote Sens. 10, 1–24. doi: 10.3390/rs10020187
Jennings, S. B., Brown, N. D., and Sheil, D. (1999). Assessing forest canopies and understorey illumination: canopy closure, canopy cover and other measures. Forestry 72, 59–74. doi: 10.1093/forestry/72.1.59
Jose, S. (2012). Agroforestry for conserving and enhancing biodiversity. Agrofor. Syst. 85, 1–8. doi: 10.1007/s10457-012-9517-5
Koh, L. P., Levang, P., and Ghazoul, J. (2009). Designer landscapes for sustainable biofuels. Trends Ecol. Evol. 24, 431–438. doi: 10.1016/j.tree.2009.03.012
Konopik, O., Gray, C. L., Grafe, T. U., Steffan-Dewenter, I., and Fayle, T. M. (2014). From rainforest to oil palm plantations: shifts in predator population and prey communities, but resistant interactions. Glob. Ecol. Conserv. 2, 385–394. doi: 10.1016/j.gecco.2014.10.011
Korhonen, L., Korhonen, K. T., Rautiainen, M., and Stenberg, P. (2006). Estimation of forest canopy cover: a comparison of field measurement techniques. Silva Fenn. 40, 577–588. doi: 10.14214/sf.315
Kumar, V. (2012). Forest Inventory Parameters and Carbon Mapping From Airborne LiDAR. Master thesis: University of Twente.
Lawrence, D. (2001). Nitrogen and phosphorus enhance growth and luxery consumption of four secondary tree species in Borneo. J. Trop. Ecol. 17, 859–869. doi: 10.1017/S0266467401001638
Leblanc, S. G., and Fournier, R. A. (2017). “Measurement of forest structure with hemispherical photography,” in Hemispherical Photography in Forest Science: Theory, Methods, Applications, eds. R. A. Fournier and R. J. Hall (Dordrecht: Springer Science + Business Media), 53–84.
Lee, C. T., Wickneswari, R., Clyde, M. M., and Zakri, A. H. (2002). Maintenace of genetic diversity in Parkia speciosa in logged-over forests. J. Trop. For. Sci. 14, 163–178. Available online at: https://ukm.pure.elsevier.com/en/publications/maintenance-of-genetic-diversity-in-parkia-speciosa-in-logged-ove
Ma, Q., Su, Y., and Guo, Q. (2017). Comparison of canopy cover estimations from airborne LiDAR, aerial imagery, and satellite imagery. IEEE J. Sel. Top. Appl. Earth Obs. Remote Sens. 10, 4225–4236. doi: 10.1109/JSTARS.2017.2711482
Mailly, D. (2017). “Hemispherical photography in support of forest inventory and silviculture,” in Hemispherical Photography in Forest Science: Theory, Methods, Applications, eds. R. A. Fournier and R. J. Hall (Dordrecht: Springer Science + Business Media), 227–252.
Mathews, A. J., and Jensen, J. L. R. (2013). Visualizing and quantifying vineyard canopy LAI using an unmanned aerial vehicle (UAV) collected high density structure from motion point cloud. Remote Sens. 5, 2164–2183. doi: 10.3390/rs5052164
Meijide, A., Shekhar, C., Moyano, F., Tiralla, N., Gunawan, D., and Knohl, A. (2018). Impact of forest conversion to oil palm and rubber plantations on microclimate and the role of the 2015 ENSO Event. Agri. For. Meteorol. 252, 208–219. doi: 10.1016/j.agrformet.2018.01.013
Mohan, M., Silva, C. A., Klauberg, C., Jat, P., Catts, G., Cardil, A., et al. (2017). Individual tree detection from unmanned aerial vehicle (UAV) derived canopy height model in an open canopy mixed conifer forest. Forests 8, 1–17. doi: 10.3390/f8090340
Morsdorf, F., Kötz, B., Meier, E., Itten, K. I., and Allgöwer, B. (2006). Estimation of LAI and fractional cover from small footprint airborne laser scanning data based on gap fraction. Remote Sens. Environ. 104, 50–61. doi: 10.1016/j.rse.2006.04.019
Nevalainen, O., Honkavaara, E., Tuominen, S., Viljanen, N., Hakala, T., Yu, X., et al. (2017). Individual tree detection and classification with UAV-based photogrammetric point clouds and hyperspectral imaging. Remote Sens. 9, 1–34. doi: 10.3390/rs9030185
Nguyen, H., Lamb, D., Herbohn, J., and Firn, J. (2014). Designing mixed species tree plantations for the tropics: balancing ecological attributes of species with landholder preferences in the Philippines. PLoS ONE 9:095267. doi: 10.1371/journal.pone.0095267
Nieuwstadt, M. G. L. V., and Sheil, D. (2005). Drought, fire and tree survival in a Borneo rain forest, East Kalimantan, Indonesia. J. Ecol. 93, 191–201. doi: 10.1111/j.1365-2745.2004.00954.x
Nunes, M. H., Ewers, R. M., Turner, E. C., and Coomes, D. A. (2017). Mapping aboveground carbon in oil palm plantations using LiDAR: a comparison of tree-centric versus area-based approaches. Remote Sens. 9, 1–13. doi: 10.3390/rs9080816
Orwa, C., Mutua, A., Kindt, R., Jamnadass, R., and Simons, A. (2009). Agroforest Tree Database: A Tree Reference and Selection Guide Version 4.0. Available online at: https://www.worldagroforestry.org/output/agroforestree-database (accessed June 11, 2018).
Prastyaningsih, S. R., and Azwin (2017). “The growth of agarwood plants on the different canopy covers level and fertilizer in oil palm plantation,” in IOP Conference Series: Earth and Environmental Science (Pekanbaru: IOP Publishing Ltd), 97. doi: 10.1088/1755-1315/97/1/012041
R Development Core Team (2016). R: A Language and Environment for Statistical Computing. Vienna: R Foundation for Statistical Computing.
Riaño, D., Valladares, F., Condés, S., and Chuvieco, E. (2004). Estimation of leaf area index and covered ground from airborne laser scanner (LiDAR) in two contrasting forests. Agric. For. Meteorol. 124, 269–275. doi: 10.1016/j.agrformet.2004.02.005
Rist, L., Laurène, F., and Levang, P. (2010). The livelihood impacts of oil palm: smallholders in Indonesia. Biodivers. Conserv. 19, 1009–1024. doi: 10.1007/s10531-010-9815-z
Shin, P., Sankey, T., Moore, M. M., and Thode, A. E. (2018). Evaluating unmanned aerial vehicle images for estimating forest canopy fuels in a Ponderosa pine stand. Remote Sens. 10, 1–22. doi: 10.3390/rs10081266
Silva, C. A., Crookston, N. L., Hudak, A. T., Vierling, L. A., Klauberg, C., and Cardil, A. (2017). rLiDAR: LiDAR Data Processing and Visualization. R Package Version 0.1.1. Available online at: https://CRAN.R-project.org/package=rLiDAR.
Silva, C. A., Hudak, A. T., Vierling, L. A., Loudermilk, E. L., O'Brien, J. J., Hiers, J. K., et al. (2016). Imputation of individual longleaf pine (Pinus Palustris Mill.) tree attributes from field and LiDAR data. Can. J. Remote Sens. 42, 554–573. doi: 10.1080/07038992.2016.1196582
Teuscher, M., Gérard, A., Brose, U., Buchori, D., Clough, Y., Ehbrecht, M., et al. (2016). Experimental biodiversity enrichment in oil-palm-dominated landscapes in Indonesia. Front. Plant Sci. 7:01538. doi: 10.3389/fpls.2016.01538
Torres-Sánchez, J., Peña, J. M., de Castro, A. I., and López-Granados, F. (2014). Multi-temporal mapping of the vegetation fraction in early-season wheat fields using images from UAV. Comput. Electron. Agric. 103, 104–113. doi: 10.1016/j.compag.2014.02.009
Tscharntke, T., Tylianakis, J. M., Rand, T. A., Didham, R. K., Fahrig, L., Batáry, P., et al. (2012). Landscape moderation of biodiversity patterns and processes - eight hypotheses. Biol. Rev. 87, 661–685. doi: 10.1111/j.1469-185X.2011.00216.x
Vacca, G., Dessì, A., and Sacco, A. (2017). The use of nadir and oblique UAV images for building knowledge. ISPRS Int. J. Geo-Information 6:393. doi: 10.3390/ijgi6120393
Vaccari, S., Leeuwen, M. V., Calders, K., Coops, N. C., and Herold, M. (2013). Bias in LiDAR-based canopy gap fraction estimates. Remote Sens. Lett. 4, 391–399. doi: 10.1080/2150704X.2012.742211
Vijay, V., Pimm, S. L., Jenkins, C. N., and Smith, S. J. (2016). The impacts of oil palm on recent deforestation and biodiversity loss. PLoS ONE 11:0159668. doi: 10.1371/journal.pone.0159668
Wallace, L., Lucieer, A., Malenovskè, Z., Turner, D., and Vopěnka, P. (2016). Assessment of forest structure using two UAV techniques: a comparison of airborne laser scanning and structure from motion (SfM) point clouds. Forests 7, 1–16. doi: 10.3390/f7030062
Weiss, M., and Baret, F. (2016). Can_Eye v6.4.6 User Manual. Available online at: https://www6.paca.inra.fr/can-eye/Documentation/Documentation (accessed March 10, 2017).
Wulder, M., Niemann, K. O., and Goodenough, D. G. (2000). Local maximum filtering for the extraction of tree locations and basal area from high spatial resolution imagery. Remote Sens. Environ. 73, 103–114. doi: 10.1016/S0034-4257(00)00101-2
Keywords: agroforestry, photogrammetry, structure from motion, SfM, Sumatra, Indonesia, unmanned aerial vehicle, UAV
Citation: Khokthong W, Zemp DC, Irawan B, Sundawati L, Kreft H and Hölscher D (2019) Drone-Based Assessment of Canopy Cover for Analyzing Tree Mortality in an Oil Palm Agroforest. Front. For. Glob. Change 2:12. doi: 10.3389/ffgc.2019.00012
Received: 21 January 2019; Accepted: 01 April 2019;
Published: 30 April 2019.
Edited by:
Janice Ser Huay Lee, Nanyang Technological University, SingaporeReviewed by:
Badrul Azhar, Putra Malaysia University, MalaysiaGeertje M. F. Van Der Heijden, University of Nottingham, United Kingdom
Copyright © 2019 Khokthong, Zemp, Irawan, Sundawati, Kreft and Hölscher. This is an open-access article distributed under the terms of the Creative Commons Attribution License (CC BY). The use, distribution or reproduction in other forums is permitted, provided the original author(s) and the copyright owner(s) are credited and that the original publication in this journal is cited, in accordance with accepted academic practice. No use, distribution or reproduction is permitted which does not comply with these terms.
*Correspondence: Watit Khokthong, watit.khokthong@forst.uni-goettingen.de