Average phenotype but not plasticity in two metabolic hormones covary in wild female bonobos (Pan paniscus)
 Ruth Sonnweber1*
  Gottfried Hohmann2,3
  Jeroen M. G. Stevens4
  Tobias Deschner5,6
  Barbara Fruth3,7,8 Anna-Lena Fiedler9 Niina O. Nurmi5
  Verena Behringer9,10
- 1Department of Behavioral and Cognitive Biology, University of Vienna, Vienna, Austria
- 2Department of Human Evolution, Max Planck Institute for Evolutionary Anthropology, Leipzig, Germany
- 3Department for the Ecology of Animal Societies, Max Planck Institute of Animal Behavior, Konstanz, Germany
- 4SALTO, Agro and Biotechnology Odisee University of Applied Sciences, Sint Niklaas, Belgium
- 5Department of Primatology, Max Planck Institute for Evolutionary Anthropology, Leipzig, Germany
- 6Comparative BioCognition, Institute of Cognitive Science, University of Osnabrück, Osnabrück, Germany
- 7Centre for Research and Conservation of the Royal Zoological Society of Antwerp (KMDA), Antwerp, Belgium
- 8School of Biological and Environmental Sciences, Faculty of Science, Liverpool John Moores University, Liverpool, United Kingdom
- 9Institute of Zoology, Technische Universität Dresden, Dresden, Germany
- 10Endocrinology Laboratory, German Primate Center, Leibniz Institute for Primate Research, Göttingen, Germany
Each individual is equipped with a distinct genetic disposition and ontogenetic history and experiences environmental conditions in a unique way. As a result, individuals vary in terms of phenotypic differences regarding their responses to internal and external conditions. By modulating hormone secretion, an individual can react to changing conditions, thus maintaining homeostasis. Cortisol and triiodothyronine (T3) are involved in mediating energy homeostasis. The secretion of metabolic hormones enables individuals to respond flexibly to internal and external conditions. However, this flexibility may be constrained by tradeoffs between average hormone levels and the degree of hormonal plasticity and the impact of the HPA axis on T3 secretion and effects. Like many other species, bonobos (Pan paniscus) are confronted with rapid ecological and climatic perturbations, resulting in challenges to energetic homeostasis. Due to their limited genetic diversity, K-strategist and stenoecious species characteristics, they are predicted to have only limited potential for adaptation. Therefore, it is important to quantify individual cortisol and T3 reaction norms and examine their relationship with each other to understand the level of flexibility of metabolic hormone phenotypes. Using a multivariate random slope model, we found that diurnal urinary excretion patterns of cortisol and T3 in wild female bonobos have (i) no relationship between average phenotype and plasticity within the reaction norms of both hormones. (ii) We also found a negative correlation between the intercepts of the two metabolic hormones, but (iii) no relationship between their slopes. (iv) Standard deviations of cortisol and T3 intercepts and slopes between females indicate little variation among females. Our data show that plasticity within and between the two metabolic hormones is not related to overall low or high hormone levels, but there is a linear negative relationship between cortisol and T3 average phenotypes. Thus, individuals with high average cortisol levels, investing in restoring energy depots, have low average T3 levels, reducing energy expenditure, and vice versa. From this we conclude that the plasticity of diurnal hormone excretion is not affected by average metabolic hormone phenotypes. Evaluations of cortisol and T3 plasticity along ecological gradients can enhance our understanding of the adaptive potential of a given species to environmental changes.
Introduction
Individuals of the same species, even when living in spatial proximity, differ in terms of their internal status (e.g., body condition) and their perception of external stimuli (e.g., exposure to weather or human disturbance) (Romero and Wingfield, 2015). This individualistic setup influences how environmental stimuli trigger morphological, physiological, and behavioral responses (Wingfield et al., 2011). Consequently, individuals within a population exhibit varying responses to internal and external conditions. Some may be fast and flexible in their responses to changing conditions while others may show slow responses and little variation across internal or external alterations. To understand the ecology and evolution of traits that function as regulators (Hau et al., 2016), we need to explore variation in responses to internal and environmental changes on both the within-individual and between-individual level. Hormones are powerful regulators that facilitate phenotypical adjustment to fluctuating conditions (Lema, 2014; Hau and Goymann, 2015). In the context of energetic homeostasis, the glucocorticoid cortisol and the thyroid hormone triiodothyronine (T3) are important. Both are involved in a range of processes, including metabolism, stress response, and immune functions (Hadley, 2000). Thyroid hormones (THs) primarily increase energy expenditure and optimize energy utilization, helping to maintain energy homeostasis by influencing metabolic rate and thermogenesis (McAninch and Bianco, 2014). In mammalian species, the secretion of the biologically active thyroid hormone T3 increases basal metabolic rate (Kelly, 2000). Glucocorticoids like cortisol are involved in restoring energy reserves, helping to ensure a stable supply of glucose for energy needs (Romero and Beattie, 2022). Cortisol secretion affects lipid metabolism, and is key to cope with energy shortage (Reeder and Kramer, 2005; Jeanniard du Dot et al., 2009). To conclude, cortisol contributes to energy homeostasis by restoring energy status, while T3 regulates energy expenditure.
The secretion of cortisol and thyroid hormones (TH) is under the control of two physiological circuits, the hypothalamic–pituitary–adrenal (HPA) axis and the hypothalamic–pituitary–thyroid (HPT) axis (Figure 1). The release of cortisol is controlled by the HPA-axis: corticotropin‐releasing hormone (CRH) is synthesized in the hypothalamus and stimulates the anterior pituitary gland to release adrenocorticotropin hormone (ACTH). ACTH stimulates the adrenal cortex to secret cortisol. Cortisol suppresses CRH and ACTH production, establishing a negative feedback on its own secretion (Mastorakos and Pavlatou, 2005; Haus, 2007). The release of thyroid hormones from the thyroid gland is regulated by the HPT axis. The hypothalamus releases thyrotropin-releasing hormone (TRH), which stimulates the anterior pituitary gland to release thyroid-stimulating hormone (TSH). TSH stimulates the thyroid gland to excrete thyroxin (T4) and, in smaller quantities, triiodothyronine (T3). THs exert a negative feedback loop over the pituitary response to TRH (Kelly, 2000; Mastorakos and Pavlatou, 2005; Haus, 2007). Beside the internal negative feedback loops, data from a variety of non-mammalian species (e.g., chicken (Gallus gallus), Coho salmon (Oncorhynchus kisutch), American bullfrog (Rana catesbeiana), Northern leopard frog (Rana pipiens; now Lithobates pipiens), African clawed frog (Xenopus laevis), and red-eared slider (Pseudemys scripta)) are indicative for a cross-talk between the two axes and suggest that the release of TH can be induced by CRH (reviewed in Castañeda Cortés et al., 2014). In mammals the link between the two axes is not as tight as in non-mammalians and the effect of CRH on TH levels seems to be reversed (reviewed in Behringer et al., 2018). The activation of the HPA axis can suppress TSH excretion from the anterior pituitary gland, resulting in decreasing TH levels (in humans: Burr et al., 1976; Charmandari et al., 2005; Mastorakos and Pavlatou, 2005; in horses: Fazio et al., 2008). However, it seems that the HPT axis can adapt to long-lasting challenges (Baumgartner et al., 1988), and prior experience with a particular stressor may alleviate its adverse effects on TH levels (Fazio et al., 2008).
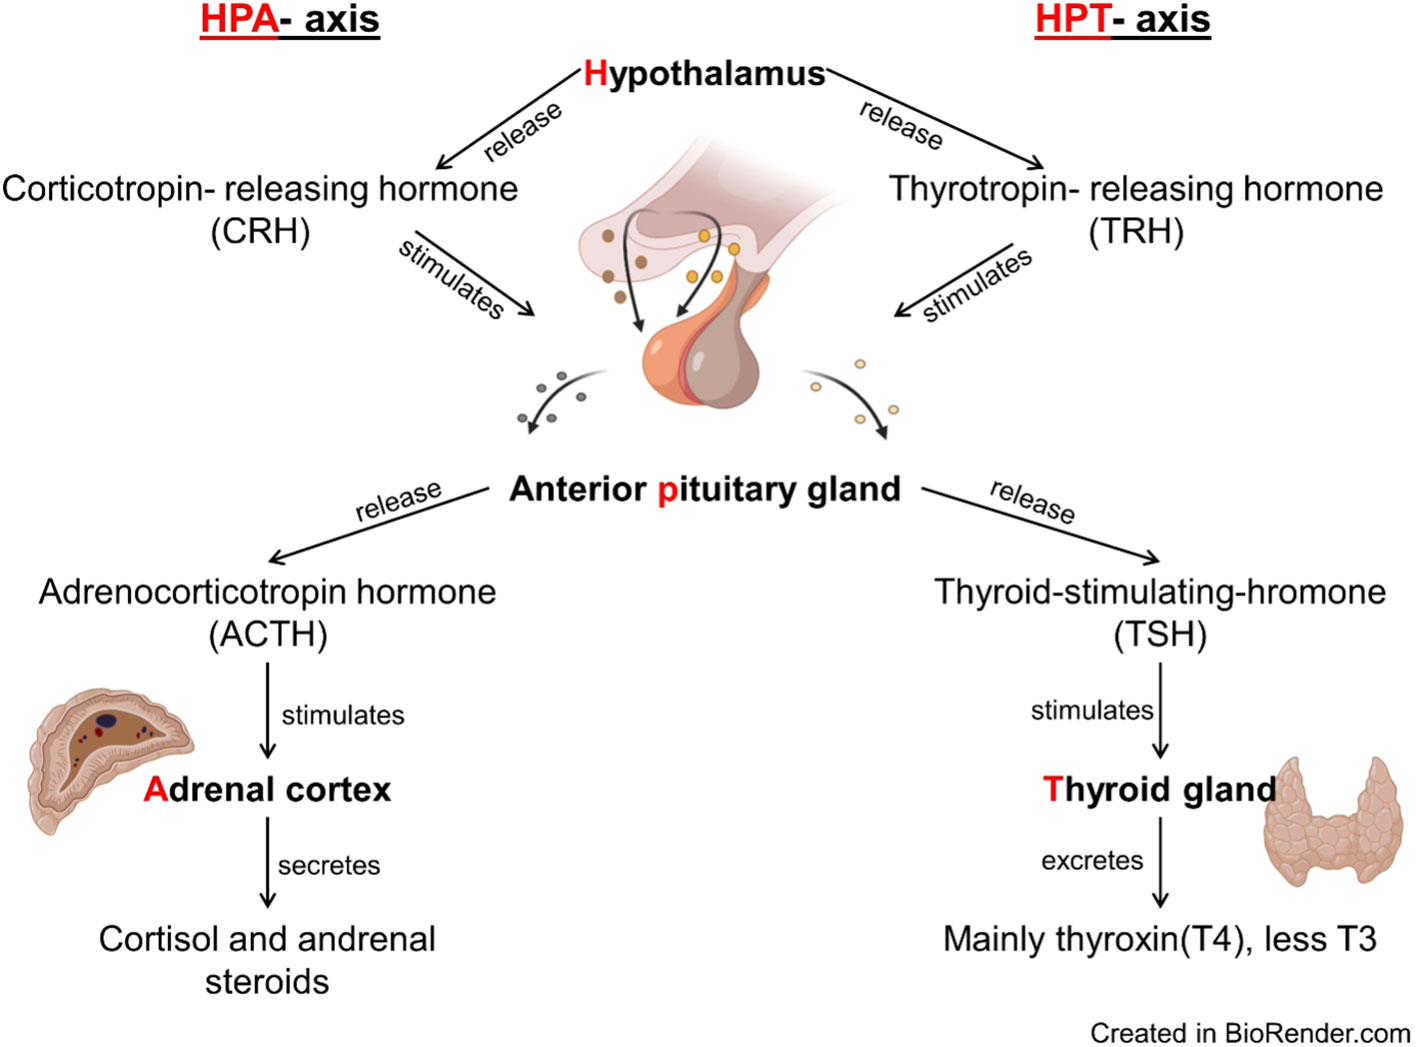
Figure 1 Flow chart of the hypothalamic–pituitary–adrenal (HPA) and the hypothalamic–pituitary–thyroid (HPT) axes. Corticotropin‐releasing hormone (CRH) from the hypothalamus stimulates the secretion of adrenocorticotropin hormone (ACTH) by the pituitary, which leads to the synthesis of cortisol and its secretion into the bloodstream by the adrenal cortex. Thyrotropin-releasing hormone (TRH) from the hypothalamus stimulates the pituitary to secrete thyroid stimulating hormone (TSH), which leads to the synthesis of thyroid hormones (T3 and T4) and their secretion into the bloodstream by the thyroid gland.
The secretion of many hormones is regulated by internal circadian clocks, leading to distinctive patterns of release. In most diurnal species, HPA axis activity and related glucocorticoid secretion exhibit a pronounced diurnal release pattern, with highest levels at the start of the active phase (in the morning), a decline during the day, and minimal levels at midnight. In many species, the diurnal cortisol secretion pattern can be detected in plasma, in urine, and saliva samples (e.g., Jerjes et al., 2006; Sonnweber et al., 2018; Nurmi et al., 2023). The HPT axis is also under control of a circadian clock and shows various time structures, including pulsatile secretions and ultradian, circadian, and circannual rhythms (Haus, 2007; Philippe and Dibner, 2015; Ikegami et al., 2019). Moreover, it has been suggested that circulating cortisol levels influence the circadian pattern of the HPT axis as, for example, the increase in cortisol levels in the morning is accompanied by a decrease in TSH levels in humans (Nicoloff et al., 1970). From this, one would expect to find relatively low T3 levels at times when cortisol levels are high, and vice versa. Indeed, in humans plasma T3 levels are lowest early in the day, increase towards the afternoon and show a peak between midnight and 2 am to 4 am (Weeke and Gundersen, 1978; Philippe and Dibner, 2015; Kim et al., 2021). However, this diurnal pattern of T3 secretion is not conserved. Some species show different circadian patterns than humans (e.g., in rats: Jordan et al., 1980), while others lack a clear diurnal pattern entirely (e.g., in Harbor seals (Phoca vitulina): Oki and Atkinson, 2004). As the rhythmic processes are governed by external pacemakers, such as light intensity and temperature, the lifestyle and habitat of a species may impact hormonal secretion rhythms (Philippe and Dibner, 2015). If both cortisol and THs, express a circadian secretion pattern, it is likely that there is a rhythmic interaction between cortisol and T3 excretion patterns due to the cross-talk between the HPA and the HPT axes (Haus, 2007). Thus, the question arises whether the release patterns of metabolic hormones are interlinked in species that express circadian variation in the release of cortisol and T3.
The reaction norm approach is a powerful statistical way to address such questions on an individual level (Dingemanse and Dochtermann, 2013; Malkoc et al., 2022). In this approach the total variance of hormonal changes is divided into the two main traits of an individual response: the average hormonal response to a gradient is estimated by the intercept; and the plasticity of hormonal change is represented by the slope across a gradient. When different types of traits, such as the average phenotype or plasticity in cortisol and T3 secretion, respond to the same gradient, such as the internal diurnal rhythm, exploration of individual reaction norms informs about the extent to which a certain individual phenotype in cortisol patterns is related to a specific individual phenotype in T3 patterns. For instance, do individuals with high average cortisol phenotype have low T3 intercepts, an interaction that would be plausible given that activation of the HPA axis can result in decreasing TH levels (Burr et al., 1976; Charmandari et al., 2005; Mastorakos and Pavlatou, 2005). And, do phenotypes with pronounced variability in cortisol levels also show large variation in TH levels?
Bonobos (Pan paniscus) inhabit the lowland forests of the central part of the Congo basin in the Democratic Republic of the Congo. They are typical K-strategists (MacArthur and Wilson, 1967; Pianka, 1970) and from this, one would infer that the capacity of the species to respond to environmental changes is more reduced than in species that evolved a fast pace of life strategy and that are living in a more dynamic environment. Species combining larger body size, extended lifespans, limited habitats, and low reproductive rates, tend to show reduced genetic diversity (Osada, 2015), and indeed, there is evidence that bonobos passed a genetic bottle neck, lowering the genetic diversity of contemporary populations (Prado-Martinez et al., 2013; de Manuel et al., 2016; Han et al., 2019). Low genetic diversity is likely to decrease the power of selective pressures acting on the population gene pool (Vida, 1994). However, apart from population-level adaptation, there are alternative mechanisms to respond to internal and environmental change on a non-genetic, phenotypic level, for instance via epigenetic or physiological modifications (Meyers and Bull, 2002; Lighten et al., 2016).
Cortisol and T3 are crucial for maintaining energetic homeostasis and flexibility in secretion of both hormones remains an important trajectory to regulate the physiological status of individuals. In this study we ask if bonobos are confronted with tradeoffs (e.g., investment in high cortisol levels is associated with reduced cortisol plasticity) and limitations (e.g., when cortisol levels are high, T3 levels must be low, as would be predicted by the link between the HPA and HPT axis) in the adjustments of the two metabolic hormones. To answer these questions, we investigate the reaction norms of two metabolic hormones, cortisol and T3, along the diurnal gradient i) to unravel how reaction norm traits (average phenotype and plasticity) within and between metabolic hormones are related to each other, and ii) to investigate the level of between individual variability in these traits. We used the diurnal rhythm to study bonobos’ reaction norms of metabolic hormone excretion, as the presence of the diurnal cortisol pattern was already known from a previous study on the same population (Nurmi et al., 2023). Several factors render it likely that bonobos also show a diurnal pattern of T3 excretion: they experience relatively constant temperatures (range 18 to 29°C) and equatorial climate throughout the year (Fruth et al., 2014). Moreover, fluctuation of sunrise, sunset, and day length are modest (Goymann et al., 2012), resulting in a rather uniform wake and sleep rhythm (Fruth and Hohmann, 1993). Taken together, the external pacemakers moderate temporal variation in activity and the expression of rhythmic diurnal changes of both metabolic hormones. Using the reaction norm approach, we built a multivariate random slope model to explore individual females’ average phenotype (intercept) and plasticity (slopes) of cortisol and T3 across the internal diurnal gradient. We examined whether the plasticity of hormonal expression across the day was related to the average phenotype, as was previously found in great tits (Parus major) where average levels and degree of plasticity of baseline glucocorticoid levels along a temperature gradient covaried (Hau et al., 2022). Furthermore, we modeled the correlation between the cortisol and T3 reaction norms to understand to what extent they are interconnected, a prediction based on human studies (Nicoloff et al., 1970). We further investigated the level of variation of cortisol and T3 reaction norms between individuals to assess the potential for among-individual differences that would allow selective pressures to act on. We did not expect to find large variation between individuals, as the population size of bonobos is relatively small, and genetic diversity is rather low.
Materials and methods
Ethics statement
This study adheres to a rigorous protocol that ensured a non-contact and non-invasive approach with wild animals. The Institut Congolaise pour la Conservation de la Nature (ICCN) authorizes research in LuiKotale, Salonga National Park, Democratic Republic of Congo (Permission Number: 0683/ICCN/DG/ADG/014/KV/2012). The ICCN also granted permits (Permit Number: 0521/ICCN/DG/CWB/05/01/2014) for exporting urine samples from the Democratic Republic of Congo and the German Ministry for Social Affairs and Consumer Protection issued the permits for importing these samples.
Study species and subjects
The LuiKotale field site is situated at the southwestern border of Salonga National Park in the Democratic Republic of Congo. The study site (2°47’S, 20°21’E) lies within a continuous stretch of equatorial rainforest predominantly composed of lowland tropical forest. The region experiences a seasonal rainfall pattern, with an extended dry season spanning from June to August, as well as a shorter dry season around February (Bessone et al., 2021). The work protocol of the LuiKotale Bonobo Project includes the collection of urine samples to monitor physiological patterns. The samples used in this analysis were collected between September 2012 and August 2019 from resident females of the Bompusa West community. During this period, the community was composed of 6–8 adult males and 15–17 adult females (Table 1 shows the number of females and number of samples per year). In total, across the whole data collection period, 19 adult female individuals were included in our study. Of these, 13 are considered long-term residents of their community since the beginning of our research. Birth dates of adult females born before the onset of the project (2002) are not known.
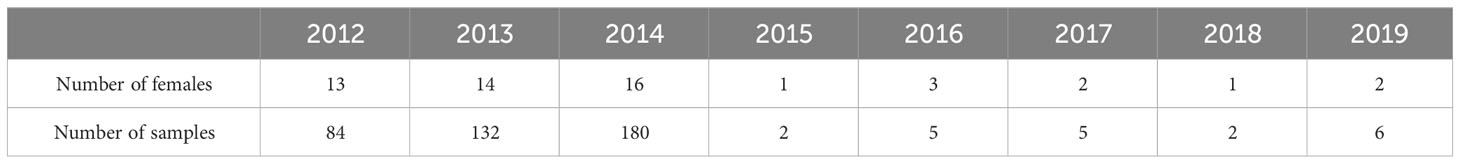
Table 1 Number of adult females and samples per data collection year.
Urine sample collection
Throughout the study period, 416 urine samples from the 19 adult female bonobos were collected between 5:00 and 18:00. From the 19 individuals, we collected a mean of 21.9 ± 13.4 (range: 2–45) samples. Samples were obtained immediately after excretion and directly from the vegetation, excluding those contaminated with feces. Using micropipettes, urine was transferred into cryo tubes and tubes were labeled with the respective individual’s name, date, and time of sample collection. Urine samples were frozen in liquid nitrogen upon arrival at the camp. Samples were shipped frozen to the Max Planck Institute for Evolutionary Anthropology in Leipzig, Germany, for cortisol and total triiodothyronine (T3) analysis. Upon arrival, the samples were stored at −20°C until hormone analysis took place.
Hormone extraction and measurement
Frozen urine samples were thawed at room temperature and subsequently agitated for 10 seconds using a VX-2500 Multi-tube vortexer. Following agitation, the samples were centrifuged at 2000g for five minutes using a Multifuge Heraeus centrifuge. Specific gravity (SG) of each sample was measured using a digital handheld refractometer (TEC, Ober-Ramstadt, Germany).
Urinary cortisol analyses
Urinary cortisol was measured with liquid chromatography–tandem mass spectrometry (LC-MS). The extraction method and measurement have been validated and described in Hauser et al. (2008). In brief, each urine sample was mixed with an internal standard (prednisolone, methyltestosterone, d3-testosterone, d4-estrone, and d9-progesterone) to assess sample recovery and quantify urinary cortisol levels, with prednisolone used as the reference compound. Hydrolysis of the samples was performed using β-glucuronidase from Escherichia coli (activity: 200 U/40 μl). Subsequently, the extracts were purified using solid phase extractions (Chromabond HR-X SPE cartridges: 1 ml, 30 mg). This was followed by solvolysis with 250 ml of ethyl acetate and 200 mg of sulfuric acid. Cortisol extraction was carried out using methyl tert-butyl ether, and the evaporated extracts were reconstituted in 30% acetonitrile. The urinary cortisol measurements were conducted using a liquid chromatography–tandem mass spectrometry system consisting of a Waters Acquity UPLC separation module equipped with a binary solvent manager, sample manager, and a column oven (Waters, Milford, MA, USA). Chromatographic separation was achieved using a Waters Acquity BEH C18 column (2.1 × 100 mm, 1.7 μm particle diameter). Eluent A consisted of water with 0.1% formic acid, while Eluent B consisted of acetonitrile. A sample volume of 10 μl was injected into the system. Mass spectrometry analysis was performed on a Waters XEVO TQ454 S tandem quadrupole mass spectrometer (Waters, Milford, MA, USA) with an electrospray interface (ESI) operating in positive mode. The quantitative analysis of cortisol levels was conducted within the range of 0.01–100 pg/μl using MassLynx software (Version 4.1; QuanLynx Software). The results of urinary cortisol were expressed in ng/ml and corrected for specific gravity (SG). A measurement batch was accepted if the quality control measurements deviated by less than 13% from the true cortisol concentration. In cases where the internal standard recovery deviated by more than 60% of the internal standard, the respective samples were re-measured through reinjection. For samples with measurements above the calibration curve limit, extracts were reinjected at a 1:10 dilution.
Urinary total T analyses
Urinary total T3 analysis was performed using a competitive total triiodothyronine (T3) ELISA kit (Ref. RE55251, IBL International GmbH, Hamburg, Germany), which was previously validated for total T3 measurement in urine of bonobos (Behringer et al., 2014). The samples were measured at different dilutions (1:2, 1:5, 1:10, 1:20, or 1:50) based on their specific gravity (SG). For each measurement, 50 μl of the diluted sample was pipetted into a well along with 50 μl of the provided assay reagent. The plate was shaken for ten seconds and then incubated for 30 minutes at room temperature. After the initial incubation, 50 μl of the provided triiodothyronine–enzyme conjugate was added to each well and the plate was shaken again for ten seconds. Subsequently, it was incubated for an additional 30 minutes at room temperature. The plate was washed five times with 300 μl of the washing buffer, and then 100 μl of TMB substrate was added. Following a ten-minute incubation, the reaction was stopped by adding 100 μl of the provided stop solution, and the plate was read at 450 nm using a microplate reader. All samples were measured in duplicates. For quality control purposes, high- and low-value quality control samples were included in each assay. The inter-assay variation for the high- and low-value quality controls was 4.2% and 7.6% (N = 14 assays), respectively. The intra-assay variation was 9.2%. The final concentrations of total T3 are expressed in ng/ml corrected for SG.
Data preparations
Before running statistical analyses, we prepared our data frame as follows. First, we excluded samples of pregnant females from the dataset. Pregnancy affects levels of both cortisol and T3 (e.g., Behringer et al., 2018; Touitou et al., 2021; Behringer et al., 2023) and as it is difficult to distinguish between maternal and fetal glucocorticoids in a sample (Mastorakos and Ilias, 2009). Consequently, a total of 398 samples of 19 adult non-pregnant females entered our statistical assessments. Second, we log-transformed both urinary cortisol and urinary T3 levels to achieve a more symmetrical distribution. Third, the time of sample collection was converted into minutes since midnight. It is important to standardize variables when examining the magnitude and sign of estimates of variance in reaction norm components, as the measure and scale of the external or internal gradient used can influence the results (Gelman, 2008). Therefore, we mean-centered our time variable minutes since midnight by subtracting the mean value of the variable from each data point, effectively centering it around zero. Next, the variable was standardized, scaling it to two standard deviation units. This transformation ensures that the data is expressed in a common standardized scale (Araya-Ajoy et al., 2015).
Statistical analyses
To test for correlations between reaction norms of different traits, one approach is to build multivariate random slope models in which two or more traits are included as response variables (Dingemanse and Dochtermann, 2013; Araya-Ajoy et al., 2015; Malkoc et al., 2022). These models reveal whether there are correlations between average trait expressions of individuals (intercepts), individual trait plasticities (slopes), and residual variations (Malkoc et al., 2022). Therefore, to investigate the relationship between individual-level variation (intercepts and slopes) in urinary cortisol and urinary T3 levels, we fitted a Bayesian multilevel model using the brms package (version 2.19.0; Bürkner, 2017) in R (version 4.2.3 R Core Team, 2017). The aim was to estimate individual intercepts, slopes, and their correlation for each of the two metabolic hormones, as well as the correlation between the intercepts of urinary cortisol and urinary T3 and the slopes of cortisol and T3, respectively. For this purpose, we entered log-transformed cortisol and log-transformed T3 levels as response variables into the model (the model was fit to the data using the brm() function from the brms package). The standardized, z-transformed time variable was included as a predictor variable to account for the general effect of the diurnal variation in both metabolic hormones (Haus, 2007). Furthermore, we included a multilevel random effects structure (Bosker and Snijders, 2011) in the model to allow for (i) different random intercepts of individual females for both hormones and (ii) for different slopes across the z-transformed time variable for each individual and hormone. In other words, this structure allows for individual-level variation in the intercept and slope of the relationship between the outcome variables and the predictor variable. In Bayesian models, priors help constrain the model estimates and provide additional information about the expected behavior of the parameters (McElreath, 2016). Therefore, we used the set_prior() function of the brms package (Bürkner, 2017) to specify prior distributions for the model parameters as follows. (i) We set a prior for the correlation matrix of the random effects for each female using a lkj prior (Lewandowski et al., 2009) with a shape parameter of 2 and a scaling parameter of −1.5. The shape parameter controls the concentration of the prior around zero correlations, while the scaling parameter governs the strength of the prior. A more negative value for the scaling parameter results in a more informative prior, pulling the correlations closer to zero. (ii) Next, we set a prior for the regression coefficient of the z-transformed time variable for log-transformed cortisol. As we can expect a decrease of cortisol across the time gradient for all females, we specified the prior distribution as a normal distribution with mean −1 (to account for the decrease of cortisol across time) and a standard deviation of 0.5 (to account for a moderate level of uncertainty). (iii) Similarly, we set a prior for the regression coefficient of the z-transformed time variable for log-transformed T3. However, as we expected an increase of T3 levels across the time gradient we specified the prior distribution as a normal distribution with mean 1. The standard deviation was set to 0.5 to account for moderate uncertainty. We set the set_rescor function to FALSE to turn off residual correlations between the two response variables. We further set a Student’s t-distribution for the response variables to allow for heavier tails than assumed by a gaussian distribution (Gelman et al., 1995), to better capture potential outliers or extreme values that may be present in the data, making the analysis more robust and accurate. The links were specified as identity for both the mean (mu) and standard deviation (sigma) parameters (regression coefficients are on the original scale). Results are based on calculations from five chains using NUTS (No-U-Turn Sampler) for Markov Chain Monte Carlo (MCMC) sampling, each with 10,000 iterations and 2000 warmups (a total of 40,000 post-warmup draws). Thinning was set to 1 to keep all samples.
To ensure the goodness of our model we performed a series of model diagnostics and compared our model to alternatives. To confirm that the model converged well, we checked the Gelman-Rubin diagnostics (Gelman and Rubin, 1992) using the rhat function of the brms package (Bürkner, 2017). Furthermore, we visually inspected posterior distributions of all model variables, posterior predictive check plots, residual plots, observed versus predicted plots, and autocorrelation. We tested for the sensitivity to prior specifications (using the loo package, after Vehtari et al., 2017) of our results by running alternative models with more and less informative priors and different distributions.
Results
The model included data of 19 non-pregnant, female bonobos. Table 2 gives an overview of means, SD, medians and ranges of urinary cortisol and T3 levels (ng/ml corr. SG).
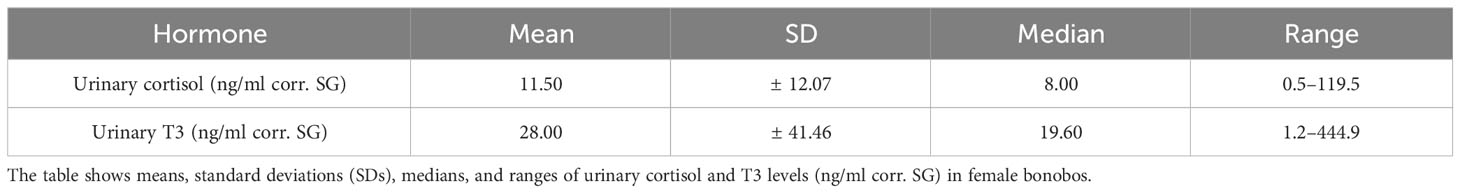
Table 2 Description of urinary cortisol and T3 data in female bonobos.
Visual inspection of posterior distributions, posterior predictive check plots, residual plots, and observed versus predicted plots of the model suggested that model assumptions were met. Gelman Rubin diagnostics indicated that the model converged well. Autocorrelation plots of the model variables did not indicate issues with autocorrelation in the data. Furthermore, comparing the model with different prior specifications (strong priors, weak priors, prior where no correlation between log-cortisol and log-T3 is assumed, and priors assuming a gaussian distribution) revealed that our original model fit the data best, but overall the results were not sensitive to different prior specifications.
Our multivariate random slope model estimated traits of individual reaction norms of the two response variables log-cortisol and log-T3 across the diurnal gradient as well as the correlations between them (Table 3).
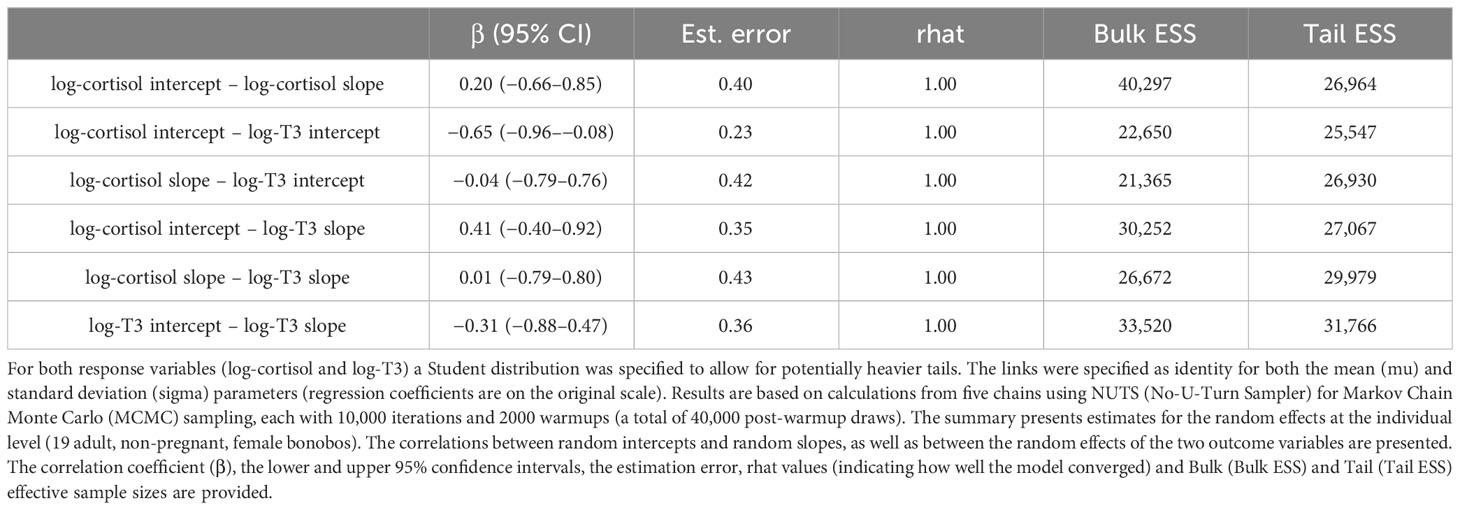
Table 3 Results of the multivariate random effects model.
Within-hormone reaction norm traits:
We found that the intercept and slope of log-cortisol were weakly positively correlated (at β = 0.20). Females with higher log-cortisol intercepts showed a steeper decrease of log-cortisol levels across the diurnal gradient, compared to females with lower log-cortisol intercepts. However, the credible intervals are large and include zero (95% CI: −0.65 to 0.85), which indicates a wide range within which the true parameter value is expected to lie. The correlation between the intercept and the slope of log-T3 revealed a negative relationship (β = −0.31, 95% CI: −0.88 to 0.48). This negative correlation indicates that females with higher intercepts of log-T3 tended to have slightly shallower slopes with respect to the diurnal gradient, and females with lower intercepts of log-T3 tended to have slightly steeper slopes. However, again, this effect is associated with a high degree of uncertainty (large credible intervals that include zero). These results indicate that there is neither a correlational relationship between the intercepts and slopes of log-cortisol, nor such a relationship between the intercepts and slopes of log-T3 in the females of this population.
Between-hormone reaction norm traits
The correlation between the intercepts of log-cortisol and log-T3 (Table 3; Figure 2A) showed a negative relationship (β = −0.65, 95% CI: −0.96 to −0.09). This negative correlation indicates that individuals with higher intercepts of log-cortisol had lower intercepts of log-T3, and vice versa. The standard error (SE) of the estimated correlation coefficient is 0.23, which further denotes a relatively precise estimate of the correlation coefficient. The correlation between the slopes of log-cortisol and log-T3 with respect to the diurnal gradient (Table 3; Figure 2B) was estimated to be β = 0.01 (with a SE of 0.43 and a 95% confidence interval of −0.79 to 0.80). This weak positive correlation with high uncertainty indicates that there is no linear relationship between the slopes of the two variables along the diurnal gradient. In other words, changes in log-cortisol along the time gradient were not systematically related to changes in log-T3 with respect to diurnal variation, and vice versa.
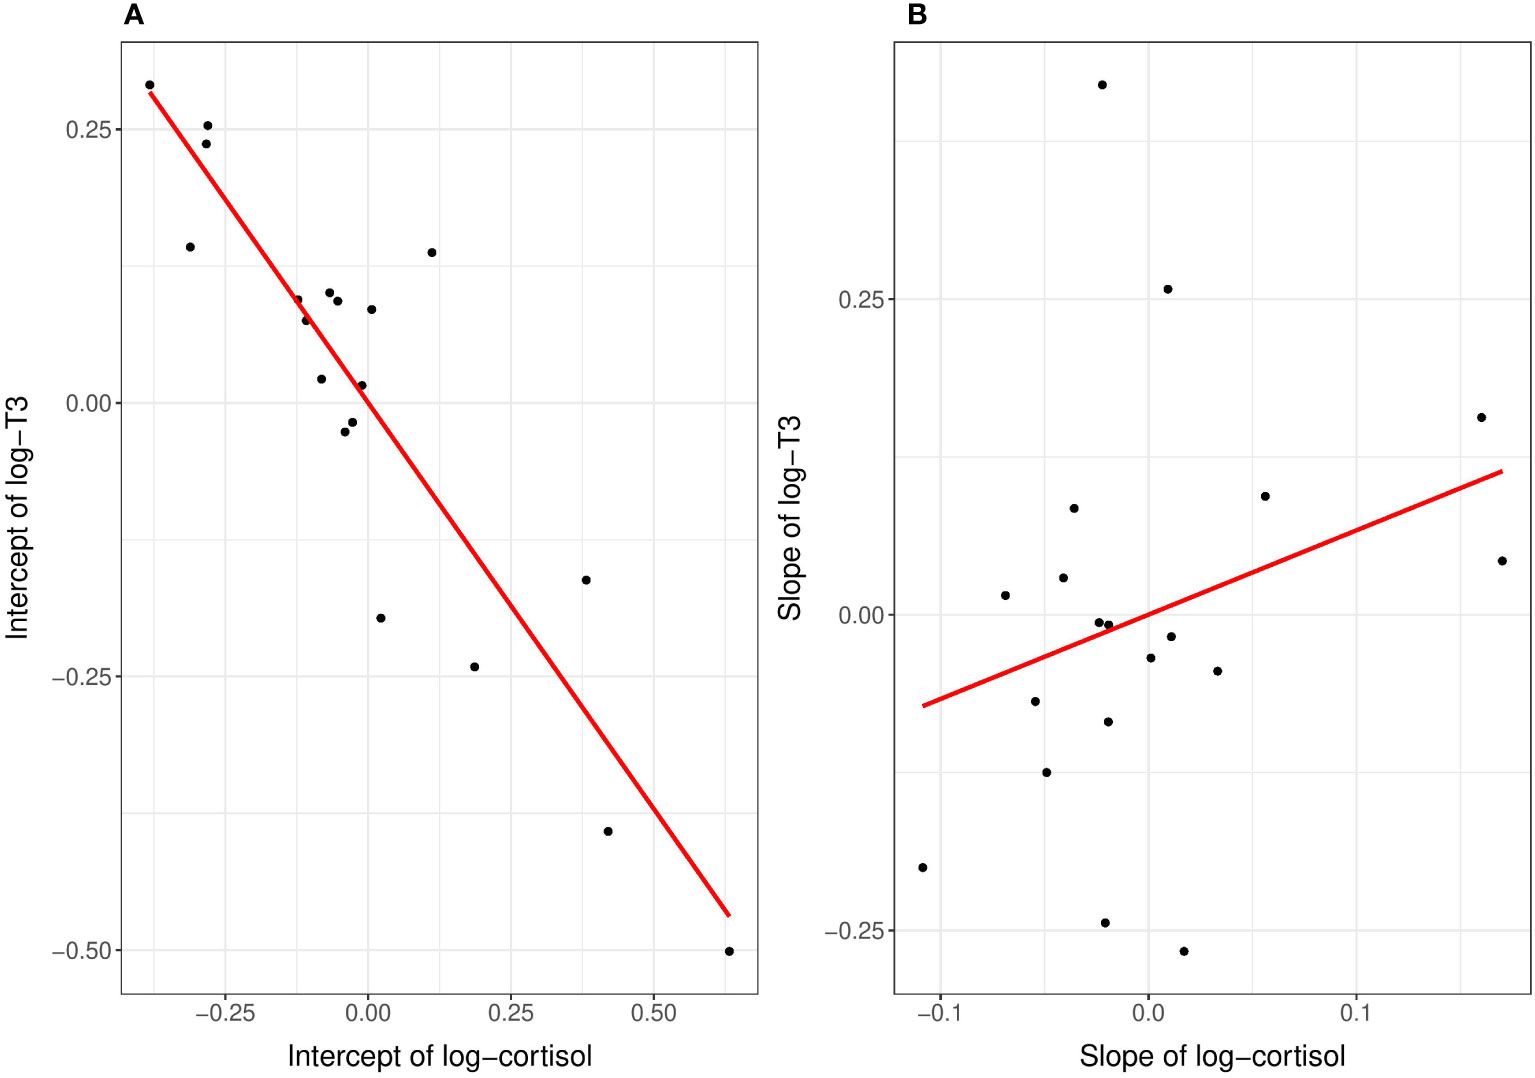
Figure 2 Correlational results of the reaction norm intercepts (A) and slopes (B) of log-cortisol and log-T3 in adult female bonobos. (A) The estimated intercepts of log-cortisol are on the x-axis, the estimated intercepts of log-T3 are on the y-axis. Each dot represents the estimated intercept of one female and red solid lines are regression lines. The higher the intercept in log-T3, the lower was the intercept in log-cortisol. (B) No correlational effect was found between the slopes of log-cortisol (on the x-axis) and log-T3 (on the y-axis).
Between-individual variation in reaction norms and population level effects
The estimated standard deviations (SD) indicate the between-individual variability of individual response patterns of log-cortisol and log-T3 to the standardized internal time gradient (diurnal gradient). The standard deviation can vary between 0 and 1. Higher standard deviations indicate more between-individual variation, suggesting that different individuals respond differently to the diurnal gradient. The estimated standard deviations of the random intercept for log-cortisol were 0.32 (95% CI: 0.18–0.52), for log-T3 0.29 (95% CI: 0.13–0.49). Therefore, the between-female variation of log-cortisol and log-T3 intercepts on the standardized time gradient was relatively similar and values were small. The between-female variation of log-cortisol slopes 0.17 (95% CI: 0.01–0.47) was smaller than for log-T3 slopes 0.30 (95% CI: 0.03–0.64), and both values were again small.
The population-level effects (Table 4) represent the average responses (typical outcome) of log-cortisol and log-T3 across all females. The estimated population level effect of the standardized time variable (z-time) on log-cortisol was β = −0.61 (95% CI: −0.81 to −0.41), indicating a relatively strong negative slope across the time gradient. For log-T3, the population level effect of the standardized time variable was estimated β = 0.25 (95% CI: −0.01 to 0.51). Given the sample size, the confidence interval is relatively small and the lower bound is close to zero. This suggests that on the population level we find a slight increase in log-T3 levels across the day.
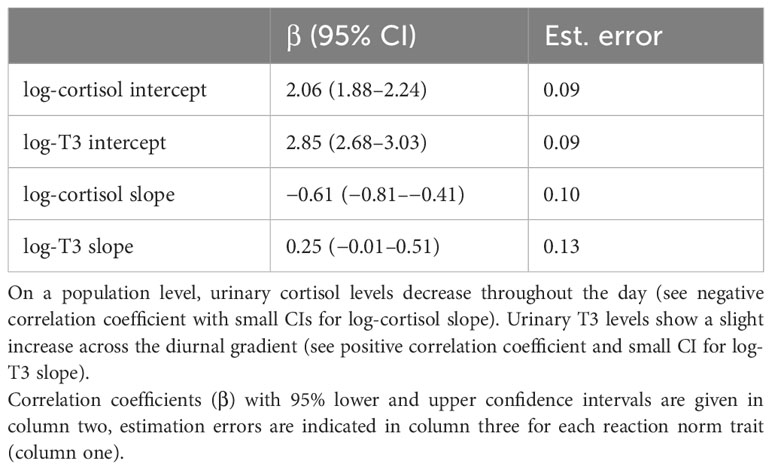
Table 4 Population level effects.
Discussion
Our multivariate random effects model provides insight into several aspects of metabolic hormone reaction norms in female bonobos: (i) Average phenotype (individual intercepts) is independent from plasticity (individual slopes) in both hormones, cortisol and T3. (ii) Average phenotype of cortisol is negatively related to average phenotype of T3, but cortisol and T3 plasticity are not related to each other. (iii) Inter-individual variation in reaction norm traits is relatively small for cortisol and T3, indicating that female bonobos have similar average phenotype and plasticity in both hormones. (iv) The population level effects confirm the presence of a relatively strong diurnal decrease in urinary cortisol levels, and a modest diurnal increase in urinary T3 levels across all 19 females.
Within-hormone reaction norms
We found that urinary cortisol and urinary T3 intercepts and slopes across the diurnal gradient are independent of each other. The correlation coefficients were small and associated confidence intervals large. While small effect sizes may necessitate a larger sample size to capture a potential effect, our model converged well (indicated by rhat values close to 1 for all correlations) and estimates were based on high effective sample sizes (indicated by the Bulk ESS and Tail ESS values). This indicates that the model obtained a sufficient number of independent samples to reliably estimate the parameters. Therefore, the lack of a notable correlation between female urinary cortisol intercepts and slopes and urinary T3 intercepts and slopes is less likely not driven by small sample size. Instead, the large effective sample sizes suggest that the model effectively captured the underlying patterns present in the data. Thus, the observed correlations are indeed weak, and their practical importance is negligible. The absence of a correlation between average phenotype (intercept) and plasticity (slope) in both metabolic hormones across the diurnal gradient indicates that these two traits (intercept and slope) are not functionally or genetically coupled for either hormone (Malkoc et al., 2022). Thus, independent of whether levels of cortisol or T3 are high or low, females can maintain high hormonal plasticity, which allows them to still respond to perturbations or challenges (Nussey et al., 2007; Dingemanse et al., 2010) in both hormonal markers independently. Different ecological or physiological mechanisms may drive the observed variation in average phenotype and plasticity of cortisol and T3, respectively. In contrast to our findings, one study on a wild passerine bird population found that average phenotype and plasticity in corticosterone levels co-varied along a temperature gradient (Hau et al., 2022). The differences of the results of this study and our work may be due to species-specific patterns of endocrine regulation or the impact of different gradients (diurnal in bonobos vs. temperature in birds) under study. The regulation of the hypothalamic–pituitary–thyroid (HPT) and hypothalamic–pituitary–adrenal (HPA) axes differs between mammals and birds. In mammals, corticotropin-releasing hormone (CRH) stimulates the secretion of glucocorticoids from the adrenal glands, whereas in birds, CRH activates glucocorticoid secretion and stimulates the release of thyroid-stimulating hormone (TSH) (De Groef et al., 2006; Castañeda Cortés et al., 2014). However, at this stage we cannot exclude that in bonobos, intercept and slope of cortisol along an external temperature gradient are functionally correlated and future studies will be required to explore the link between physiology and environmental parameters.
Between-hormone reaction norm relationships
Another notable result of our analyses is the negative relationship between the cortisol and T3 intercepts in individual female bonobos. Females with high cortisol intercepts had low T3 intercepts and vice versa. Our model converged, and the effective sample sizes were sufficiently large, ensuring the reliability of our findings. Elevated cortisol levels may indicate the need of restoring energy reserves (Romero and Beattie, 2022). These females may reduce energy expenditure in combination with a decline in basal metabolic rate, as reflected by their lower T3 levels (McAninch and Bianco, 2014). The negative correlation between cortisol and T3 intercepts adds to the evidence of a cross-talk between the two hormonal axes (HPA and HPT) that regulate cortisol and T3 levels. The HPA axis affects TH levels through various mechanisms. For instance, increased CRH levels stimulate somatostatin, which in turn suppresses the secretion of TRH and TSH, leading to a decline of THs production by the thyroid gland (Danforth and Burger, 1989; Charmandari et al., 2005). Additionally, glucocorticoids secreted by the HPA axis temporarily inhibit the activity of deiodinases, reducing the peripheral conversion of T4 to T3 (Charmandari et al., 2005). However, given that human studies found serum TH and TSH levels returned to pre-treatment levels after discontinuing exogenous glucocorticoid administration (Nicoloff et al., 1970) it is reasonable to assume that such effects of glucocorticoids on TH levels are likely temporary and reversible and that the HPT axis is able to adapt to long-lasting challenges of the HPA axis (Baumgartner et al., 1988). In our study, 12 out of the 19 females showed low cortisol and high T3 intercepts however. This could suggest that not only HPA axis activity influences the HPT axis, but the functional link between HPA and HPT axes may operate in both directions. We are not aware of any studies investigating the effect of THs on HPA axis activity and the examination of the cause-and-effect chain between HPA and HPT remain to be investigated.
At this point, it is challenging to fully interpret our result, as various factors that influence cortisol and T3 levels in female bonobos were not accounted for in our model. Environmental factors such as social interactions, food availability, and temperature, but also individual-specific parameters such as reproductive states (cycle phase and lactation), health, or demography are likely to affect individuals’ physiology and contribute to the correlational effect obtained in this study. Consideration of these and other parameters will improve future studies investigating diurnal cortisol and T3 intercepts and slopes in bonobos and other species. Another topic of interest is to what extent the reaction norm intercepts of individual females are repeatable over time. Do some females have a phenotype with a consistently high cortisol and low T3 intercept, versus other females who have a phenotype with a consistently low cortisol and high T3 intercept? Consistency of reaction norms over time within individual females would indicate that individual attributes associated with the costs and benefits of plasticity remain stable across time. Research on average reaction norms and plasticity has revealed that both can be influenced by sexual and natural selection, leading to significant implications for environmental processes and trait evolution (e.g., Piersma and Drent, 2003; Brommer, 2013; Dingemanse and Dochtermann, 2013). Our results indicate that cortisol and T3 are not inevitably interconnected in female bonobos. While the intercepts of cortisol and T3 across the diurnal gradient in female bonobos indeed displayed a negative correlation, we did not find a link between the plasticity of cortisol and T3 levels throughout the day. In other words, the extent of plasticity in urinary cortisol levels throughout the day was not related to the plasticity in T3.
Between-individual and population variation in reaction norm traits
The reaction norm approach has proven to be a powerful statistical approach in addressing questions about different physiological processes associated with energy balance. For instance, in house sparrows (Passer domesticus), glucocorticoid slopes were negatively related to a decrease in body mass during food restriction, but no relationship was found with the slope in oxidative stress (Lendvai et al., 2014). These studies contribute valuable information to our understanding of how individuals cope with environmental challenges and can inform effective conservation strategies. When it comes to considerations in conservation efforts, one factor that can be decisive in terms of developing conservation strategies is the ability of a population to respond to changing conditions in an adaptive way. Selective pressures can act on the population if there is a reasonable amount of variation of different phenotypes and genotypes. In our study population, between individual variability in reaction norm traits of the two metabolic hormones was present but small. Variation between females was similar for cortisol and T3 intercepts as well as for T3 slopes (see Table 3), but slightly smaller for cortisol slopes. Hormone regulation is closely linked to an individual’s life history, including growth, reproduction, and early life adversity (Crespi et al., 2013; Behringer et al., 2014; Emery Thompson, 2017; Berghänel et al., 2023). The phenotypic characteristics of glucocorticoid levels in individuals can be influenced by experiences during early life, such as maternal and/or developmental effects, as well as epigenetic factors (Hau et al., 2016; Behringer et al., 2022). The variability in hormone traits could be associated with diverse life history strategies adopted by individuals in the population. This is part of the “pace-of-life syndrome”, a conceptual framework that is representative of the phenotypic co-variation across individuals within a population or species, encompassing behavioral, morphological, but also physiological traits (Araya-Ajoy et al., 2018). Some individuals may invest in reproduction, which is associated with high cortisol and T3 levels, while others may prioritize resource conservation, which reduces hormone levels. These strategies can impact population dynamics and fitness trade-offs (Williams, 2013). Overall, a better understanding of the ecology and evolution of physiological traits will shed light on the mechanisms driving population dynamics, individual fitness, and responses to environmental changes. Further research is needed to explore how this variation interacts with other ecological and evolutionary factors to shape the population’s performance and dynamics over time.
Change in internal or external conditions requires individuals to adjust parameters that maintain homeostasis. We have a fair amount of information on how environmental conditions shape anatomical adaptations. For instance, in humans, some individuals show an increase in lung tissue, which allows them to cope well in high altitudes where air pressure and consequently oxygen concentration is low (e.g., Frisancho, 1975; de Meer et al., 1995). This expression of an anatomical trait was shaped by natural selection acting on individuals of the local population. However, little is known about the flexibility, plasticity, and evolution of labile traits, such as hormonal patterns. The function of physiological traits receives increasing attention though (for instance: Baugh et al., 2014; Guindre-Parker, 2020; Malkoc et al., 2022; Giroud et al., 2022), also because highly variable traits are well suited to respond to changes of internal and external conditions (Meyers and Bull, 2002), a challenge that many species are currently confronted with. Our analyses of bonobo reaction norms of cortisol and T3 across the diurnal gradient indicate that there are no major tradeoffs (e.g., investment in high average phenotypes is not associated with reduced plasticity), although still some limitation (cortisol and T3 average phenotypes negatively correlated) in the adjustments of the two metabolic hormones. This suggests, that bonobos can modulate the two metabolic hormones independently from each other in a flexible way. Such a trait would be of great advantage in an environment where fluctuation of food resources is a common pattern. Frugivore primate species are exposed to consistent changes in resource abundance and some species including bonobos engage in a fission–fusion grouping pattern to reduce resource competition. The reaction norms of metabolic hormones could be another trait that facilitates exploitation of unpredictable food sources.
Data availability statement
Source data for statistics and figures in the paper is permanently stored at GRO (https://doi.org/10.25625/5HIDII).
Ethics statement
Ethical approval was not required for the study involving animals in accordance with the local legislation and institutional requirements because Our procedures adhered to a rigorous protocol that ensured a non-contact and non-invasive approach. We were authorized by the Institut Congolaise pour la Conservation de la Nature (ICCN) to carry out our research in LuiKotale, Salonga National Park, Democratic Republic of Congo (Permission Number: 0683/ICCN/DG/ADG/014/KV/2012). The ICCN also granted us permits (Permit Number: 0521/ICCN/DG/CWB/05/01/2014) for exporting urine samples from the Democratic Republic of Congo. Additionally, the German Ministry for Social Affairs and Consumer Protection issued the necessary permits for importing these samples.
Author contributions
RS: Conceptualization, Formal Analysis, Methodology, Visualization, Writing – original draft, Writing – review & editing. GH: Methodology, Resources, Writing – review & editing. JS: Conceptualization, Writing – review & editing. TD: Methodology, Resources, Writing – review & editing. BF: Resources, Writing – review & editing. AF: Investigation, Writing – review & editing. NN: Investigation, Writing – review & editing. VB: Conceptualization, Methodology, Writing – original draft.
Funding
The author(s) declare financial support was received for the research, authorship, and/or publication of this article. RS was supported by the Austrian Science Fund (FWF, Young Independent Researcher Group (YIRG) grant; Grant Number ZK 66). NN was supported by the German Research Foundation (Deutsche Forschungsgemeinschaft; grant numbers SCHU 1554/4-1 and HO 1151/9-1). VB was supported by funding by the German Research Foundation (Deutsche Forschungsgemeinschaft; grant number BE 5511/4-1). Long-term data collection at LuiKotale is funded by the Max Planck Society and the Centre for Research and Conservation of the Royal Zoological Society of Antwerp. Additional support ensuring the collection of long-term data came from Bonobo Alive, The Federal Ministry of Education and Research (Germany), the Leakey Foundation and the Wenner-Gren Foundation. Funding for laboratory analyses was provided by the Max Planck Society.
Acknowledgments
We express our gratitude to Róisín Murtagh and Vera Schmeling for their valuable assistance with LC-MS extraction and measurement. Special thanks go to the Institut Congolais pour la Conservation de la Nature (ICCN) and the community of Lompole for granting us permission to conduct fieldwork on bonobos in their forest within the buffer zone of Salonga National Park. We extend our thanks to all individuals who assisted with data collection for the LuiKotale Bonobo Project.
Conflict of interest
The authors declare that the research was conducted in the absence of any commercial or financial relationships that could be construed as a potential conflict of interest.
Publisher’s note
All claims expressed in this article are solely those of the authors and do not necessarily represent those of their affiliated organizations, or those of the publisher, the editors and the reviewers. Any product that may be evaluated in this article, or claim that may be made by its manufacturer, is not guaranteed or endorsed by the publisher.
Supplementary material
The Supplementary Material for this article can be found online at: https://www.frontiersin.org/articles/10.3389/fevo.2023.1300003/full#supplementary-material
References
Araya-Ajoy Y. G., Bolstad G. H., Brommer J., Careau V., Dingemanse N. J., Wright J. (2018). Demographic measures of an individual’s “pace of life”: fecundity rate, lifespan, generation time, or a composite variable? Behav. Ecol. Sociobiol 72, 75. doi: 10.1007/s00265-018-2477-7
Araya-Ajoy Y. G., Mathot K. J., Dingemanse N. J. (2015). An approach to estimate short-term, long-term and reaction norm repeatability. Methods Ecol. Evol. 6, 1462–1473. doi: 10.1111/2041-210X.12430
Baugh A. T., Oers K., Dingemanse N. J., Hau M. (2014). Baseline and stress-induced glucocorticoid concentrations are not repeatable but covary within individual great tits (Parus major). Gen. Comp. Endocrinol. 208, 154–163. doi: 10.1016/j.ygcen.2014.08.014
Baumgartner A., Gräf K.-J., Kürten I., Meinhold H. (1988). The hypothalamic-pituitary-thyroid axis in psychiatric patients and healthy subjects: Parts 1–4: Part 1. Repeated thyrotropin-releasing hormone tests in patients with major depressive disorder, patients with schizophrenia, and healthy subjects. Psychiatry Res. 24, 271–283. doi: 10.1016/0165-1781(88)90109-6
Behringer V., Berghänel A., Deschner T., Lee S. M., Fruth B., Hohmann G. (2022). Transition to siblinghood causes a substantial and long-lasting increase in urinary cortisol levels in wild bonobos. eLife 11, e77227. doi: 10.7554/eLife.77227
Behringer V., Deimel C., Hohmann G., Negrey J., Schaebs F. S., Deschner T. (2018). Applications for non-invasive thyroid hormone measurements in mammalian ecology, growth, and maintenance. Hormones Behav. 105, 66–85. doi: 10.1016/j.yhbeh.2018.07.011
Behringer V., Deschner T., Murtagh R., Stevens J. M. G., Hohmann G. (2014). Age-related changes in thyroid hormone levels of bonobos and chimpanzees indicate heterochrony in development. J. Hum. Evol. 66, 83–88. doi: 10.1016/j.jhevol.2013.09.008
Behringer V., Heistermann M., Malaivijitnond S., Schülke O., Ostner J. (2023). Developmental and environmental modulation of fecal thyroid hormone levels in wild Assamese macaques (Macaca assamensis). Am. J. Primatology 85 (9), e23530. doi: 10.1002/ajp.23530
Berghänel A., Stevens J. M. G., Hohmann G., Deschner T., Behringer V. (2023). Adolescent length growth spurts in bonobos and other primates: Mind the scale. eLife 12, RP86635 doi: 10.1101/2023.01.26.525764
Bessone M., Booto L., Santos A. R., Kühl H. S., Fruth B. (2021). No time to rest: How the effects of climate change on nest decay threaten the conservation of apes in the wild. PloS One 16, e0252527. doi: 10.1371/journal.pone.0252527
Bosker R., Snijders T. A. (2011)Multilevel analysis : an introduction to basic and advanced multilevel modeling. In: Multilevel analysis (Sage). Available at: https://www.torrossa.com/en/resources/an/4912508 (Accessed July 24, 2023).
Brommer J. E. (2013). Phenotypic plasticity of labile traits in the wild. Curr. Zool 59, 485–505. doi: 10.1093/czoolo/59.4.485
Bürkner P.-C. (2017). brms: an R package for bayesian multilevel models using stan. J. Stat. Software 80, 1–28. doi: 10.18637/jss.v080.i01
Burr W. A., Griffiths R. S., Ramsden D. B., Black E. G., Hoffenberg R., Meinhold H., et al. (1976). Effect of a single dose of dexamethasone on serum concentrations of thyroid hormones. Lancet 308, 58–61. doi: 10.1016/S0140-6736(76)92283-2
Castañeda Cortés D. C., Langlois V. S., Fernandino J. I. (2014)Crossover of the hypothalamic pituitary–adrenal/interrenal, –thyroid, and –gonadal axes in testicular development (Accessed August 1, 2023).
Charmandari E., Tsigos C., Chrousos G. (2005). Endocrinology of the stress response. Annu. Rev. Physiol. 67, 259–284. doi: 10.1146/annurev.physiol.67.040403.120816
Crespi E. J., Williams T. D., Jessop T. S., Delehanty B. (2013). Life history and the ecology of stress: how do glucocorticoid hormones influence life-history variation in animals? Funct. Ecol. 27, 93–106. doi: 10.1111/1365-2435.12009
Danforth E., Burger A. G. (1989). The impact of nutrition on thyroid hormone physiology and action. Annu. Rev. Nutr. 9, 201–227. doi: 10.1146/annurev.nu.09.070189.001221
De Groef B., van der Geyten S., Darras V. M., Kühn E. R. (2006). Role of corticotropin-releasing hormone as a thyrotropin-releasing factor in non-mammalian vertebrates. Gen. Comp. Endocrinol. 146, 62–68. doi: 10.1016/j.ygcen.2005.10.014
de Manuel M., Kuhlwilm M., Frandsen P., Sousa V. C., Desai T., Prado-Martinez J., et al. (2016). Chimpanzee genomic diversity reveals ancient admixture with bonobos. Science 354, 477–481. doi: 10.1126/science.aag2602
de Meer K., Heymans H. S. A., Zijlstra W. G. (1995). Physical adaptation of children to life at high altitude. Eur. J. Pediatr. 154, 263–272. doi: 10.1007/BF01957359
Dingemanse N. J., Dochtermann N. A. (2013). Quantifying individual variation in behaviour: mixed-effect modelling approaches. J. Anim. Ecol. 82, 39–54. doi: 10.1111/1365-2656.12013
Dingemanse N. J., Edelaar P., Kempenaers B. (2010). Why is there variation in baseline glucocorticoid levels? Trends Ecol. Evol. 25, 261–262. doi: 10.1016/j.tree.2010.01.008
Emery Thompson M. (2017). Energetics of feeding, social behavior, and life history in non-human primates. Hormones Behav. 91, 84–96. doi: 10.1016/j.yhbeh.2016.08.009
Fazio E., Medica P., Cravana C., Ferlazzo A. (2008). Effects of competition experience and transportation on the adrenocortical and thyroid responses of horses. Veterinary Rec. 163, 713–716. doi: 10.1136/vr.163.24.713
Frisancho A. R. (1975). Functional adaptation to high altitude hypoxia. Science 187, 313–319. doi: 10.1126/science.1089311
Fruth B., Hohmann G. (1993). Ecological and behavioral aspects of nest building in wild bonobos (Pan paniscus). Ethology 94, 113–126. doi: 10.1111/j.1439-0310.1993.tb00552.x
Fruth B., Ikombe N. B., Matshimba G. K., Metzger S., Muganza D. M., Mundry R., et al. (2014). New evidence for self-medication in bonobos: Manniophyton fulvum leaf- and stemstrip-swallowing from LuiKotale, Salonga National Park, DR Congo: Bonobo Self-Medication. Am. J. Primatology 76, 146–158. doi: 10.1002/ajp.22217
Gelman A. (2008). Scaling regression inputs by dividing by two standard deviations. Statist. Med. 27, 2865–2873. doi: 10.1002/sim.3107
Gelman A., Carlin J. B., Stern H. S., Rubin D. B. (1995). Bayesian data analysis (New York: Chapman and Hall/CRC). doi: 10.1201/9780429258411
Gelman A., Rubin D. B. (1992). Inference from iterative simulation using multiple sequences. Stat. Sci. 7, 457–472. doi: 10.1214/ss/1177011136
Giroud S., Habold C., Vetter S., Painer J., Four-Chaboussant A., Smith S., et al. (2022). Living in a changing world: Physiological and behavioural flexibility of juvenile Garden Dormice. ARPHA Conf. Abstracts 5, e81850. doi: 10.3897/aca.5.e81850
Goymann W., Helm B., Jensen W., Schwabl I., Moore I. T. (2012). A tropical bird can use the equatorial change in sunrise and sunset times to synchronize its circannual clock. Proc. R. Soc. B: Biol. Sci. 279, 3527–3534. doi: 10.1098/rspb.2012.0743
Guindre-Parker S. (2020). Individual variation in glucocorticoid plasticity: considerations and future directions. Integr. Comp. Biol. 60, 79–88. doi: 10.1093/icb/icaa003
Han S., Andrés A. M., Marques-Bonet T., Kuhlwilm M. (2019). Genetic variation in pan species is shaped by demographic history and harbors lineage-specific functions. Genome Biol. Evol. 11, 1178–1191. doi: 10.1093/gbe/evz047
Hau M., Casagrande S., Ouyang J. Q., Baugh A. T. (2016). “Chapter two - glucocorticoid-mediated phenotypes in vertebrates: multilevel variation and evolution,” in Advances in the study of behavior. Eds. Marc Naguib J. C. M., Simmons L. W., Barrett L., Healy S., Zuk M. (Elsevier), 41–115. doi: 10.1016/bs.asb.2016.01.002
Hau M., Deimel C., Moiron M. (2022). Great tits differ in glucocorticoid plasticity in response to spring temperature. Proc. R. Soc. B: Biol. Sci. 289, 20221235. doi: 10.1098/rspb.2022.1235
Hau M., Goymann W. (2015). Endocrine mechanisms, behavioral phenotypes and plasticity: known relationships and open questions. Front. Zool 12, S7. doi: 10.1186/1742-9994-12-S1-S7
Haus E. (2007). Chronobiology in the endocrine system. Advanced Drug Delivery Rev. 59, 985–1014. doi: 10.1016/j.addr.2007.01.001
Hauser B., Deschner T., Boesch C. (2008). Development of a liquid chromatography–tandem mass spectrometry method for the determination of 23 endogenous steroids in small quantities of primate urine. J. Chromatogr. B 862, 100–112. doi: 10.1016/j.jchromb.2007.11.009
Ikegami K., Refetoff S., Van Cauter E., Yoshimura T. (2019). Interconnection between circadian clocks and thyroid function. Nat. Rev. Endocrinol. 15, 590–600. doi: 10.1038/s41574-019-0237-z
Jeanniard du Dot T., Rosen D. A. S., Richmond J. P., Kitaysky A. S., Zinn S. A., Trites A. W. (2009). Changes in glucocorticoids, IGF-I and thyroid hormones as indicators of nutritional stress and subsequent refeeding in Steller sea lions (Eumetopias jubatus). Comp. Biochem. Physiol. Part A: Mol. Integr. Physiol. 152, 524–534. doi: 10.1016/j.cbpa.2008.12.010
Jerjes W. K., Peters T. J., Taylor N. F., Wood P. J., Wessely S., Cleare A. J. (2006). Diurnal excretion of urinary cortisol, cortisone, and cortisol metabolites in chronic fatigue syndrome. J. Psychosom Res. 60, 145–153. doi: 10.1016/j.jpsychores.2005.07.008
Jordan D., Rousset B., Perrin F., Fournier M., Orgiazzi J. (1980). Evidence for circadian variations in serum thyrotropin, 3,5,3’-triiodothyronine, and thyroxine in the rat. Endocrinology 107, 1245–1248. doi: 10.1210/endo-107-4-1245
Kim B. H., Joo Y., Kim M.-S., Choe H. K., Tong Q., Kwon O. (2021). Effects of intermittent fasting on the circulating levels and circadian rhythms of hormones. Endocrinol. Metab. (Seoul) 36, 745–756. doi: 10.3803/EnM.2021.405
Lema S. C. (2014). Hormones and phenotypic plasticity in an ecological context: linking physiological mechanisms to evolutionary processes. Integr. Comp. Biol. 54, 850–863. doi: 10.1093/icb/icu019
Lendvai A. Z., Ouyang J. Q., Schoenle L. A., Fasanello V., Haussmann M. F., Bonier F., et al. (2014). Experimental food restriction reveals individual differences in corticosterone reaction norms with no oxidative costs. PloS One 9, e110564. doi: 10.1371/journal.pone.0110564
Lewandowski D., Kurowicka D., Joe H. (2009). Generating random correlation matrices based on vines and extended onion method. J. Multivariate Anal. 100, 1989–2001. doi: 10.1016/j.jmva.2009.04.008
Lighten J., Incarnato D., Ward B. J., van Oosterhout C., Bradbury I., Hanson M., et al. (2016). Adaptive phenotypic response to climate enabled by epigenetics in a K-strategy species, the fish Leucoraja ocellata (Rajidae). R. Soc. Open Sci. 3, 160299. doi: 10.1098/rsos.160299
MacArthur R. H., Wilson E. O. (1967). The theory of island biogeography (Princeton, N.J: Princeton University Press). Available at: https://press.princeton.edu/books/paperback/9780691088365/the-theory-of-island-biogeography (Accessed August 11, 2023).
Malkoc K., Mentesana L., Casagrande S., Hau M. (2022). Quantifying glucocorticoid plasticity using reaction norm approaches: there still is so much to discover! Integr. Comp. Biol. 62, 58–70 doi: 10.1093/icb/icab196
Mastorakos G., Ilias I. (2009). Maternal and fetal hypothalamic-pituitary-adrenal axes during pregnancy and postpartum. Ann. New York Acad. Sci. 997, 136–149. doi: 10.1196/annals.1290.016
Mastorakos G., Pavlatou M. (2005). Exercise as a stress model and the interplay between the hypothalamus-pituitary-adrenal and the hypothalamus-pituitary-thyroid axes. Horm. Metab. Res. 37, 577–584. doi: 10.1055/s-2005-870426
McAninch E. A., Bianco A. C. (2014). Thyroid hormone signaling in energy homeostasis and energy metabolism. Ann. New York Acad. Sci. 1311, 77–87. doi: 10.1111/nyas.12374
McElreath R. (2016). Statistical rethinking: A bayesian course with examples in R and stan (Boca Raton: Chapman and Hall/CRC). doi: 10.1201/9781315372495
Meyers L. A., Bull J. J. (2002). Fighting change with change: adaptive variation in an uncertain world. Trends Ecol. Evol. 17, 551–557. doi: 10.1016/S0169-5347(02)02633-2
Nicoloff J. T., Fisher D. A., Appleman M. D. (1970). The role of glucocorticoids in the regulation of thyroid function in man. J. Clin. Invest. 49, 1922–1929. doi: 10.1172/JCI106411
Nurmi N. O., Sonnweber R., Schülke O., Moscovice L. R., Deschner T., Hohmann G. (2023). Bonobo mothers have elevated urinary cortisol levels during early but not mid or late lactation. Primates 64, 215–225. doi: 10.1007/s10329-022-01044-7
Nussey D. H., Wilson A. J., Brommer J. E. (2007). The evolutionary ecology of individual phenotypic plasticity in wild populations. J. Evolutionary Biol. 20, 831–844. doi: 10.1111/j.1420-9101.2007.01300.x
Oki C., Atkinson S. (2004). Diurnal patterns of cortisol and thyroid hormones in the Harbor seal (Phoca vitulina) during summer and winter seasons. Gen. Comp. Endocrinol. 136, 289–297. doi: 10.1016/j.ygcen.2004.01.007
Osada N. (2015). Genetic diversity in humans and non-human primates and its evolutionary consequences. Genes Genet. Syst. 90, 133–145. doi: 10.1266/ggs.90.133
Philippe J., Dibner C. (2015). Thyroid circadian timing: roles in physiology and thyroid Malignancies. J. Biol. Rhythms 30, 76–83. doi: 10.1177/0748730414557634
Piersma T., Drent J. (2003). Phenotypic flexibility and the evolution of organismal design. Trends Ecol. Evol. 18, 228–233. doi: 10.1016/S0169-5347(03)00036-3
Prado-Martinez J., Sudmant P. H., Kidd J. M., Li H., Kelley J. L., Lorente-Galdos B., et al. (2013). Great ape genetic diversity and population history. Nature 499, 471–475. doi: 10.1038/nature12228
Reeder D. A. M., Kramer K. M. (2005). Stress in free-ranging mammals: integrating physiology, ecology, and natural history. J. Mammalogy 86, 225–235. doi: 10.1644/BHE-003.1
Romero L. M., Beattie U. K. (2022). Common myths of glucocorticoid function in ecology and conservation. J. Exp. Zoology Part A: Ecol. Integr. Physiol. 337, 7–14. doi: 10.1002/jez.2459
Romero L. M., Wingfield J. C. (2015). “Responses to natural perturbations: variation in available energy,” in Tempests, poxes, predators, and people: stress in wild animals and how they cope. Eds. Romero L. M., Wingfield J. C. (Oxford, New York: Oxford University Press). doi: 10.1093/acprof:oso/9780195366693.003.0007
Sonnweber R., Araya-Ajoy Y. G., Behringer V., Deschner T., Tkaczynski P., Fedurek P., et al. (2018). Circadian rhythms of urinary cortisol levels vary between individuals in wild male chimpanzees: A reaction norm approach. Front. Ecol. Evol. 6. doi: 10.3389/fevo.2018.00085
Touitou S., Heistermann M., Schülke O., Ostner J. (2021). Triiodothyronine and cortisol levels in the face of energetic challenges from reproduction, thermoregulation and food intake in female macaques. Hormones Behav. 131, 104968. doi: 10.1016/j.yhbeh.2021.104968
Vehtari A., Gelman A., Gabry J. (2017). Practical Bayesian model evaluation using leave-one-out cross-validation and WAIC. Stat. Comput. 27, 1413–1432. doi: 10.1007/s11222-016-9696-4
Vida G. (1994). “Global issues of genetic diversity,” in Conservation genetics EXS. Eds. Loeschcke V., Jain S. K., Tomiuk J. (Basel: Birkhäuser), 9–19. doi: 10.1007/978-3-0348-8510-2_2
Weeke J., Gundersen H. J. (1978). Circadian and 30 minutes variations in serum TSH and thyroid hormones in normal subjects. Acta Endocrinol. (Copenh) 89, 659–672. doi: 10.1530/acta.0.0890659
Williams C. K. (2013). Accounting for wildlife life-history strategies when modeling stochastic density-dependent populations: A review. J. Wildlife Manage. 77, 4–11. doi: 10.1002/jwmg.429
Keywords: glucocorticoids, cortisol, thyroid hormones, triiodothyronine (T3), reaction norms, non-invasive
Citation: Sonnweber R, Hohmann G, Stevens JMG, Deschner T, Fruth B, Fiedler A-L, Nurmi NO and Behringer V (2023) Average phenotype but not plasticity in two metabolic hormones covary in wild female bonobos (Pan paniscus). Front. Ecol. Evol. 11:1300003. doi: 10.3389/fevo.2023.1300003
Received: 23 September 2023; Accepted: 22 November 2023;
Published: 08 December 2023.
Edited by:
Daniel Becker, University of Oklahoma, United StatesReviewed by:
Susanne R. K. Zajitschek, Liverpool John Moores University, United KingdomBreanna N. Harris, Texas Tech University, United States
Copyright © 2023 Sonnweber, Hohmann, Stevens, Deschner, Fruth, Fiedler, Nurmi and Behringer. This is an open-access article distributed under the terms of the Creative Commons Attribution License (CC BY). The use, distribution or reproduction in other forums is permitted, provided the original author(s) and the copyright owner(s) are credited and that the original publication in this journal is cited, in accordance with accepted academic practice. No use, distribution or reproduction is permitted which does not comply with these terms.
*Correspondence: Ruth Sonnweber, ruth-sophie.sonnweber@univie.ac.at