Assessing restoration and degradation of natural and artificial vegetation in the arid zone of Northwest China
 Jinxia Zhang
 Zhi Li
 Weili Duan
 Hongfang Zhao
 Haichao Hao
 Yanyun Xiang
 Qifei Zhang
- 1School of Geographic Sciences, East China Normal University, Shanghai, China
- 2Key Laboratory of Geographic Information Science, Ministry of Education, East China Normal University, Shanghai, China
- 3State Key Laboratory of Desert and Oasis Ecology, Xinjiang Institute of Ecology and Geography, Urumqi, China
- 4School of Public Administration, Shanxi University of Finance and Economics, Taiyuan, China
- 5School of Geographic Sciences, Shanxi Normal University, Taiyuan, China
Assessing vegetation restoration and degradation trends is important for regional ecological conservation and sustainable development, yet few studies have examined the characteristics of these trends in natural and artificial vegetation in arid zones. In this study, we develop an assessment framework based on two common ecological indicators, Net Primary Productivity (NPP) and Water Use Efficiency (WUE). We discuss the restoration and degradation trends of natural and artificial vegetation in China’s Northwest Arid Region (NAR) and analyze the similarities and differences between the changes in the two. Our results reveal the following: (1) Both natural vegetation (Nav) NPP and artificial vegetation (Arv) NPP in the NAR are dominated by significant growth, with precipitation being the most influential factor. Arv NPP changes are greater than Nav NPP. (2) WUE and NPP have similar spatial distribution characteristics, with precipitation and temperature dominating WUE changes in the Qilian Mountains and s southern Xinjiang, respectively. In the near future, Nav WUE is expected to be dominated by improvement to degradation, while Arv WUE will continue to improve under human intervention. These two indices respond differently to the environmental factors that cause their changes. (3) Nav and Arv exhibit similar restoration and degradation trends, mainly dominated by early recovery with Nav displaying a slightly more prominent restoration trend than Arv. The NPP-WUE assessment framework will help to rapidly assess vegetation degradation and restoration at large scales, providing new perspectives for research in this field.
1. Introduction
According to the newly published World Atlas of Desertification, more than 75% of the world’s land is already degraded. By 2050, this proportion is predicted to exceed 90% (Ádám and Křeček, 2019). As multiple regions across the globe are suffering from the effects of drought, degradation and desertification, coping with these issues has become an international flash point that will challenge the achievement of the United Nations Sustainable Development Goals (SDGs; Stavi and Lal, 2015; Barbier and Hochard, 2018). To alleviate environmental pressures and improve ecosystems, the Chinese government started a series of ecological construction projects in the late 20th century (Lü et al., 2012; Bryan et al., 2018). The Northwest Arid Region (NAR) is one of the most ecologically fragile regions in China. In recent years, with the development of oasis agriculture, there has been serious vegetation destruction in that zone, making it a priority area for ecological construction (Fang et al., 2001; Li et al., 2019).
Artificial vegetation (Arv) is an important component of the NAR’s ecosystem. Arv is also an important complement to natural ecosystems, so China’s vast Arv region plays a key role in enhancing ecosystem services and mitigating climate warming (Peng et al., 2014; Tang et al., 2018). Several studies have attempted to explore the structural differences as well as the degradation and restoration patterns between Arv and natural vegetation (Nav; Domec et al., 2015; Fu et al., 2017). Recent research suggests that Nav restoration significantly improves soil organic carbon storage and inorganic nitrogen accumulation in restored areas compared to Arv restoration; it also plays an important role in improving soil aggregate stability and erosion resistance (Hu et al., 2019; Dou et al., 2020). Over the long term, Arv planting is anticipated to cause degradation of vegetation when it exceeds the natural carrying capacity, causing the growth of Nav to saturate or even decrease (Xu, 2022). These widespread trends in vegetation restoration and subsequent degradation have caused considerable concern. However, due to the complexity of the processes involved, especially in arid areas, there is considerable uncertainty in their assessment. Vegetation restoration and degradation in arid zones remains poorly studied, which limits our understanding of the change mechanisms contributing to the phenomenon.
With the development of remote sensing techniques, ecological indicators such as the Normalized Difference Vegetation Index (NDVI) and Net Primary Productivity (NPP) are now being widely used to characterize vegetation growth trends (Wessels et al., 2012; Le et al., 2016). The most popular method is the simulation of NPP estimation based on NDVI and using the Carnegie-Ames-Stanford Approach (CASA). However, there is uncertainty in assessing desertification processes when relying solely on NPP indicators. Furthermore, desertification not only has an impact on vegetation quantity, but usually also on the photosynthetic characteristics, species composition, and water use efficiency (WUE) of vegetation (Zhao et al., 2009; Zheng et al., 2011).
Water use efficiency refers to the ratio of CO2 assimilation rate to transpiration rate or stomatal conductance of leaves and is used to reflect the physiological condition of plants (Farquhar and Richards, 1984; Law et al., 2002). Typically, WUE changes very little, but it does change significantly under certain circumstances, such as when plants become physiologically adapted to extreme climatic conditions, when photosynthesis, transpiration and stomatal conductance of leaves change, or when changes in vegetation composition occur (Do and Kang, 2014; Huang et al., 2015). In an environment that has turned arid, pore conductance preferentially decreases photosynthesis, causing transpiration to decrease and plant WUE to increase. In contrast, WUE decreases when severe drought occurs (Taylor et al., 2010; Li et al., 2015).
Vegetation productivity, species composition, and physiological characteristics respond differently to environmental stresses during the various stages of vegetation degradation. While NPP and WUE can characterize some information about changes in vegetation production and species composition, respectively, the joint use of these two indicators to build a framework can characterize different stages of vegetation degradation more effectively than the use of individual indicators alone (Ruppert et al., 2012; Horion et al., 2016). Based on this approach, the present study uses a joint WUE and NPP framework to assess the degradation and restoration trends of natural and artificial vegetation in the arid zone of northwest China and to analyze the differences between the two trends (Figure 1). The aim in conducting this research is to provide a scientific basis for vegetation conservation and ecological environment improvement in the NAR.
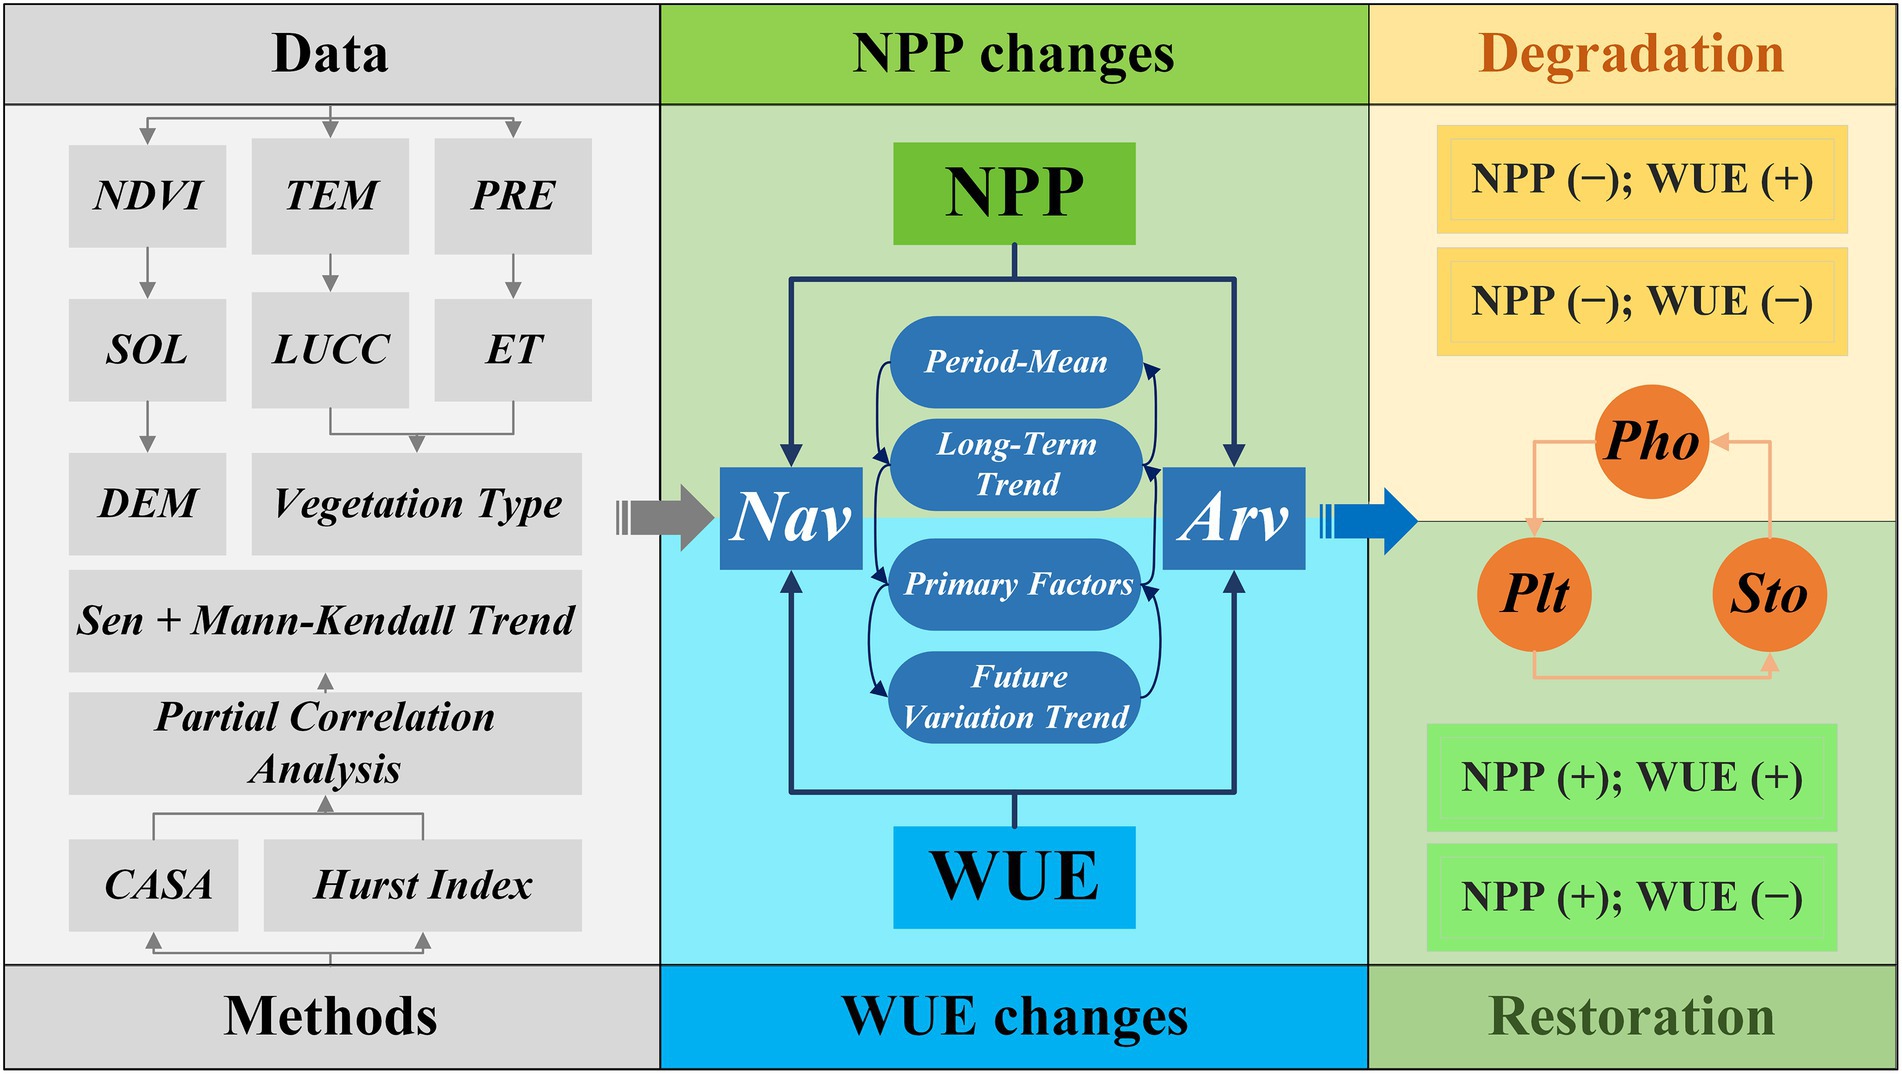
Figure 1. Technical roadmap for the study.
2. Study area
The Northwest Arid Region (NAR) is located in the interior of western China. It covers an area of about 2.11 × 10⁶ square kilometers and includes Xinjiang, northern Gansu, and western Inner Mongolia. The NAR has a complex and diverse landscape, with undulating terrain and a topography that is dominated by plateaus, mountains, and basins. The natural landscape constitutes a special geographical pattern with the coexistence of three major ecosystems: mountain-oasis-desert (Figure 2).
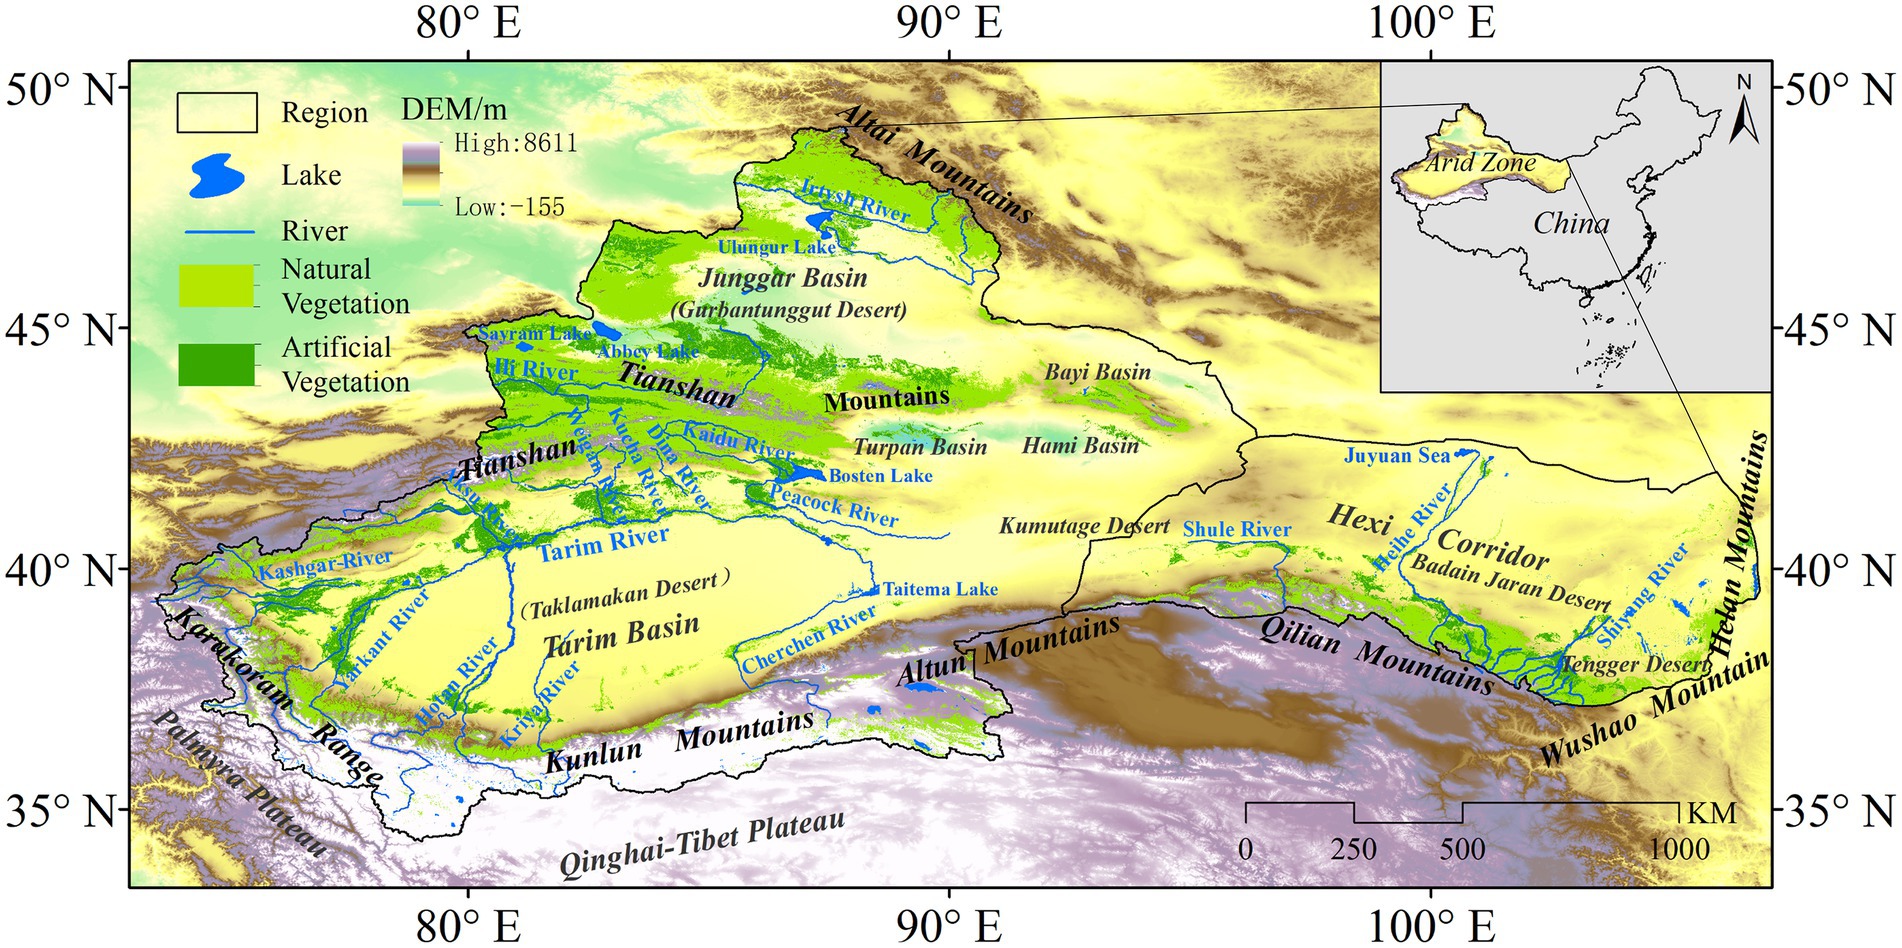
Figure 2. Study area. NO.: GS (2019)1822. ARV covered about 6.5% of the study area and NAV covered about 29.86%.
Due to the perennial influence of continental climate, the NAR has little precipitation and shows a decreasing trend from east to west. Evaporation is strong and surface water is insufficient to sustain normal vegetation growth, so plants have to rely mainly on groundwater. Temperatures vary widely from day to day, season to season, and year to year, making the NAR one of the driest areas in the world. Of the few lakes that do exist, most are located in the Xinjiang Uygur Autonomous Region. Their water is typically brackish and saline, and they have large seasonal variations in area and depth. Human settlement in the NAR is relatively sparse compared to elsewhere in China, with most of the population concentrated in the region’s oasis area. Unfortunately, economic development in this arid zone has not kept pace with the rest of the country, due primarily to the constraints imposed by the harsh environmental conditions and low population.
3. Data and methods
3.1. Data
The data used in this study are shown in Table 1. MODIS (Moderate-Resolution Imaging Spectroradiometer) is a new generation of “atlas-integrated” optical remote sensing instruments. Its data products help us to understand in depth the global dynamics of land, ocean, and lower atmosphere (Justice et al., 2002). GLDAS (Global Land Data Assimilation System) can generate the best land surface states and flux fields for global implementation at high resolution (Rodell et al., 2004). TerraClimate is a monthly climate dataset for the global land surface that combines the WorldClim dataset with CRU Ts4.0 and JRA55 to create a high spatial resolution dataset covering a wider range of time records (Abatzoglou et al., 2018). The AVHRR evapotranspiration product uses satellite remote sensing data combined with atmospheric reanalysis products and daily ground-based meteorological data to produce a global terrestrial evapotranspiration dataset (Zhang et al., 2010). The SRTM (Shuttle Radar Topography Mission) data were jointly measured by NASA and the National Mapping Agency (NIMA) of the Department of Defense. They used the C-band in the SAR method to collect 80% of the global terrestrial topography (Farr et al., 2007). Some of the temperature and precipitation data are downscaled over China using the Delta Spatial Downscaling scheme based on the global 0.5° climate dataset published by CRU and the global high-resolution climate dataset published by WorldClim (Ding and Peng, 2020).
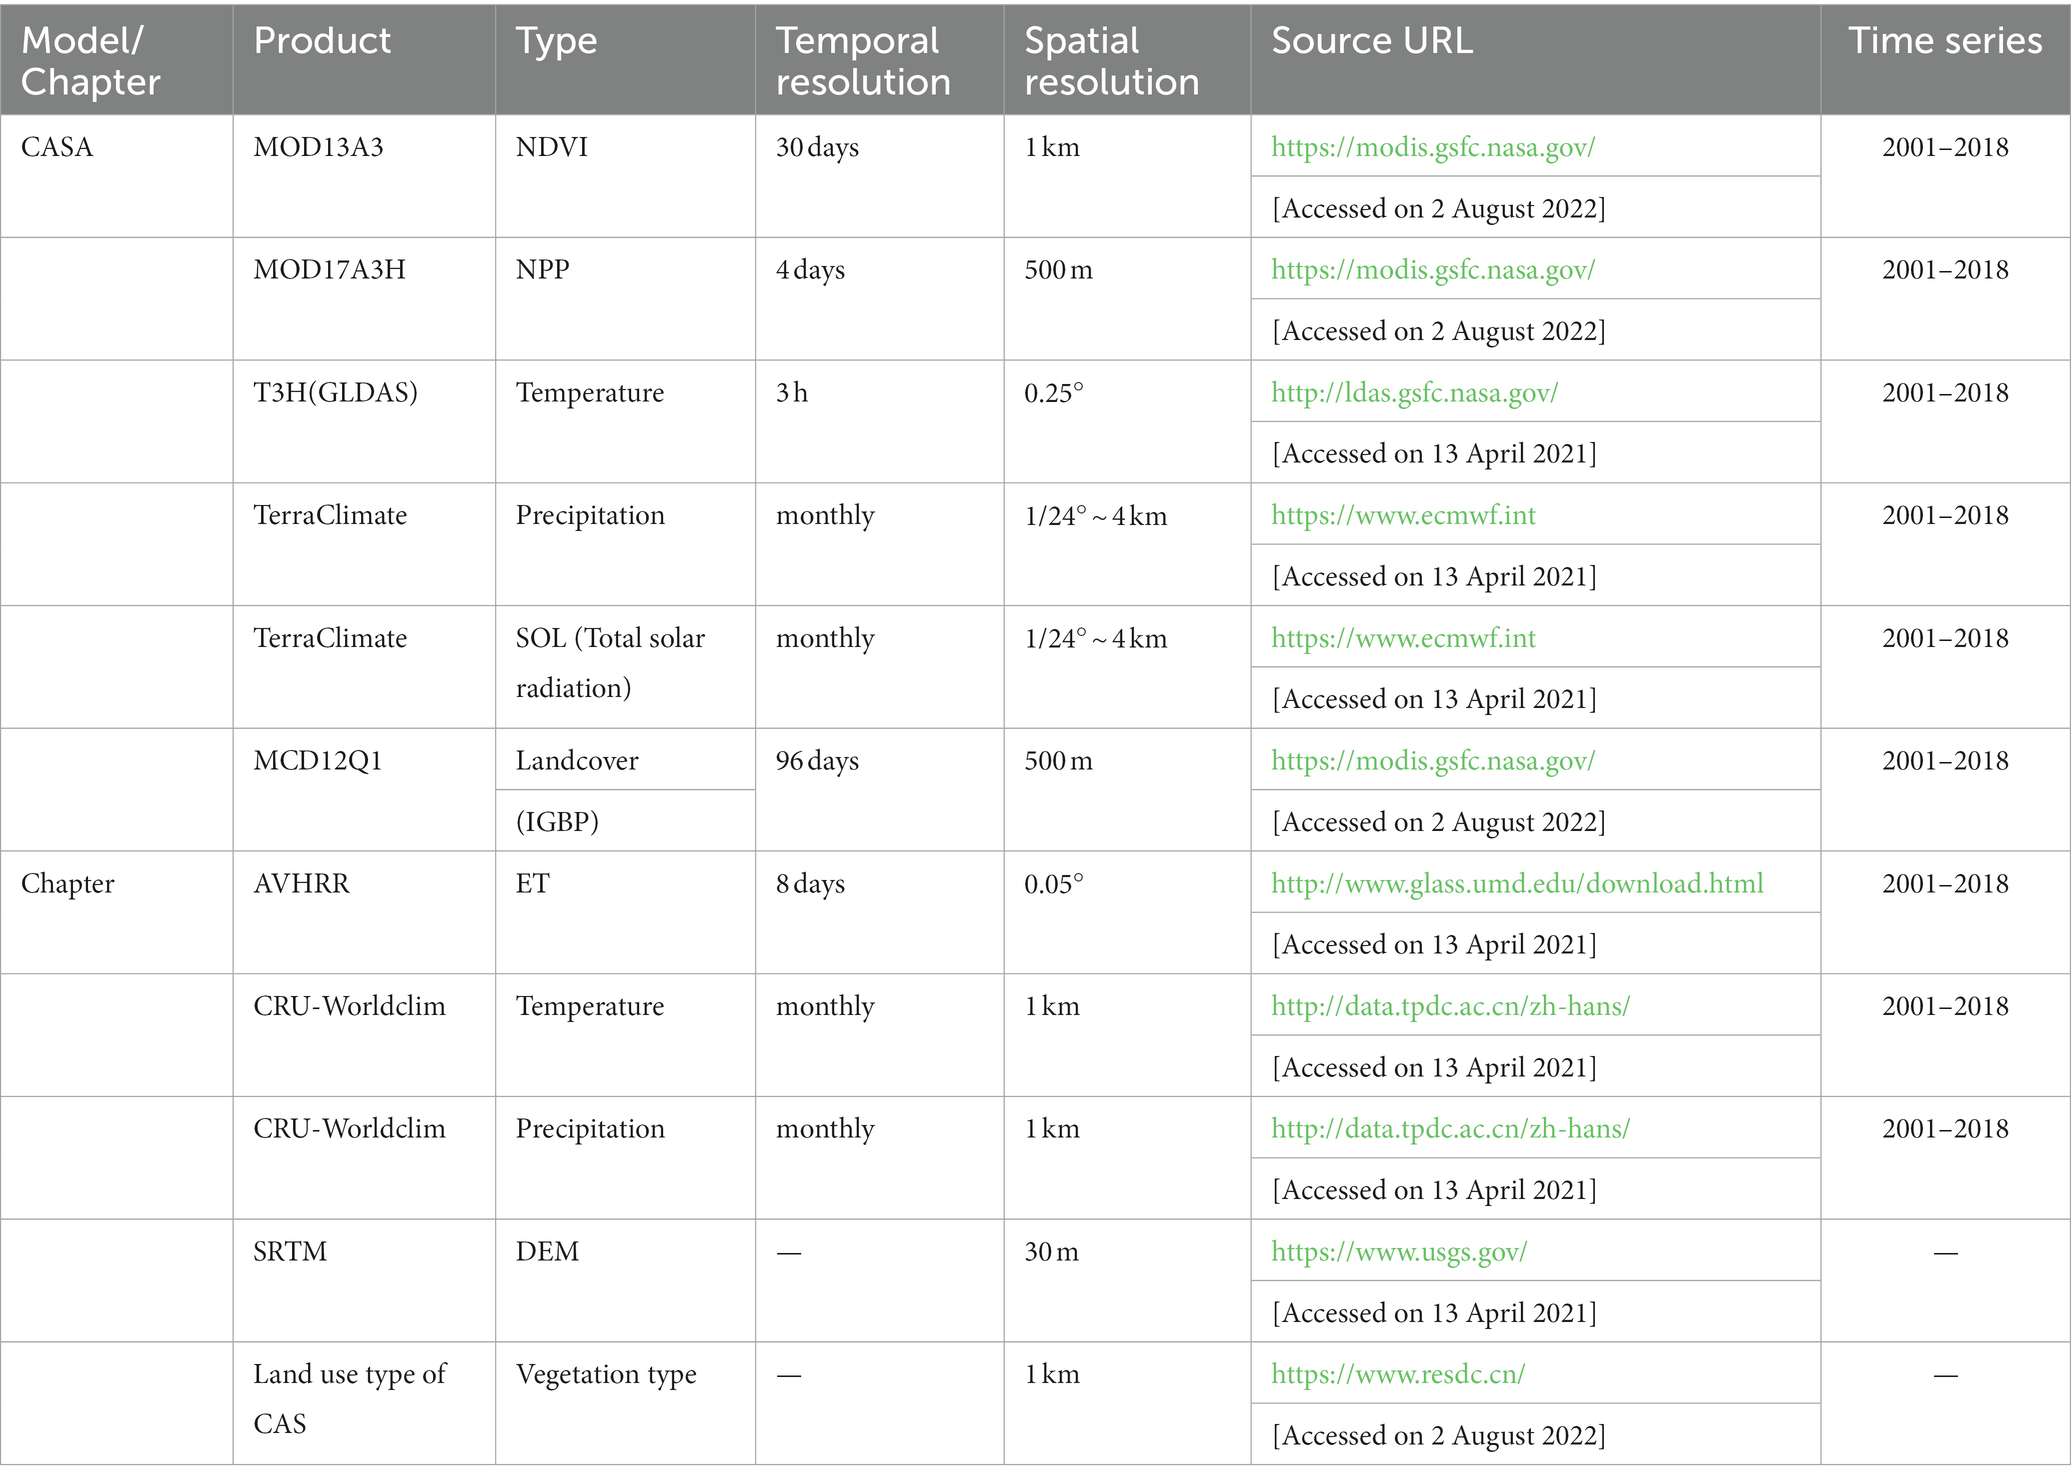
Table 1. Data product type and source.
3.2. Methods
3.2.1. WUE calculation
The water use efficiency of an ecosystem is equal to the ratio of net primary productivity (NPP) of vegetation to evapotranspiration (ET) and is calculated as:
where WUE indicates water use efficiency (g C·mm−1·a−2), NPP denotes the net primary productivity of vegetation (g C·m−2·a−1), and ET is evapotranspiration (mm·a).
3.2.2. NPP calculation
The CASA (Carnegie-Ames-Stanford Approach) model is a typical representative of light energy utilization. In this study, the NPP was simulated using the CASA model optimized by Zhu et al. (2006). Photosynthetically active radiation (APAR) and light energy utilization are the main parameters in this model. Their calculation equations are as follows:
In the formula, APRP indicates the radiation on an image (x) in month t that is beneficial to plant photosynthesis, i.e., photosynthetically active radiation (MJ·m−2), and ε denotes the degree of light energy utilization in an image (x) in month t, i.e., light energy utilization (gC·MJ−1).
To estimate the photosynthetically active radiation absorbed by vegetation, remote sensing data can be used for the analysis. Our analysis of the determinants of light and effective radiation absorbed by vegetation shows that it is determined by the utilization of total solar radiation and photosynthetically-effective radiation. The expressions can be formulated as:
where SOL(x, t) represents the total solar radiation (MJ·m−2) contained in an image element (x) in month t, and FPAR(x, t) indicates the ratio of radiation absorbed by vegetation to incident radiation.
The photosynthesis of plants is influenced by factors such as temperature, precipitation, and atmospheric water-air pressure difference, which further affects the NPP of vegetation. Therefore, in the model, these factors regulate NPP through the maximum light energy use efficiency. The formula to describe this relation can be calculated as follows:
where indicate the stress on ε when the temperature is too high or too low represents the effect of moisture on ; and is the maximum (gC· MJ−1) of vegetation. In this study, the value of () is based on the calculation results of Zhu et al. (2006).
We validated the estimation results using MOD17A3H data. As shown in Figure 3, the simulated NPP values have a good linear correlation with MODIS17A3H values (R2 = 0.81). This indicates that the simulated NPP values of the improved CASA model can truly reflect the variations in NPP in the NAR. Therefore, the improved CASA model is applicable to the study of NPP estimation in the study area.
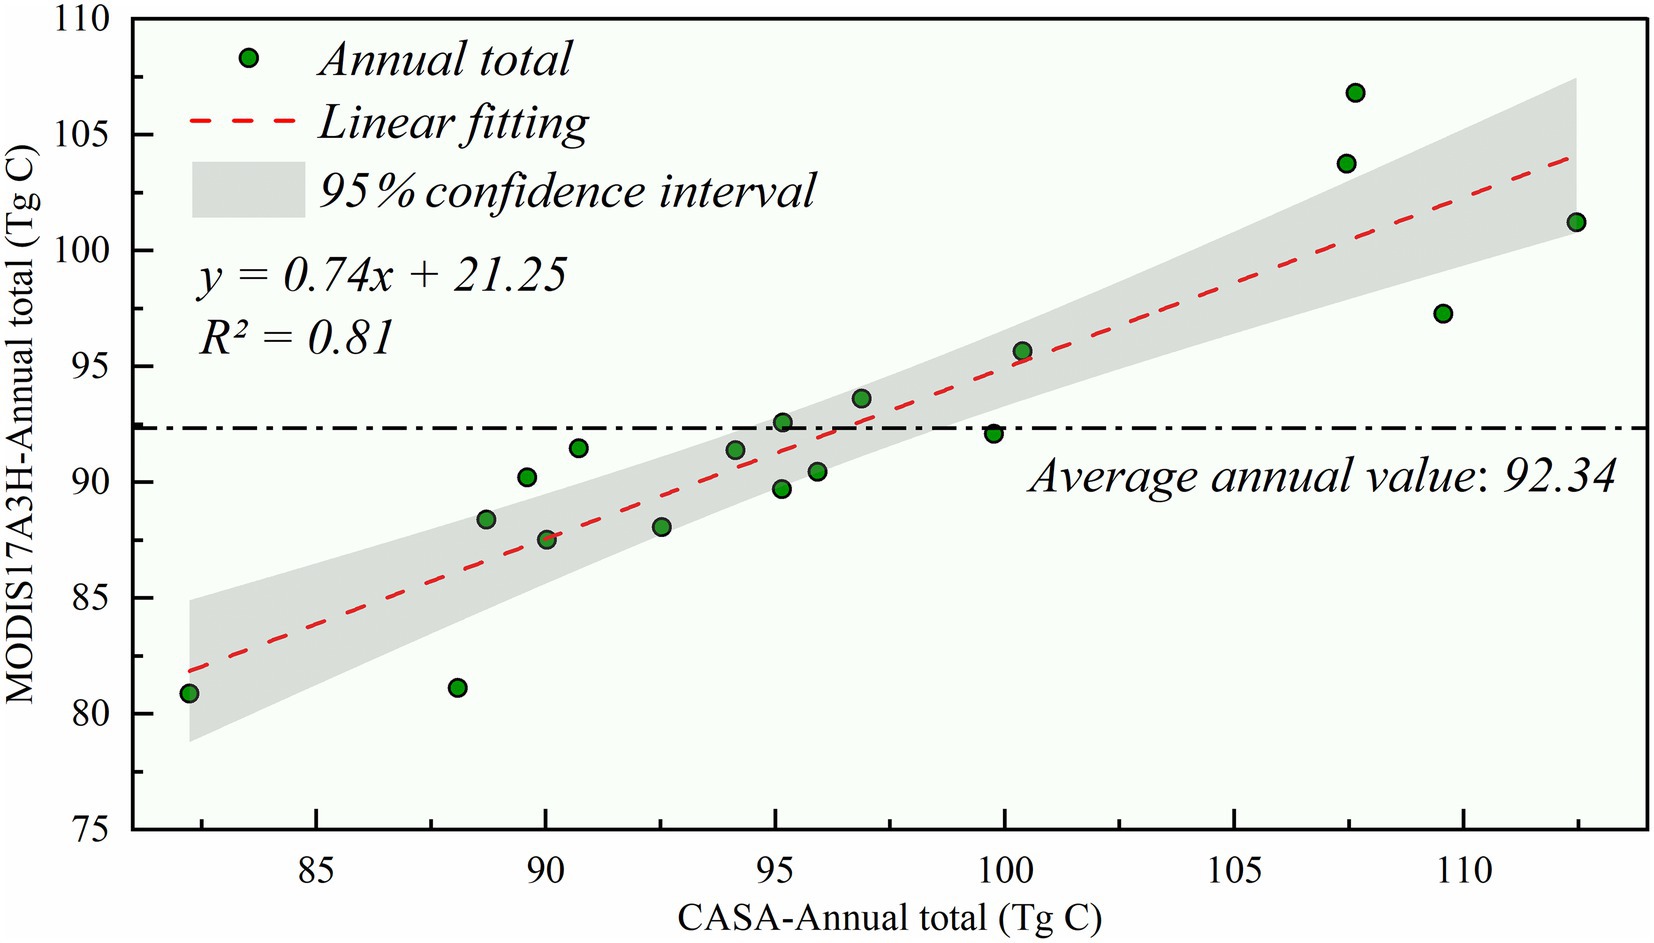
Figure 3. Correlation analysis between simulated annual total NPP and total annual MODIS17A3H in China’s NAR, 2001–2018.
3.2.3. Hurst index
The Hurst index is often used to predict the persistence of time series. In this paper, the index is obtained based on the R/S calculation method. The calculation formula is:
where represents the cumulative deviation; denotes the extreme deviation; stands for the standard deviation; and H indicates the Hurst index, whose value is between 0 and 1. When H = 0.5, the future trend of the series does not have long-term correlation with the past trend; when 0 ≤ H < 0.5, the series has inverse persistence, and the future trend is opposite to the past one; and when 0.5 < H ≤ 1, the series has persistence, and the future trend is consistent with the past one.
3.2.4. Partial correlation analysis
In multivariate systems, partial correlation allows the study of the correlation of one element to another, while eliminating the effect of one or more confounding factors. When the number of control variables is one, the partial correlation coefficient is called the first-order partial correlation coefficient. When the number of control variables is n, the partial correlation coefficient is called the nth-order correlation coefficient. When the number of control variables is zero, the partial correlation coefficient is called the zero-order partial correlation coefficient, which is also known as the correlation coefficient. The formula for calculating the partial correlation coefficient is as follows:
where indicates the first-order partial correlation coefficient between ab with constant c, applicable to the analysis of the relationship between three variables; and indicates the correlation coefficient between ab, applicable to the analysis of the relationship between two variables.
The t-test is generally used to test statistics, using the formula:
where represents the bias correlation coefficient, n indicates the number of samples, and m denotes the number of independent variables. For the present study, p ≤ 0.05 is considered statistically significant.
3.2.5. Sen + Mann-Kendall trend analysis
Theil-Sen median trend analysis (also known as Sen trend analysis or Sen’s slope) is a robust nonparametric statistical approach to trend calculation. Compared to linear regression trend analysis, Sen trend analysis circumvents the effects of missing data and data distribution patterns in the time series and eliminates the interference of outliers in the time series. Its calculation formula is:
where and are the values of year i and j in A time series data; Median is the median taking function; and is the median of the slope of all data pairs, which is the Sen slope of the time series. When β>0, the time series has an increasing trend, whereas when β<0, the time series has a decreasing trend.
The Mann-Kendall (MK) test is typically used in conjunction with Sen trend analysis. It is a nonparametric statistical test that is not affected by missing values and outliers, nor does it require the sample data to follow a certain distribution. Its formula can be expressed as:
where and are A time series data; sign is the sign function; S is the test statistic; Z is the standardized test statistic; and n is the amount of data. NPP trends were classified into five categories according to the significance levels of Sen-MK trend analysis |Z| > 1. 96 (p < 0.05) and |Z| > 2. 58 (p < 0.01; Table 2).
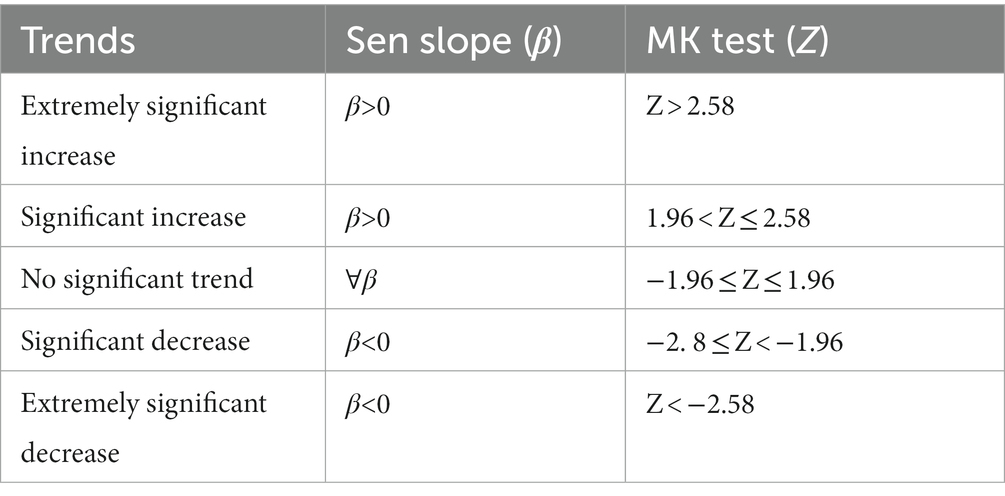
Table 2. Criteria for grading change trends.
3.2.6. WUE and NPP assessment of vegetation degradation and restoration
Vegetation degradation is usually accompanied by the occurrence of reduced biomass, decreased vegetation cover, increased drought-tolerant plants, and increased area of bare soil patches. NPP and WUE are used to characterize these changes. In the early degradation stage, NPP declines and plants can close stomata for physiological regulation or establish a survival advantage by increasing the area of drought-tolerant vegetation, which increases the WUE and slows the rate of NPP decline (Chen et al., 2004). In the later degradation stage, with the aggravation of further drought and anthropogenic disturbance stress, vegetation NPP decreases substantially, bare soil patches begin to appear and expand, WUE decreases, and finally a desert landscape appears (Horion et al., 2016). Based on this, we used NPP and WUE to assess land degradation and restoration, assuming that the path of vegetation restoration is the opposite of degradation (Gang et al., 2016).
3.2.7. Division of natural vegetation and artificial vegetation
Based on the spatial distribution data of 1 million vegetation types in China, downloaded from the Resource and Environmental Science and Data Center of the Chinese Academy of Sciences,1 this study defines cultivated vegetation (including farmland, economic forests, and orchards) as artificial vegetation (Arv), while vegetation other than cultivated vegetation is defined as natural vegetation (Nav).
4. Results
4.1. NPP changes in Nav and Arv
From 2001 to 2018, the annual average NPP of vegetation in the NAR largely showed a spatial pattern of high in the north, low in the south, high in the west, and low in the east. The Ili Valley, Tianshan Mountains, Altay Mountains, and Qilian Mountains were the high value areas of Nav NPP, with values ranging from 343.09 to 711.29 g C·m−2·a−1. The Arv high value areas were relatively small in distribution and were located mainly in the Ili Valley and Qilian Mountains, with Arv NPP values ranging from 300 to 542.02 g C·m−2·a−1. The southern part of the NAR was the low value area of Nav NPP, with NPP values mainly in the range of 40 g C·m−2·a−1. Arv NPP low value areas were primarily in the desert-oasis transition zone in southern Xinjiang, with NPP values mostly below 42.51 g C·m−2·a−1 (Figure 4A).
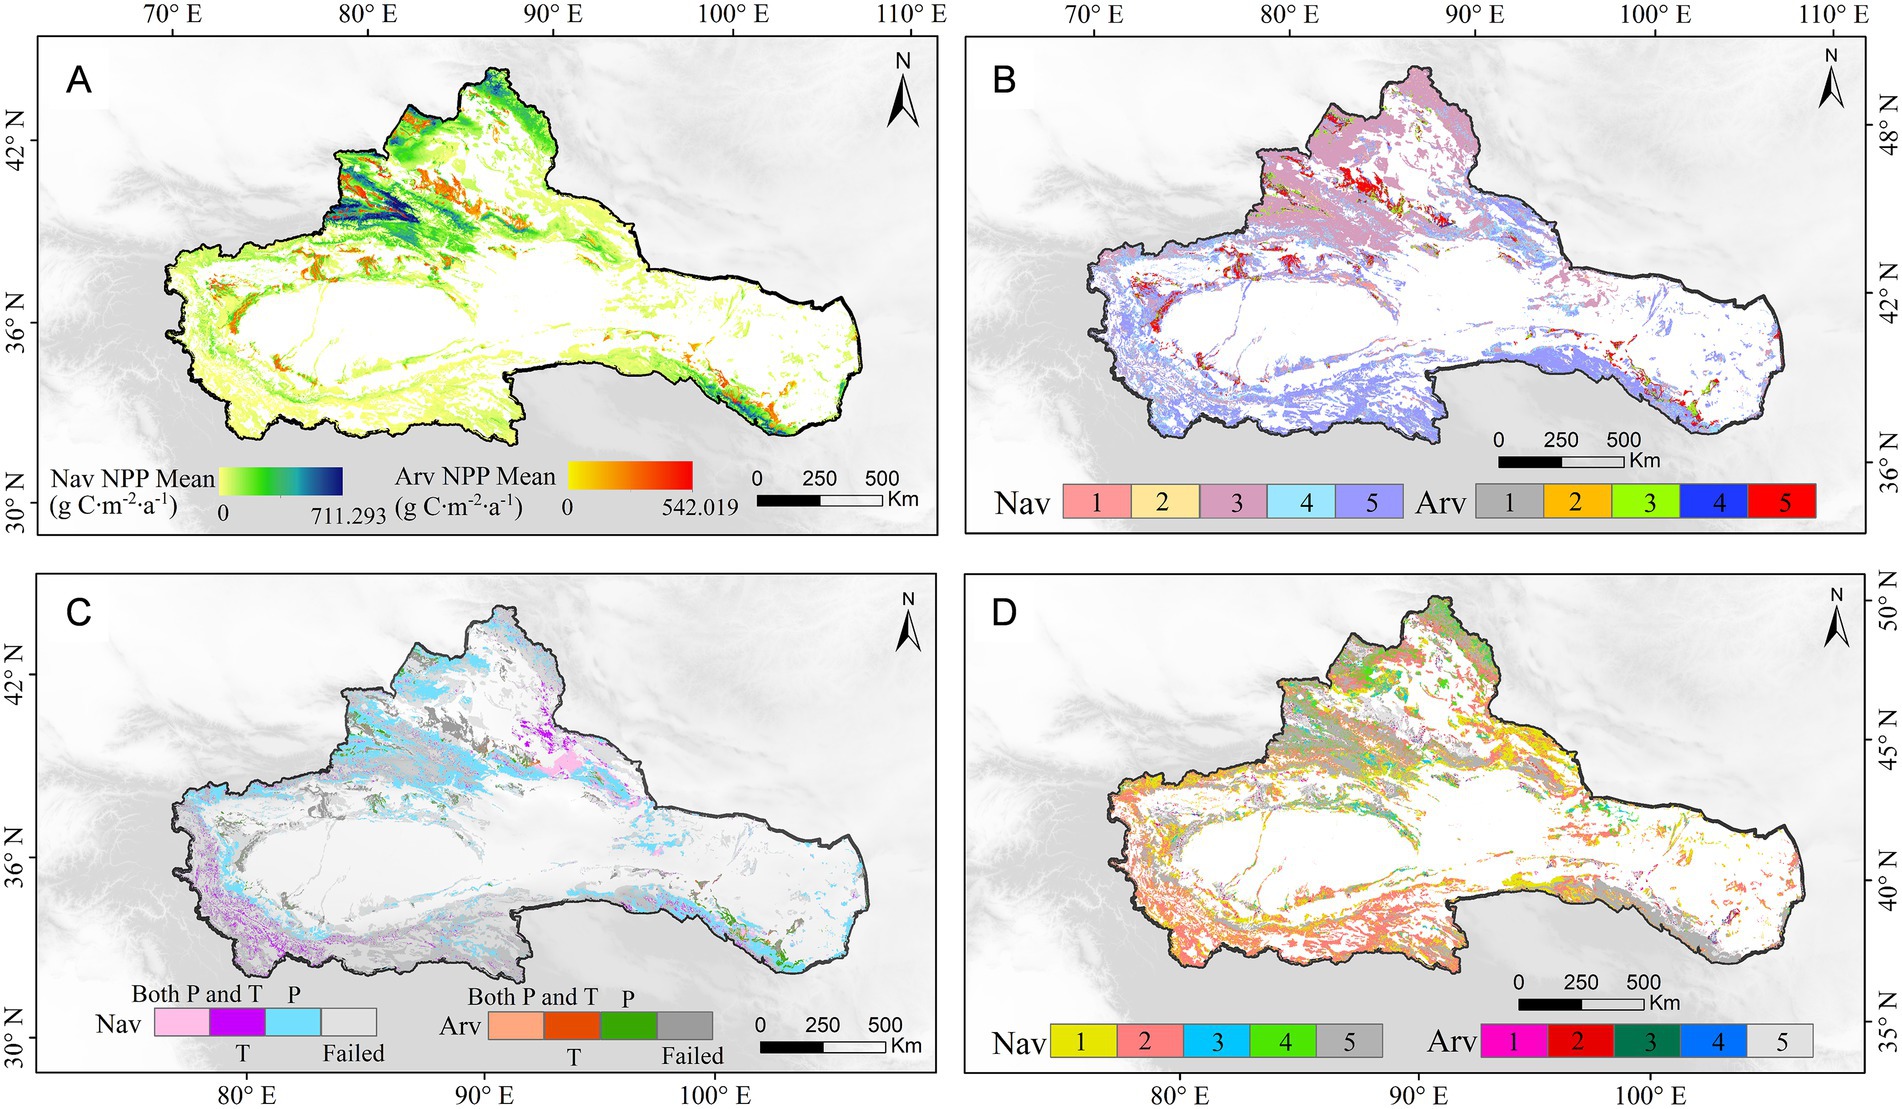
Figure 4. Net primary productivity (NPP) of vegetation in the NAR from 2001 to 2018: (A) period-mean NPP; (B) long-term trend of NPP (1. Extremely significant decrease, 2. Significant decrease, 3. No significant change, 4. Significant rise, 5. Extremely significant rise); (C) primary factors regulating interannual variations of NPP; (D) future variation trend of NPP (1. Sustained improvement, 2. Improvement to degradation, 3. Degradation to improvement, 4. Sustained degradation, 5. Insignificant).
The areas of significant increase in NPP were widely distributed, with Arv clustered around oases and Nav occurring in mountainous areas (Figure 4B). In contrast, the mountain-oasis interface and the oasis-desert transition zone were the main areas of decrease in Nav and Arv, respectively. Climate change can explain 36.38 and 25.70% of the variations in NPP of natural and natural vegetation in the NAR, respectively. Meanwhile, precipitation was the dominant climate factor affecting variations in vegetation NPP, whereas temperature played a major role only in 4.04% (Nav) and 5.89% (Nav) of the area, respectively (Figure 4C).
To better understand the future trends of vegetation NPP in the NAR, this study conducted an overlay analysis of the vegetation NPP Hurst index and interannual variation trends, which were divided into five classes (Figure 4D). Except for areas with insignificant changes, continuous improvement and improvement to degradation were distributed throughout the study area and had the largest area share. The areas of continuous degradation and degradation to improvement as well as their distributions were roughly equivalent, but the distribution of degradation to improvement was more concentrated in the northern border. In general, the development trend of the Nav improvement area in the NAR is consistent with that of Arv, mainly improvement to degradation. However, the degraded area in the future period is expected to be mainly degradation to improvement in Nav and continuous degradation in Arv (Tables 3 and 4).
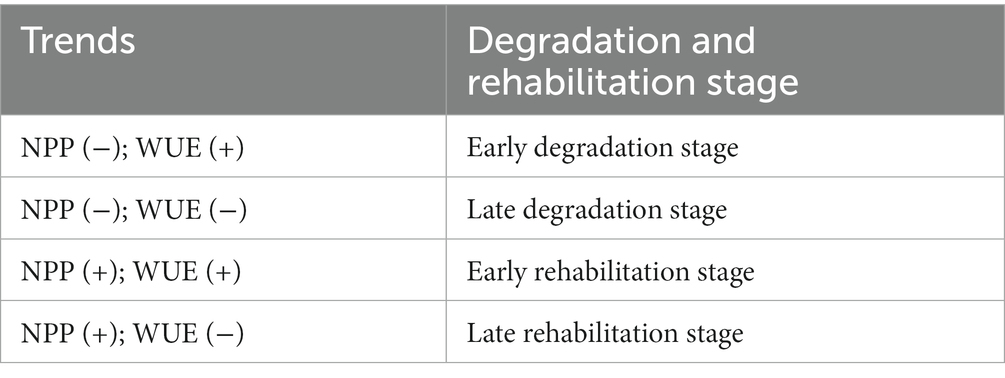
Table 3. Assumptions of NPP and WUE trends in various stages of vegetation degradation and restoration.
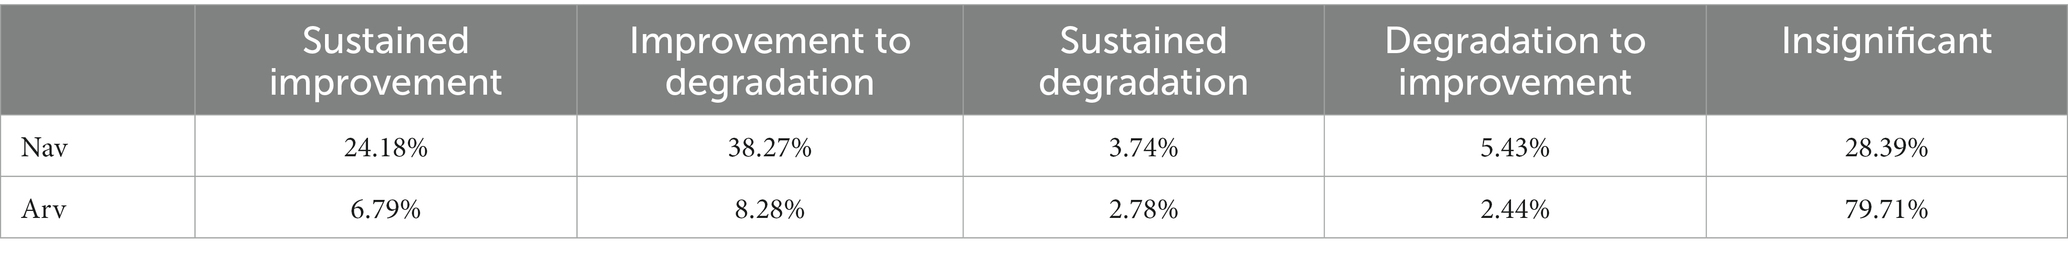
Table 4. Table of future trends of vegetation in the NAR, 2001–2018.
4.2. WUE changes in Nav and Arv
During the study period, vegetation WUE and NPP exhibited similar spatial distributions. The mountainous regions of northern Xinjiang were the high value areas of Nav WUE, with multi-year mean WUE values generally above 1.29 g C·mm−1·a−2. The low value areas were mainly distributed around the Kunlun Mountains, with multi-year mean WUE values mostly below 0.40 g C·mm-1·a−2. The oasis center was the high value area of Arv WUE, while the low value area was mainly located at the desert edge, showing a multi-year mean WUE value below 0.35 g C·mm−1·a−2 (Figure 5A). The long-term trend of Nav WUE change compared to Nav NPP shows some similarities. Areas of insignificant change in Nav NPP were the predominant type and the largest area (59.23%), while areas of increase and decrease in Nav WUE were 39 and 1.77%, respectively. Arv WUE and Arv NPP changed in the same direction with the largest area of growth covering 47.96%, followed by areas of insignificant change and decrease covering 47.90 and 4.14%, respectively. Overall, WUE changes were similar to NPP changes in northern and southern NAR, but there were some regions with different spatial trends. Nav WUE in northeastern NAR and northern Tarim Basin showed a more pronounced upward and downward trend than NPP, while WUE changes in the Qilian Mountains were not as pronounced as NPP changes in the eastern NAR region (Nav NPP). The trends in WUE and NPP suggest that the two indices respond differently to the environmental factors that cause them to change (Figure 5B).
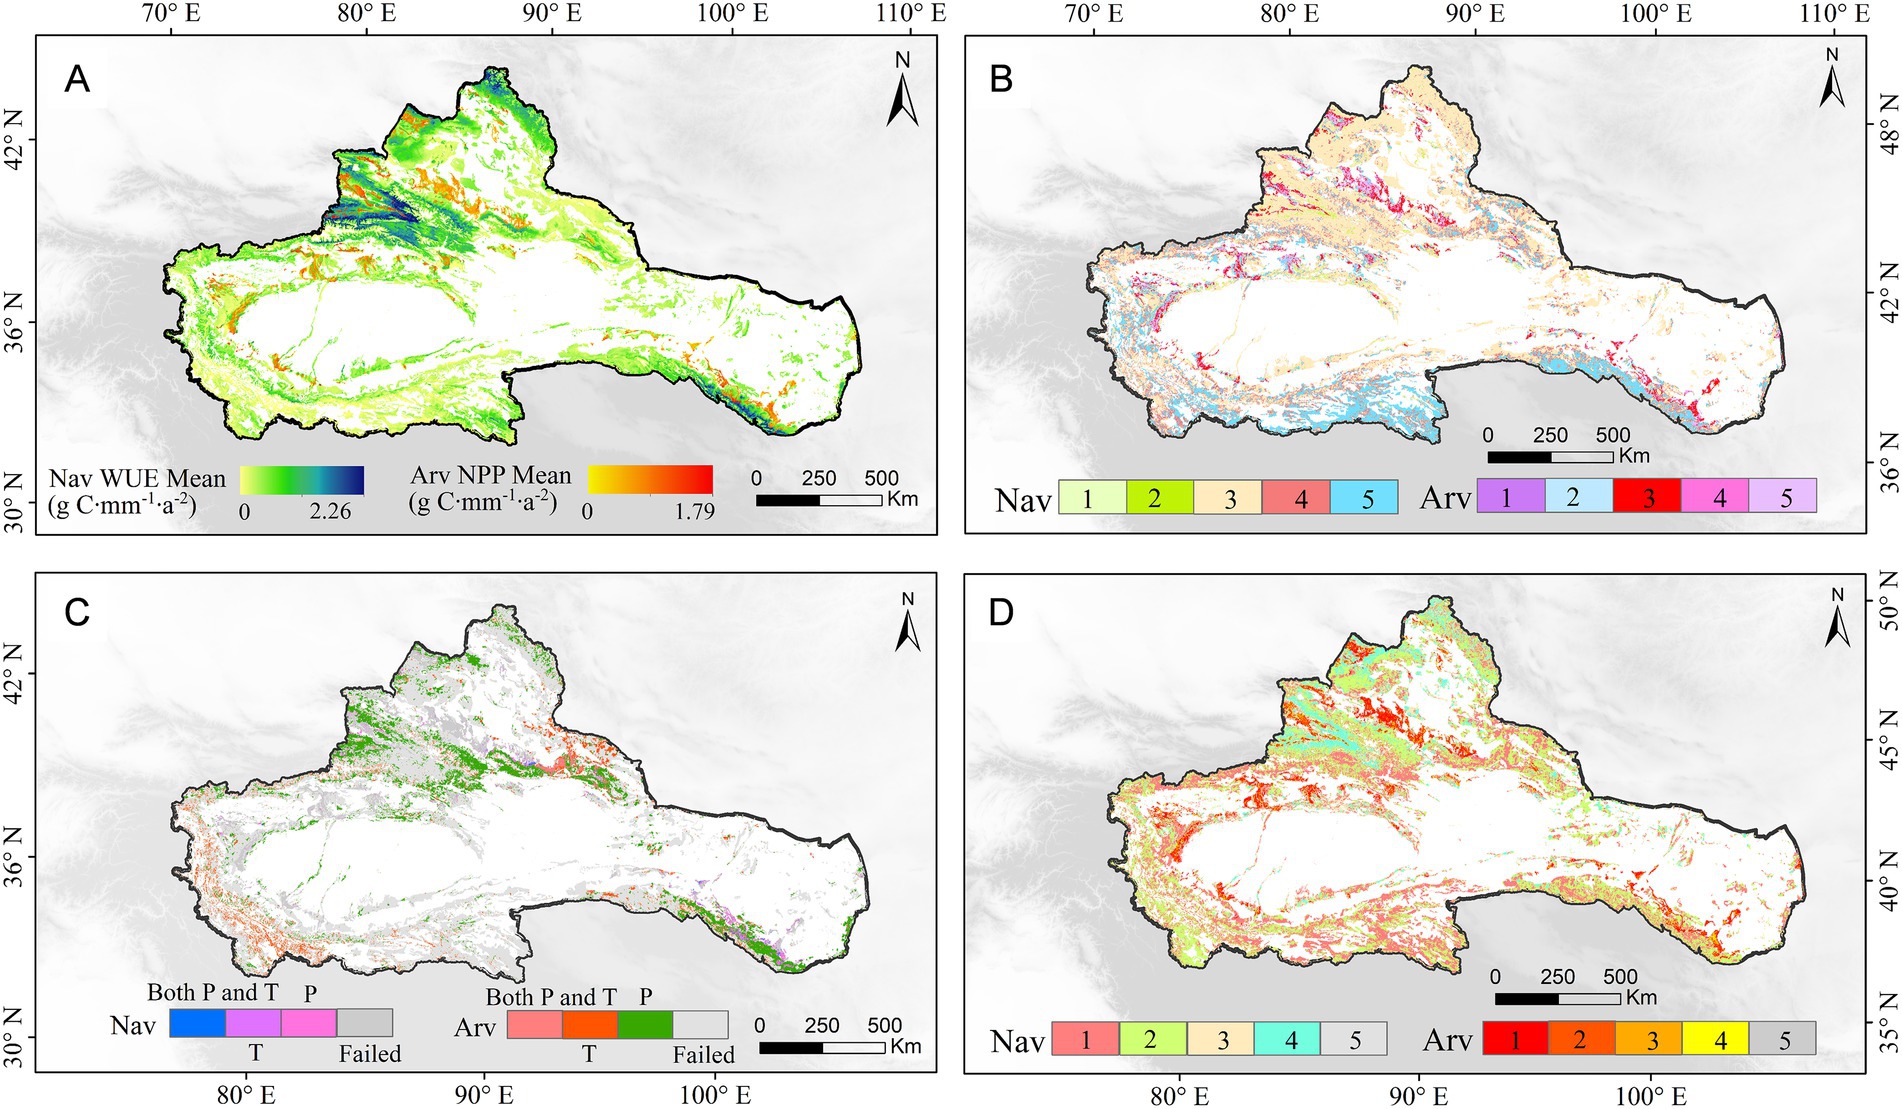
Figure 5. Water use efficiency of natural vegetation in China’s arid northwest region from 2001 to 2018: (A) period-mean WUE; (B) long-term trend of WUE (1. Extremely significant decrease, 2. Significant decrease, 3. No significant change, 4. Significant rise, 5. Extremely significant rise); (C) primary factors regulating interannual variations of WUE; (D) future variation trend of WUE (1. Sustained improvement, 2. Improvement to degradation, 3. Degradation to improvement, 4. Sustained degradation, 5. Insignificant).
Whether in reference to Nav WUE or Arv WUE, climate change explains less of the change in WUE dynamics than does NPP. Precipitation was the dominant climatic factor affecting the change in vegetation WUE in the NAR (Nav: 17.37%, Arv: 13.91%). Furthermore, the dominant role of precipitation is obvious in the Qilian Mountains. Meanwhile, temperature had less influence on vegetation WUE in the NAR (Nav. 5.89%, Arv: 2.09%), but dominated the change in WUE in southern Xinjiang (Figure 5C). Future trends in WUE are more pronounced than for NPP, but future trends in Nav WUE are consistent with those for Nav NPP. Arv WUE shows the opposite trend, with areas of improved Arv WUE dominated by sustained improvement (41.83%) and degraded areas dominated by sustained degradation (10.66%; Figure 5D).
4.3. Spatial dynamics of NPP and WUE in Nav and Arv
From the spatial dynamics of NPP-WUE, the Nav degradation phase of the NAR was dominated by late degradation, while the restoration phase was dominated by early restoration. It is worth noting that the area of early restoration was much larger than that of late degradation (Figure 6). Grasslands, shrubs, and forests showed the same trend, with late degradation and early restoration as their main contributors. Meanwhile, the percentage of early degradation and late restoration was small. Unlike other vegetation types, the restoration phase was evident in wetlands, especially the late restoration phase. Compared to Nav, Arv showed a similar trend of predominant restoration, but with a larger area of late degradation (Figure 7).
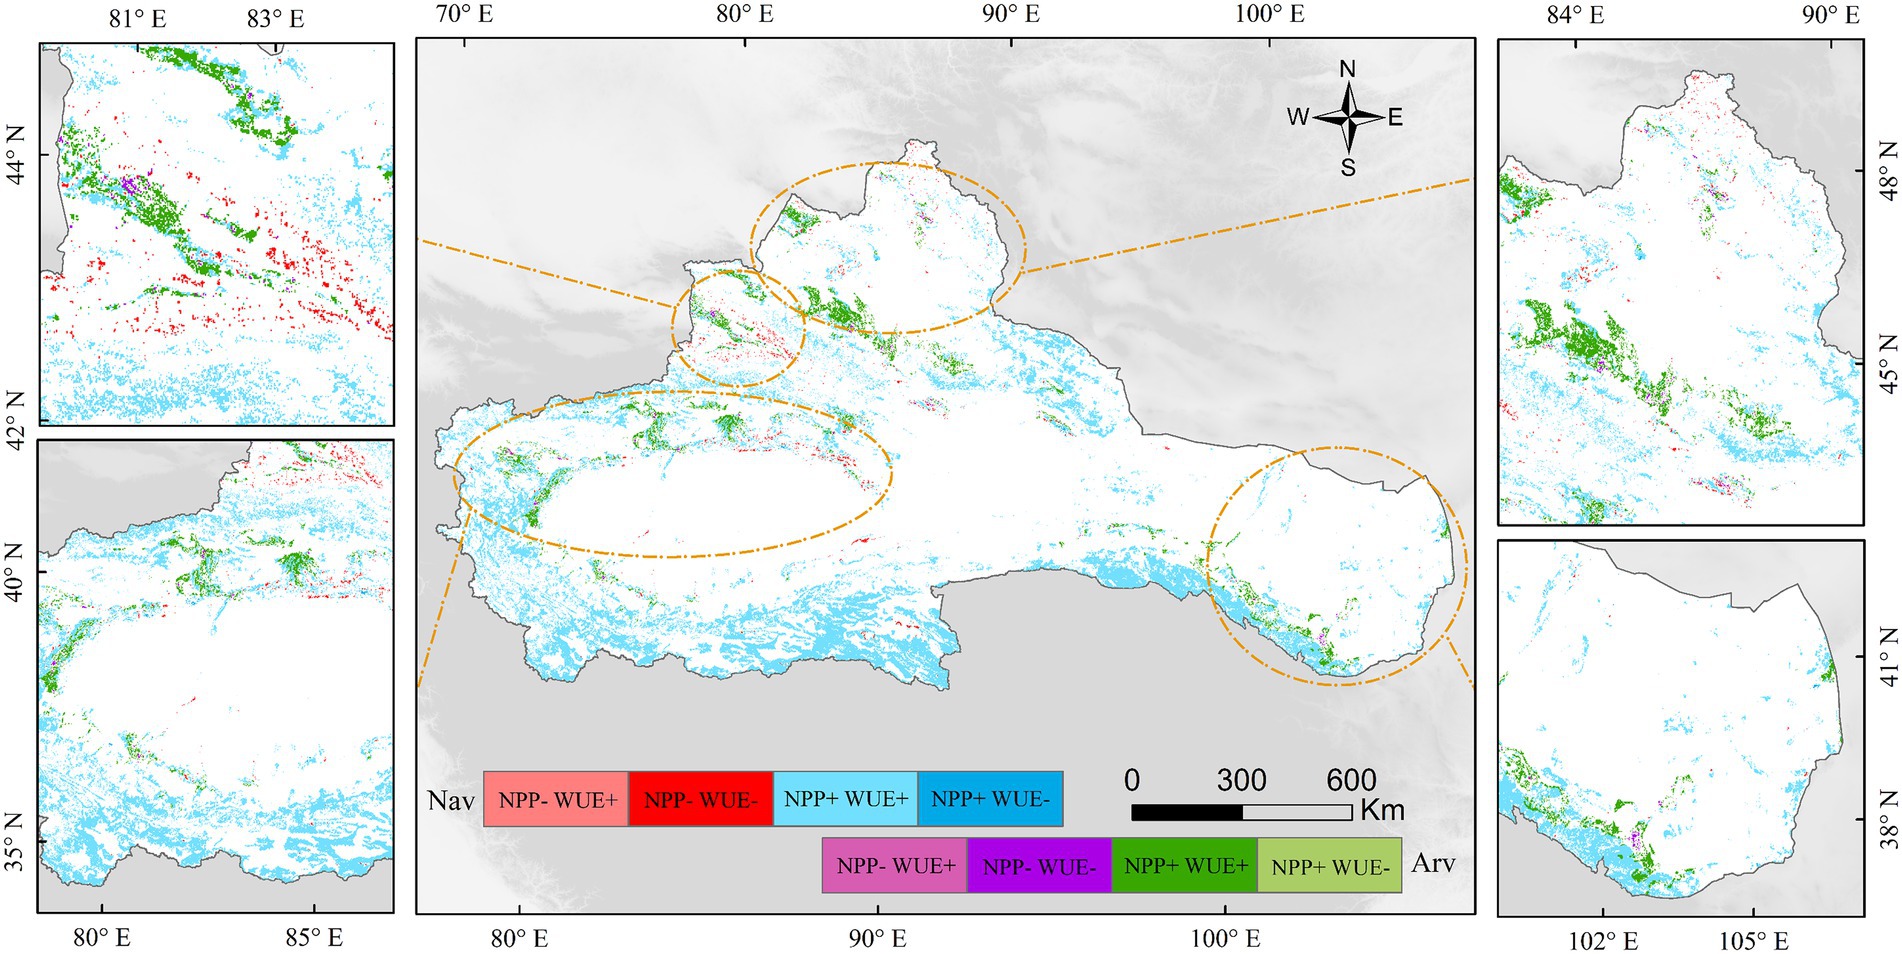
Figure 6. Spatial pattern of land degradation and restoration in the NAR.
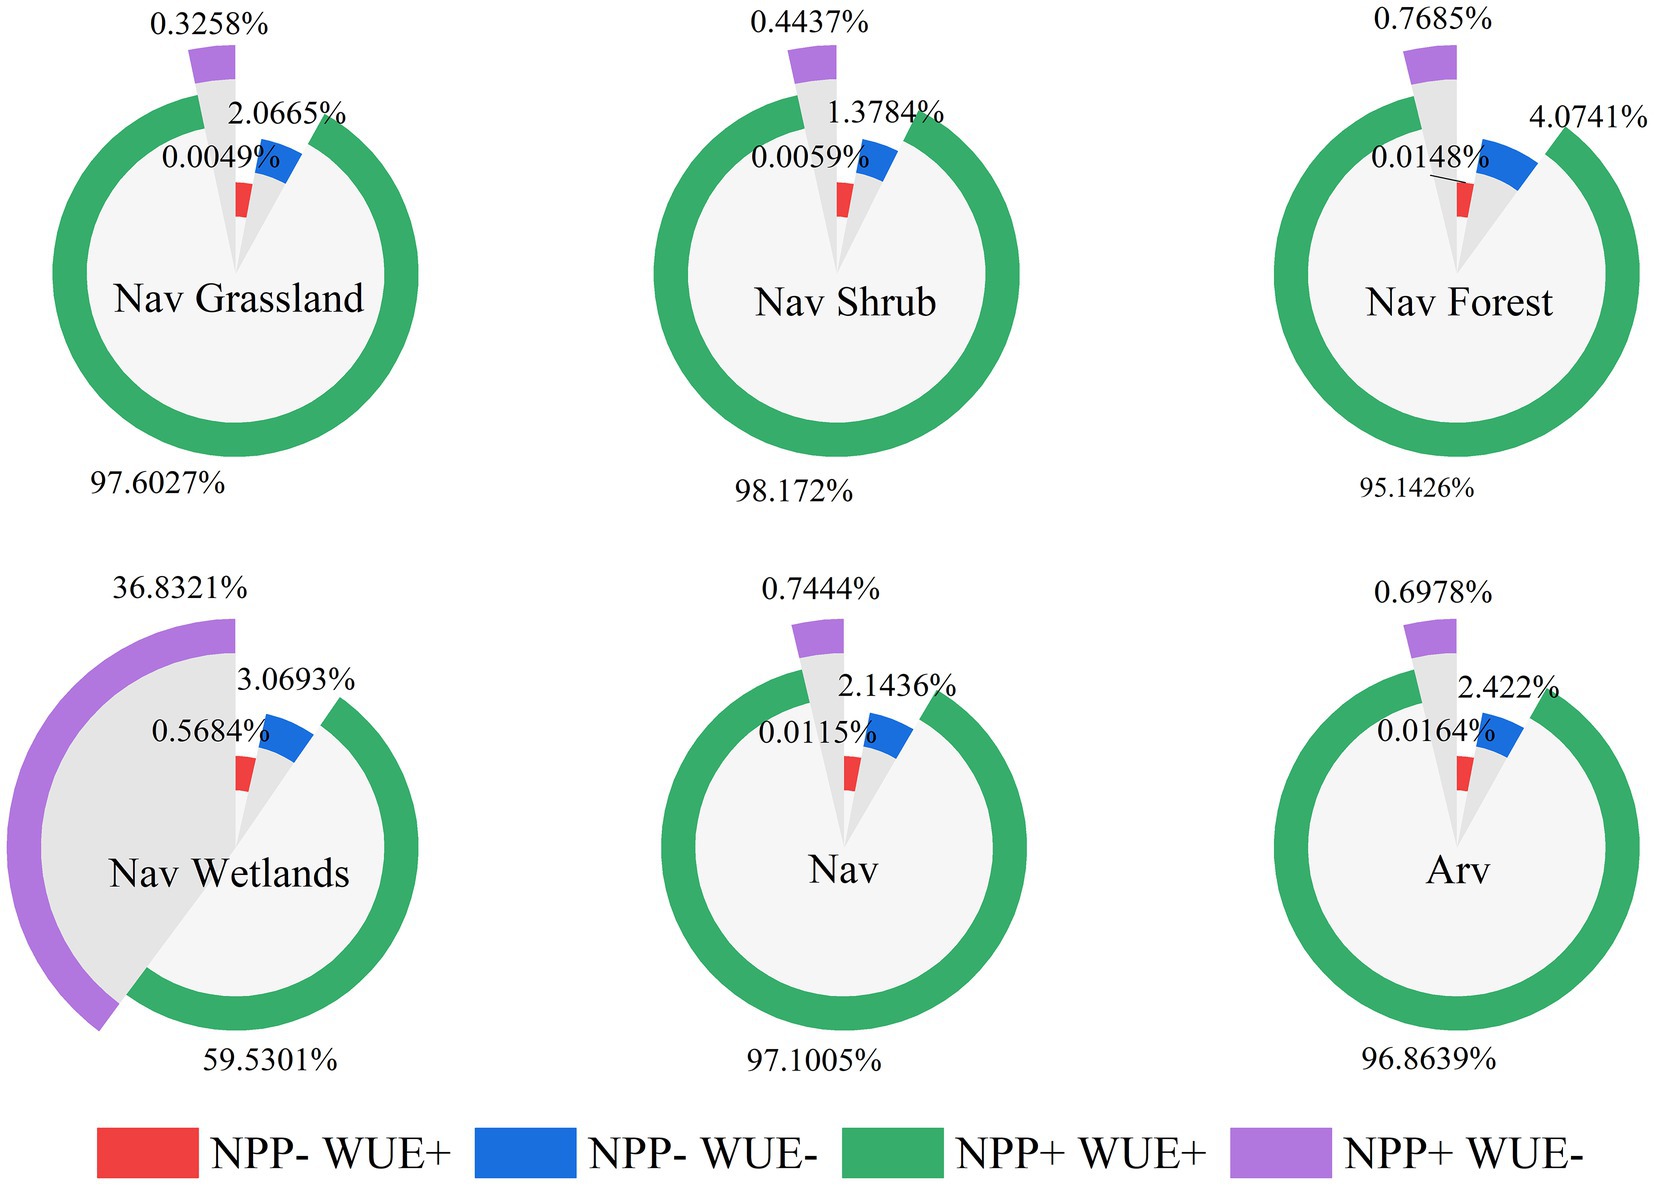
Figure 7. Percentage contribution of each vegetation type at different stages of degradation and restoration.
In terms of spatial distribution, the Nav restoration area was widely distributed, mainly in the central, southern, and northeastern parts of the NAR, but there was relatively concentrated distribution in the mountainous areas. Degraded areas, on the other hand, were sporadically distributed and occurred mostly in the mountain-oasis interface. The degradation phenomenon was most prominent in the Ili Valley. Meanwhile, the oasis located in the northern and southern portions of the Tianshan Mountains was the main restoration area of Arv, with degraded areas distributed in the oasis-desert transition zone in a dotted pattern. Interestingly, the oasis areas with high anthropogenic disturbance were not only the main areas of vegetation restoration, but also hot spots for serious vegetation degradation. The degradation may be related to human negligence in management and/or the cultivation area exceeding the local resource carrying capacity.
5. Discussion
5.1. Mechanism of WUE and NPP changes
The factors affecting plant WUE are somewhat complex, with the primary influences comprising the photosynthesis of leaves, transpiration, and plant stomatal conductance. These factors are also related to the direct effects of species, life type, and intrinsic plant mechanisms, as well as the indirect effects of factors such as the external plant environment (climate, soil, etc.).
Plant transpiration (Plt) and photosynthesis (Pho) form the basis for changes in WUE. Stomata (Sto) usually act as a special channel that controls the exchange of water between air and plant body. Sto also regulate the rate of plant water consumption and carbon assimilation, which in turn has an effect on plant photosynthesis and transpiration, causing additional changes in WUE. When drought occurs, stomatal closure preferentially decreases photosynthesis, which reduces transpiration and contributes to higher plant WUE. Leaf water potential, root system, leaf nutrients (nitrogen content, etc.), specific leaf area, plant genes, and chromosome ploidy influence vegetation WUE as well (Cernusak et al., 2011; Fang et al., 2017).
WUE also varies among habitats and species. The current results of plant WUE response to climatic environment exhibit unevenness (Li et al., 2017; Du et al., 2021). As the research progresses and more plant species are studied, the main climatic factors derived vary; in some cases, the results of the same climatic environment even show opposite conclusions. Therefore, when considering the influence of climatic environment on plant WUE, the compound effect of multiple environments should be considered (Farquhar et al., 1982; Wang et al., 2010, 2019).
Factors affecting vegetation biomass and productivity can simply be divided into two categories: biotic and abiotic factors. Biotic factors include species composition and species density, while abiotic factors are those such as light, temperature, water, CO2, and soil (Kamali et al., 2020; Koju et al., 2020). For different ecosystems, biomass and productivity will vary due to differences in their plant species, species density, etc. Site conditions include elevation, slope, slope orientation, slope position, soil thickness and soil type, which usually act synergistically with meteorological factors to influence the growth and development of vegetation and thus biomass and productivity. Anthropogenic factors are also a non-negligible aspect and have two sides to vegetation growth (Cao et al., 2020; Yang et al., 2021). Overall, while these studies have improved our understanding of vegetation NPP changes, they also reveal that these changes are the result of a combination of multiple factors (Figure 8).
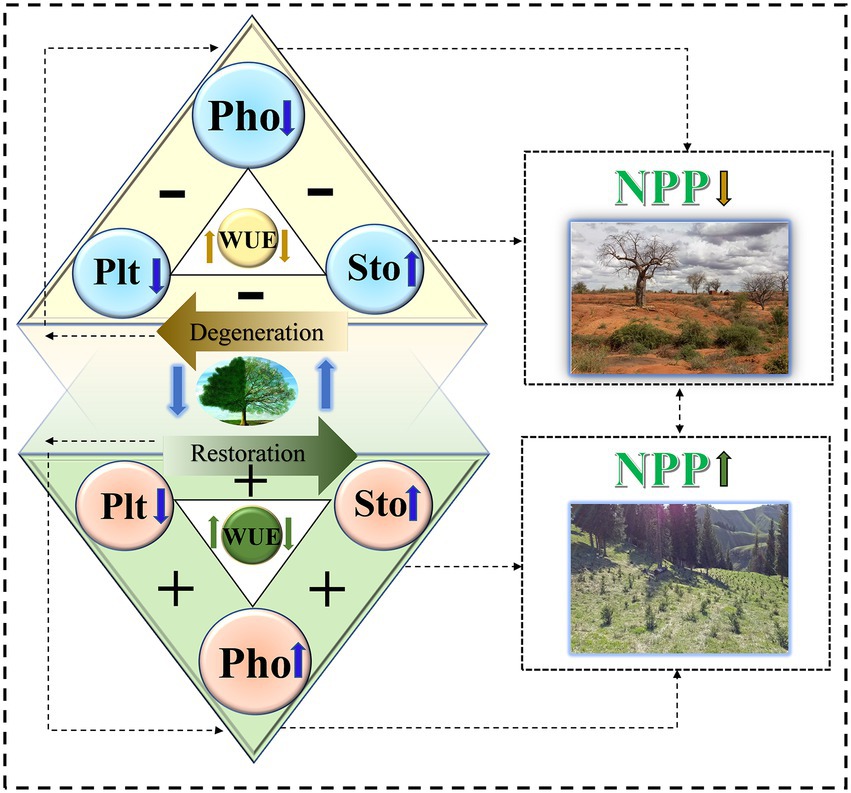
Figure 8. Mechanism of WUE and NPP changes.
5.2. Degradation and restoration patterns in the NAR
The NAR is an ecologically fragile yet important construction area for soil and water conservation in China. Given its noted vulnerability, the NAR has historically received extensive research attention. From 2001 to 2018, the region was dominated by the restoration of mountains (natural vegetation) and oases (artificial vegetation), which is consistent with the results from other studies that focused on the Tianshan Mountains (Zheng et al., 2011), Altai Mountains, and oasis areas (He et al., 2021). Additionally, the vegetation restoration observed in the Qilian Mountains (Zuo et al., 2022) is in good agreement. This is also consistent with the increasing trend of WUE in the NAR (Yang et al., 2022). In contrast, vegetation degradation was found in the transition zone around the oasis (Wei et al., 2018).
Precipitation plays a key role in regulating changes in natural NPP and WUE. Accordingly, the different responses of vegetation to NPP and WUE are related to the pattern of gradually decreasing precipitation in the mountain range-oasis-desert system. Air temperature appears to be a major factor only in the western Qilian and Kunlun Mountains and the eastern part of the northern border. The increase in air temperature and precipitation well explains the restoration of vegetation in the eastern portion of Northern Xinjiang (Shen et al., 2013). Moreover, the warming trend in the super-arid region and the high intensity of anthropogenic disturbance explain the degradation trend at the edge of the oasis (Meng et al., 2020).
The restoration of artificial vegetation can be attributed to active vegetation restoration activities and advances in sustainable agricultural techniques, with arable land expansion being the main manifestation. Although there is an increasing trend in oasis cover, anthropogenic-induced water redistribution has also caused local degradation of oases in the northern region. Despite bringing positive ecological benefits for a short period, artificial vegetation saturates and fuels the expansion of artificial oases, causing the degradation of natural oases (Zhang et al., 2020). Therefore, to improve oasis stability, relevant management authorities should further control oasis size and agricultural area.
Based on the evaluation framework of NPP and WUE, this study analyzed the restoration and degradation trends of natural vegetation and artificial vegetation in the arid area of northwest China, and deepened the understanding of its change mechanism. However, there is no entry analysis of their influencing factors. In future studies, breakthroughs should be made in identifying the anthropogenic and natural factors affecting vegetation recovery and degradation and their respective weights, and in-depth studies and researches should be conducted on the attribution factors affecting vegetation recovery and degradation.
6. Conclusion
This study evaluated the degradation and restoration trends of Nav and Arv in the arid zone of northwest China, using NPP and WUE as indicators. The research also analyzed the differences between the two. Overall, the NPP and WUE trends revealed the following:
1. Nav NPP and Arv NPP in the NAR were both dominated by significant increases, with precipitation being the main climatic factor causing their changes. Due to human activities, Arv NPP changed more than Nav NPP, and mountainous and oasis areas saw significant increases in Nav NPP and Arv NPP, respectively. Meanwhile, the relative expansion of oasis to mountains and deserts caused a decrease in Nav and Arv.
2. WUE and NPP exhibited similar spatial distributions, but climate change explained less of the dynamic changes in WUE than did NPP. Precipitation and temperature dominated the WUE changes in the Qilian Mountains and Southern Xinjiang, respectively. In the near future, Nav WUE is expected to dominate by improvement to degradation, while Arv WUE will continue to improve under human intervention.
3. Nav in the NAR is dominated by early restoration and late degradation, making the recovered area larger than the degraded area. Arv shows a similar trend, but the area of late degradation is larger than that of Nav. Early recovery and late degradation are the main trends in grassland, shrub, and forest change, while the recovery phase is more pronounced in wetlands.
Data availability statement
The original contributions presented in the study are included in the article/Supplementary material, further inquiries can be directed to the corresponding author/s.
Author contributions
All authors made significant contributions to this study. HH and ZL provided the conceptualization. JZ and HZ framed the methodology. JZ and HH wrote and prepared the original draft. JZ and WD did the review and editing. YX and QZ oversaw the project administration. ZL was responsible for funding acquisition. All authors contributed to the article and approved the submitted version.
Funding
This research was supported by National Key Research and Development Program (2019YFA0606902) and Natural Science Foundation of Xinjiang Uygur Autonomous Region (2021D01E02).
Conflict of interest
The authors declare that they have no known competing financial interests or personal relationships that could have appeared to influence the work reported in this paper.
Publisher’s note
All claims expressed in this article are solely those of the authors and do not necessarily represent those of their affiliated organizations, or those of the publisher, the editors and the reviewers. Any product that may be evaluated in this article, or claim that may be made by its manufacturer, is not guaranteed or endorsed by the publisher.
Supplementary material
The Supplementary material for this article can be found online at: https://www.frontiersin.org/articles/10.3389/fevo.2023.1131210/full#supplementary-material
Abbreviations
CASA, Carnegie-Ames-Stanford Approach; NAR, The Northwest Arid Region; Arv, Artificial vegetation; Nav, Natural vegetation; MODIS, Moderate-resolution Imaging Spectroradiometer; NPP, Net primary production; P, Precipitation; T, Temperature; WUE, Water use efficiency; Plt, Plant transpiration; Pho, Photosynthesis; Sto, Stomata.
Footnotes
References
Abatzoglou, J. T., Dobrowski, S. Z., Parks, S. A., and Hegewisch, K. C. (2018). Terraclimate, a high-resolution global dataset of monthly climate and climatic water balance from 1958-2015. Sci. Data 5:170191. doi: 10.1038/sdata.2017.191
Ádám, K., and Křeček, J. (2019). Landscape degradation in the world and in Hungary. Hungarian Geogr. Bull. 68, 201–221. doi: 10.15201/hungeobull.68.3.1
Barbier, E. B., and Hochard, J. P. (2018). Land degradation and poverty. Nat. Sustain. 1, 623–631. doi: 10.1038/s41893-018-0155-4
Bryan, B. A., Gao, L., Ye, Y., Sun, X., Connor, J. D., Crossman, N. D., et al. (2018). China’s response to a national land-system sustainability emergency. Nature 559, 193–204. doi: 10.1038/s41586-018-0280-2
Cao, F., Li, J., Fu, X., and Wu, G. (2020). Impacts of land conversion and management measures on net primary productivity in semi-arid grassland. Ecosyst. Health Sustain. 6:17. doi: 10.1080/20964129.2020.1749010
Cernusak, L. A., Winter, K., and Turner, B. L. (2011). Transpiration modulates phosphorus acquisition in tropical tree seedlings. Tree Physiol. 31, 878–885. doi: 10.1093/treephys/tpr077
Chen, J., Jönsson, P., Tamura, M., Gu, Z., Matsushita, B., and Eklundh, L. (2004). A simple method for reconstructing a high-quality NDVI timeseries data set based on the Savitzky–Golay filter. Remote Sens. Environ. 91, 332–344. doi: 10.1016/j.rse.2004.03.014
Ding, Y. X., and Peng, S. Z. (2020). Spatiotemporal trends and attribution of drought across China from 1901–2100. Sustainability 12:477. doi: 10.3390/su12020477
Do, N., and Kang, S. (2014). Assessing drought vulnerability using soil moisturebased water use efficiency measurements obtained from multi-sensor satellite data in Northeast Asia dryland regions. J. Arid Environ. 105, 22–32. doi: 10.1016/j.jaridenv.2014.02.018
Domec, J. C., King, J. S., Ward, E., Christopher Oishi, A., Palmroth, S., Radecki, A., et al. (2015). Conversion of natural forests to managed forest plantations decreases tree resistance to prolonged droughts. For. Ecol. Manag. 355, 58–71. doi: 10.1016/j.foreco.2015.04.012
Dou, Y., Yang, Y., An, S., and Zhu, Z. (2020). Effects of different vegetation restoration measures on soil aggregate stability and erodibility on the Loess Plateau, China. Catena 185:104294. doi: 10.1016/j.catena.2019.104294
Du, B., Zheng, J., Ji, H. W., Zhu, Y. H., Yuan, J., Wen, J. H., et al. (2021). Stable carbon isotope used to estimate water use efficiency can effectively indicate seasonal variation in leaf stoichiometry. Ecol. Indic. 121:107250. doi: 10.1016/j.ecolind.2020.107250
Fang, J., Chen, A., Peng, C., Zhao, S., and Ci, L. (2001). Changes in forest biomass carbon storage in China between 1949 and 1998. Science 292, 2320–2322. doi: 10.1126/science.1058629
Fang, C. H., Zhou, K. Y., Zhang, Y. W., Li, B. Z., and Han, M. Y. (2017). Effect of root pruning and nitrogen fertilization on growth of young ‘fuji’apple (Malus domestica borkh.) trees. J. Plant Nutr. 40, 1538–1546. doi: 10.1080/01904167.2016.1240202
Farquhar, G. D., O'Leary, M. H., and Berry, J. A. (1982). On the relationship between carbon isotope discrimination and the intercellular carbon dioxide concentration in leaves. Funct. Plant Biol. 9, 121–137. doi: 10.1071/PP9820121
Farquhar, G. D., and Richards, R. A. (1984). Isotopic composition of plant carbon correlates with water-use efficiency of wheat genotypes. Funct. Plant Biol. 11, 539–552. doi: 10.1071/PP9840539
Farr, T. G., Rosen, P. A., Caro, E., Crippen, R., Duren, R., Hensley, S., et al. (2007). The shuttle radar topography mission. Rev. Geophys. 45, 1–33. doi: 10.1029/2005RG000183
Fu, B., Wang, S., Liu, Y., Liu, J., Liang, W., and Miao, C. (2017). Hydrogeomorphic ecosystem responses to natural and anthropogenic changes in the Loess Plateau of China. Annu. Rev. Earth Planet. Sci. 45, 223–243. doi: 10.1146/annurev-earth-063016-020552
Gang, C., Wang, Z., Zhou, W., Chen, Y., Li, J., Chen, J., et al. (2016). Assessing the spatiotemporal dynamic of global grassland water use efficiency in response to climate change from 2000 to 2013. J. Agron. Crop Sci. 202, 343–354. doi: 10.1111/jac.12137
He, P., Sun, Z., Han, Z., Dong, Y., Liu, H., Meng, X., et al. (2021). Dynamic characteristics and driving factors of vegetation greenness under changing environments in Xinjiang, China. Environ. Sci. Pollut. Res. 28, 42516–42532. doi: 10.1007/s11356-021-13721-z
Horion, S., Prishchepov, A., Verbesselt, J., de Beurs, K., Tagesson, T., and Fensholt, R. (2016). Revealing turning points in ecosystem functioning over the Northern Eurasian agricultural frontier. Glob. Chang. Biol. 22, 2801–2817. doi: 10.1111/gcb.13267
Hu, T., Hu, H., Li, F., Zhao, B., Wu, S., Zhu, G., et al. (2019). Long-term effects of post-fire restoration types on nitrogen mineralisation in a Dahurian larch (Larix gmelinii) forest in boreal China. Sci. Total Environ. 679, 237–247. doi: 10.1016/j.scitotenv.2019.05.008
Huang, M., Piao, S., Sun, Y., Ciais, P., Cheng, L., Mao, J., et al. (2015). Change in terrestrial ecosystem water-use efficiency over the last three decades. Glob. Chang. Biol. 21, 2366–2378. doi: 10.1111/gcb.12873
Justice, C. O., Townshend, J., Vermote, E. F., Masuoka, E., Wolfe, R. E., Saleous, N., et al. (2002). An overview of MODIS land data processing and product status. Remote Sens. Environ. 83, 3–15. doi: 10.1016/S0034-4257(02)00084-6
Kamali, A., Khosravi, M., and Hamidianpour, M. (2020). Spatial–temporal analysis of net primary production (NPP) and its relationship with climatic factors in Iran. Environ. Monit. Assess. 192, 718–720. doi: 10.1007/s10661-020-08667-7
Koju, U. A., Zhang, J., Maharjan, S., Bai, Y., Zhang, S., and Yao, F. (2020). Analysis of spatiotemporal dynamics of forest net primary productivity of Nepal during 2000–2015. Int. J. Remote Sens. 41, 4336–4364. doi: 10.1080/01431161.2020.1717667
Law, B. E., Falge, E., Gu, L., and Baldocchi, D. D. (2002). Environmental controls over carbon dioxide and water vapor exchange of terrestrial vegetation. Agric. For. Meteorol. 113, 97–120. doi: 10.1016/S0168-1923(02)00104-1
Le, QB, Nkonya, E, and Mirzabaev, A., 2016. Biomass productivity-based mapping of global land degradation hotspots. In, E Nkonya, A Mirzabaev, and J Braunvon (eds) Economics of land degradation and improvement—A global assessment for sustainable development. Springer International Publishing, Cham, pp. 55–84.
Li, Y. P., Li, H. B., Li, Y. Y., and Zhang, S. Q. (2017). Improving water-use efficiency by decreasing stomatal conductance and transpiration rate to maintain higher ear photosynthetic rate in drought-resistant wheat. Crop J. 5, 231–239. doi: 10.1016/j.cj.2017.01.001
Li, Z., Ma, W., Liang, C., Liu, Z., Wang, W., and Wang, L. (2015). Long-term vegetation dynamics driven by climatic variations in the Inner Mongolia grassland, findings from 30-year monitoring. Landsc. Ecol. 30, 1701–1711. doi: 10.1007/s10980-014-0068-1
Li, Y., Piao, S., Chen, A., Ciais, P., Laurent, Z., and Li, X. (2019). Local and tele-connected temperature effects of afforestation and vegetation greening in China. Natl. Sci. Rev. 7, 897–912. doi: 10.1093/nsr/nwz132
Lü, Y., Fu, B., Feng, X., Zeng, Y., Liu, Y., Chang, R., et al. (2012). A policy-driven large scale ecological restoration: quantifying ecosystem services changes in the Loess Plateau of China. PLoS One 7:31782. doi: 10.1371/journal.pone.0031782
MENG, Y., HE, Z., LIU, B., CHEN, L., and LIU, B. (2020). Changes of spatial distribution and ecosystem service value of oasis wetlands in arid areas: taking three typical inland river basins as examples. Resour. Sci. 42, 2022–2034. doi: 10.18402/resci.2020.10.18
Peng, S.-S., Piao, S., Zeng, Z., Ciais, P., Zhou, L., Laurent, Z., et al. (2014). Afforestation in China cools local land surface temperature. Proc. Natl. Acad. Sci. U. S. A. 111, 2915–2919. doi: 10.1073/pnas.1315126111
Rodell, M., Houser, P. R., Jambor, U., Gottschalck, J., Mitchell, K., Meng, C. J., et al. (2004). The global land data assimilation system. Bull. Amer. Meteor. Soc. 85, 381–394. doi: 10.1175/BAMS-85-3-381
Ruppert, J. C., Holm, A., Miehe, S., Muldavin, E., Snyman, H. A., Wesche, K., et al. (2012). Meta-analysis of ANPP and rainuse efficiency confirms indicative value for degradation and supports non-linear response along precipitation gradients in drylands. J. Veg. Sci. 23, 1035–1050. doi: 10.1111/j.1654-1103.2012.01420.x
Shen, Y. P., Su, H. C., Wang, G. Y., Mao, W. M., Wang, S. D., Han, P., et al. (2013). The response of glaciers and snow cover to climate in Xinjiang(I):hydrological effect. J. Glaciol. Geocryol. 35, 513–527. doi: 10.7522/j.issn.1000-0240.2013.0061
Stavi, I., and Lal, R. (2015). Achieving zero net land degradation, challenges and opportunities. J. Arid Environ. 112, 44–51. doi: 10.1016/j.jaridenv.2014.01.016
Tang, X., Zhao, X., Bai, Y., Tang, Z., Wang, W., Zhao, Y., et al. (2018). Carbon pools in China's terrestrial ecosystems, new estimates based on an intensive field survey. Proc. Natl. Acad. Sci. U. S. A. 115, 4021–4026. doi: 10.1073/pnas.17002911
Taylor, S. H., Hulme, S. P., Rees, M., Ripley, B. S., Woodward, F. I., and Osborne, C. P. (2010). Ecophysiological traits in C3 and C4 grasses, a phylogenetically controlled screening experiment. New Phytol. 185, 780–791. doi: 10.1111/j.1469-8137.2009.03102.x
Wang, H., Liu, G., Li, Z., Wang, P., and Wang, Z. (2019). Comparative assessment of vegetation dynamics under the influence of climate change and human activities in five ecologically vulnerable regions of China from 2000 to 2015. Forests 10:317. doi: 10.3390/f10040317
Wang, Q. W., Yu, D. P., Dai, L. M., Zhou, L., Zhou, W. M., Qi, G., et al. (2010). Research progress in water use efficiency of plants under global climate change. Chin. Acad. Sci. 21, 3255–3265. doi: 10.13287/j.1001-9332.2010.0440
Wei, X., Wang, S., and Wang, Y. (2018). Spatial and temporal change of fractional vegetation cover in North-Western China from 2000 to 2010. Geol. J. 53, 427–434. doi: 10.1002/gj.3030
Wessels, K. J., Van Den Bergh, F., and Scholes, R. (2012). Limits to detectability of land degradation by trend analysis of vegetation index data. Remote Sens. Environ. 125, 10–22. doi: 10.1016/j.rse.2012.06.022
Xu, X. (2022). The identification of artificial and natural modes for vegetation restoration and their degradation risk assessment—A case study in the Loess Plateau Northwest A&F University, 1–6.
Yang, L., Feng, Q., Wen, X., Barzegar, R., Adamowski, J. F., Zhu, M., et al. (2022). Contributions of climate, elevated atmospheric CO2 concentration and land surface changes to variation in water use efficiency in Northwest China. Catena 213:106220. doi: 10.1016/j.catena.2022.106220
Yang, Q., Liu, G., Casazza, M., Dumontet, S., and Yang, Z. (2021). Ecosystem restoration programs challenges under climate and land use change. Sci. Total Environ. 807:150527. doi: 10.1016/j.scitotenv.2021.150527
Zhang, P., Deng, M., Long, A., Deng, X., Wang, H., Hai, Y., et al. (2020). Coupling analysis of social-economic water consumption and its effects on the arid environments in Xinjiang of China based on the water and ecological footprints. Arid Land 12, 73–89. doi: 10.1007/s40333-020-0050-5
Zhang, K., Kimball, J. S., Nemani, R. R., and Running, S. W. (2010). A continuous satellite-derived global record of land surface evapotranspiration from 1983 to 2006. Water Resour. Res. 46:W09522. doi: 10.1029/2009WR008800
Zhao, W., Chen, S. P., and Lin, H. G. H. (2009). Effects of long-term grazing on the morphological and functional traits of Leymus chinensis in the semiarid grassland of Inner Mongolia, China. Ecol. Res. 24, 99–108. doi: 10.1007/s11284-008-0486-0
Zheng, S., Lan, Z., Li, W., Shao, R., Shan, Y., Wan, H., et al. (2011). Differential responses of plant functional trait to grazing between two contrasting dominant C3 and C4 species in a typical steppe of Inner Mongolia, China. Plant Soil 340, 141–155. doi: 10.1007/s11104-010-0369-3
Zheng, K., Tan, L., Sun, Y., Wu, Y., Duan, Z., Xu, Y., et al. (2021). Impacts of climate change and anthropogenic activities on vegetation change, evidence from typical areas in China. Ecol. Indic. 126, 107648–107613. doi: 10.1016/j.ecolind.2021.107648
Zhu, W. Q., Pan, Y. Q., He, H., Yu, D., and Hu, H. (2006). Simulation of maximum light utilization of typical vegetation in China. Chin. Sci. Bull. 51, 700–706. doi: 10.1360/972005-555
Wen-Quan, Z. H. U., Yao-Zhong, P. A. N., and Jin-Shui, Z. H. A. N. G., Key Laboratory of Environmental Change and Natural Disaster of Ministry of Education, College of Resources Science and Technology, Beijing Normal University, Beijing 100875, China (2007). Estimation of net primary productivity of CHINESE terrestrial vegetation based on remote sensing. Chin. J. Plant Ecol. 31, 413–424. doi: 10.17521/cjpe.2007.0050
Keywords: artificial vegetation, natural vegetation, net primary productivity, water use efficiency, restoration and degradation
Citation: Zhang J, Li Z, Duan W, Zhao H, Hao H, Xiang Y and Zhang Q (2023) Assessing restoration and degradation of natural and artificial vegetation in the arid zone of Northwest China. Front. Ecol. Evol. 11:1131210. doi: 10.3389/fevo.2023.1131210
Edited by:
Xiaoyang Zhang, South Dakota State University, United StatesReviewed by:
Hailong Wang, Sun Yat-sen University, Zhuhai Campus, ChinaBin Guo, Shandong University of Science and Technology, China
Copyright © 2023 Zhang, Li, Duan, Zhao, Hao, Xiang and Zhang. This is an open-access article distributed under the terms of the Creative Commons Attribution License (CC BY). The use, distribution or reproduction in other forums is permitted, provided the original author(s) and the copyright owner(s) are credited and that the original publication in this journal is cited, in accordance with accepted academic practice. No use, distribution or reproduction is permitted which does not comply with these terms.
*Correspondence: Haichao Hao, haohc@stu.ecnu.edu.cn