Comparative genomics of Hox and ParaHox genes among major lineages of Branchiopoda with emphasis on tadpole shrimps
 Filippo Nicolini1,2*
  Jacopo Martelossi1
  Giobbe Forni3
  Castrense Savojardo4 Barbara Mantovani1
  Andrea Luchetti1*
- 1Department of Biological, Geological, and Environmental Sciences, University of Bologna, Bologna, Italy
- 2Fano Marine Center, Fano, Italy
- 3Department of Agricultural and Environmental Sciences, University of Milan, Milan, Italy
- 4Department of Pharmacy and Biotechnology, University of Bologna, Bologna, Italy
Hox and ParaHox genes (HPHGs) are key developmental genes that pattern regional identity along the anterior–posterior body axis of most animals. Here, we identified HPHGs in tadpole shrimps (Pancrustacea, Branchiopoda, Notostraca), an iconic example of the so-called “living fossils” and performed a comparative genomics analysis of HPHGs and the Hox cluster among major branchiopod lineages. Notostraca possess the entire Hox complement, and the Hox cluster seems to be split into two different subclusters, although we were not able to support this finding with chromosome-level assemblies. However, the genomic structure of Hox genes in Notostraca appears more derived than that of Daphnia spp., which instead retains the plesiomorphic condition of a single compact cluster. Spinicaudata and Artemia franciscana show instead a Hox cluster subdivided across two or more genomic scaffolds with some orthologs either duplicated or missing. Yet, branchiopod HPHGs are similar among the various clades in terms of both intron length and number, as well as in their pattern of molecular evolution. Sequence substitution rates are in fact generally similar for most of the branchiopod Hox genes and the few differences we found cannot be traced back to natural selection, as they are not associated with any signals of diversifying selection or substantial switches in selective modes. Altogether, these findings do not support a significant stasis in the Notostraca Hox cluster and further confirm how morphological evolution is not tightly associated with genome dynamics.
1. Introduction
Since their discovery, Hox and ParaHox genes (HPHGs) have gained an increasing importance in many fields of biology due to their role in animal development and their clustered organization in many taxa (Lemons and McGinnis, 2006; Holland, 2013; Bürglin and Affolter, 2016). Thus, HPHGs are often among the first genes to be characterized in newly sequenced genomes e.g., (see Chipman et al., 2014; Baldwin-Brown et al., 2018; Jo et al., 2021), especially when considering taxa with specific morphological peculiarities. For example, they have been investigated in the coelacanth (Amemiya et al., 2010; Higasa et al., 2012), probably the most iconic living fossil, and the Banna caecilian (Wu et al., 2015), in search of an explanation for their apparent morphological stasis. However, HPHGs by themselves can hardly explain the evolution of the whole genome of an organism or its morphology (Casane and Laurenti, 2013; Lidgard and Love, 2018), since they just represent the iceberg tip of morphogenetic processes (Pick, 2016). Within a comprehensive and coherent biological framework, HPHGs are nevertheless interesting candidates to gain better insights on genome evolution and can shed light on many evolutionary processes. For example, the vertebrate Hox complement was part of the empirical evidence that supported the hypothesis of multiple-round genome duplications in this clade (Taylor et al., 2003; Dehal and Boore, 2005).
Like the coelacanth, Notostraca (tadpole shrimps) have been repeatedly regarded as living fossils (e.g., Fryer, 1988; Suno-Uchi et al., 1997; Gall and Grauvogel-Stamm, 2005; Ikeda et al., 2015) because of their morphological and ecological stasis (Gueriau et al., 2016), and their ancient origin which dates back to the Permian (Gand et al., 1997). However, recent molecular phylogenetic and time tree analyses (Mathers et al., 2013), as well as comparative genomic studies (Savojardo et al., 2019; Luchetti et al., 2021), have questioned the status of tadpole shrimps as living fossils. In fact, at the molecular level, the clade shows highly dynamic gene families and high levels of transposable element turnovers, as well as a heterogeneous landscape of protein-coding gene substitution rates (Luchetti et al., 2021). Generally speaking, the concept of “living fossil” (i.e., evolutionary stasis) can be problematic when applied a-priori to every aspect of the biology of certain organisms and can lead to erroneous interpretations of data (Casane and Laurenti, 2013). In fact, there is no reason to expect a shared pattern of evolutionary change between different traits, as already proved by many works (e.g., Hay et al., 2008; Mathers et al., 2013; Luchetti et al., 2021). Even in the case of a species exhibiting a generally slow rate of morphological evolution, we should not expect that the same holds for the genomes as well, as the two patterns are not so tightly linked (Casane and Laurenti, 2013; Lidgard and Love, 2018).
In this study, we provide the first insight into HPHGs of six tadpole shrimp species from the genera Triops and Lepidurus, and the first comparative analysis among major branchiopod clades. To date, HPHGs have been investigated in Cladocera (Kim et al., 2018), in the clam shrimp Eulimnadia texana (Baldwin-Brown et al., 2018) and in the brine shrimp Artemia franciscana (Averof and Akam, 1993), while no records are found for Notostraca. Thus, we also aim at increasing our knowledge on differences and similarities of these peculiar crustaceans by investigating molecular evolution of their HPHGs.
2. Materials and methods
2.1. HPHG and eve ortholog identification
A total of 12 branchiopod genome assemblies were obtained from NCBI [Accessed on September 2021; Daphnia magna, Daphnia pulex, Eulimnadia texana, Leptestheria dahalacensis, Lepidurus apus lubbocki, Lepidurus apus apus, Lepidurus couesii, Lepidurus arcticus, Triops longicaudatus, Triops cancriformis from Espolla, Spain (ES; bisexual population) and Triops cancriformis from Novara, Italy (IT; parthenogenetic population)] and from the Korea Polar Research Institute (https://antagen.kopri.re.kr/project/genome_info_iframe.php?Code=AF01; accessed on September 2021; Artemia franciscana; Supplementary Table S1). The springtail Folsomia candida (NCBI acc. no. GCF_002217175.1; Faddeeva-Vakhrusheva et al., 2017) and the fruit fly Drosophila melanogaster (NCBI acc. no. GCF_000001215.4; Hoskins et al., 2015), which are two of the best characterized hexapod genome assemblies, were selected as the outgroups.
All the HPHG sequences which are deposited on HomeoDB (http://homeodb.zoo.ox.ac.uk/; accessed on September 2021; Zhong and Holland, 2011) were downloaded and used to build a reference dataset. Additionally, all the even-skipped (eve) available sequences were included in the dataset to set an outgroup in the subsequent phylogenetic analysis.
Hox and ParaHox gene and eve candidates in branchiopods and the springtail were searched using BLASTP v2.10.1+ (Camacho et al., 2009) with an e-value of 10−5. The resulting best-hit sequence identities were then checked against the proteomes of D. melanogaster and D. pulex with the same parameters as before. Each HPHG/eve ortholog was then inspected for the presence of the essential homeodomain (HD) using RPS-BLAST v2.10.1+ against the Conserved Domain Database.
In case of missing HPHG candidates, Exonerate v2.4.0 (Slater and Birney, 2005) with the protein2genome model and intron maximum length set to 40 kb was used to scan the whole genome assembly to search for unannotated sequences. The longest CDS for each HPHG was then selected and checked for the presence of the homeobox. Protein sequences were subsequently predicted using EMBOSS Transeq v6.6.0.0 (Rice et al., 2000).
A maximum likelihood (ML) phylogenetic analysis on all sequences was performed to further confirm the identity of HPHGs and eve orthologs. Sequences were aligned with MAFFT v7.453 (Katoh and Standley, 2013), by also incorporating protein structural information as provided by the DASH database (Rozewicki et al., 2019), and then trimmed using trimAl v.1.4.rev15 (Capella-Gutierrez et al., 2009) with a gap threshold of 40%. The phylogenetic tree was built using IQ-TREE v2.1.2 (Nguyen et al., 2015) with automatic model selection and 1,000 ultrafast bootstrap replicates.
Hox and ParaHox gene locations and structures (i.e., intron number and lengths, intergenic space lengths, and transcriptional orientation) were obtained by directly analyzing the genome annotation files. Concerning A. franciscana, whose annotation file was not available at the time of these analyses, HPHG locations and structures were inferred by aligning the coding sequences back to the genome using Exonerate with the coding2genome model and the same parameters as before. The Kruskal-Wallis test followed by the pairwise Wilcoxon test with the Bonferroni correction were performed to look for significant differences among species in intron and intergenic space lengths. A regression analysis between genome and Hox cluster sizes was performed in species where Hox genes are spread in maximum two clusters, namely Daphnia spp., E. texana, L. apus apus, L. arcticus, and T. longicaudatus. The Hox cluster lengths were calculated considering two separate clusters for E. texana and the three Notostraca.
2.2. Molecular evolution of Hox and ParaHox genes
For molecular evolution analyses, nucleotide alignments were obtained with PAL2NAL v14 (Suyama et al., 2006) and trimmed with trimAl to remove all gaps.
Relative rate test (RRT) analysis was performed using RRTree v1.1.11 (Robinson-Rechavi and Huchon, 2000) on both amino acid and nucleotide alignments. RRT analysis was first performed considering A. franciscana, Onychocaudata (Daphnia spp., E. texana, and L. dahalacensis), and Notostraca (Triops spp. and Lepidurus spp.) as tested groups, with F. candida as the outgroup. In a second analysis, RRT was run on the pairs Cladocera (Daphnia spp.) + Notostraca, and Spinicaudata (E. texana and L. dahalacensis) + Notostraca, in order to unveil which Onychocaudata was responsible for the differences in substitution rates.
Selection analyses were carried out considering the dN/dS ratio and using the tests implemented in the HyPhy v2.5.8 package (Kosakovsky Pond et al., 2005). Gene trees were built on nucleotide alignments using IQTREE as described before. Both RELAX (Wertheim et al., 2015) and aBSREL (Smith et al., 2015) were run to investigate selective modes. The former tests whether any differences in selection strength can be detected in a set of branches (test) with respect to another set of branches (reference) in a phylogenetic tree, while the latter looks for signs of natural selection across each branch of a predetermined set. Therefore, considering that only Notostraca and Cladocera were systematically retrieved as monophyletic groups in all the HPHG trees, RELAX was performed to investigate selective patterns between the two, with Cladocera set as reference group and Notostraca set as test group. The aBSREL analysis was instead performed on all terminal branches of the trees.
2.3. Hox-cluster associated miRNAs
miR-993, miR-10, and the pair miR-iab-4 and miR-iab-8 (miR-iab-4/8, which produce sense and antisense transcripts at the same locus, respectively) are all generally found in conserved positions within arthropod Hox clusters (Pace et al., 2016), that is, between the pairs Hox3 + dfd, dfd + scr and abd-A + abd-B, respectively. miRNA sequences were retrieved from NCBI (Supplementary Table S2) and used in a BLASTN search to find their own orthologs in the brachiopod genomes. Resulting sequences were then aligned with the MAFFT Q-INS-i method, trimmed and used to infer a phylogenetic tree as previously described; miR-196 sequence was used to root the tree. The tree topology was constrained to have monophyletic miRNA families and a Kishino-Hasegawa (KH; Kishino and Hasegawa, 1989) tree topology test against the unconstrained topology was performed using IQTREE.
3. Results
3.1. Hox and ParaHox genes in branchiopods
All the 10 canonical Hox genes of the ancestral arthropod Hox cluster [labial (lab), proboscipedia (pb), Hox3, deformed (dfd), sex combs reduced (scr), fushi tarazu (ftz), antennapedia (antp), ultrabithorax (ubx), abdominal-A (abd-A), and abdominal-B (abd-B); Chipman et al., 2014] were successfully retrieved as single copies in tadpole shrimp genomes. Of the three genes belonging to the ParaHox complement [Intermediate neuroblasts defective (ind), Pancreatic and duodenal homeobox 1 (Pdx), and caudal (cad)], cad alone was found in tadpole shrimps (Figure 1; Supplementary Figure S1; Supplementary Table S3).
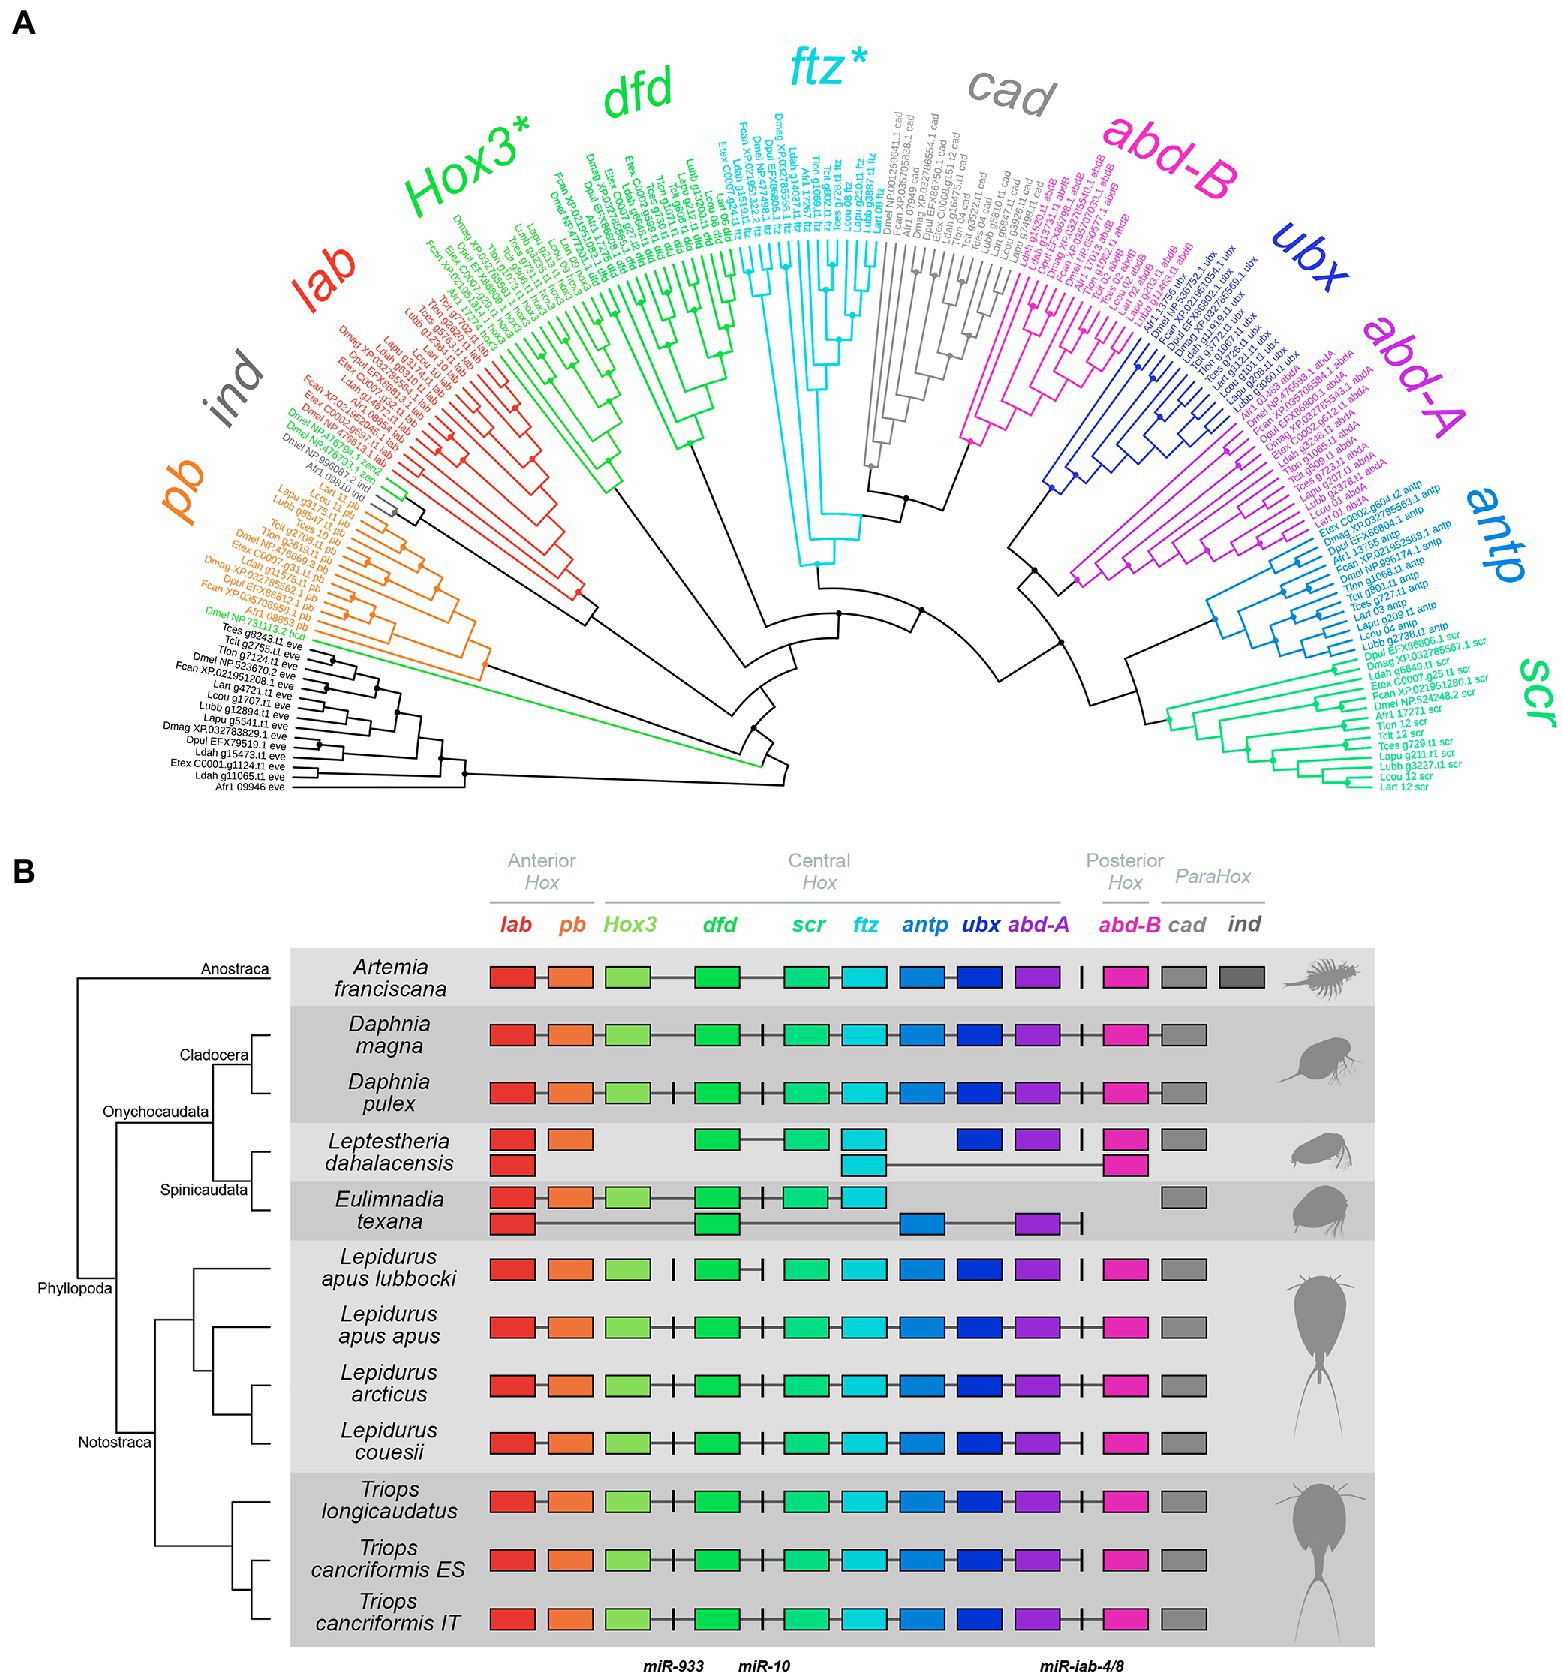
Figure 1. Maximum likelihood (ML) phylogenetic tree (A) and cluster organization (B) of Hox and ParaHox genes (HPHGs) in branchiopod crustaceans. (A) HPHGs are each highlighted in a different color. The phylogenetic tree has been rooted using eve as the outgroup. Each tip shows the species ID as in Supplementary Table S1, the gene accession number as in Supplementary Table S3 and the gene ID. Nodes with support values ≥85 are marked with a solid circle. HPHG names are shown around the tree and asterisks mark non-monophyletic groups. (B) Each row corresponds to a different surveyed genome and HPHG presence is represented by colored boxes. HPHGs are all oriented in the same transcriptional direction, i.e., from right to left; miRNAs are represented by black vertical lines. A phylogenetic tree of the species is shown on the left with indication of the major branchiopod clades. Hox cluster paralogy groups (anterior, central, and posterior) are shown on the top. HPHGs that are hosted within the same genomic scaffold are connected by a gray line. Note that intergenic spaces are not at scale (see Supplementary Figure S1 for a scaled representation of HPHG clusters).
One ortholog per each Hox gene and one ortholog of the ParaHox cad were found in Cladocera genomes, consistently with previous works (Pace et al., 2016; Kim et al., 2018). All the HPHGs already annotated in the source genome were confirmed in our analyses, with the exception of the D. magna Hox3 gene (NCBI acc. no. XP_032795265.1), which was found to be mis-annotated (Supplementary Table S4). In fact, comparing this sequence against the entire NCBI non-redundant protein database returns no match with Hox3 orthologs from other organisms; additionally, this sequence falls in a different genome scaffold than the one hosting the Hox cluster. Our analysis, in fact, suggested another amino acid sequence as a Hox3 ortholog (NCBI acc. no. XP_032785561.1). The mis-annotation probably arose because this latter sequence brings two additional protein domains downstream from the HD, namely a SPRY domain and a SOCS box. After having aligned this sequence with other Daphnia Hox3 orthologs (NCBI acc. nos. AUX14965.1 and EFX86809.1), the poorly aligned terminal part bearing the additional domains (from position 639 to the end) was removed. The resulting sequence matched with other known Hox3 orthologs in the NCBI non-redundant protein database and fell within the D. magna Hox cluster in the canonical position, that is, between pb and dfd (Figure 1). Thus, we discarded the previously annotated XP_032795265.1 and kept XP_032785561.1 as Hox3 in D. magna.
The Spinicaudata Hox cluster composition appeared far more different than those found in Cladocera and Notostraca (Figure 1). In fact, five genes are represented by multiple copies (i.e., lab and dfd from E. texana, and lab, ftz, and abd-B from L. dahalacensis) while four genes are completely missing (i.e., ubx and abd-B from E. texana, and Hox3 and antp from L. dahalacensis). Most of the E. texana Hox genes found in this work were consistent with those previously identified (Baldwin-Brown et al., 2018), while some others were not (Supplementary Table S4). According to the phylogenetic analysis and on the basis of the relative position of genes along the scaffolds (Figure 1), the presently identified (i) C0007.g29.t1 (previously annotated as pb) is considered as Hox3, (ii) C0007.g25.t1 (previously dfd) is considered as scr, (iii) C0007.g24.t1 (previously either dfd or scr) is considered as ftz, and (iv) C0002.g604.t1 (previously as abd-A) is considered as antp. Spinicaudata also showed cad as the only representative of the ParaHox complement.
In the genome of A. franciscana, Hox gene cluster composition appeared rather conserved and most of HPHGs have been retrieved (Figure 1). The antp gene has been found with two paralogs at first, while ftz was missing. Interestingly, one of the two antp paralogs (Art-17267) clustered into the ftz clade in the ML phylogeny (Figure 1A). Actually, Heffer et al. (2010) successfully investigated ftz in Artemia salina and Averof and Akam (1993) found just one antp paralog in A. franciscana. Accordingly, the alignment between the presently-determined antp putative paralogs (Art-13755 and Art-17267), ftz from Heffer et al. (NCBI acc. no. ADQ27867.1), and antp from Averof and Akam (NCBI acc. no. CAA49682.1) showed that (i) Art-13,755 hosts an antp-like HD while (ii) Art-17267 hosts a ftz-like HD. In particular, this latter HD has the amino acid N-terminal motif that distinguishes ftz from all the other Hox proteins, namely KR(T/S)RQ(T/S)Y(T/S)(R/K) (Supplementary Figure S2; Heffer et al., 2010). Also, Art-17,267 (ftz) is found downstream scr (Art-17271), that is, in the expected position according to the canonical order of arthropod Hox genes (Chipman et al., 2014). These findings led us to consider Art-17267 as a ftz ortholog (Supplementary Table S4). For what concerns ParaHox genes, A. franciscana exhibits both cad and ind.
Overall, HPHG groups are monophyletic with maximum support with the exceptions of Hox3 and ftz (Figure 1A), which are commonly recognized as rogue Hox genes in other relevant studies (see the Discussion).
3.2. Hox cluster structure in branchiopods
In three out of seven tadpole shrimp specimens (namely L. apus apus, L. arcticus and T. longicaudatus), Hox genes fall into two different scaffolds, one harboring lab and pb genes (the anterior paralogy group, APG), while the other harbors all the remaining Hox genes (the central/posterior paralogy group, CPPG; Figure 1B). In the remaining four tadpole shrimp specimens (namely L. apus lubbocki, L. couesii, T. cancriformis ES, and T. cancriformis IT), Hox genes are spread among more than two scaffolds, albeit the APG is never found together with the CPPG. In addition, cad orthologs always fall in separate scaffolds. Cladocera show a single Hox gene cluster coupled with the ParaHox gene cad, which is found downstream abd-B, while in Spinicaudata and A. franciscana HPHGs are scattered across two or more genome scaffolds.
Intergenic region lengths between contiguous Hox genes are overall homogeneous among branchiopods (Kruskal-Wallis test χ2 = 12.903, p = 0.167; Figure 2A; Supplementary Figure S1). Similarly, intron numbers (Table 1) and lengths (Figure 2B) do not differ significantly, except for the pair A. franciscana and L. dahalacensis (Kruskal-Wallis test: χ2 = 23.703, value of p = 0.01404; Wilcoxon test: p = 0.029). However, when considering intergenic regions, their lengths might be underestimated in tadpole shrimps, E. texana and A. franciscana as they possess a split Hox cluster. In Notostraca, in particular, if assuming that APG and CPPG scaffolds are contiguous and that the Hox genes keep their prototypical order, the space between pb and Hox3 would range from at least ~55 kb in L. arcticus to ~279 kb in T. longicaudatus (Figure 2C), far higher values than those observed in Daphnia (~15 kb).
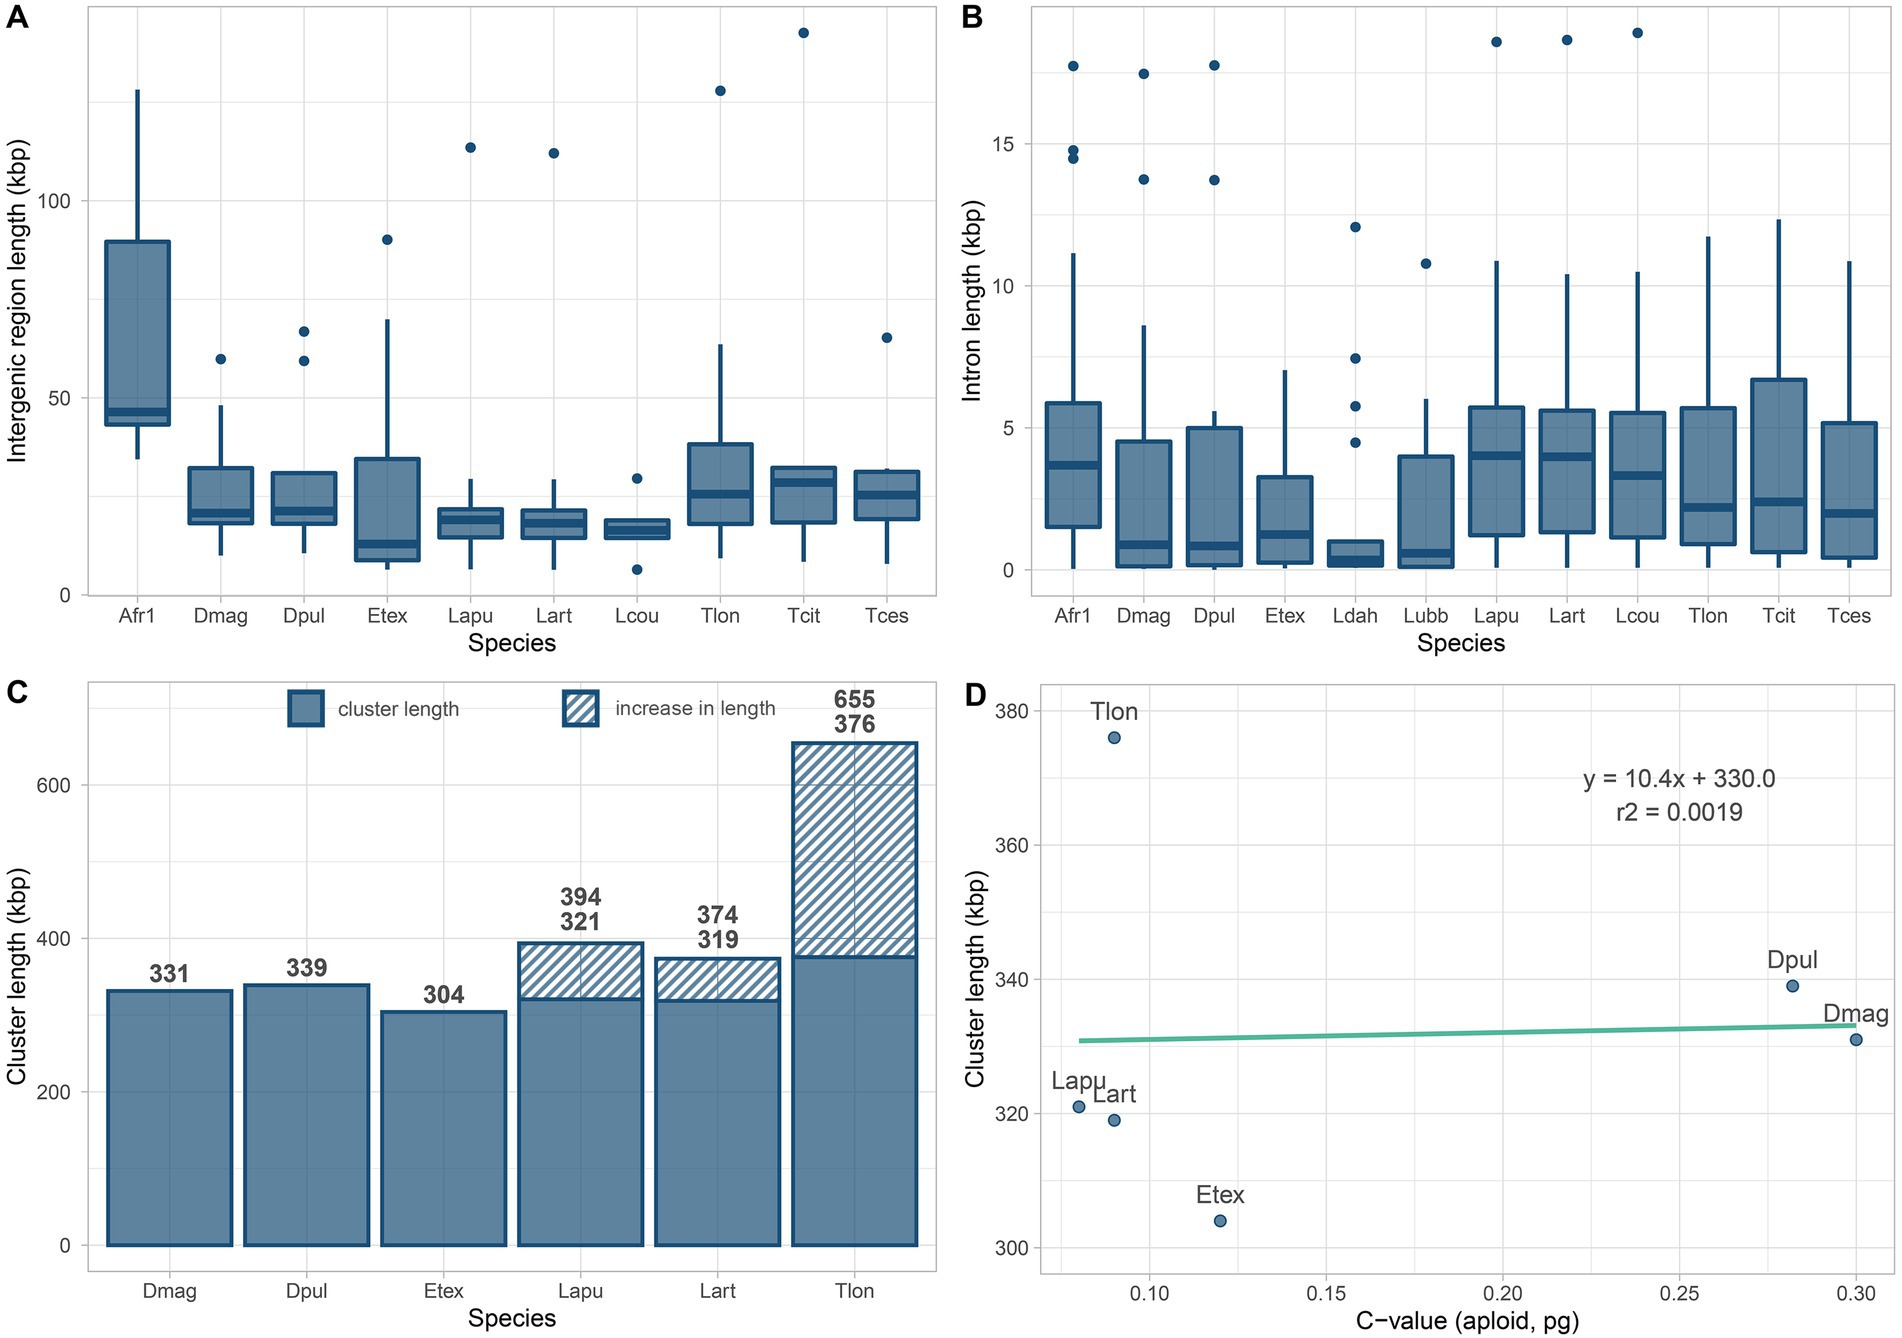
Figure 2. Intergenic region, intron and Hox cluster lengths in Branchiopoda. Boxplots in (A,B) summarize the values of intergenic regions and introns length of branchiopod Hox genes. Introns values are drawn from all surveyed genomes, while intergenic region lengths are drawn from all genomes except the two highly fragmented genomes of Leptestheria dahalacensis and Lepidurus apus lubbocki. Barplots in (C) summarize the Hox cluster lengths for genomes with Hox genes spread in maximum two clusters (scaffolds). Striped areas show the increase in length assuming that Notostraca APG and CPPG are contiguous and that the Hox genes keep their prototypical order. Length values are shown above each barplot. The scatterplot in (D) shows the correlation between genome and Hox cluster sizes for species as in (C); note that cluster lengths in (D) for Triops longicaudatus, Lepidurus apus apus, and Lepidurus arcticus refer to the split condition of the Hox cluster, thus not considering that APG and CPPG are contiguous. Species IDs are the same as in Supplementary Table S1.
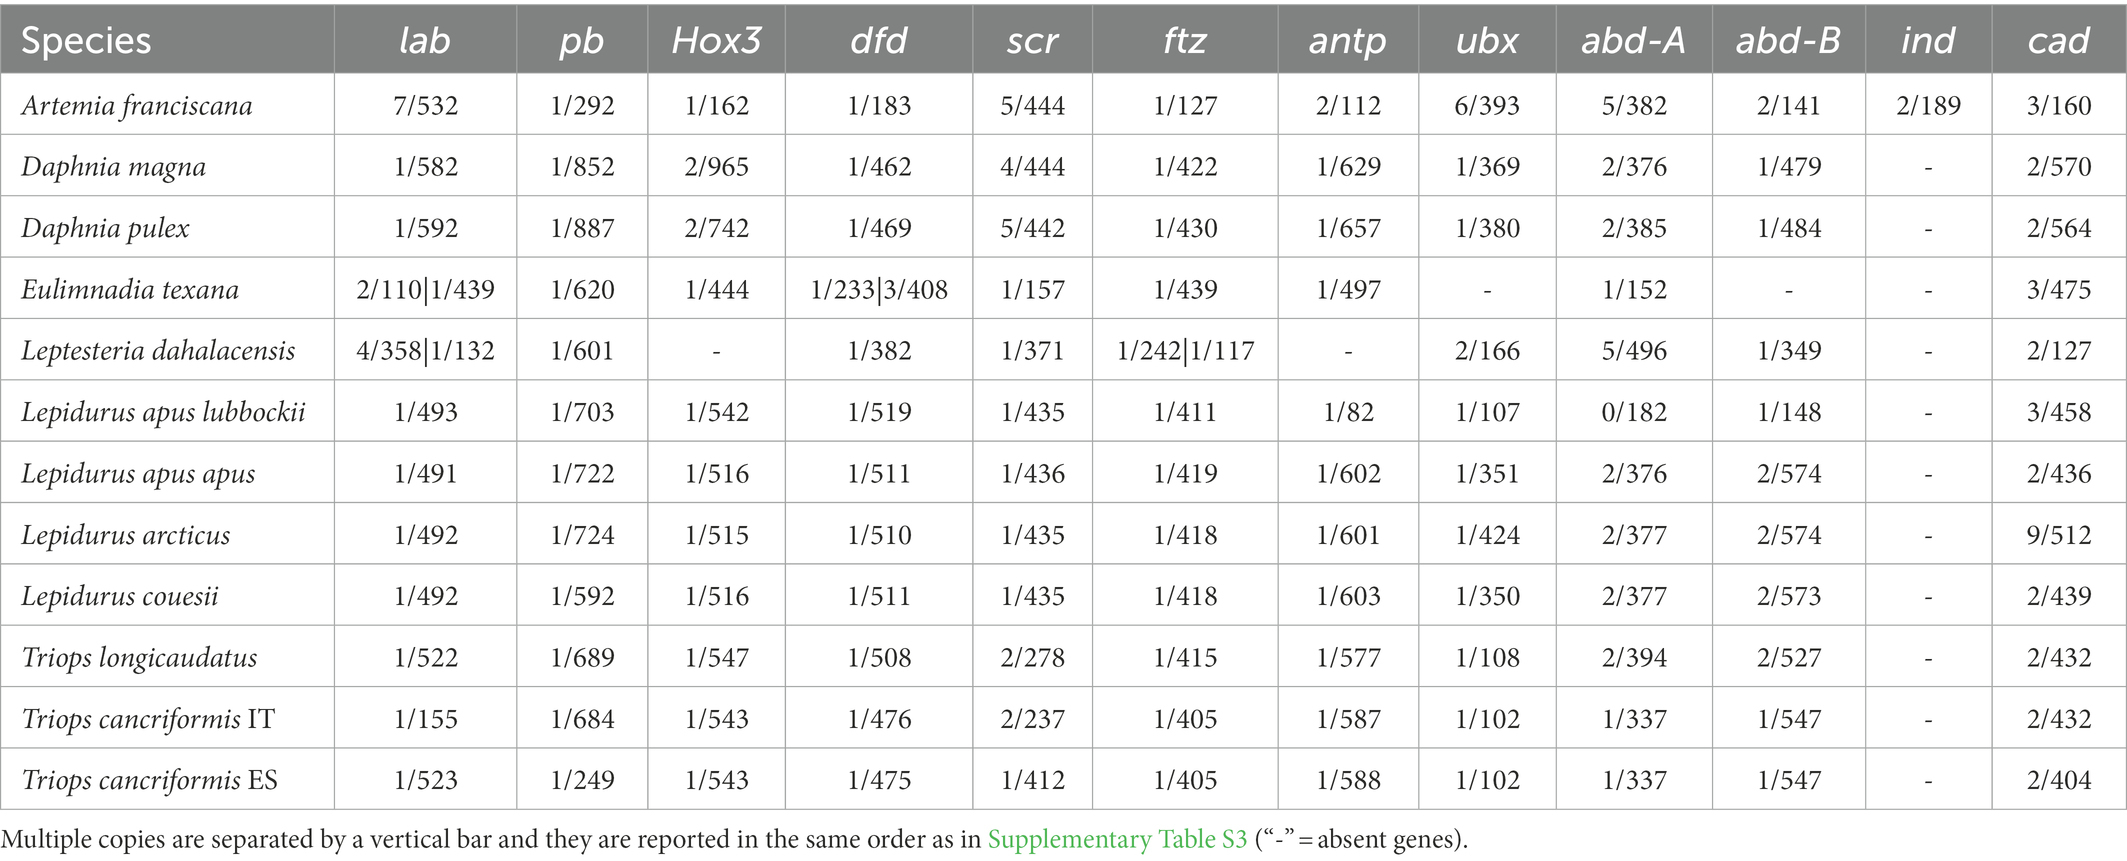
Table 1. Number of introns (first value) and protein length (second value) of HPHGs.
All the four Hox-cluster associated miRNAs were found in most of the species analyzed in this work (Figure 1; Supplementary Table S5). The gene for miR-993 is missing from the D. magna genome assembly but this could be likely due to an assembly artifact, since miR-993 was retrieved in previous D. magna sequencing works (Hearn et al., 2018; Coucheron et al., 2019). Both E. texana and L. dahalacensis are lacking miR-993 as well, and the latter is also lacking miR-10. The phylogenetic analysis on miRNA genes shows monophyletic miR-10 and miR-iab-4/8 and a paraphyletic miR-993 (Supplementary Figure S3A). However, when constraining the monophyly of the miRNA groups, the KH tree topology test accepted the constrained topology as equally likely (deltaL = 2.387; p = 0.322; Supplementary Figure S3B).
3.3. Hox and ParaHox gene molecular evolution
Phylogenetic reconstructions of each HPHG tree returned consistently both Cladocera and Notostraca as monophyletic groups, while monophyletic Spinicaudata were retrieved just in pb, ftz, abd-A, and cad gene trees (Figure 3).
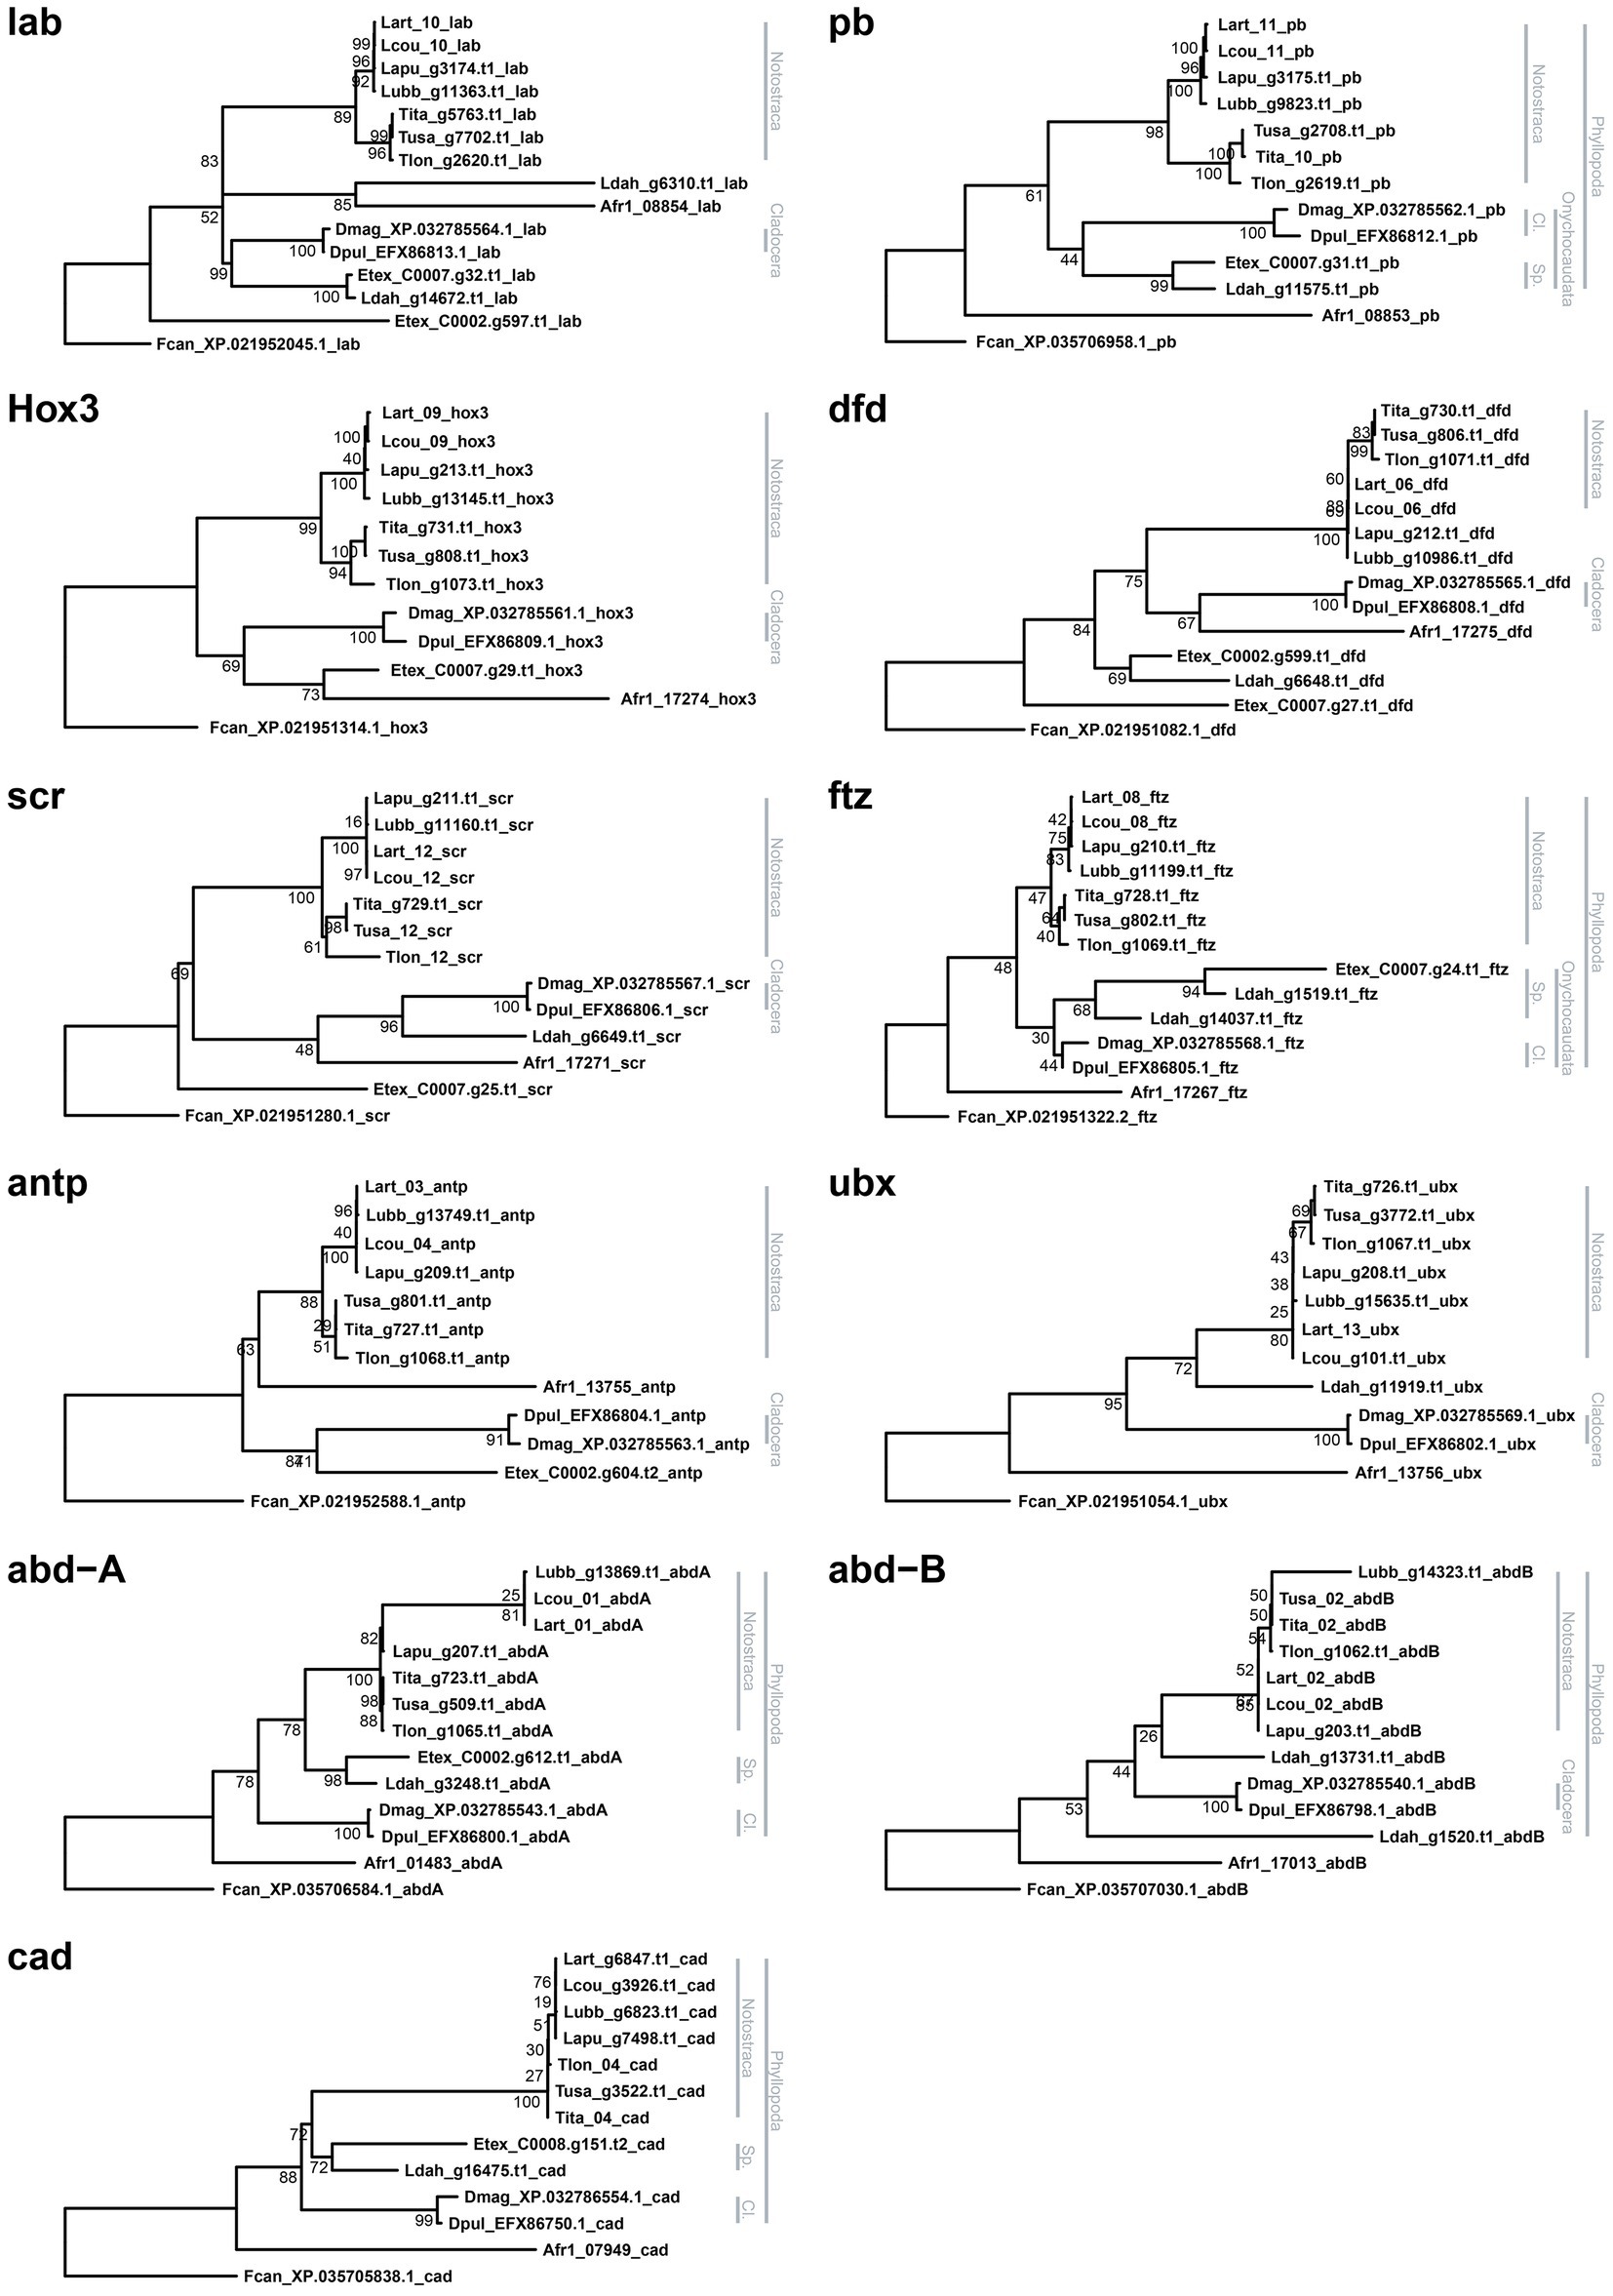
Figure 3. Hox and ParaHox gene maximum likelihood gene trees. Each tree is rooted using Folsomia candida as outgroup. Bootstrap values are shown at nodes. Branchiopod monophyletic groups are highlighted on the right side of each tree (Cl.: Cladocera; Sp.: Spinicaudata).
The RRT analysis showed that A. franciscana lab, Hox3 (both at the nucleotide and amino acid level, NT + AA) and ubx (only at the nucleotide level, NT) have higher substitution rates (p < 0.005) with respect to Onychocaudata. The same pattern holds for lab (NT + AA) and Hox3 (NT) with respect to Notostraca. Conversely, Onychocaudata have higher substitution rates (p < 0.005) in lab (NT + AA) and abd-A (NT) with respect to Notostraca (Supplementary Table S6). The aBSREL analysis found evidence (p < 0.05) of episodic diversifying selection in T. longicaudatus scr and in one L. dahalacencis abd-A (Supplementary Table S7). When comparing Notostraca to Cladocera, RELAX found instead evidence (p < 0.05) of relaxed selection (K < 1) in lab, dfd, and abd-B and of intensified selection (K > 1) in scr and cad (Supplementary Table S8).
4. Discussion
In this work, we report the first characterization of HPHGs in tadpole shrimps, and we present a comparative analysis with other branchiopods. Generally, orthology relationships proved to be very neat and with highly-supported monophyletic clades, even in groups with gene duplications, such as lab, dfd, and abd-B. Hox3 and ftz were the only exceptions and resulted in non-monophyletic groups. Interestingly, in many hexapod lineages these two genes have been recognized as rogue Hox genes since both have gained non-homeotic functions: for example, zerknüllt (zen) and zerknüllt-2 (zen2) are expressed in extra-embryonic tissues during development of many insect lineages, including the fruit fly (Hughes et al., 2004), while bicoid (bcd) is a maternal morphogen in cyclorrhaphan flies (Stauber et al., 1999, 2002); ftz is instead a pair-ruled gene both in insects and non-insect hexapods (Hughes et al., 2004). Concerning other crustaceans, Hox3 and ftz retain their homeotic expressions in D. pulex (Papillon and Telford, 2007), while in the barnacle Sacculina carcini (Mouchel-Vielh et al., 2002) and in the brine shrimp A. salina (Heffer et al., 2010) ftz has lost its homeotic role and is expressed in the central nervous system. These gains of functions are also reflected in the divergent sequences of their HDs and regulatory amino acid motifs (Stauber et al., 1999; Hughes et al., 2004; Pick, 2016; Liu et al., 2018): this may be the case also for some branchiopod orthologs and may affect their phylogenetic placement. However, until functional essays for Hox3 and ftz are performed in branchiopods, no further speculation on their function can be made.
Concerning the Notostraca HPHG complement, all genomes considered here show a single copy of each of the 10 arthropods’ canonical Hox genes, as well as a single copy of the ParaHox gene cad. The Hox location in the genome assemblies suggests that the Hox cluster may be split into two subclusters, one including the APG and one including the CPPG, as they are never found together. This suggests that either there is a very long intergenic region separating the two clusters or the Hox cluster is somehow structurally rearranged. The fragmented Hox clusters of L. apus lubbocki, L. couesii and T. cancriformis (as well as the one from the spinicaudatan L. dahalacensis) can possibly be traced back to assembly artifacts, as suggested by their N50 values (Supplementary Table S1). Among non-notostracan taxa, the only difference in the Hox cluster repertoire can be observed in the two Spinicaudata species, which show several gene duplications and losses. The A. franciscana situation is also of particular interest, since it is the only branchiopod which retains an ortholog of the ParaHox gene ind in our analysis. Data about ParaHox genes in Pancrustacea are generally lacking and, consequently, it will be of great evolutionary value to survey the ParaHox gene complement in other Pancrustacea species, in order to determine whether ind is absent only in Phyllopoda or also in other lineages. In comparison, the ParaHox gene Pdx is missing in all branchiopods investigated in this study, in agreement with its absence from the majority of other surveyed Ecdysozoa (Chipman et al., 2014).
Overall, tadpole shrimps show very small genome sizes among Pancrustacea (~107.5 Mb; Jeffery, 2015), yet their genomes appear highly dynamic in terms of molecular evolution, as indicated by the rate of gene family expansion/contraction and the content of transposable elements (Luchetti et al., 2021). Correspondingly, the Hox cluster seems to have rearranged in Notostraca with respect to the ancestral condition in arthropods, as indicated by the putative split between the APG and the CPPG. Thus far, we cannot detect any strong positive correlation between the genome and the Hox cluster size in Branchiopoda (r2 = 0.00019, Figure 2D), as instead Kim et al. (2021) proposed for copepods. As a matter of fact, in Daphnia, whose genomes are 2–3 times bigger than those of Notostraca (~215–479 Mb; Gregory, 2022), the Hox cluster retains the arthropod ancestral organization, with just one compact group of Hox genes (Pace et al., 2016; Kim et al., 2018). Conversely, both E. texana and L. dahalacensis, whose genome sizes are comparable to those of Notostraca (120.5 and 103.5 Mb, respectively, as inferred by Baldwin-Brown et al. (2018), and Luchetti et al. (2021)), seem to possess a Hox gene cluster rearranged with multiple gene duplications and losses. Artemia franciscana, whose genome is the biggest among the analyzed branchiopods (938 Mb; Jo et al., 2021), shows the complete set of Hox genes scattered through different genome scaffolds.
Comparative genomics among notostracans and other branchiopods retrieved a generally low substitution rate of tadpole shrimp genomes compared to Artemia or Onychocaudata. On the other hand, it was also shown that this trend does not hold true for all the genes analyzed (Luchetti et al., 2021). In this study, we concordantly found that HPHGs generally share similar substitution rates among branchiopods, with just few exceptions in which A. franciscana shows the highest values and Notostraca the lowest. However, these observed differences in substitution rates cannot be directly linked to diversifying selection since it has not been detected consistently by aBSREL. Conversely, the differences in selective pressures between Cladocera and Notostraca found by RELAX seemingly have not affected the substitution rates in these clades: the RRT analyses showed that the differences in substitution rates between Notostraca and Onychocaudata can be ascribed to Spinicaudata alone, rather than to Cladocera. These findings suggest that differences in substitution rates are more likely determined by local molecular mechanisms and/or specific life-history traits rather than by natural selection (Luchetti et al., 2021). For example, it has been shown that halophilic micro-crustaceans, including Artemia, exhibit an accelerated substitution rate in certain genes compared to their freshwater counterparts (Hebert et al., 2002). Similar factors may explain the consistent higher substitution rates of A. franciscana both in some HPHGs and in most of its protein coding genes.
Altogether, these genome dynamics in branchiopods further challenge the foggy association between morphological and molecular evolution, especially in the so-called “living fossils.” The two processes appear clearly unlinked (Casane and Laurenti, 2013) and trying to explain the rate of morphological change by just studying the rate of sequence change might be misleading, in particular when taking in consideration just a small set of genes. Furthermore, considering the HPHG sequence evolution as a proxy of the rate of morphological change might be deceiving, as the evolution of HPHGs is determined not only by the evolution of their raw sequences but also by the (co-)evolution of the gene regulatory networks they are part of (Pick and Heffer, 2012). In this sense, the fact that some animals may actually exhibit a certain degree of morphological stasis in relation to their closest kin should not be the reason for a priori expectation of any comparable degree of molecular stasis in their genomes (Casane and Laurenti, 2013), but instead should highlight open biological questions in need of an explanation (Lidgard and Love, 2018). A clear example of this comes from horseshoe crabs (Chelicerata, Xiphosura), another well-known example of living fossils (Mathers et al., 2013; Lidgard and Love, 2018). Recent comparative genomic surveys on this arthropod lineage have revealed that their long-term morphological stability is not associated with a comparable degree of genomic and molecular stasis, since multiple rounds of whole-genome duplications and subsequent gene family expansions have been detected (Kenny et al., 2016; Shingate et al., 2020). Their Hox gene complement is indeed present in multiple copies in the genomes of lineage members. They have experienced several events of sub-functionalization and pseudogenization of paralogs, suggesting again that genomic and morphological evolutionary patterns are not necessarily directly linked (Kenny et al., 2016). A similar situation is also present in Branchiopoda. Besides Notostraca, also Anostraca and Spinicaudata show a certain degree of morphological and ecological stasis (Gueriau et al., 2016), while Cladocera are the most diverse and successful clade among branchiopods (Lindholm, 2014). However, in terms of genomic organization, Cladocera exhibit a Hox cluster that is likely the most similar to that of the ancestral arthropod or, in other words, the most static one. Also, differences in branchiopod morphological evolution are not reflected in comparable differences in the molecular evolution of HPHGs.
Tadpole shrimps thus represent an excellent case study, for they fall within a hotspot of the arthropod tree of life in which phylogenetic relationships are still debated (Schwentner et al., 2017, 2018) and, together with their closest relatives, prove to be valuable model organisms to study the relationships between genome evolution and other life history traits. Often regarded as living fossils, Notostraca undoubtedly show outstanding morphological and ecological stasis compared to their fossil forms (Gueriau et al., 2016), but the same does not hold true for their genome as a whole. For example, according to the present study, their Hox cluster seems to have experienced a structural rearrangement, that is, either a putative split between the APG and the CPPG or a sensible increase of the reciprocal distance along the chormosome has occurred. In the future, it would be of primary importance to—literally—fill the gap in this putative split nature of the Hox cluster by generating highly contiguous reference genomes, which would allow comparative analyses at the intergenic level and shed light on the evolution of regulatory sequences. Providing high-quality genomic resources for other Branchiopoda species is also fundamental to unravel the mechanism underlying the outstanding biological and life history trait diversity of this tiny clade of crustaceans: for example, it would be useful to include non-Daphnia Cladocera and other Anostraca species in such comparative studies which may reveal more peculiar genome and HPHG dynamics. Hopefully, this characterization of HPHGs in novel branchiopod species, together with growing comparative data from other Pancrustacea lineages (e.g., Jaramillo et al., 2022), will also empower functional studies on these organisms to better understand how the evolution of HPHG sequences and regulatory pathways may have contributed to the diversification of Pancrustacea body plans and genome architectures.
Data availability statement
The datasets presented in this study can be found in online repositories. The link to the data can be found at: https://github.com/filonico/branchiopoda_Hox_ParaHox.
Author contributions
FN: data curation, bioinformatic analyses, visualization, result interpretation, and writing—original draft. JM and GF: methodology, validation, result interpretation, and writing—review and editing. CS: methodology and writing—review. BM: conceptualization, resources, and writing—review and editing. AL: conceptualization, resources, supervision, validation, and writing—review and editing. All authors contributed to the article and approved the submitted version.
Funding
This research was funded by Canziani funding to AL and BM.
Acknowledgments
We thank the two editors Scott Lidgard and Alan C. Love for setting up of the Research Topic New perspective on living fossils, and the two reviewers for their reading of the manuscript and their clever and insightful revisions.
Conflict of interest
The authors declare that the research was conducted in the absence of any commercial or financial relationships that could be construed as a potential conflict of interest.
Publisher’s note
All claims expressed in this article are solely those of the authors and do not necessarily represent those of their affiliated organizations, or those of the publisher, the editors and the reviewers. Any product that may be evaluated in this article, or claim that may be made by its manufacturer, is not guaranteed or endorsed by the publisher.
Supplementary material
The Supplementary material for this article can be found online at: https://www.frontiersin.org/articles/10.3389/fevo.2023.1046960/full#supplementary-material
Supplementary Figure S1 | Genomic organization of HPHGs and associated miRNAs in branchiopod crustaceans. Each row corresponds to a different surveyed genome. HPHGs, each highlighted with a different color, are all oriented in the same transcriptional direction, i.e., from right to left. HPHGs that are hosted within the same genomic scaffold are connected by a gray line. In addition to HPHGs, miRNAs are also shown (993: miR-993; 10: miR-10; 4/8: miR-iab-4/8). A phylogenetic tree of the species is shown on the left, with indication of the major branchiopod clades. The scale bar is shown at the bottom.
Supplementary Figure S2 | Multiple sequence alignments and sequence logos of HDs from (A) ftz and (B) antp orthologs. In both (A) and (B), A. franciscana sequences from this study are compared to A. salina from Averof and Akam (1993) (NCBI acc. no. ADQ27867.1) and A. franciscana from Heffer et al. (2010) (NCBI acc. no. CAA49682.1), respectively. In (A), the amino acid residues that distinguish ftz from all the other Hox proteins are marked above with asterisks.
Supplementary Figure S3 | ML phylogenetic tree of the Hox cluster associated miRNAs with unconstrained (A) and constrained (B) topology. miRNA groups are highlighted on the right of each tree. The paraphyletic miR-993 in (A) is marked with an asterisk. Tip IDs are the same as in Supplementary Table S2.
References
Amemiya, C. T., Powers, T. P., Prohaska, S. J., Grimwood, J., Schmutz, J., Dickson, M., et al. (2010). Complete HOX cluster characterization of the coelacanth provides further evidence for slow evolution of its genome. PNAS 107, 3622–3627. doi: 10.1073/pnas.0914312107
Averof, M., and Akam, M. (1993). HOM/Hox genes of Artemia: implications for the origin of insect and crustacean body plans. Curr. Biol. 3, 73–78. doi: 10.1016/0960-9822(93)90158-K
Baldwin-Brown, J. G., Weeks, S. C., and Long, A. D. (2018). A new standard for crustacean genomes: the highly contiguous, annotated genome assembly of the clam shrimp Eulimnadia texana reveals HOX gene order and identifies the sex chromosome. Genome Biol. Evol. 10, 143–156. doi: 10.1093/gbe/evx280
Bürglin, T. R., and Affolter, M. (2016). Homeodomain proteins: an update. Chromosoma 125, 497–521. doi: 10.1007/s00412-015-0543-8
Camacho, C., Coulouris, G., Avagyan, V., Ma, N., Papadopoulos, J., Bealer, K., et al. (2009). BLAST+: architecture and applications. BMC Bioinformatics 10, 1–9. doi: 10.1186/1471-2105-10-421
Capella-Gutierrez, S., Silla-Martinez, J. M., and Gabaldon, T. (2009). trimAl: a tool for automated alignment trimming in large-scale phylogenetic analyses. Bioinformatics 25, 1972–1973. doi: 10.1093/bioinformatics/btp348
Casane, D., and Laurenti, P. (2013). Why coelacanths are not ‘living fossils’. A review of molecular and morphological data. BioEssays 35, 332–338. doi: 10.1002/bies.201200145
Chipman, A. D., Ferrier, D. E. K., Brena, C., Qu, J., Hughes, D. S. T., Schröder, R., et al. (2014). The first myriapod genome sequence reveals conservative arthropod gene content and genome organisation in the centipede Strigamia maritima. PLoS Biol. 12:e1002005. doi: 10.1371/journal.pbio.1002005
Coucheron, D. H., Wojewodzic, M. W., and Bøhn, T. (2019). MicroRNAs in Daphnia magna identified and characterized by deep sequencing, genome mapping and manual curation. Sci. Rep. 9:15945. doi: 10.1038/s41598-019-52387-z
Dehal, P., and Boore, J. L. (2005). Two rounds of whole genome duplication in the ancestral vertebrate. PLoS Biol. 3:e314. doi: 10.1371/journal.pbio.0030314
Faddeeva-Vakhrusheva, A., Kraaijeveld, K., Derks, M. F., Anvar, S. Y., Agamennone, V., Suring, W., et al. (2017). Coping with living in the soil: the genome of the parthenogenetic springtail Folsomia candida. BMC Genomics 18, 493–414. doi: 10.1186/s12864-017-3852-x
Fryer, G. (1988). Studies on the functional morphology and biology of the Notostraca (Crustacea: Branchiopoda). Philos. Trans. R. Soc. Lond. Ser. B Biol. Sci. 321, 27–124. doi: 10.1098/rstb.1988.0091
Gall, J. C., and Grauvogel-Stamm, L. (2005). The early middle Triassic ‘Grès à Voltzia’ formation of eastern France: a model of environmental refugium. C. R. Palevol 4, 637–652. doi: 10.1016/j.crpv.2005.04.007
Gand, G., Garric, J., and Lapeyrie, J. (1997). Biocénoses à triopsidés (Crustacea, Branchiopoda) du Permien du bassin de Lodève (France). Geobios. Mem. Spec. 30, 673–700. doi: 10.1016/S0016-6995(97)80157-X
Gregory, T. R. (2022). Animal genome size database. Available at: http://www.genomesize.com (Accessed January 2022).
Gueriau, P., Rabet, N., Clément, G., Lagebro, L., Vannier, J., Briggs, D. E. G., et al. (2016). A 365-million-year-old freshwater community reveals morphological and ecological stasis in branchiopod crustaceans. Curr. Biol. 26, 383–390. doi: 10.1016/j.cub.2015.12.039
Hay, J. M., Subramanian, S., Millar, C. D., Mohandesan, E., and Lambert, D. M. (2008). Rapid molecular evolution in a living fossil. Trends Genet. 24, 106–109. doi: 10.1016/j.tig.2007.12.002
Hearn, J., Chow, F. W. N., Barton, H., Tung, M., Wilson, P. J., Blaxter, M., et al. (2018). Daphnia magna microRNAs respond to nutritional stress and ageing but are not transgenerational. Mol. Ecol. 27, 1402–1412. doi: 10.1111/mec.14525
Hebert, P. D. N., Remigio, E. A., Colbourne, J. K., Taylor, D. J., and Wilson, C. C. (2002). Accelerated molecular evolution in halophilic crustaceans. Evolution 56, 909–926. doi: 10.1111/j.0014-3820.2002.tb01404.x
Heffer, A., Shultz, J. W., and Pick, L. (2010). Surprising flexibility in a conserved Hox transcription factor over 550 million years of evolution. PNAS 107, 18040–18045. doi: 10.1073/pnas.1010746107
Higasa, K., Nikaido, M., Saito, T. L., Yoshimura, J., Suzuki, Y., Suzuki, H., et al. (2012). Extremely slow rate of evolution in the HOX cluster revealed by comparison between Tanzanian and Indonesian coelacanths. Gene 505, 324–332. doi: 10.1016/j.gene.2012.05.047
Holland, P. W. H. (2013). Evolution of homeobox genes. Wiley Interdiscip. Rev. Dev. Biol. 2, 31–45. doi: 10.1002/wdev.78
Hoskins, R. A., Carlson, J. W., Wan, K. H., Park, S., Mendez, I., Galle, S. E., et al. (2015). The release 6 reference sequence of the Drosophila melanogaster genome. Genome Res. 25, 445–458. doi: 10.1101/gr.185579.114
Hughes, C. L., Liu, P. Z., and Kaufman, T. C. (2004). Expression patterns of the rogue Hox genes Hox3/zen and fushi tarazu in the apterygote insect Thermobia domestica. Evol. Dev. 6, 393–401. doi: 10.1111/j.1525-142X.2004.04048.x
Ikeda, K. T., Hirose, Y., Hiraoka, K., Noro, E., Fujishima, K., Tomita, M., et al. (2015). Identification, expression, and molecular evolution of microRNAs in the “living fossil” Triops cancriformis (tadpole shrimp). RNA 21, 230–242. doi: 10.1261/rna.045799.114
Jaramillo, M. L., Ammar, D., Quispe, R. L., Bonatto Paese, C. L., Gruendling, A. P., Müller, Y. M., et al. (2022). Identification of Hox genes and their expression profiles during embryonic development of the emerging model organism, Macrobrachium olfersii. J. Exp. Zool. B Mol. Dev. Evol. 338, 292–300. doi: 10.1002/jez.b.23118
Jeffery, N. (2015). Genome size diversity and evolution in the Crustacea. Doctoral dissertation. University of Guelph.
Jo, E., Cho, Y. H., Lee, S. J., Choi, E., Kim, J., Kim, J. H., et al. (2021). Genome survey and microsatellite motif identification of Artemia franciscana. Biosci. Rep. 41, 1–6. doi: 10.1042/BSR20210824
Katoh, K., and Standley, D. M. (2013). MAFFT multiple sequence alignment software version 7: improvements in performance and usability. Mol. Biol. Evol. 30, 772–780. doi: 10.1093/molbev/mst010
Kenny, N. J., Chan, K. W., Nong, W., Qu, Z., Maeso, I., Yip, H. Y., et al. (2016). Ancestral whole-genome duplication in the marine chelicerate horseshoe crabs. Heredity 116, 190–199. doi: 10.1038/hdy.2015.89
Kim, D., Jeong, H., Kim, M., Kim, S., Souissi, S., Park, H. G., et al. (2021). Identification and characterization of homeobox gene clusters in harpacticoid and calanoid copepods. J. Exp. Zool. B Mol. Dev. Evol. 338, 215–224. doi: 10.1002/jez.b.23112
Kim, D. H., Lee, B. Y., Kim, H. S., Jeong, C. B., Hwang, D. S., Kim, I. C., et al. (2018). Identification and characterization of homeobox (Hox) genes and conservation of the single Hox cluster (324.6 kb) in the water flea Daphnia magna. J. Exp. Zool. B Mol. Dev. Evol. 330, 76–82. doi: 10.1002/jez.b.22793
Kishino, H., and Hasegawa, M. (1989). Evaluation of the maximum likelihood estimate of the evolutionary tree topologies from DNA sequence data, and the branching order in Hominoidea. J. Mol. Evol. 29, 170–179. doi: 10.1007/BF02100115
Kosakovsky Pond, S. L., Frost, S. D. W., and Muse, S. V. (2005). HyPhy: hypothesis testing using phylogenies. Bioinformatics 21, 676–679. doi: 10.1007/0-387-27733-1_6
Lemons, D., and McGinnis, W. (2006). Genomic evolution of Hox gene clusters. Science 313, 1918–1922. doi: 10.1126/science.1132040
Lidgard, S., and Love, A. C. (2018). Rethinking living fossils. Bioscience 68, 760–770. doi: 10.1093/biosci/biy084
Lindholm, M. (2014). Morphologically conservative but physiologically diverse: the mode of stasis in Anostraca (Crustacea: Branchiopoda). Evol. Biol. 41, 503–507. doi: 10.1007/s11692-014-9283-6
Liu, Q., Onal, P., Datta, R. R., Rogers, J. M., Schmidt-Ott, U., Bulyk, M. L., et al. (2018). Ancient mechanisms for the evolution of the bicoid homeodomain’s function in fly development. elife 7:e34594. doi: 10.7554/eLife.34594
Luchetti, A., Forni, G., Martelossi, J., Savojardo, C., Martelli, P. L., Casadio, R., et al. (2021). Comparative genomics of tadpole shrimps (Crustacea, Branchiopoda, Notostraca): dynamic genome evolution against the backdrop of morphological stasis. Genomics 113, 4163–4172. doi: 10.1016/j.ygeno.2021.11.001
Mathers, T. C., Hammond, R. L., Jenner, R. A., Hänfling, B., and Gómez, A. (2013). Multiple global radiations in tadpole shrimps challenge the concept of ‘living fossils’. PeerJ 1:e62. doi: 10.7717/peerj.62
Mouchel-Vielh, E., Blin, M., Rigolot, C., and Deutsch, J. S. (2002). Expression of a homologue of the fushi tarazu (ftz) gene in a cirripede crustacean. Evol. Dev. 4, 76–85. doi: 10.1046/j.1525-142X.2002.01063.x
Nguyen, L. T., Schmidt, H. A., von Haeseler, A., and Minh, B. Q. (2015). IQ-TREE: a fast and effective stochastic algorithm for estimating maximum-likelihood phylogenies. Mol. Biol. Evol. 32, 268–274. doi: 10.1093/molbev/msu300
Pace, R. M., Grbić, M., and Nagy, L. M. (2016). Composition and genomic organization of arthropod Hox clusters. EvoDevo 7:11. doi: 10.1186/s13227-016-0048-4
Papillon, D., and Telford, M. J. (2007). Evolution of Hox3 and ftz in arthropods: insights from the crustacean Daphnia pulex. Dev. Genes Evol. 217, 315–322. doi: 10.1007/s00427-007-0141-8
Pick, L. (2016). Hox genes, evo-devo, and the case of the ftz gene. Chromosoma 125, 535–551. doi: 10.1007/s00412-015-0553-6
Pick, L., and Heffer, A. (2012). Hox gene evolution: multiple mechanisms contributing to evolutionary novelties. Ann. N. Y. Acad. Sci. 1256, 15–32. doi: 10.1111/j.1749-6632.2011.06385.x
Rice, P., Longden, I., and Bleasby, A. (2000). EMBOSS: the European molecular biology open software suite. Trends Genet. 16, 276–277. doi: 10.1016/S0168-9525(00)02024-2
Robinson-Rechavi, M., and Huchon, D. (2000). RRTree: relative-rate tests between groups of sequences on a phylogenetic tree. Bioinformatics 16, 296–297. doi: 10.1093/bioinformatics/16.3.296
Rozewicki, J., Li, S., Amada, K. M., Standley, D. M., and Katoh, K. (2019). MAFFT-DASH: integrated protein sequence and structural alignment. Nucleic Acids Res. 47, W5–W10. doi: 10.1093/nar/gkz342
Savojardo, C., Luchetti, A., Martelli, P. L., Casadio, R., and Mantovani, B. (2019). Draft genomes and genomic divergence of two Lepidurus tadpole shrimp species (Crustacea, Branchiopoda, Notostraca). Mol. Ecol. Resour. 19, 235–244. doi: 10.1111/1755-0998.12952
Schwentner, M., Combosch, D. J., Nelson, J. P., and Giribet, G. (2017). A phylogenomic solution to the origin of insects by resolving crustacean-hexapod relationships. Curr. Biol. 27, 1818–1824.e5. doi: 10.1016/j.cub.2017.05.040
Schwentner, M., Richter, S., Rogers, D. C., and Giribet, G. (2018). Tetraconatan phylogeny with special focus on malacostraca and Branchiopoda: highlighting the strength of taxon-specific matrices in phylogenomics. Proc. R. Soc. Lond. B Biol. Sci. 285:20181524. doi: 10.1098/rspb.2018.1524
Shingate, P., Ravi, V., Prasad, A., Tay, B. H., Garg, K. M., Chattopadhyay, B., et al. (2020). Chromosome-level assembly of the horseshoe crab genome provides insights into its genome evolution. Nat. Commun. 11, 2322–2313. doi: 10.1038/s41467-020-16180-1
Slater, G. S. C., and Birney, E. (2005). Automated generation of heuristics for biological sequence comparison. BMC Bioinformatics 6, 1–11. doi: 10.1186/1471-2105-6-31
Smith, M. D., Wertheim, J. O., Weaver, S., Murrell, B., Scheffler, K., and Kosakovsky Pond, S. L. (2015). Less is more: an adaptive branch-site random effects model for efficient detection of episodic diversifying selection. Mol. Biol. Evol. 32, 1342–1353. doi: 10.1093/molbev/msv022
Stauber, M., Jäckle, H., and Schmidt-Ott, U. (1999). The anterior determinant bicoid of drosophila is a derived Hox class 3 gene. PNAS 96, 3786–3789. doi: 10.1073/pnas.96.7.3786
Stauber, M., Prell, A., and Schmidt-Ott, U. (2002). A single Hox3 gene with composite bicoid and zerknüllt expression characteristics in non-Cyclorrhaphan flies. PNAS 99, 274–279. doi: 10.1073/pnas.012292899
Suno-Uchi, N., Sasaki, F., Chiba, S., and Kawata, M. (1997). Morphological stasis and phylogenetic relationships in tadpole shrimps, Triops (Crustacea: Notostraca). Biol. J. Linn. Soc. Lond. 61, 439–457. doi: 10.1111/j.1095-8312.1997.tb01801.x
Suyama, M., Torrents, D., and Bork, P. (2006). PAL2NAL: robust conversion of protein sequence alignments into the corresponding codon alignments. Nucleic Acids Res. 34, W609–W612. doi: 10.1093/nar/gkl315
Taylor, J. S., Braasch, I., Frickey, T., Meyer, A., and Van de Peer, Y. (2003). Genome duplication, a trait shared by 22,000 species of ray-finned fish. Genome Res. 13, 382–390. doi: 10.1101/gr.640303
Wertheim, J. O., Murrell, B., Smith, M. D., Kosakovsky Pond, S. L., and Scheffler, K. (2015). RELAX: detecting relaxed selection in a phylogenetic framework. Mol. Biol. Evol. 32, 820–832. doi: 10.1093/molbev/msu400
Wu, R., Liu, Q., Meng, S., Zhang, P., and Liang, D. (2015). Hox cluster characterization of Banna caecilian (Ichthyophis bannanicus) provides hints for slow evolution of its genome. BMC Genomics 16, 468–414. doi: 10.1186/s12864-015-1684-0
Keywords: Branchiopoda, evolutionary rates, Hox genes, living fossils, molecular evolution, positive selection, tadpole shrimps
Citation: Nicolini F, Martelossi J, Forni G, Savojardo C, Mantovani B and Luchetti A (2023) Comparative genomics of Hox and ParaHox genes among major lineages of Branchiopoda with emphasis on tadpole shrimps. Front. Ecol. Evol. 11:1046960. doi: 10.3389/fevo.2023.1046960
Edited by:
Scott Lidgard, Field Museum, United StatesReviewed by:
Ariel D. Chipman, Hebrew University of Jerusalem, IsraelLudwik Gasiorowski, Max Planck Institute for Multidisciplinary Sciences, Germany
Copyright © 2023 Nicolini, Martelossi, Forni, Savojardo, Mantovani and Luchetti. This is an open-access article distributed under the terms of the Creative Commons Attribution License (CC BY). The use, distribution or reproduction in other forums is permitted, provided the original author(s) and the copyright owner(s) are credited and that the original publication in this journal is cited, in accordance with accepted academic practice. No use, distribution or reproduction is permitted which does not comply with these terms.
*Correspondence: Filippo Nicolini, ✉ filippo.nicolini6@unibo.it; Andrea Luchetti, ✉ andrea.luchetti@unibo.it