Spatiotemporal relationship characteristic of climate comfort of urban human settlement environment and population density in China
 Dahao Zhang
 Chunshan Zhou
 Yi Zhou
 Bahram Zikirya
- 1School of Geography and Planning, Sun Yat-sen University, Guangzhou, China
- 2College of Tourism, Xinjiang University, Ürümqi, China
- 3Key Laboratory of the Sustainable Development of Xinjiang’s Historical and Cultural Tourism, Xinjiang University, Ürümqi, China
Rapid urbanization in China has caused substantial changes in the urban climate, leading to accelerated shifts in the climate comfort of the human settlement environment. In addition, in certain regions of China, a glaring disproportion exists in the distribution of population to the available area. Therefore, the climate comfort of such areas needs to be improved to enhance their habitability. In this study, we explored the spatiotemporal evolution characteristics of the climate comfort of the urban human settlement environment in China from 2000 to 2015, based on a three-level time scale of year, month, and day using the temperature and humidity index and wind efficiency index. In addition, the population density in China was calculated by employing the population grid spatial calculation method. Subsequently, we compared and analyzed the spatiotemporal relationship characteristics between the climate comfort of the urban human settlement environment and population density. Our results indicated that (1) the extremely cold area was the largest, followed by the cold area, with the comfort area being the smallest. The area range of climate comfort and cold expanded northward, whereas the extremely cold area shrank from 2000 to 2015. (2) The duration of the comfort month and comfort day in southern China was higher than that in northern China. The climate comfort area of 3–4 months was the largest, and that of 7–12 months was the smallest, with the largest climate comfort area being 66–130 days and the smallest being 196–325 days. (3) The spatial difference in the climate comfort month was greater than that in the daily change, and the evolution process of various regions became relatively complex over time. The spatiotemporal evolution of the climate comfort day showed minimal change in northwest, north, and northeast China, whereas it changed significantly in southwest, south, central, and east China. These results imply that the population density in the country is generally concentrated in the climate comfort areas.
Introduction
Since the 20th century, rapid advances in urbanization in China has led to a fundamental change in the urban climate, with the emergence of extreme weather accelerating shifts in the climate comfort of the human settlement environment (Yang et al., 2020; Yu et al., 2022). Climate change is an important element in the natural system of the human settlement environment and fundamentally affects the climate comfort of the environment. Climate comfort refers to the level of comfort—experienced by healthy humans—provided by climatic factors, such as temperature, humidity, wind speed, and sunshine, without the aid of temperature control devices or sunscreen. The habitability of an area increases with greater climate comfort. Along with continuous improvement in the quality of life, people have become more aware of the climate comfort of living in cities, implying that this aspect has become an important standard for choosing a place of residence (Stathopoulos et al., 2004; Dulal and Akbar, 2013).
Currently, research on the climate comfort of human settlement mainly includes the following aspects: (1) The spatial characteristics of the comfort degree of the tourism climate and the effects on tourism development; generally, such research includes analysis of temporal change in climate comfort based on the temperature and humidity index, wind chill, and dressing index of a tourism city (Li and Zhong, 2005; Ma et al., 2010, 2011; Cao et al., 2012); exploring the spatial layout characteristics of the tourism climate comfort degree by the tourism climate index (TCI) (Masoudi, 2021); applying geographic information system (GIS) technology to partition and evaluate the potential of ecotourism in the climate comfort area (Esmael et al., 2014); and evaluation of the influence of climate comfort on convalescence tourism and tourism activities (Amininia et al., 2020; Adiguzel et al., 2022). (2) The effect of natural elements and human activities on the climate comfort of the human settlement environment, including exploring the effects of the spatial layout of meteorology (Areti et al., 2010; Luo et al., 2021; Ren et al., 2022), river (Amorosi et al., 2013), vegetation (Maria et al., 2019; Du et al., 2020), and residential area (Liu et al., 2019). (3) Spatiotemporal analysis and evaluation of climate comfort of the human settlement environment, including measuring climate comfort by employing the climate comfort index and analyzing the spatial characteristics of climate comfort (Cao et al., 2019), as well as exploring the spatial difference characteristics of climate comfort in China based on the multiple phase scale (Kong, 2020). Furthermore, the thermal environment of rural areas has also been simulated using ArcGIS [environmental systems research institute (ESRI), United States] and the environment for visualizing images (ENVI) (L3Harris Geospatial, United States) software to evaluate climate comfort (Fan et al., 2021).
Related research on the effects of climate change on humans mainly includes (1) the effect of climate change on the spatial distribution of the population, such as exploring the dynamic relationship between climate change and population migration and conducting spatial modeling of this relationship (Alisson et al., 2010; Michael, 2018), for example, heavy rain to explore the effect of exposure to extreme weather on the spatial layout of human spaces (Liao et al., 2019). (2) The effects of climate change on human health by exploring such effects, for example, on the health of the elderly population through a literature survey (Chen et al., 2020), and analyzing the effect of increasing temperature on the number of diseases among the population (Pottier et al., 2021). (3) Human thermal perception of urban temperature, for example, by analyzing the thermal perception of the urban climate and the comfort levels of residents from both indoor and outdoor space dimensions (Cohen et al., 2013; Pantavou et al., 2013; Salata et al., 2016; Lai et al., 2021).
Current research on the climate comfort of the human settlement environment focuses on the spatiotemporal distribution and evaluation of climate comfort, influence of individual environmental factors on climate comfort, tourism climate comfort, and the number of tourists. Research on the correlation between climate and humans focuses on the effect of climate change on the distribution of the population, their health, and environmental heat perception. However, few studies have explored the relationship between climate comfort and population density.
In comparison with existing research, our study introduces improvements in terms of the research scale and research perspective. We consider investigation of the spatiotemporal relationship between climate comfort and population density not only beneficial to improving resident perception of the climatic environment but also essential to reasonably predicting the spatial feature of population density (Smirnov et al., 2016). In view of the aforementioned discussion, with China as the study object and combining the temperature and humidity index with the wind efficiency index, we evaluated the climate comfort of the human settlement environment during 2000–2015, and we explored the spatiotemporal relationship between climate comfort and population density. This study not only enriches the related theory about the human settlement environment but also provides useful reference to improve the livability of the Chinese urban human settlement environment (Zhang et al., 2022).
Data sources and research methods
Overview of the study area
China has a vast territory, spanning multiple temperature zones and dry and wet areas, and is characterized by a complicated terrain between the east and west, leading to complex and diverse climate types. Moreover, China has a population of 1.4 billion in 2022, which makes it the most populous country in the world. Therefore, China is a good example to explore spatiotemporal relationship characteristics of the climate comfort of the human settlement environment and population density (Figure 1). We divided China into seven regions and explored the spatiotemporal relationship characteristic of climate comfort of the urban human settlement environment and population density based on the prefecture-level city regional scale (Table 1).
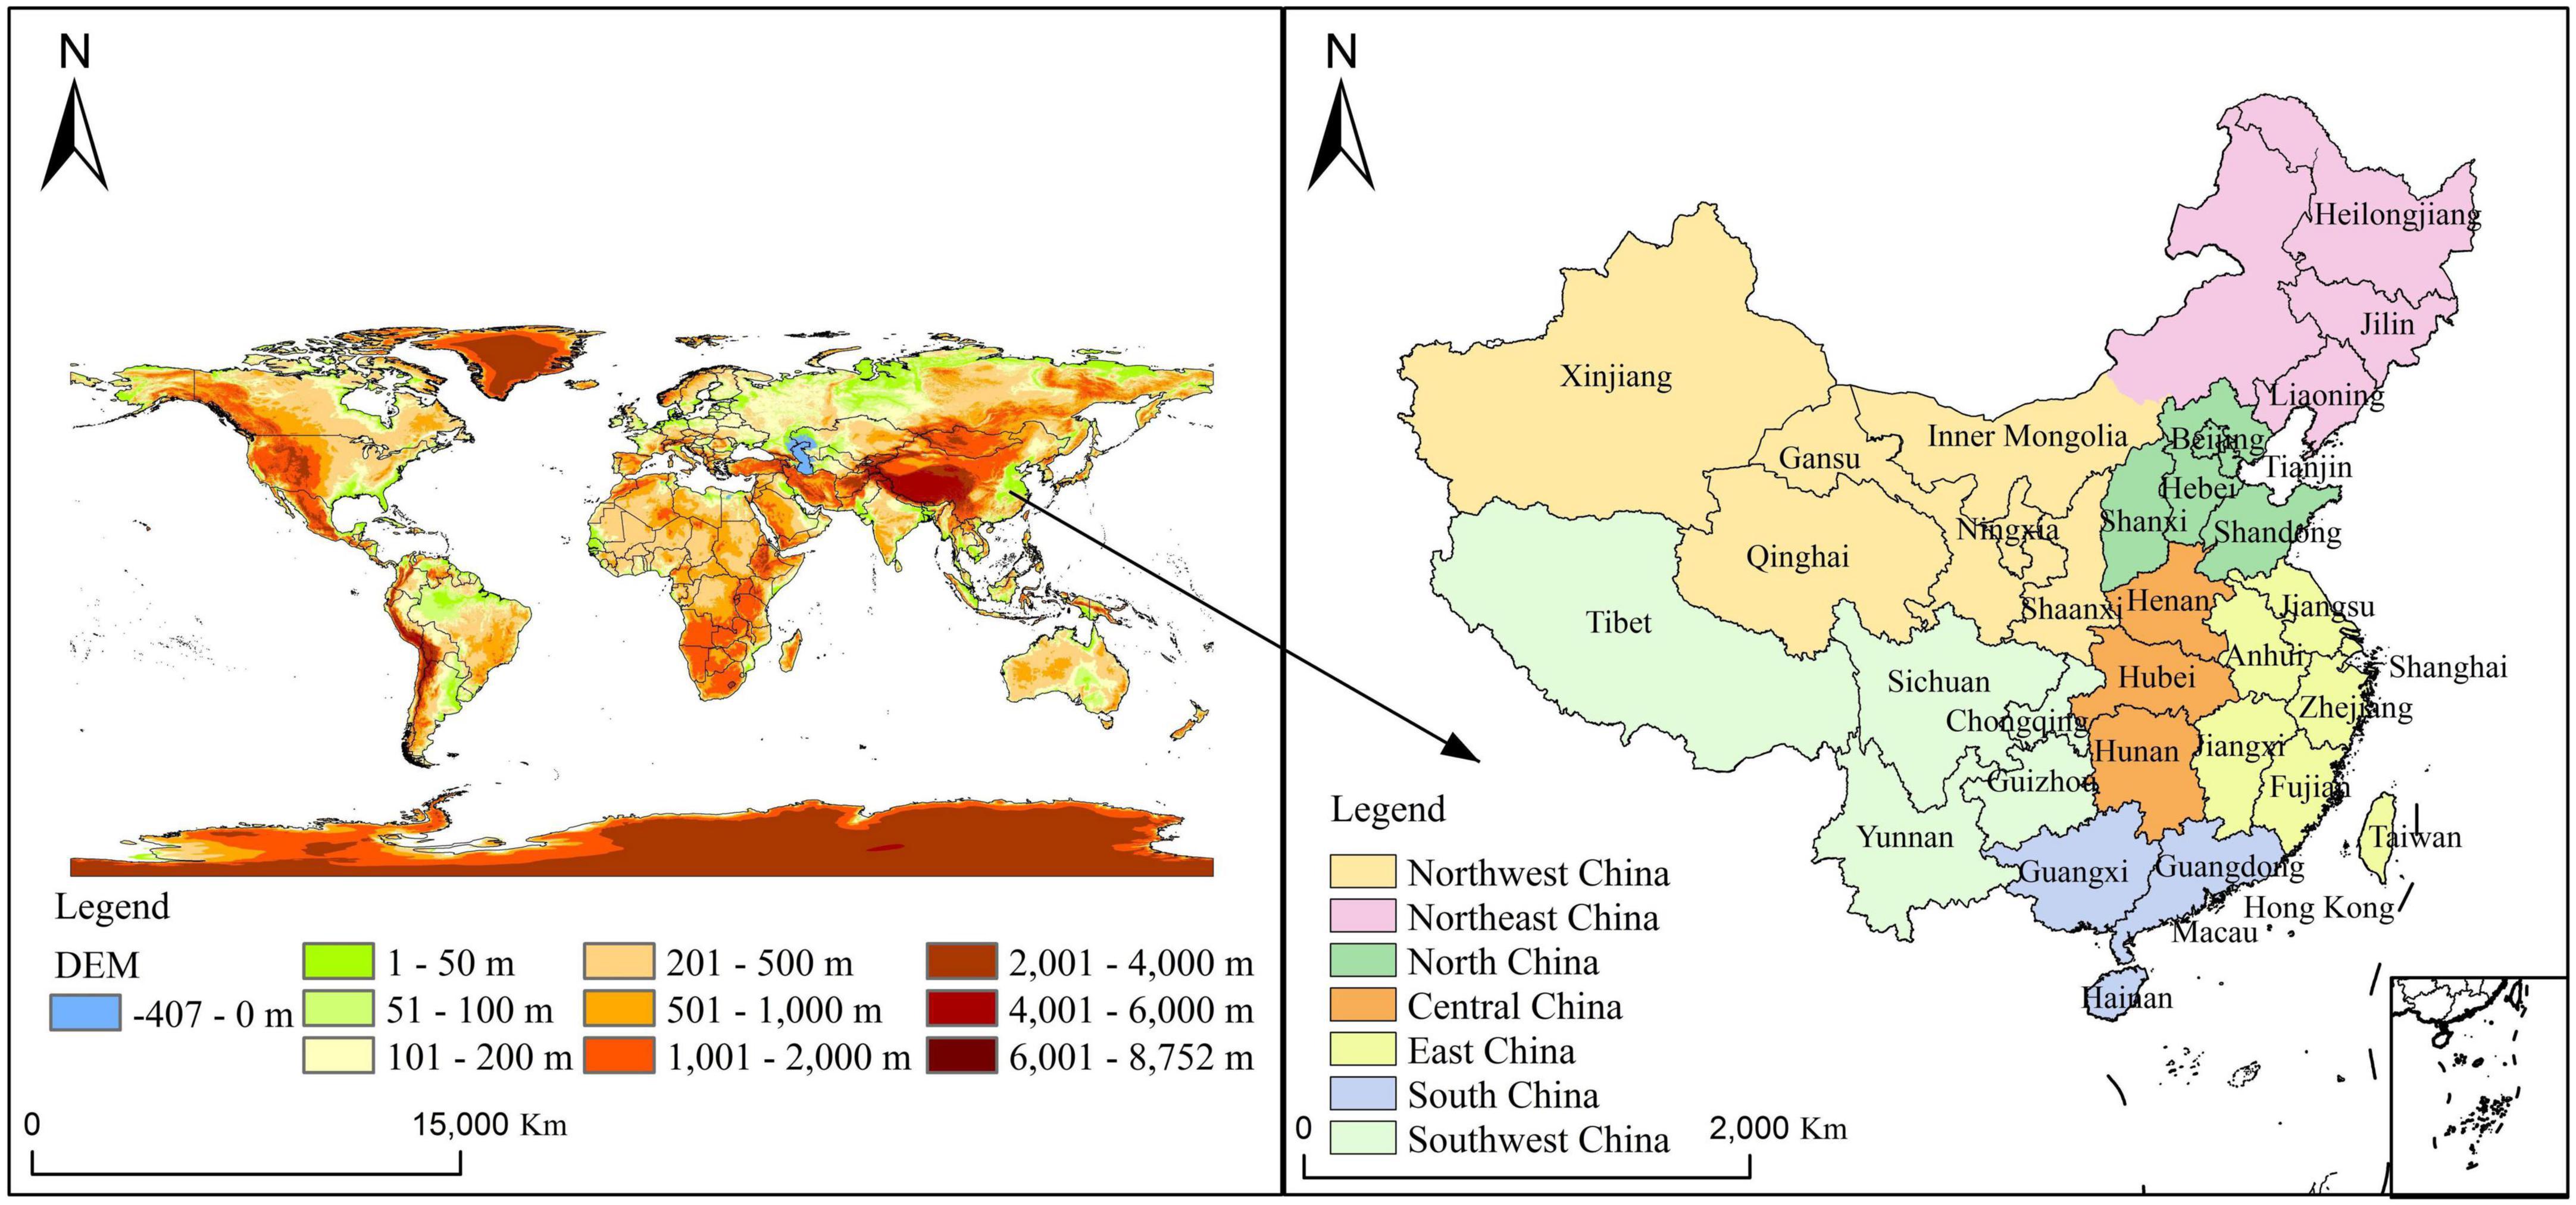
Figure 1. Location of study area.
Table 1. Regional classification of China.
Data source and processing
The data employed in this study mainly include data derived from the China ground climate, that is, the daily value dataset (V3.0 processing and generation), China population spatial distribution kilometer grid dataset, digital elevation model (DEM), and administrative division information. The China ground climate dataset mainly includes daily data from 2000 to 2015 on the wind speed, humidity, precipitation, temperature, sunshine, station number, and longitude and latitude of 824 benchmark meteorological stations in China, and derives from the China Meteorological Data Service Center.1 First, the data were cleaned, followed by the show point and projection, and the daily data were interpolated spatially by the inverse distance weight method. Finally, the data were divided and spliced according to administrative division to obtain the daily data for provinces and cities, as well as the average daily data of meteorological elements in different years and months to obtain the yearly and monthly data of the different regions.
The China population spatial distribution kilometer grid dataset reflects the detailed spatial distribution of population data in China. The dataset is based on county demographic data and comprehensively considers factors closely related to population, such as land-use type, night light brightness, residential density, and similar. The basic statistical unit is the administrative region, and the multi-factor weight allocation method is employed to spread the population data to the spatial grid, thereby achieving the spatialization of the population. The data format is grid data, with each grid representing the population within a grid range (1 km2), with the unit being person/km2. The data are based on the Krassovsky ellipsoid, and the projection function is Albers projection (Xu, 2017). The dataset derives from the Resource and Environment Sciences and Data Center of the Chinese Academy of Sciences2 (DATA ID = 333). The global DEM elevation data at 1 km resolution are published by the U.S. National Oceanic and Atmospheric Administration (NOAA).3 The administrative division data derive from the Resources and Environment Sciences and Data Center of the Chinese Academy of Sciences (see text footnote 2; DATA ID = 333) (Table 2).
Table 2. Data sources and description.
Research methodology
Temperature and humidity index
The temperature and humidity index refers to an index of the human body’s comprehensive perception of ambient temperature and humidity, calculated as follows (National Standardization Administration, 2012):
where I is the temperature and humidity index, retain 1 decimal place; T is the average temperature of a certain evaluation period; unit is degree Celsius (°C); and RH is the average air relative humidity during an evaluation period (%).
Wind efficiency index
This refers to an index of comprehensively perceiving wind, temperature, and sunshine. The calculation formula of wind efficiency index K is as follows:
where K is the wind efficiency index, taken as an integer; T is the average temperature of a certain evaluation period, measured in degree Celsius (°C); V is the average wind speed in meter per second (m/s); and S is the average sunshine hours during an evaluation period, measured in time per day (h/day).
Generally, an evaluation method combining the temperature and humidity index and the wind efficiency index is used to evaluate climate comfort. When the two indices are inconsistent, the wind efficiency index is used in the cold (winter) half-year, and the temperature and humidity index in the hot (summer) half-year. The wind efficiency index is used when the average wind speed exceeds 3 m/s during the evaluation period. March to May is considered as spring, June to August as summer, September to November as autumn, and December to February as winter. A high temperature and humidity index and wind efficiency index indicate a relatively sultry human settlement climate, whereas a low temperature and humidity index and wind efficiency index indicate an extremely cold human settlement climate. The only comfortable human settlement climate is a moderate temperature and humidity index and wind efficiency index (Table 3).

Table 3. Classification of climate comfort degree of human settlement environment.
Population grid space calculation method
During data processing of the population spatial distribution kilometer grid, various factors were calculated first, namely, the weights of land-use type, night light brightness, and residential density of the population distribution. The total weight of each county-level administrative unit was calculated based on the effects of the weight standardization treatment of the aforementioned three aspects and, subsequently, based on the calculation of the proportion of population of each county-level administrative unit weight. Using grid space calculation, the population number on unit weight was combined with the total weight distribution map to spatialize the population. The calculation formula is as follows:
where POPij is the steric grid cell value; POP is the population demographic value of the county-level administrative unit where the grid unit is located; Qij is the total weight of the land-use type, night light brightness, and the settlement density; and Q is the total weight of the land-use type, night light brightness, and settlement density of the county administrative unit where the grid unit is located. Finally, the population spatial distribution data of the 1-km grid were obtained employing the aforementioned method.
Results
Human settlement climate comfort yearly change
The annual climate comfort degrees of China are mainly extremely cold, cold, and comfortable, among which the area range of extremely cold was the largest, followed by cold, with comfortable being the smallest. From the perspective of the spatial layout characteristics of the annual human settlement climate comfort degree in 2015, the climate comfort areas were distributed mainly in south China and the southern part of east China; the eastern, central, and southern parts of southwest China; and southern central China. The areas with an annual cold human settlement climate were distributed mainly in the north of east China, central and north parts of central China, north and central parts of southwest China, the south of northwest China, and the south of north China. The areas with annual extremely cold human settlement climate were distributed mainly in northeast China; northwest China, except for the southern part of Shaanxi Province; the central and north parts of north China; and the western part of southwest China.
From the perspective of the annual change characteristics of the degree of human settlement climate comfort in China, the range of human settlement climate comfort and cold expanded northward from 2000 to 2015, whereas that of extremely cold shrank. The human settlement climate comfort area in southwest China (southwest of Guizhou Province and east of Sichuan Province) and central China (Hunan Province) apparently expanded northward, as well as the cold area in north China (Shandong Province) (Figure 2).
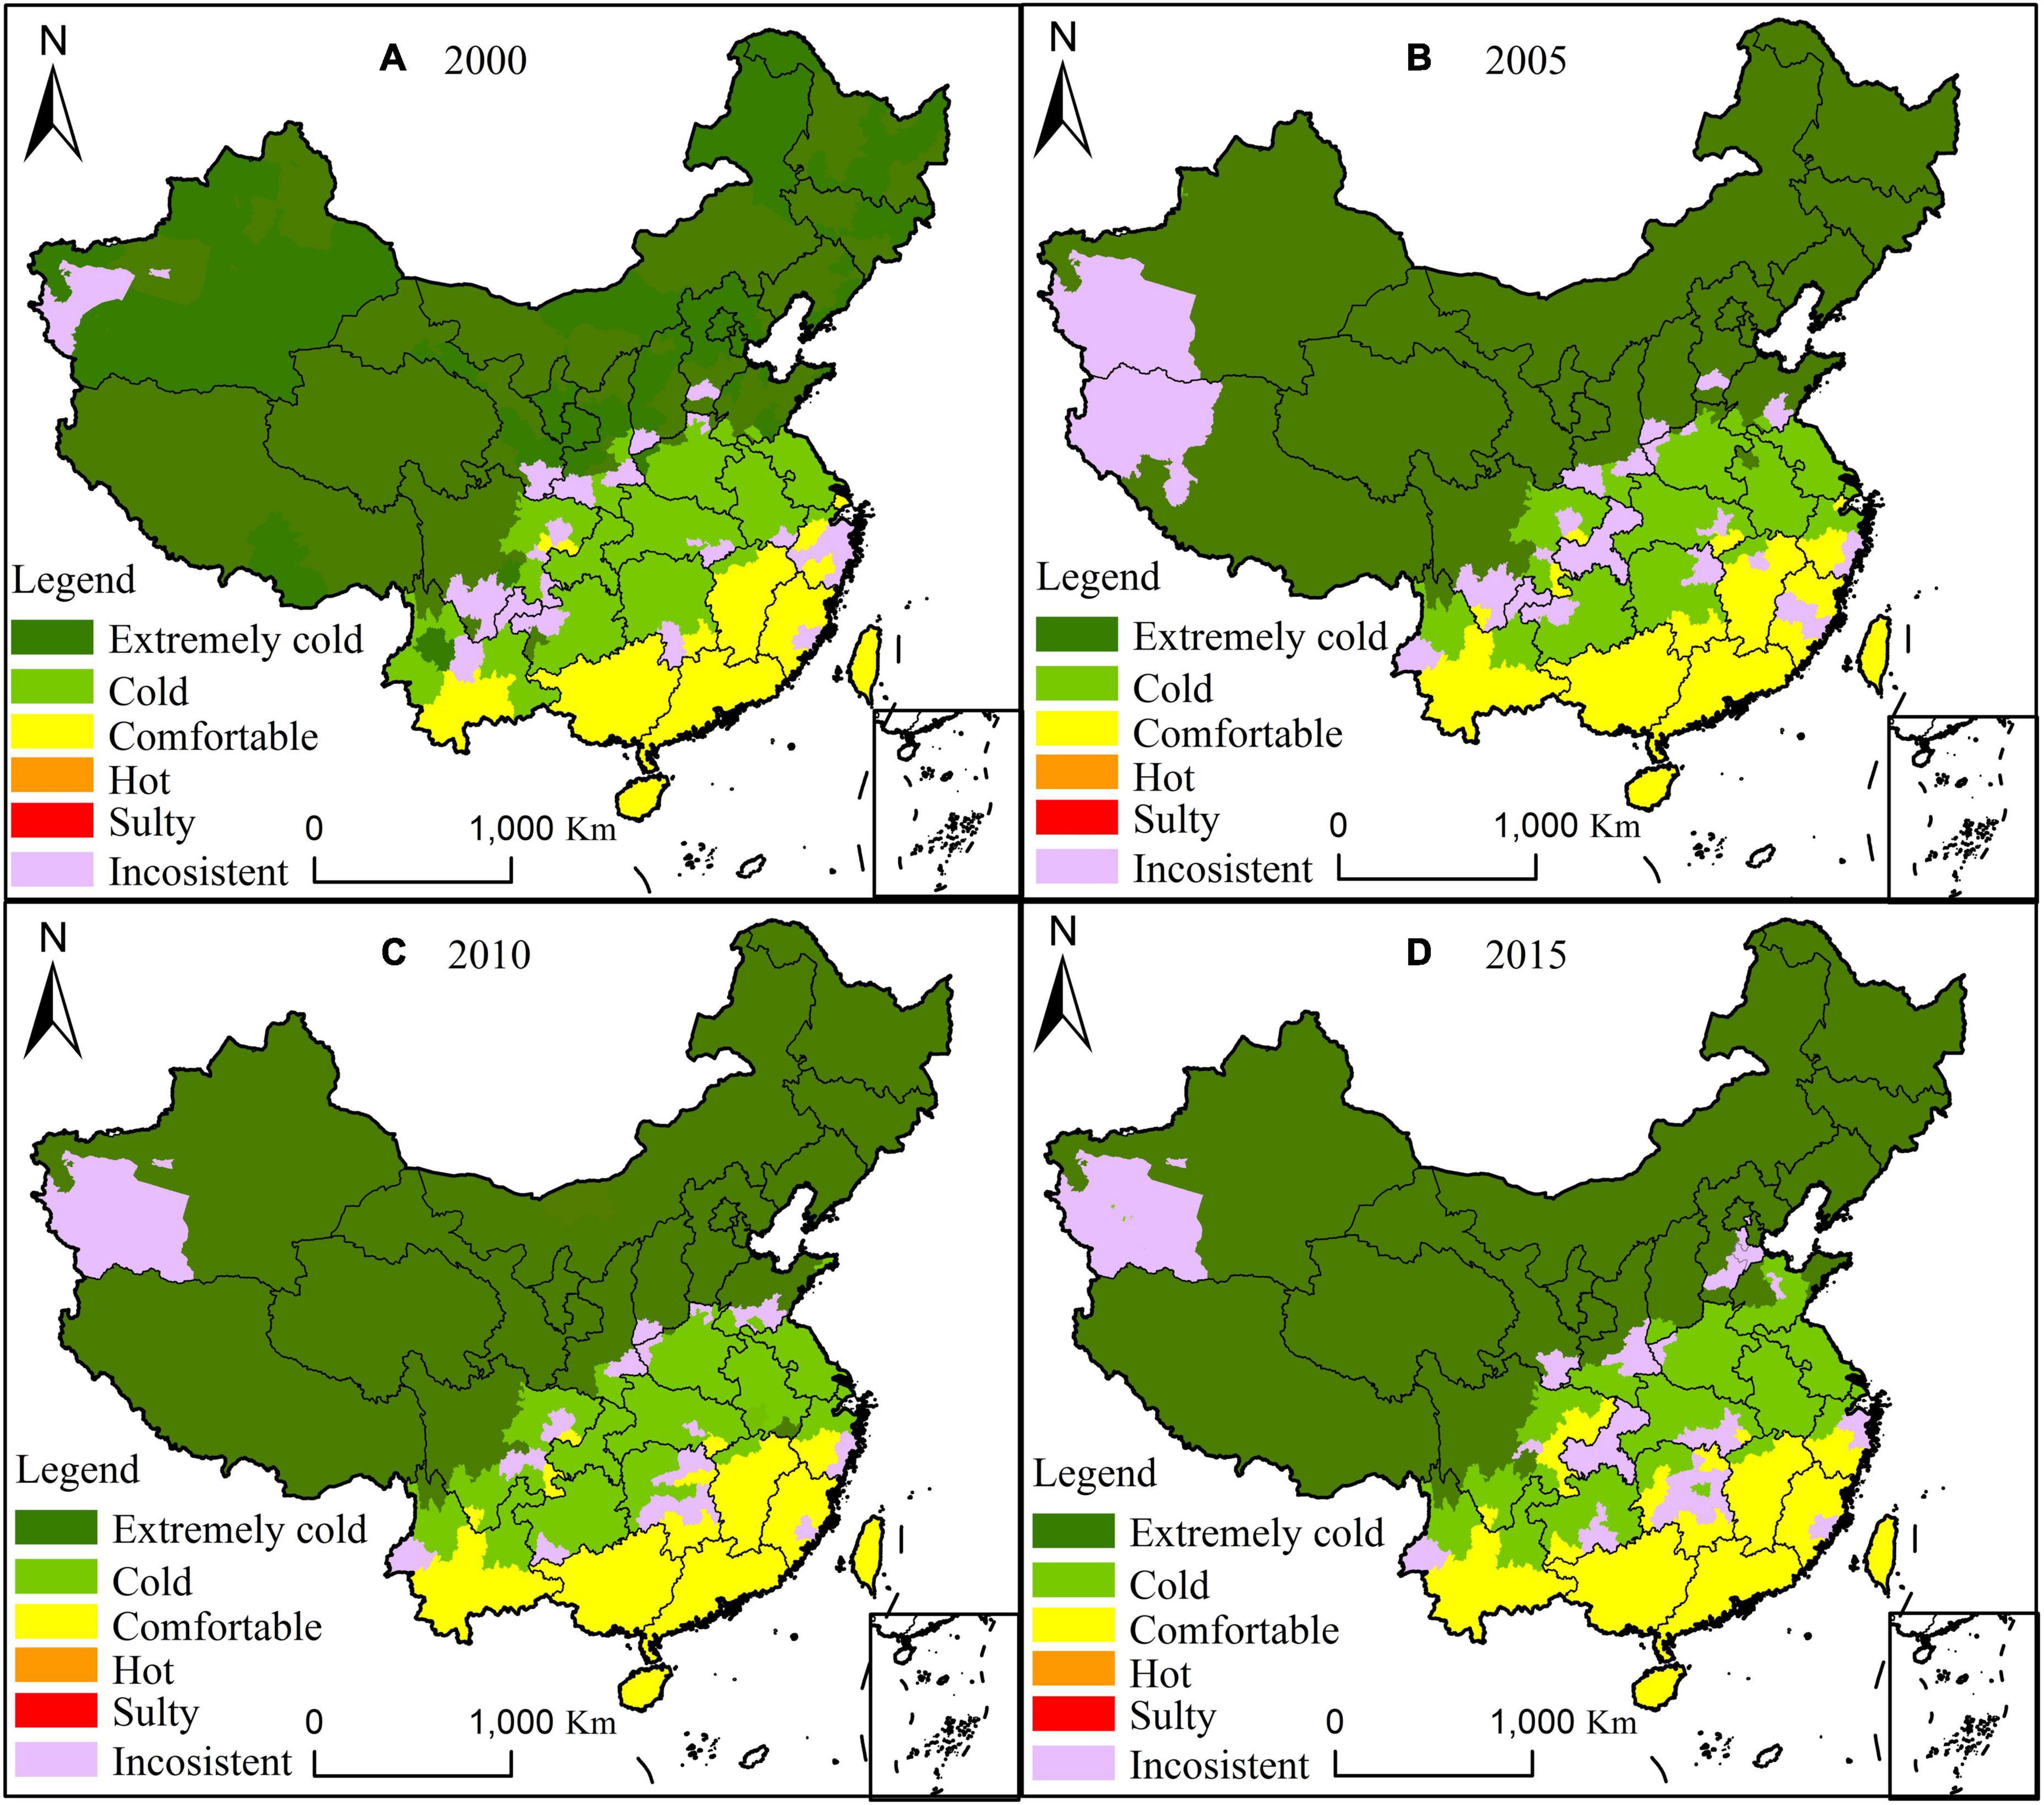
Figure 2. Annual change in climate comfort of human settlement environment in China from 2000 to 2015.
Human settlement climate comfort monthly change
From the perspective of the comfort month of the human settlement climate in China, the duration of the comfort month in southern China was generally longer than that in northern China. Using the equal interval method in ArcGIS 10.2, the duration of the comfort months was classified into six levels (0–2, 3–4, 5–6, 7–8, 9–10, and 11–12) based on the number of comfort months. The region representing 3–4 months of comfort was the largest, followed by regions representing 0–2 months and 5–6 months of comfort. The smallest region was that of 7–12 months of comfort. In 2015, the areas with long comfort months (7–12) of human settlement climate comfort were distributed mainly in the south and east of southwest China, south and west of south China, and the south of east China. Areas with short human settlement comfort months (0–2) were distributed mainly in the west of southwest China, central and southwest of northwest China, and north of northeast China.
From the perspective of the annual change characteristics of the comfort duration months, these characteristics differed from 2000 to 2015. The comfort duration months in the west and north of northwest China decreased, and those of northeast China decreased in the north and increased in the south, as well as those in central China. The comfort month duration in north China showed a trend of the east increasing first, then decreasing, and then increasing again, and the west increasing first and then decreasing. The comfort month in all provinces in east China showed a trend of decreasing first and then increasing, whereas that in the north of south China showed a trend of increasing first, then decreasing, and subsequently increasing. The southern part of south China was characterized by a trend of decreasing first and then increasing. The change in the comfort months in southwest China was relatively complex, but the comfort months of the human settlement climate in the west did not change significantly. In the east of southwest China, Chongqing city showed a trend of decreasing first and then increasing, whereas Guizhou Province showed a trend of increasing first and then decreasing. Yunnan Province in the southern part of southwest China showed characteristics of decreasing in the east and increasing in the west (Figure 3).

Figure 3. Monthly change in human settlement climate comfort in China from 2000 to 2015.
Human settlement climate comfort daily change
From the perspective of the daily change in the human settlement climate comfort, the comfort days in southern China were generally greater in number than those in the north. Using the equal interval method in ArcGIS 10.2, the duration of the comfort days was classified into five levels (i.e., 0–65, 66–130, 131–195, 196–260, and 261–325) based on the number of comfort days. The range area of 66–130 annual comfort days was the largest, followed by 0–65 and 131–195 days, with the range area of 196–325 annual comfort days being the smallest. In 2015, the areas with 261–325 comfort days and 196–260 comfort days were distributed mainly in the south of southwest China and the west of south China. Areas with a moderately comfortable daily duration (131–195 days) were distributed mainly in most parts of east China, south China, and central China, as well as the central and eastern regions of southwest China, the south of north China, and the south of northwest China. Areas with fewer human settlement climate comfort days (66–130 days) were distributed mainly in northeast China and most parts of northwest China and north China. The areas with the least human settlement climate comfort days (0–65 days) were distributed mainly in the west of southwest China and southwest of northwest China.
From the perspective of the annual change characteristics of comfort days from 2000 to 2015, comfort days varied in the different regions, being relatively minor in northwest, northeast, and north China, but substantial in central, southwest, south, and east China. The duration of comfort days in the Xinjiang Uygur Autonomous Region in northwest China first increased and then decreased, that in the north of northeast China increased, but in northwest and northeast China, the changes were not significant. The duration of comfort days in the west of the southwest region changed less, whereas that in the central, southern, and eastern parts of the southwest regions changed significantly. The comfort days increased in the south of the southwest regions, but those in the east of the southwest regions decreased first and then increased, whereas the comfort days first increased and then decreased in the center of the southwest regions. No significant change was observed in the northern part of north China, but the comfort days in the southern part of north China increased. The comfort days in the middle of south China showed a trend of first decreasing and then increasing, whereas those in the western region increased, but in the southern region, they first decreased and then increased. The trend in the south of Guangdong Province first showed a decreasing trend, followed by an increase and a subsequent decrease. In both east and central China, these days first decreased and then increased (Figure 4).
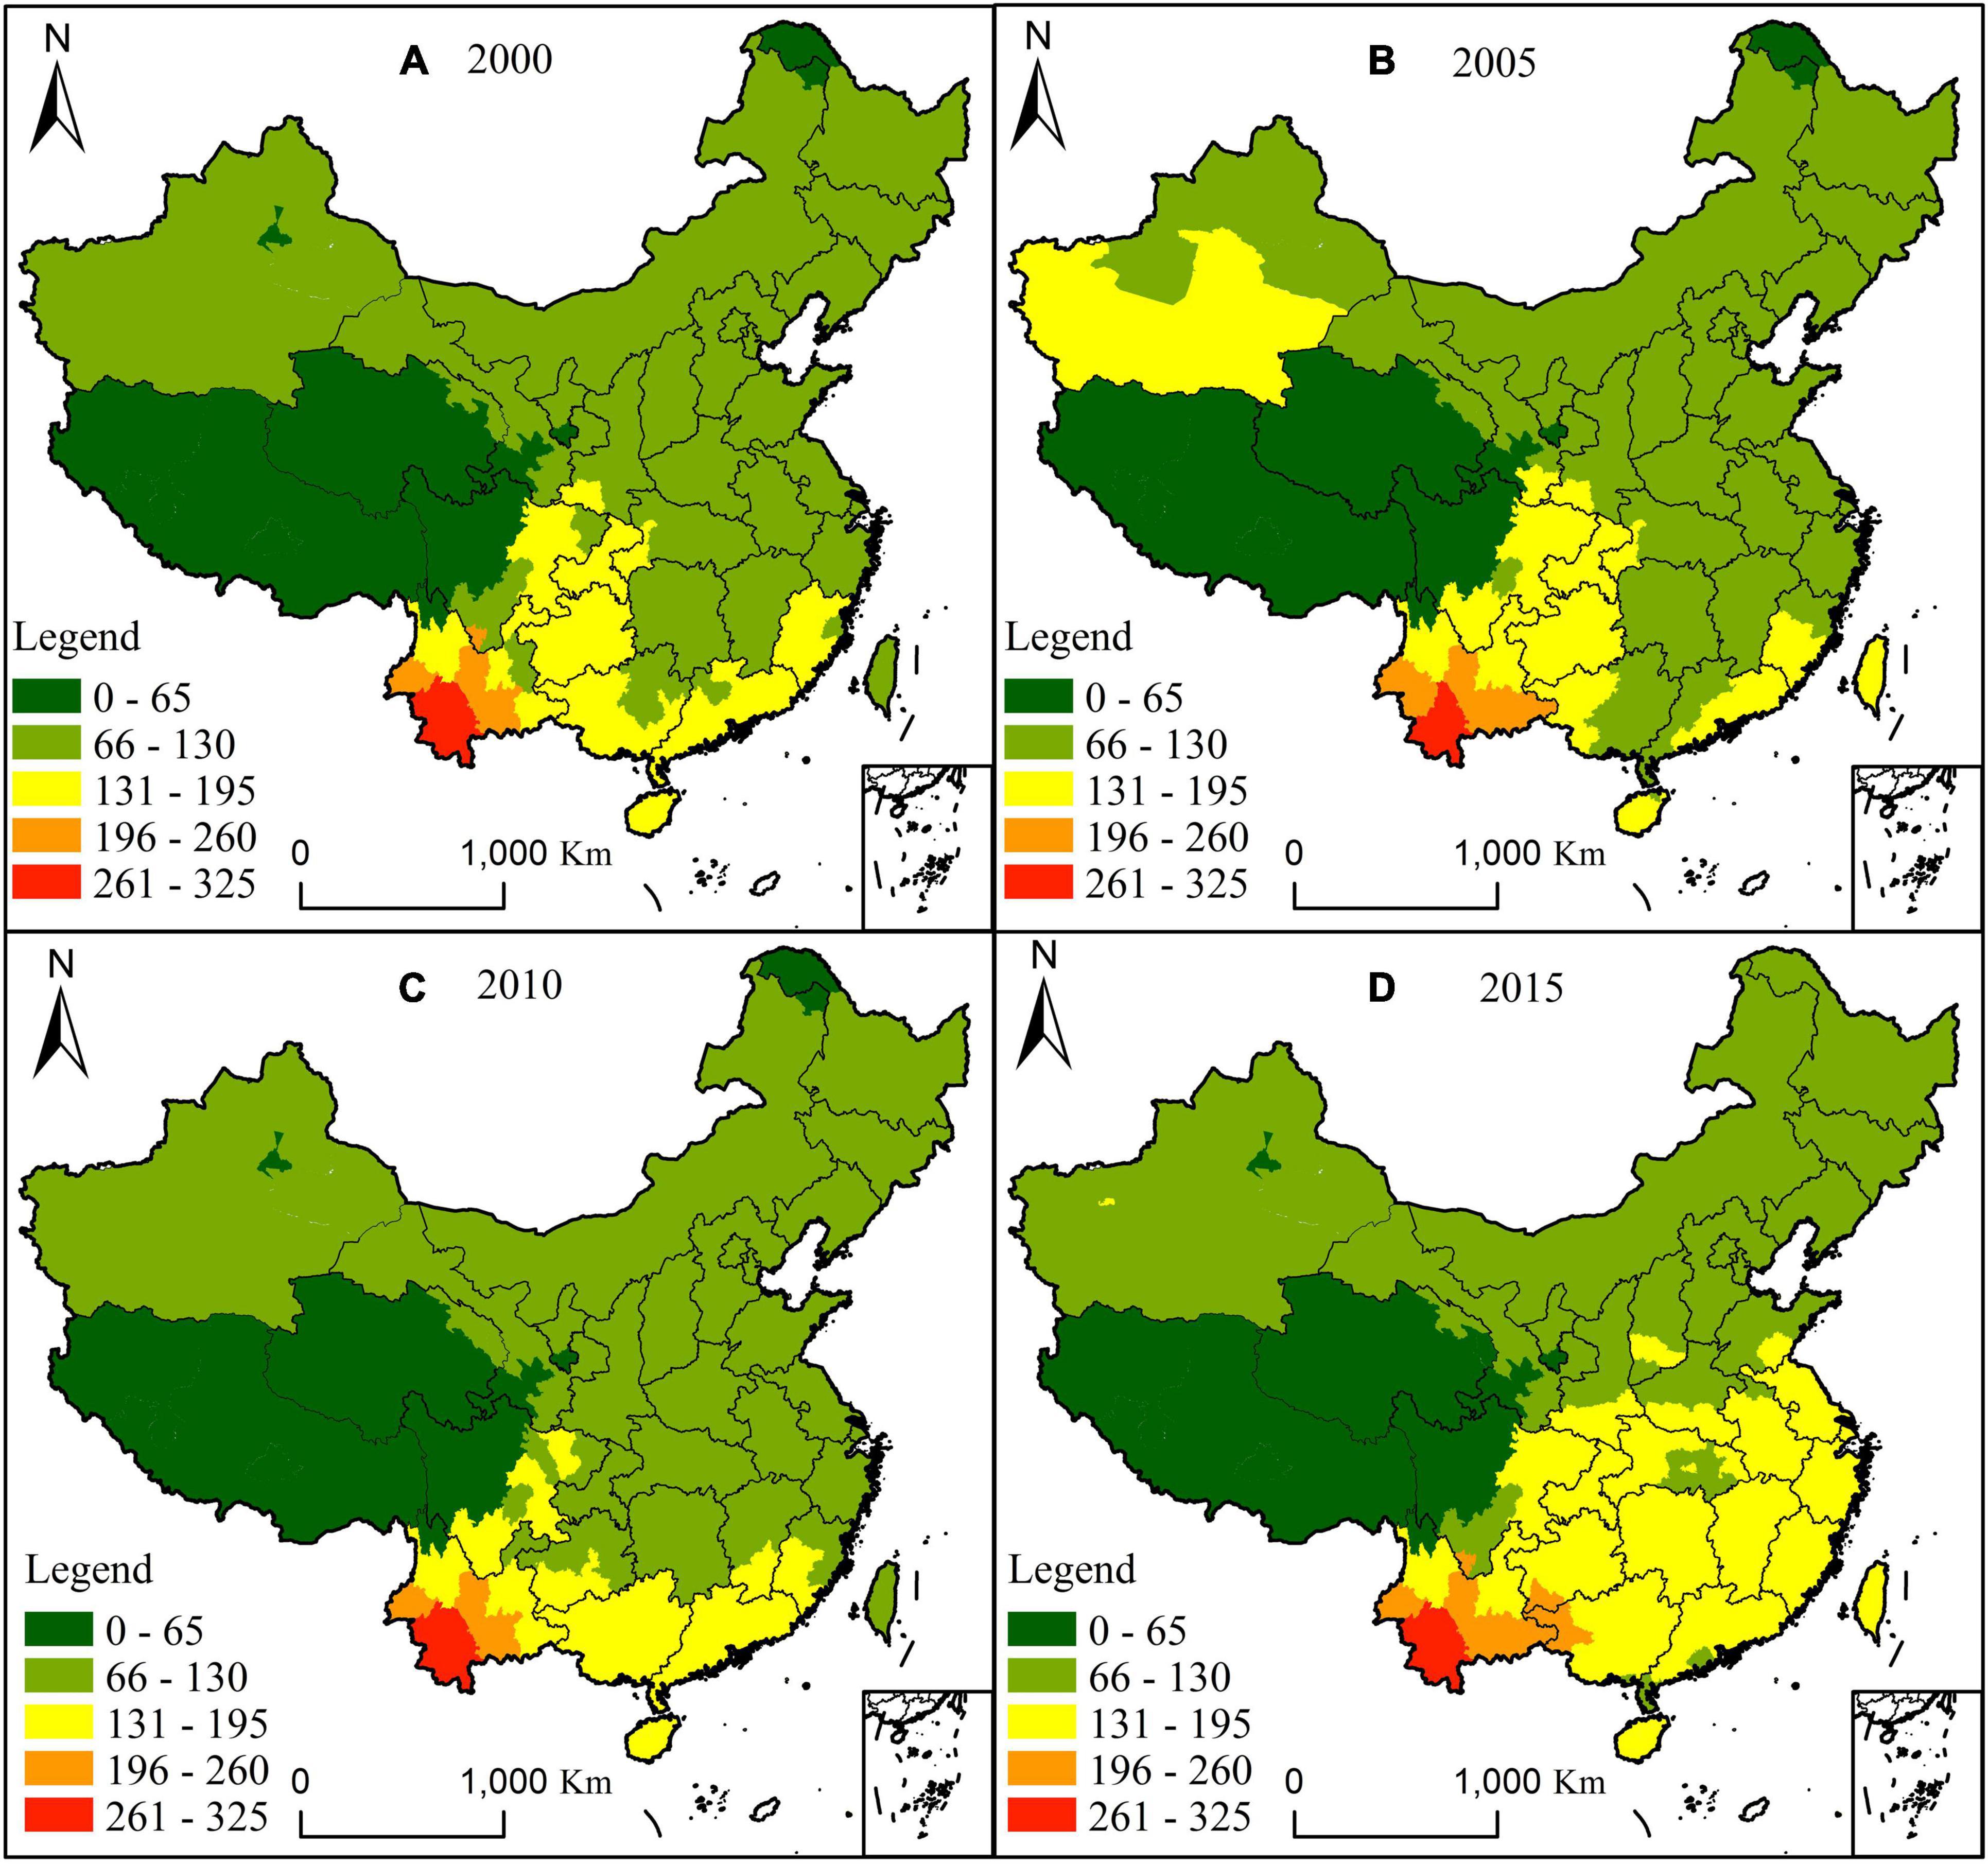
Figure 4. Daily change in human settlement climate comfort in China from 2000 to 2015.
Spatial characteristics of population density
In 2015, the regions with high population density were located mainly in north China, the northern part of central China, the northern part of east China, the northeastern part of southwest China, and the eastern part of south China. Dotted population distribution was found in northeast China, northwest China, the southern part of southwest China, the southern part of central China, the southern part of east China, and the western part of south China. The population, here, was distributed mainly in the capitals of various provinces (autonomous regions).
From the perspective of the annual change characteristics of population density, the areas with an obvious increase in population density in China from 2000 to 2005 mainly included northeast, north, east, central, and southwest China, whereas the areas with decreased population density were mainly in south China. The regional concentration of population density increased mainly in the northern part of north China, and east, south, and southwest China. The areas with a significant decrease in population density were concentrated mainly in the northeast, south of north China, northern part of central China, and northern part of east China.
From the perspective of the annual change characteristics of human settlement climate comfort, the population density concentration areas in 2015 mainly included the annual climate extremely cold zone, cold zone, and the transition zone between comfort and cold zones. From 2000 to 2015, the population density was concentrated from climate comfort extremely cold areas to cold and comfort areas. From the characteristics of the comfort month duration during the annual human settlement climate, the high population density area in 2015 was concentrated mainly in the annual 3- to 6-month comfort duration zone, followed by 7–10 and 11–12, with 0–2 having the lowest population density value. From 2000 to 2015, the population density was concentrated from the area of annual human settlement climate comfort month duration 3–4 months to the area of comfort month duration 5–6 months. From the characteristics of the comfort day length of the annual human settlement climate, the high population density in 2015 was concentrated mainly in the 66–195 comfort day zone, followed by the 196–260 comfort day zone, with the lowest population density value in the human settlement climate comfort day zones 261–325 and 0–65. During this period, the population density was concentrated from the area of 66–130 comfort days to the area of 131–195 comfort days (Figure 5).
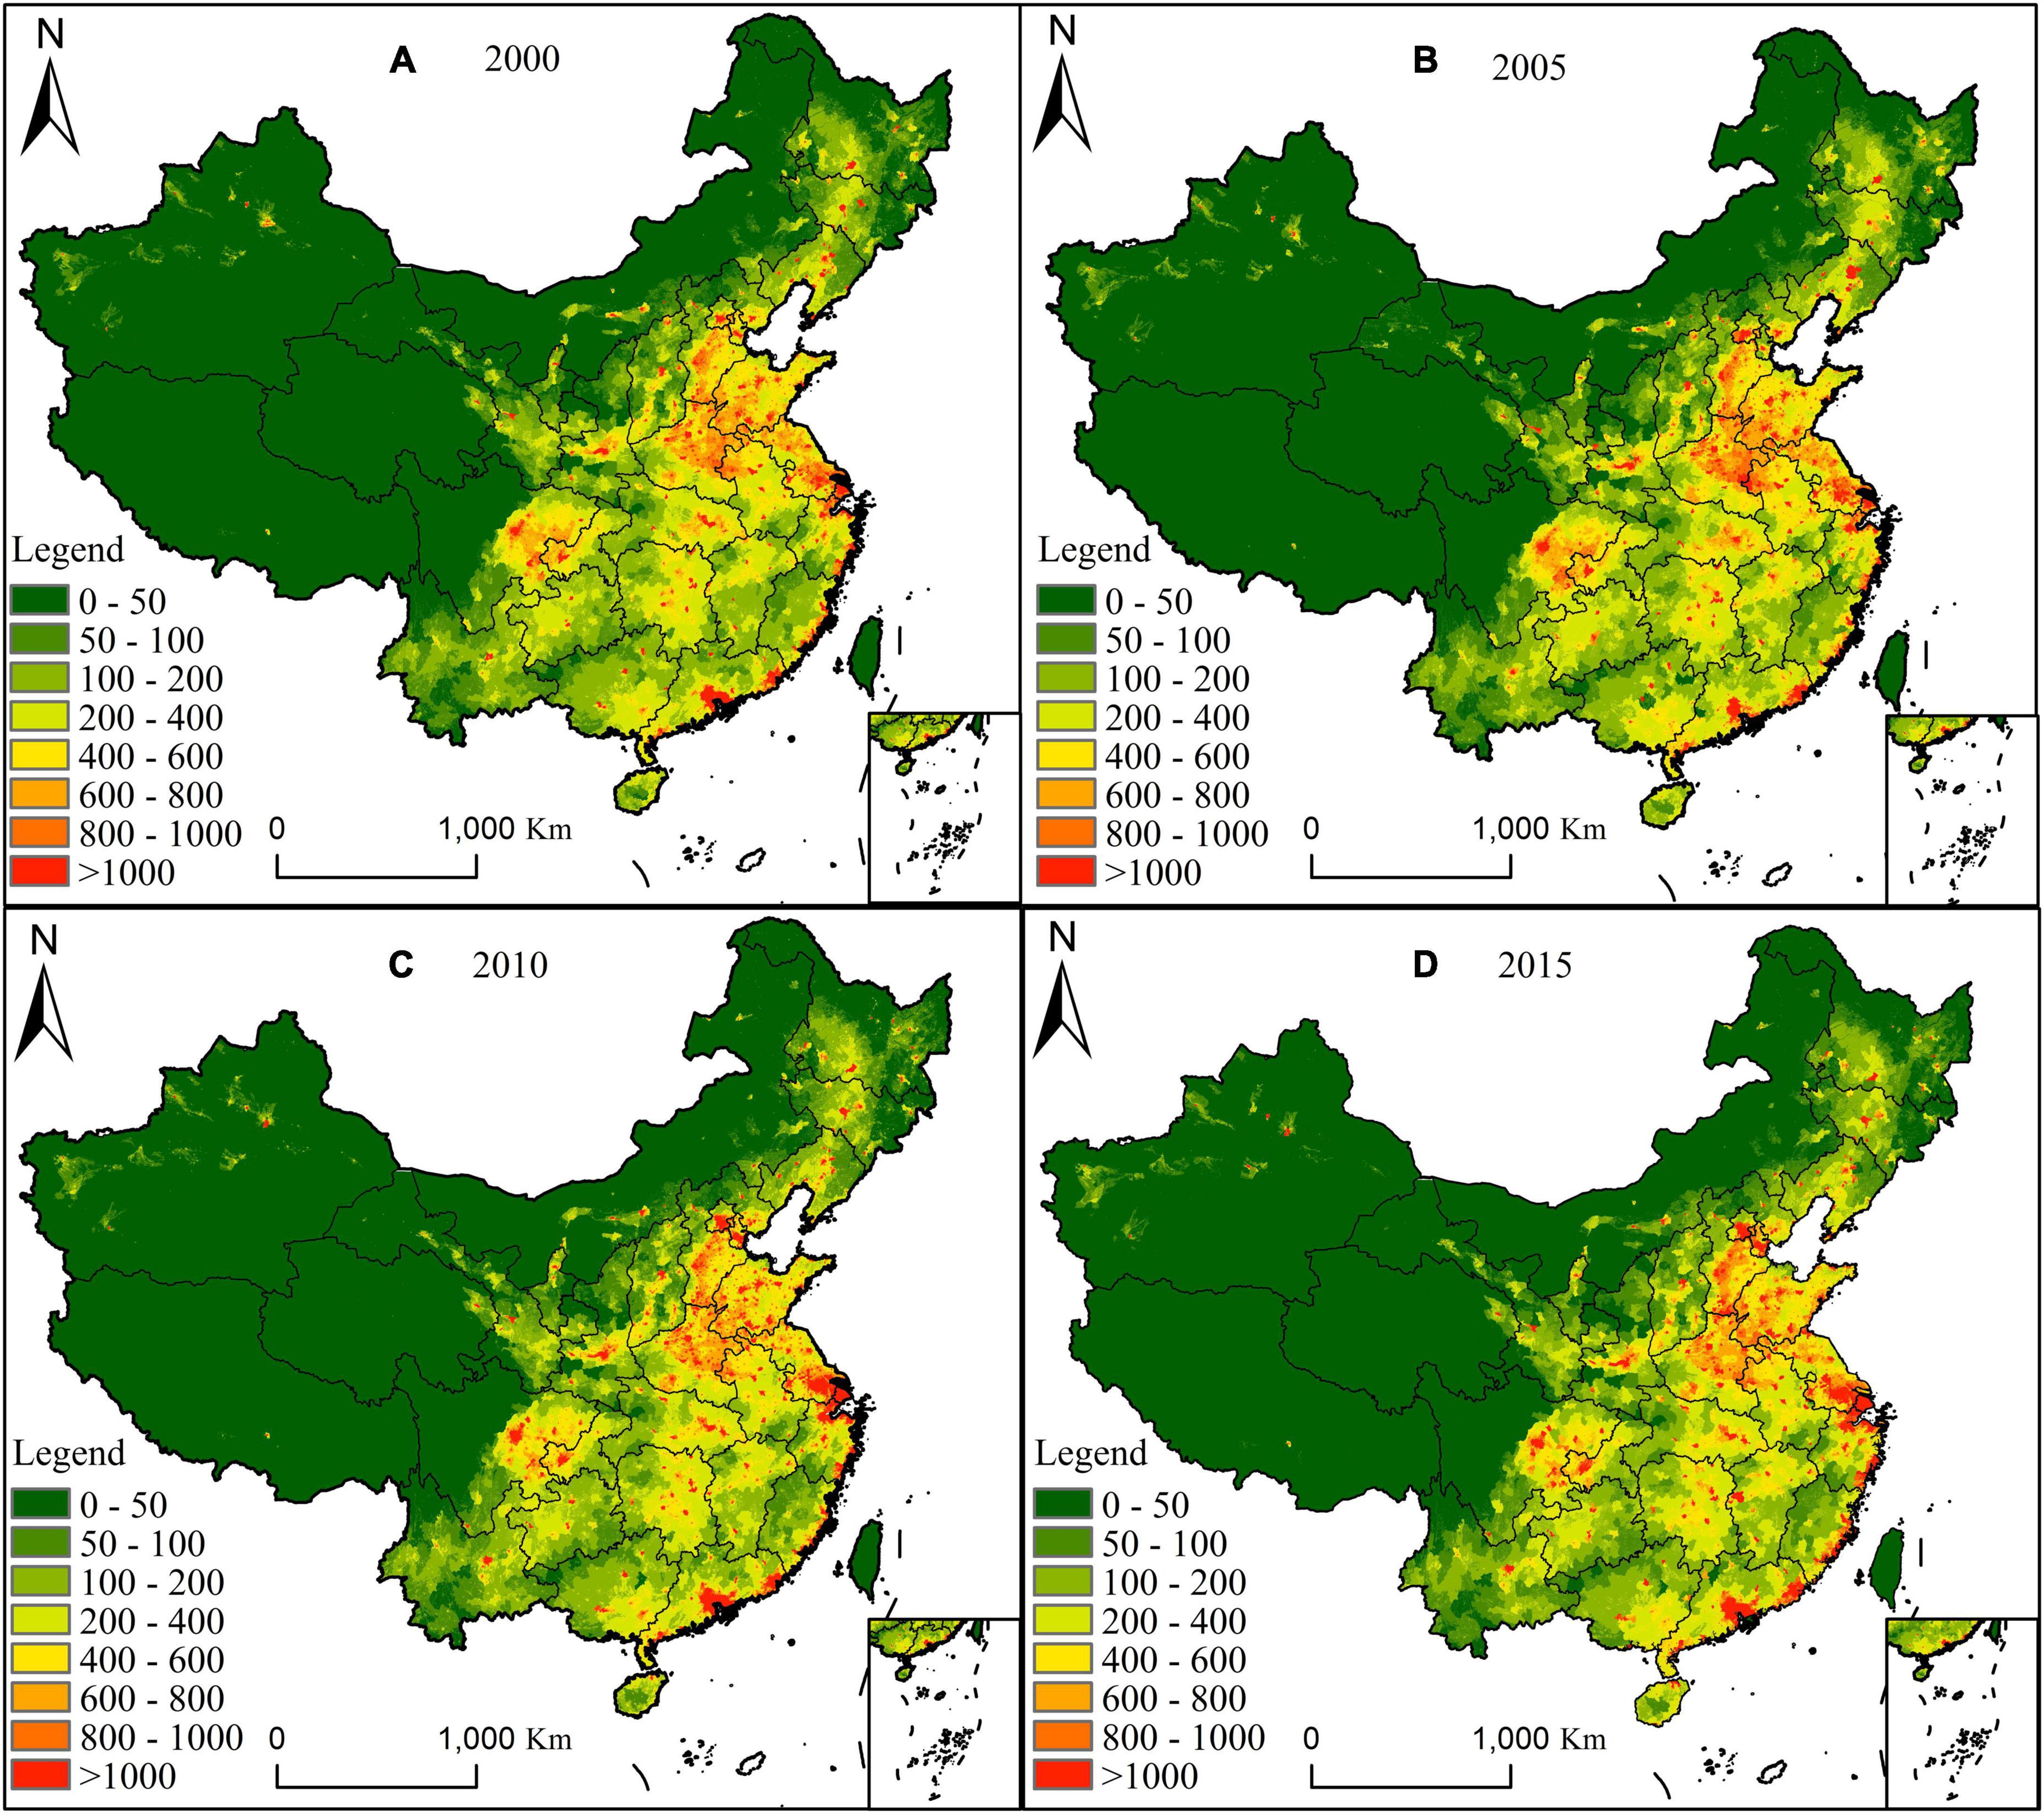
Figure 5. Spatial distribution of population density in China from 2000 to 2015.
Discussion
This study analyzed the spatial and temporal evolution characteristics of human settlement climate comfort in China through the temperature and humidity index and wind efficiency index and, subsequently, analyzed the spatial relationship of human settlement climate comfort and population density in China. Improving the climate comfort of the human settlement environment in China is important for guiding an orderly flow of population, thereby optimizing the regional population structure.
Compared with existing research, our study presents improvements in the research scale and the research perspective. With respect to the research scale, existing research on urban climate comfort evaluation is based mainly on the single year, month, and day time scale (Lyu and Chen, 2021; Xiong and Zhang, 2021), with a lack of comparative analysis of the spatial characteristics of urban climate comfort based on the three time dimensions (year, month, and day). With respect to the research perspective, existing research mainly focuses on summarizing the spatial and temporal change characteristics of regional human settlement climate comfort (Camila et al., 2021; Lin et al., 2021), but it does not explore the effect of change in human settlement climate comfort on the spatial layout of population density.
In view of the spatiotemporal evolution of human settlement climate comfort, our study presents the following suggestions.
(1) Improve the comfort level of the human settlement climate by changing meteorological elements, for example, by making full use of the natural landscape for regulating temperature, humidity, and other climatic elements. Various cities have adopted the principle of adjusting measures to local conditions and choosing appropriate natural landscapes to adjust their comfort levels. Humidity and temperature in cities could also be improved by artificial water bodies and topography.
(2) Attract people by planning cities with a comfortable climate. For instance, the territory occupied by northwest and northeast China and the Yunnan–Guizhou region in southwest China is vast, but the population density is low. Therefore, the climate comfort in northwest and northeast China should be improved, and habitable cities should be planned for areas of relative comfort. In addition, the advantages of the human settlement climate in the Yunnan–Guizhou region should be used to the maximum, and a habitable urban agglomeration should be constructed.
The limitations of our study are as follows:
(1) The population density data reflect only relevant changes between different years, but as shifts at monthly scale are not reflected, the effect of changes in human settlement climate comfort on population density in different months could not be analyzed.
(2) When the temperature and humidity index and the wind efficiency index were inconsistent, the wind efficiency index was used in winter and the temperature and humidity index in summer. This approach solved the problem of two exponential inconsistencies in the monthly and daily time scales but could not solve this problem at an annual scale. It appears that people are often inclined to follow the example of bird migration, that is, migrating to warmer climes when it is cold and back to cooler climes when it is hot. Therefore, follow-up studies should explore the spatial flow characteristics of the population at the monthly scale by, for example, mobile phone signaling data. Such research would facilitate analyses of the effects of seasonal changes in human settlement climate comfort on population migration. Furthermore, a reasonable method should be explored to evaluate human settlement climate comfort when the temperature and humidity index and wind efficiency index are inconsistent at the annual scale.
Conclusion
Based on the China ground climate (mean daily value data) and China population spatial distribution kilometer grid dataset, the temperature and humidity climate index and population grid space calculation were employed to determine human settlement climate comfort and population density, respectively, in China. The spatiotemporal relationship between the human settlement climate comfort and population density was also analyzed. Our conclusions are as follows:
(1) From the perspective of the annual human settlement climate comfort range in China, the area range of annual human settlement climate extremely cold was the largest, followed by the cold range, while the comfort climate range was the smallest. In 2015, human settlement climate comfort areas were distributed mainly in the south of east China, south China, the central-south, and the east of southwest China, and the south of central China. The cold human settlement climate was distributed mainly in the north of east China, middle and north of central China, middle and north of southwest China, south of northwest China, and south of north China. The extremely cold human settlement climate was distributed mainly in northeast China, most areas of northwest China, the middle and north of north China, and the west of southwest China. From 2000 to 2015, the annual range of human settlement climate comfort area and cold area showed a trend of northward expansion, and the range of extremely cold human settlement climate shrank. At present, most regions of the human settlement climate in China have poor climate comfort, and there are relatively few human settlement climate comfort areas. However, over time, the human settlement climate comfort area and sub-comfort area will expand gradually.
(2) The comfort month duration of the human settlement climate in southern China was generally higher than that in northern China. The regional range was the largest in comfort monthly duration of 3–4, followed by 0–2 and 5–6, and was the smallest in comfort monthly length of 7–12. From 2000 to 2015, the comfort monthly length of human settlement climate in the west and north of northwest China showed a decreasing trend, whereas northeast and central China showed the spatial characteristics of a decrease in the north and increase in the south. In north China, the east increased first, then decreased, and subsequently increased, and the west increased first and then decreased. East China showed a trend of decrease first and then increase; the north of south China increased first and then decreased and, subsequently, increased; whereas the southern part of south China decreased first and then increased. The human settlement climate change in southwest China was relatively complex, with significant differences in the comfort month length in southwest China.
(3) The comfort day length of the human settlement climate in southern China was generally higher than that in northern China. The area range of comfort day length of 66–130 was the largest, followed by 0–65 and 131–195, with that of 196–325 being the smallest. From 2000 to 2015, the human settlement climate in northwest, north, and northeast China changed less, whereas the human settlement climate in southwest, south, central, and east China changed significantly.
(4) High population density in 2015 was concentrated mainly in the area of annual climate comfort extremely cold, cold, and the transition area between comfort and cold, as well as the area of comfort monthly length 3–6 and the area of comfort day length 66–195. From 2000 to 2015, the population density migrated from extremely cold human settlement climate areas to cold and comfort areas, from the area of comfort month length 3–4 to 5–6, and from the area of comfort days 66–130 to 131–195. Our results show that population density has a certain trend relevant to the duration of comfort months and days, and people prefer to live in an area with a comfort month duration of 5–6 and 131–195 days. In general, population migration and settlement in China are expected to gradually show the spatial characteristics of agglomeration from north to south.
Data availability statement
The original contributions presented in the study are included in the article/supplementary material, further inquiries can be directed to the corresponding author.
Author contributions
CZ and DZ: conceptualization. DZ and YZ: methodology, software, and data curation. CZ: validation and formal analysis. DZ: writing—original draft. CZ and BZ: writing—review and editing. All authors have read and agreed to the published version of the manuscript.
Conflict of interest
The authors declare that the research was conducted in the absence of any commercial or financial relationships that could be construed as a potential conflict of interest.
Publisher’s note
All claims expressed in this article are solely those of the authors and do not necessarily represent those of their affiliated organizations, or those of the publisher, the editors and the reviewers. Any product that may be evaluated in this article, or claim that may be made by its manufacturer, is not guaranteed or endorsed by the publisher.
Footnotes
References
Adiguzel, F., Sert, E. B., Dinc, Y., Cetin, M., Gungor, S., Yuka, P., et al. (2022). Determining the relationships between climatic elements and thermal comfort and tourism activities using the tourism climate index for urban planning: A case study of Izmir Province. Theor. Appl. Climatol. 147, 1105–1120. doi: 10.1007/s00704-021-03874-9
Alisson, F., Edson, D., Bernardo, L., Queiroz, R., José, I., José, A., et al. (2010). Climate change and population migration in Brazil’s Northeast: Scenarios for 2025-2050. Popul. Environ. 31, 344–370. doi: 10.1007/s11111-010-0105-1
Amininia, K., Abad, B., Safarianzengir, V., GhaffariGilandeh, A., and Sobhani, B. (2020). Investigation and analysis of climate comfort on people health tourism in Ardabil province, Iran. Air Qual. Atmos. Health 13, 1293–1303. doi: 10.1007/s11869-020-00883-x
Amorosi, A., Bini, M., Giacomelli, S., Pappalardo, M., Ribecai, C., Rossi, V., et al. (2013). Middle to late Holocene environmental evolution of the Pisa coastal plain (Tuscany, Italy) and early human settlements. Quat. Int. 303, 93–106. doi: 10.1016/j.quaint.2013.03.030
Areti, T., Ioannis, X., Tsiros, S. L., and Marialena, N. (2010). An evaluation of three biometeorological indices for human thermal comfort in urban outdoor areas under real climatic conditions. Build. Environ. 45, 1346–1352. doi: 10.1016/j.buildenv.2009.11.009
Camila, T. P., Érico, M., and Vandoir, B. (2021). Socio-spatial inequality and its relationship to thermal (dis)comfort in two major Local Climate Zones in a tropical coastal city. Int. J. Biometeorol. 65, 1177–1187. doi: 10.1007/s00484-021-02099-9
Cao, W., He, Y., Li, Z., Wang, S., and Wang, C. (2012). Evaluation of the tourism climate comfort index in Lijiang City, Yunnan. J. Glaciol. Geocryol. 34, 201–206.
Cao, Y., Sun, Y., and Wu, M. (2019). Spatial and temporal characteristics of the periods of climate comfort in the Beijing-Tianjin-Hebei region from 1966 to 2015. Acta Ecol. Sin. 39, 7567–7582. doi: 10.5846/stxb201805181096
Chen, K., Cabrera, A., and Dubrow, R. (2020). Projections of ambient temperature- and air pollution-related mortality burden under combined climate change and population aging scenarios: A review. Curr. Environ. Health Rep. 7, 243–255. doi: 10.1007/s40572-020-00281-6
Cohen, P., Potchter, O., and Matzarakis, A. (2013). Human thermal perception of Coastal Mediterranean outdoor urban environments. Appl. Geogr. 37, 1–10. doi: 10.1016/j.apgeog.2012.11.001
Du, J., Liu, L., Chen, X., and Liu, J. (2020). Field assessment of neighboring building and tree shading effects on the 3D radiant environment and human thermal comfort in summer within urban settlements in Northeast China. Adv. Meteorol. 2020:8843676. doi: 10.1155/2020/8843676
Dulal, H. B., and Akbar, S. (2013). Greenhouse gas emission reduction options for cities:Finding the “Coincidence of Agendas” between local priorities and climate change mitigation objectives. Habitat Int. 38, 100–105. doi: 10.1016/j.habitatint.2012.05.001
Esmael, N., Zahraei, A., Ghadiri, H., and Komasi, H. (2014). Zoning evaluation of Eco-Touristic potentials of bio-climatic comfortability in the province of Fars, using Geographical information system (GIS). Int. J. Adv. Res. 2, 768–776.
Fan, Q., Du, F., Li, H., and Zhang, C. (2021). Thermal-comfort evaluation of and plan for public space of Maling Village, Henan, China. PLoS One 16:e0256439. doi: 10.1371/journal.pone.0256439
Kong, F. (2020). Multi-temporal scale assessment of climate comfort of habitat environment and spatial differences in China. J. Arid Land Resour. Environ. 34, 102–111. doi: 10.13448/j.cnki.jalre.2020.72
Lai, D., Liu, J., Wu, Z., Pei, J., Qi, Y., Zhang, H., et al. (2021). Thermal comfort diversity in Chinese urban residential buildings across various climates. Energy Build. 231:110632. doi: 10.1016/j.enbuild.2020.110632
Li, Q., and Zhong, G. (2005). Evaluation on climate resource for tourism in the region around Bohai. J. Arid Land Resour. Environ. 19, 149–153. doi: 10.13448/j.cnki.jalre.2005.02.029
Liao, X., Xu, W., Zhang, J., Li, Y., and Tian, Y. (2019). Global exposure to rainstorms and the contribution rates of climate change and population change. Sci. Total Environ. 663, 644–653. doi: 10.1016/j.scitotenv.2019.01.290
Lin, Y., Li, P., Feng, Z., Yang, Y., Zhen, Y., and Zhu, F. (2021). Climate suitability assessment of human settlements for regions along the belt and road. Chin. Geogr. Sci. 31, 996–1010. doi: 10.1007/s11769-021-1241-5
Liu, Z., Jin, Y., and Jin, H. (2019). The effects of different space forms in residential areas on outdoor thermal comfort in severe cold regions of China. Int. J. Environ. Res. Public Health 16:3960. doi: 10.3390/ijerph16203960
Luo, X., Yang, J., Sun, W., and He, B. (2021). Suitability of human settlements in mountainous areas from the perspective of ventilation: A case study of the main urban area of Chongqing. J. Clean. Prod. 310:127467. doi: 10.1016/j.jclepro.2021.127467
Lyu, L., and Chen, D. (2021). Impact of climate comfort of urban human settlements on urban innovation. Areal Res. Dev. 40, 45–49. doi: 10.3969/j.issn.1003-2363.2021.02.008
Ma, L., Sun, G., Ma, Y., Cai, X., and Hou, K. (2011). Variation of tourism climate comfort degree in Beijing in the last years. J. Arid Land Resour. Environ. 25, 161–166. doi: 10.13448/j.cnki.jalre.2011.10.021
Ma, L., Sun, G., Xie, Y., and Long, M. (2010). A study on variations of the tourism climate comfort degree in five typical cities in Eastern China during the last 50 years. Resour. Sci. 32, 1963–1970.
Maria, C., Célia, M., Raquel, C., Beatriz, D. A. B., and João, P. A. G. (2019). Preliminary approach to the analysis of climate perception and human thermal comfort for riverside dwellings the Brazilian Amazon. J. Build. Eng. 23, 77–89. doi: 10.1016/j.jobe.2019.01.019
Masoudi, M. (2021). Estimation of the spatial climate comfort distribution using tourism climate index (TCI) and inverse distance weighting (IDW) (case study: Fars Province, Iran). Arab. J. Geosci. 14:363. doi: 10.1007/s12517-021-06605-6
Michael, P. (2018). Climate change, internal migration, and the future spatial distribution of population: A case study of New Zealand. Popul. Environ. 39, 239–260. doi: 10.1007/s11111-017-0289-8
National Standardization Administration (2012). National standard of the People’s Republic of China GB/T 27963-2011: Climatic suitability evaluating on human settlement. Beijing: Standards Press of China.
Pantavou, K., Theoharatos, G., Santamouris, M., and Asimakopoulos, D. (2013). Outdoor thermal sensation of pedestrians in a Mediterranean climate and a comparison with UTCI. Build. Environ. 66, 82–95. doi: 10.1016/j.buildenv.2013.02.014
Pottier, A., Fleurbaey, M., Méjean, A., and Zuber, S. (2021). Climate change and population: An assessment of mortality due to health impacts. Ecol. Econ. 183:106967. doi: 10.1016/j.ecolecon.2021.106967
Ren, J., Yang, J., Zhang, Y., Xiao, X., Xia, J., Li, X., et al. (2022). Exploring thermal comfort of urban buildings based on local climate zones. J. Clean. Prod. 340:130744.
Salata, F., Golasi, I., Roberto, V., and Andrea, V. (2016). Outdoor thermal comfort in the Mediterranean area. A transversal study in Rome, Italy. Build. Environ. 96, 46–61. doi: 10.1016/j.buildenv.2015.11.023
Smirnov, O., Zhang, M., Xiao, T., Orbell, J., Lobben, A., and Gordon, J. (2016). The relative importance of climate change and population growth for exposure to future extreme droughts. Clim. Change 138, 41–53. doi: 10.1007/s10584-016-1716-z
Stathopoulos, T., Wu, H., and Zacharias, J. (2004). Outdoor human comfort in an urban climate. Build. Environ. 39, 297–305. doi: 10.1016/j.buildenv.2003.09.001
Xiong, Y., and Zhang, F. (2021). Effect of human settlements on urban thermal environment and factor analysis based on multi-source data: A case study of Changsha city. J. Geogr. Sci. 31, 819–838. doi: 10.1007/s11442-021-1873-5
Xu, X. (2017). Data registration and publishing system of resources and environmental science data center. China population spatial distribution 1 km grid dataset. Beijing: Chinese Academy of Sciences, doi: 10.12078/2017121101
Yang, J., Wang, Y., Xiu, C., Xiao, X., Xia, J., and Jin, C. (2020). Optimizing local climate zones to mitigate urban heat island effect in human settlements. J. Clean. Prod. 275:123767. doi: 10.1016/j.jclepro.2020.123767
Yu, H., Yang, J., Li, T., Jin, Y., and Sun, D. (2022). Morphological and functional polycentric structure assessment of megacity: An integrated approach with spatial distribution and interaction. Sustain. Cities Soc. 80:103800. doi: 10.1016/j.scs.2022.103800
Keywords: human settlement environment, climate comfort, population density, spatiotemporal characteristics, China climate
Citation: Zhang D, Zhou C, Zhou Y and Zikirya B (2022) Spatiotemporal relationship characteristic of climate comfort of urban human settlement environment and population density in China. Front. Ecol. Evol. 10:953725. doi: 10.3389/fevo.2022.953725
Received: 26 May 2022; Accepted: 04 July 2022;
Published: 23 August 2022.
Edited by:
Jianhong Xia, Curtin University, AustraliaReviewed by:
Xianheng Ouyang, Zhejiang Agriculture and Forestry University, ChinaAndong Guo, Zhejiang University, China
Yunchuan Dai, Chongqing Academy of Social Sciences, China
Copyright © 2022 Zhang, Zhou, Zhou and Zikirya. This is an open-access article distributed under the terms of the Creative Commons Attribution License (CC BY). The use, distribution or reproduction in other forums is permitted, provided the original author(s) and the copyright owner(s) are credited and that the original publication in this journal is cited, in accordance with accepted academic practice. No use, distribution or reproduction is permitted which does not comply with these terms.
*Correspondence: Chunshan Zhou, zhoucs@mail.sysu.edu.cn