Plant Water Stress Reduces Aphid Performance: Exploring Mechanisms Driven by Water Stress Intensity
 Jessica T. Kansman1*
  Saumik Basu2
  Clare L. Casteel3
  David W. Crowder2
  Benjamin W. Lee2
  Chad T. Nihranz3
  Deborah L. Finke1
- 1Division of Plant Science and Technology, Columbia, MO, United States
- 2Department of Entomology, Washington State University, Pullman, WA, United States
- 3Plant Pathology and Plant-Microbe Biology, Cornell University, Ithaca, NY, United States
Drought alters plant traits in ways that affect herbivore performance. However, we lack a comprehensive understanding of the plant-derived mechanisms that mediate insect responses to drought. Water stress occurs along gradients of intensity, and the impacts of drought intensity on plant-insect interactions is understudied. Here, we assessed aphid performance on wheat plants exposed to a gradient of water stress and measured plant nutrients and phytohormones that may mediate aphid response to drought. We show that water stress reduced aphid performance, and the negative effect grew stronger as the magnitude of water stress increased. The plant response to water limitation was not consistent across the stress gradient and was reliant on the trait measured. Water limitation did not affect whole-plant nitrogen; however, water limitation did reduce amino acid concentration and increase sugars, but only under high stress intensity. The phytohormones abscisic acid (ABA), jasmonic acid (JA), and salicylic acid (SA), and the expression of their associated gene transcripts, were also differentially affected by water stress intensity. In well-watered conditions, aphid feeding increased concentrations of the defense-related hormones SA and JA over time; however, any amount of water limitation prevented aphid induction of JA. Although aphids may experience a reprieve from JA-related defenses in stressed conditions, SA levels remain high in response to aphid feeding, indicating aphids are still vulnerable to SA-related defenses. Any level of water stress also increased the expression of a callose-associated gene transcript, a physical defense that impairs feeding. Thus, poor aphid performance on mildly-stressed plants was correlated with increased plant defenses, whereas poor performance on highly-stressed plants was correlated with stronger plant defense induction and reduced plant nutritional quality. Understanding the mechanisms driving aphid and plant performance under water stress conditions can improve our ability to predict how aphid populations will respond to climate change.
Introduction
Understanding the effects of water stress on insect herbivores is critical for predicting pest outbreaks in agroecosystems in the face of a changing climate and seasonal variation in weather conditions (Mattson and Haack, 1987; Hamann et al., 2021). When plants experience water stress, they undergo a myriad of physiological changes to maintain growth and reproductive processes that alter herbivore performance. For example, the plant stress-insect performance hypothesis predicts that drought facilitates outbreaks of phloem-feeding insects by inducing plant stress responses that increase nitrogen availability for insects (White, 1969). However, empirical studies offer mixed support for this hypothesis, suggesting nitrogen availability alone does not reliably predict the response of herbivores to drought-induced changes in plants (Hale et al., 2003; Mody et al., 2009; Khan et al., 2010; Banfield-Zanin and Leather, 2015).
Drought induces a cascade of physiological responses in plants, some of which may be deleterious to insect herbivores. For example, when plants are grown in water-limited environments, phloem concentrations of soluble sugars and polyols often increase compared to plants grown in full water conditions (Marček et al., 2019). Sucrose is the most abundant soluble sugar in phloem available to herbivorous insects, and high concentrations of sucrose have been shown to negatively affect aphid reproduction (Wilkinson et al., 1997; Douglas, 2006). Water stress also induces the production of some chemical plant defensive compounds and physical structures such as peroxidases, phenolics, glucosinolates, and callose (English-loeb et al., 1997; Inbar et al., 2001; Ahmed et al., 2015; Pineda et al., 2016). Induction of phytohormone defenses in response to drought may promote subsequent resistance to herbivory (Nguyen et al., 2016; Blundell et al., 2020; Lin et al., 2021). However, few studies have comprehensively assessed how chemical and physical changes in plants due to water stress affect herbivore performance.
Another complicating factor for predicting herbivore response to drought is that water stress intensity varies across studies. There are multiple plant stress responses that mediate herbivore performance under drought conditions, and these responses may be sensitive to the magnitude of change in water availability. For example, one study showed elevated aphid performance on mildly-stressed Brassica plants compared to well-watered plants, correlating with increased nitrogen, despite higher levels of plant defensive compounds. In contrast, the same study found aphid performance was reduced on highly-stressed plants, which correlated with plant defensive compounds becoming more concentrated (Tariq et al., 2012). This demonstrates the need for more studies that assess plant and herbivore responses to water stress intensity (Huberty and Denno, 2004; Walter, 2018; Sconiers et al., 2020).
The purpose of this study was to identify which plant traits influence the response of the bird cherry-oat aphid (Rhopalosiphum padi L.) to water-limited wheat (Triticum aestivum L.). Field studies show abundance of R. padi can be reduced by 50% on drought-stressed compared to fully-watered wheat, despite increased nitrogen availability in stressed plants (Johnson et al., 2011). However, it remains unclear if aphids are sensitive to varying water availability, and which plant traits mediate aphid performance in response to drought. To address this, we experimentally incorporated multiple levels of water stress and assessed how the degree of water limitation affected plant physiological responses and plant-aphid interactions. We measured the performance of R. padi on wheat with varying levels of water stress and tested plants for changes in nutrients and stress-associated defenses. By identifying mechanisms affecting aphid performance on water-limited plants, our study can aid in predicting how aphid populations will be affected by drought in natural environments and agroecosystems.
Materials and Methods
Aphid Colony
Rhopalosiphum padi L. aphids used in experiments were reared in the Ashland Road Greenhouse Facility (16:8 h light:dark, 26–34°C; University of Missouri, Columbia, MO, United States). The colony was established in 2016 from a lab colony at Kansas State University; aphids in this colony were originally collected in Riley County, KS, United States. Aphids were maintained on winter wheat (T. aestivum) variety Coker 9553 (AgriPro) using potting mix (Miracle-Gro Potting Mix) in 60 cm × 60 cm × 60 cm mesh cages (BugDorm-2120, MegaView Science, Taichung, Taiwan). Infested colony plants were replaced with new plants multiple times a week to maintain low aphid densities.
Drought Methods
A standard protocol was used to create water-limitation treatments across experiments. Wheat seeds were planted (one per pot) in air-dried growing medium (PRO-MIX BX General Purpose non-mycorrhizae, Riviere-du-Loup, Quebec, Canada) in the greenhouse. All plants were grown in well-watered conditions for 14 days and fertilized once (All-Purpose Plant Food, Scott’s Miracle-Gro, Marysville, OH, United States) before treatments were applied. At 14 d, the soil was watered to saturation and allowed to drain for 12 h overnight. The weight of each pot after water had drained was the “baseline” for treatments. Pots in the well-watered treatment were weighed and watered daily to maintain the baseline weight (100%). Water was withheld from pots in the reduced water treatments until pots dried to 75% (mild-stress) or 50% (high-stress) of baseline weight. When the target weight was reached, the pots were watered once daily to maintain this weight.
For plants that received aphids, we waited 48 h after target weights were reached before aphids were introduced. Pot size varied across experiments (details to follow), but we confirmed that plants experienced a consistent level of stress across experiments by measuring whole-plant water potential with a pressure chamber (Scholander pressure bomb Model 670, PMS Instrument Company, Albany, OR, United States). Water potential was compared across treatments using a one-way analysis of variance with a Tukey-HSD correction (ANOVA, PROC MIXED; SAS 9.4, SAS Institute, Cary, NC, United States).
Experiment 1: Aphid Fecundity
The effect of plant water availability on aphid fecundity was assessed by observing individual aphid lifetime nymph production in the greenhouse. A single R. padi aphid was caged on a leaf inside a 11.4 cm × 8.9 cm × 5.1 cm food container (GLAD Designer Series, Proctor & Gamble, Cincinnati, OH, United States). A large hole was cut from the lid and replaced with fine mesh fabric for ventilation, and a 1.25 cm diameter hole was cut into opposite sides of the container to allow a wheat leaf to slide through and be secured with cotton. This design allowed the wheat leaf to remain connected to the plant.
Wheat plants were grown individually in 15.2 cm × 15.2 cm × 11.4 cm pots and then randomly assigned to one of the three water treatments (well-watered, mild-stress, high-stress). The water treatments were each replicated 10 times to create 30 total experimental units in our greenhouse. Once nymph production began, nymphs were counted and removed every 24 h until the original adult aphid died. Average daily nymph production was calculated as the total number of nymphs produced divided by the number of days the aphid lived. The relationship between plant water potential and average daily nymph production was analyzed using regression (PROC REG, SAS). Observations were not included in the analysis if the aphid escaped, the leaf died, or if the aphid produced no nymphs (14 observations were excluded: 100% = 6, 75% = 5, 50% = 3). It was equally likely to find aphids with zero nymph production across water-stress treatments.
Experiment 2: Aphid Population Performance
The effects of water availability on aphid population size and growth rate were evaluated over time in the greenhouse. Wheat plants were grown individually in 17.1 cm × 17.8 cm × 13.3 cm pots and randomly assigned to one of the three treatments (well-watered, mild-stress, high-stress). Before aphid release, pots were individually caged in mesh-nylon 60 cm × 60 cm × 60 cm mesh cages, with treatments arranged in a randomized complete block design. Each block was replicated nine times for a total of 27 cages. Using a paintbrush, 20 late instar aphids were added to each cage. To assess the impacts of plant water availability on aphid population size over time, the number of aphids in each cage were counted at 3, 7, and 14 days post-release. Population growth rate was calculated using the formula.
with Aphidsfinal as the aphid density on day 14, the initial density was 20, and 14 days elapsed (Nelson et al., 2012).
The main and interactive effects of water availability and time on aphid abundance were determined by repeated measures ANOVA, with a compound symmetry covariance structure based on lowest AIC value (PROC GLIMMIX, SAS). Block was as a random factor, and aphid abundance was modeled with a negative binomial distribution based on variability in the count data. The relationship between plant water potential and aphid growth rate was analyzed using regression (PROC REG, SAS). Observations were not included in the analysis for three replicates where water potential was not measured on the corresponding plant.
Experiment 3: Plant Nutrients
The effect of plant water availability on plant macro- and micro-nutrient content was assessed by growing individual wheat plants in 15.2 cm × 15.2 cm × 11.4 cm pots and then randomly assigning them to one of the three water treatments (well-watered, mild-stress, high-stress). Plants were maintained at treatment levels for 48 h before sample collection. One accidentally damaged plant was removed from the study, leaving nine replicates of the high-stress treatment and 10 of all others (n = 29). Leaf material from the top third of each plant was excised using a razor blade and air dried for 48 h (26.22 ± 0.16°C) before analysis (University of Missouri Soil and Plant Testing Laboratory, Columbia, MO, United States). Percent total nitrogen and phosphorous were determined with TKN (Total Kjeldahl Nitrogen) digestion (Lachat, 1993). Percent total potassium, calcium, and magnesium, and the ppm of zinc, iron, copper, and manganese were assessed using microwave digestion (Lachat, 1993). Nutrient identity was determined using a Varian Visa-MPX Atomic Simultaneous Inductively Coupled Plasma Optical Emission Spectrometer (Nathan et al., 2006). The effect of water treatment on individual nutrients was assessed using Kruskal–Wallis tests (PROC NPAR1WAY, SAS) and Dunn’s post hoc tests (PROC GLM, SAS), since the data did not meet the assumptions of parametric procedures.
Experiment 4: Plant Amino Acids and Sugars
The effects of water availability on amino acids and sugars were assessed by growing individual plants in 19.0 cm × 18.1 cm × 15.9 cm pots and then randomly assigning them to one of three water treatments (well-watered, mild-stress, high-stress). Plants were maintained at treatment levels for at least 48 h before sample collection (n = 15). All of the leaf material from the plant was excised using a razor blade and dried for 48 h (55°C, Imperial IV Oven, Labline Instruments, Melrose Park, IL, United States). The concentrations of plant metabolites relative to the amount of tissue sampled were assessed by Liquid Chromatography Mass Spectrometry (LC-MS) (Metabolomics Center, University of Missouri, Columbia, MO, United States).
The effect of the water treatments on composition of free amino acids (essential + nonessential) and sugars (sugars + polyols) were assessed separately with non-metric multidimensional scaling (NMS) with Sørenson (Bray Curtis) distance matrices and nineteen amino acids included (PC ORD v.6, McCune and Mefford 2011). A three-dimensional solution was chosen based on the stress value (< 25) and Monte Carlo randomization tests (PC ORD v. 6). Differences in amino acid composition across the water treatments were assessed using multi-response permutation procedure (MRPP, PC ORD v.6). Fifteen sugars and polyols were incorporated into the sugar NMS procedure. A two-dimensional solution was chosen for the final ordination. Differences in sugar composition across the water treatments were assessed using MRPP (PC ORD).
We examined the effects of the water treatments on individual amino acids considered essential for aphids: isoleucine, leucine, lysine, methionine, phenylalanine, threonine, tryptophan, and valine (Sandström and Moran, 1999). Tyrosine and cysteine were also included because they are only synthesized from essential amino acids. Effects of the water treatment on the relative concentration of each aphid essential amino acid was assessed using one-way ANOVA with a Tukey-HSD post hoc test (PROC MIXED, SAS). Arginine and histidine are also aphid essential amino acids, but they were not found in the samples. We assessed effects of the water treatment on the relative concentration of specific sugars known to be altered by osmotic adjustment. These included the polyols mannitol, myo-inositol, and glycerol, and the soluble sugars sucrose, glucose, and fructose (Marček et al., 2019). Effects of plant water treatment on the relative concentration of each sugar was assessed using one-way ANOVA with a Tukey-HSD test (PROC MIXED, SAS).
Experiment 5: Phytohormones and Associated Transcripts
We assessed the effects of aphids and water limitation on defense gene transcript expression and phytohormones. Sixty wheat plants were grown individually in 19.1 cm × 18.1 cm × 15.9 cm pots and randomly assigned to one of three treatments (well-watered, mild-stress, high-stress). Once all plants reached target water levels, a leaf sample was excised from five replicate plants of each treatment before aphid release. After this initial sample, 20 adult R. padi were added to each remaining plant, and five replicate plant samples were taken after 2, 7, and 14 days of aphid feeding. We thus had five replicate samples of each treatment from each of four timepoints. Plant samples were excised, and 150 mg of fresh plant tissue was pooled from multiple regions of the plant for each replicate. Plants were sampled once and discarded. Two separate sub-samples of plant material were taken from each plant at each timepoint for gene transcript expression and phytohormone analyses (n = 60 plants, 120 samples). These samples were placed into micro-centrifuge tubes, immediately flash-frozen in liquid nitrogen, and transferred to a −80°C freezer.
To assess impacts of water availability on phytohormones involved in plant responses to aphids and water stress, we assessed concentrations of jasmonic acid, salicylic acid, and abscisic acid. Jasmonic acid and salicylic acid regulate plant responses to herbivory and pathogens, while abscisic acid mediates plant response to water limitation (Osakabe et al., 2014; Züst and Agrawal, 2016). Plant samples were lyophilized for 48 h until dry and then weighed and ground to a fine powder, and then phytohormones were analyzed as previously described (Blundell et al., 2020; Patton et al., 2020). Briefly, 1 mL of phytohormone extraction buffer (2:1:0.005 of iso-propanol, HPLC grade H2O, and hydrochloric acid) spiked with deuterated standards of jasmonic acid (10 ng/μL), salicyclic acid (1,000 ng/μL), and abscisic acid (1,000 ng/μL) was added to each sample (Supplementary Table 1). Samples were then shaken for 1 min and centrifuged at 14,000 RPM for 20 min at 4°C. Supernatant of the centrifuged samples was transferred to new tubes containing 1 mL of dichloromethane, vortexed at 750 RPM for 30 min, and centrifuged at 12,000 RPM for 3 min at room temperature. 750 μL of dichloromethane layer containing the compounds of interest and the internal standards was removed, dried in a SpeedVac Concentrator (Savant Instruments Inc., Farmingdale, NY, United States), and resuspended in 200 μL of methanol.
To quantify extracted phytohormones, 5 μL of the extracted sample was injected to Dionex UHPLC system (Thermo Scientific, United States) with a Kinetix C18 column of particle size 1.7 μm, length 150 mm × 2.1 mm, 100 Å (Phenomenex, United States). Solvents used were deionized water + 0.1% formic acid (Solvent A) and acetonitrile + 0.1% formic acid (solvent B). Column temperature was 40°C at a flow rate of 0.5 mL min–1. The gradient used was isocratic for 1% (v/v) solvent B for 3 min, followed by linear increase of solvent B to 98% (v/v) for 17 min, followed by isocratic solvent B of 98% (v/v) for 5 min and a linear decrease of B to 1% (v/v) for 3 min. Hormones were detected in an Orbitrap-Q Exactive mass spectrometer (Thermo Scientific, United States) with a mass-to-charge scan range of 75–300 and polarity set as negative. Individual hormones were identified by their signature ions and retention times of the deuterated standards (Supplementary Table 1). Data were analyzed using the Xcalibur 3.0 program (Thermo Fisher Scientific Inc.). Relative amounts of JA, SA, and ABA were quantified by comparing endogenous phytohormone concentrations with 10 ng of JA internal standard and 1,000 ng of SA and ABA internal standards.
We also assessed expression of five gene transcripts related to phytohormones and callose, including a salicylic acid responsive gene (Pathogenesis-related protein 1, PR1), a jasmonic acid biosynthesis gene (12-oxophytodienoate reductases 3, OPR3), abscisic acid responsive genes (TaDHN3, Dehydrin 3), and a callose biosynthesis gene (1,3-beta-glucan synthase 8, GSL8). PR1 and TaDHN3 function downstream of associated hormones (Johnson et al., 2003; Hanin et al., 2011), OPR3 is an intermediate gene in the jasmonic acid biosynthesis pathway (Wang et al., 2021), and GSL8 is required in callose biosynthesis in many plant tissues (Chen et al., 2009).
To measure gene transcript expression, plant samples were ground with a mortar and pestle in liquid N2. 50 to 100 mg of tissue was used for RNA extraction using Promega SV total RNA isolation kits (Promega, Madison, WI, United States), and cDNA was synthesized from 1 μg of total RNA using Bio-Rad iScript cDNA synthesis kits. Five out of six primer pairs were used from already published papers (Supplementary Table 2) while TaGSL8 (DQ086485.1) forward and reverse primers (amplicon size 120 bp) were designed using PrimerQuest™ Tool, using appropriate conditions required for designing qRT-PCR primers. Efficiencies of all these primers were tested before using them for gene expression study in the qRT-PCR machine. Gene specific primers were used in qRT-PCR reactions (10 μl) with 3 μl of ddH2O, 5 μl of iTaq Univer SYBR Green Supermix, 1 μl of primer mix (forward and reverse), and 1 μl of diluted (1:25) cDNA template. The qRT-PCR program had an initial denaturation for 3 min at 95°C, 40 cycles of denaturation at 95°C for 15 s, annealing for 30 s at 60°C, and extension for 30 s at 72°C. For melting curves, a dissociation step cycle was used (55°C for 10 s, 0.5°C for 10 s until 95°C). The relative expression of genes were calculated using the delta-delta Ct method, (2–ΔΔCt) with Pisum sativum L. β-tubulin as a housekeeping gene (Livak and Schmittgen, 2001; Kozera and Rapacz, 2013; Basu et al., 2021).
We used generalized linear models to assess the effects of drought treatments across the different sampling times on gene transcript levels. Parameter estimates and subsequent calculations for delta-delta CT (2–ΔΔCt) were plot on log 10 scales. Response of abscisic acid concentrations to the water treatment and sampling day were assessed using linear mixed models (PROC MIXED, SAS); jasmonic acid and salicylic acid concentrations were also assessed using linear mixed models but with negative binomial distributions to meet assumptions (PROC GLIMMIX, SAS).
Results
Effects of Water Availability on Plant Water Potential
Across experiments, plant water potential declined with reduced water: Experiment 1 well-watered = −0.81 ± 0.11, mild-stress = −0.97 ± 0.10, high-stress = −1.31 ± 0.08; Experiment 2 well-watered = −0.62 ± 0.04 MPa, mild-stress = −1.10 ± 0.05 MPa, high-stress = −1.65 ± 0.05 MPa; Experiment 3 well-watered = −0.63 ± 0.06 MPa, mild-stress = −1.16 ± 0.06 MPa, high-stress = −1.22 ± 0.06 MPa; and Experiment 5 well-watered = −0.54 ± 0.03 MPa, mild-stress = −1.08 ± 0.03 MPa, high-stress = −1.37 ± 0.03 MPa (ANOVA, water treatment: F2,13 = 7.37, P < 0.01; F2,66 = 118.0, P < 0.01; F2,26 = 33.4, P < 0.01; and F2,57 = 147.9, P < 0.001, respectively).
Effects of Water Stress on Aphid Performance (Experiments 1 and 2)
Average daily nymph production decreased as water potential decreased and plants became more drought-stressed (linear regression, adjusted r2= 0.24, P = 0.03; Figure 1A). Aphid nymph production declined in response to even mild levels of water limitation (average daily nymph production; well-watered = 2.33 ± 0.33, mild-stress 75% = 1.26 ± 0.29, high-stress 50% = 1.08 ± 0.25). Fourteen days after aphid release, aphid abundance was also lower on drought-stressed compared to well-watered plants (repeated measures ANOVA, water treatment × time, F4,60 = 3.23, P = 0.02; Figure 1B). Aphid population growth rate declined with reduced water potential as plants became more drought-stressed (adjusted r2 = 0.52, P < 0.01; Figure 1C).
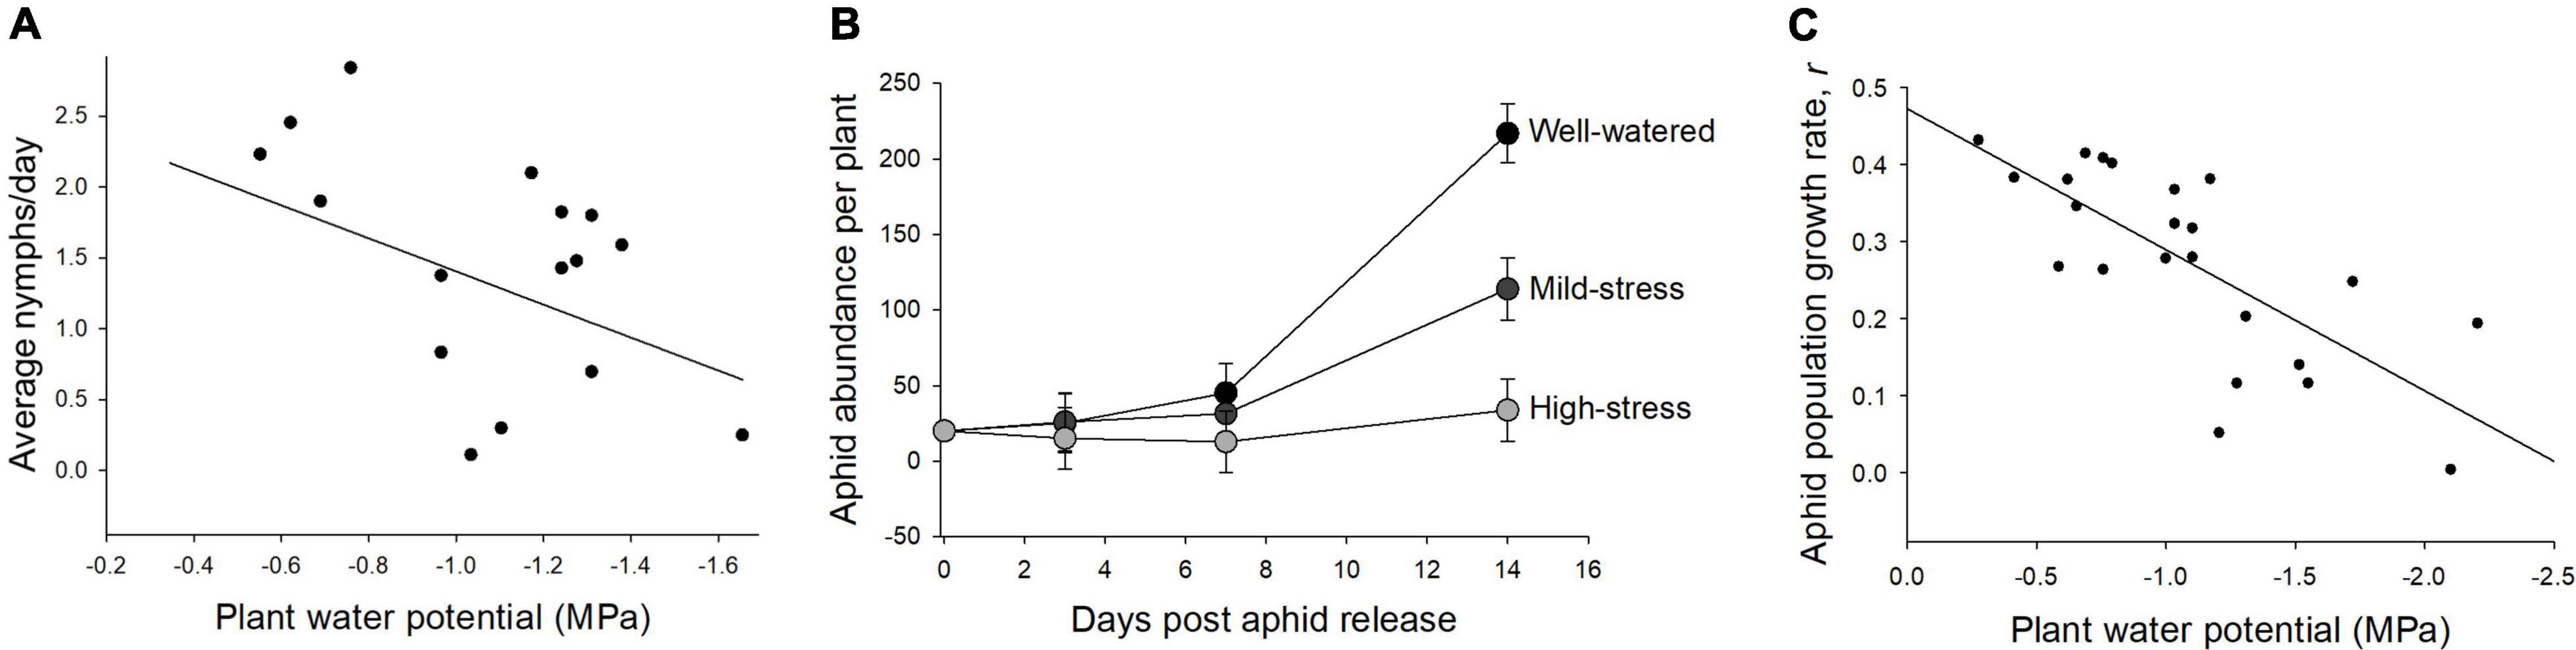
Figure 1. Aphid performance declined with increasing plant water stress. (A) Average aphid daily nymph production decreased as plant water potential decreased (adjusted r2= 0.24, P = 0.03). (B) Aphid abundance over time was highest in well-watered conditions, and lower in mild- and high-stress treatments. (C) The relationship between aphid population growth rate (adjusted r2 = 0.52, P < 0.01) and plant water potential. In panels (A,C), the x-axis was transposed so that water potential declines (plant stress increases) from left to right.
Effects of Water Stress on Plant Nutrients, Amino Acids, and Sugars (Experiments 3 and 4)
Water treatments did not significantly affect levels of nitrogen, phosphorous, potassium, calcium, magnesium, zinc, iron, or copper in plants. Only manganese levels in plant tissue were affected by water treatments (Kruskal–Wallis, water treatment, H(2) = 13.46, P < 0.01; Table 1), with highest levels of manganese in the well-watered treatment. Composition of free amino acids in plants were also not affected by water treatments (Supplementary Figure 1). However, the relative concentrations of the aphid essential amino acids lysine, methionine, phenylalanine, and tyrosine were reduced when plant water availability was limited (Figure 2, ANOVA, water treatment, lysine F2,12 = 4.23, P = 0.04, Figure 2D; methionine F2,12 = 11.66, P < 0.01 Figure 2E; phenylalanine F2,12 = 5.19, P = 0.02, Figure 2F; tyrosine F2,12 = 4.74, P = 0.03, Figure 2I).
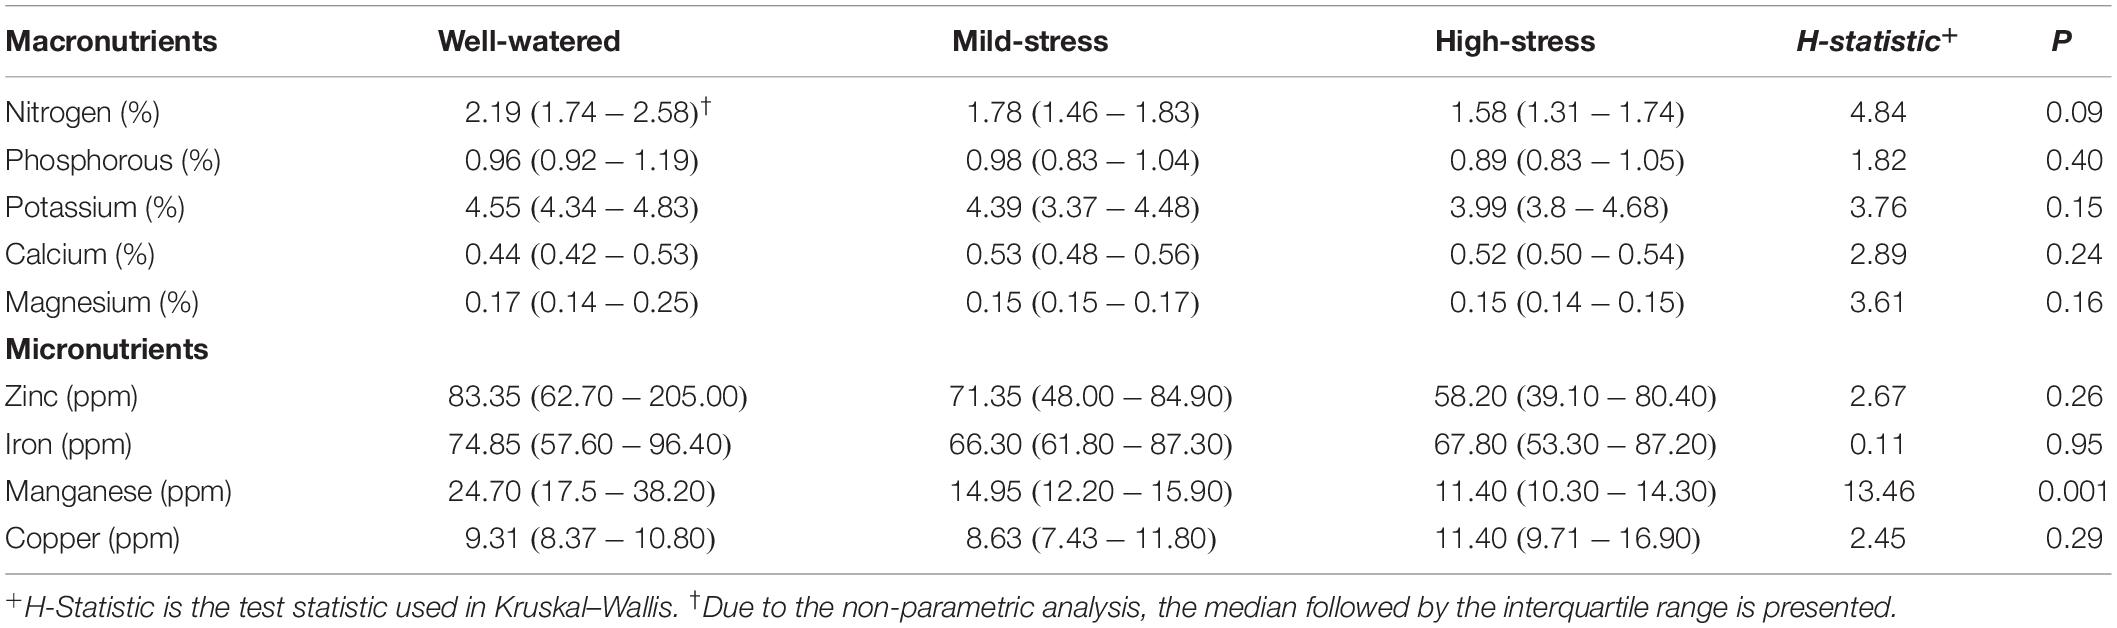
Table 1. Plant nutrients across watering treatments expressed as a percent or parts per million.
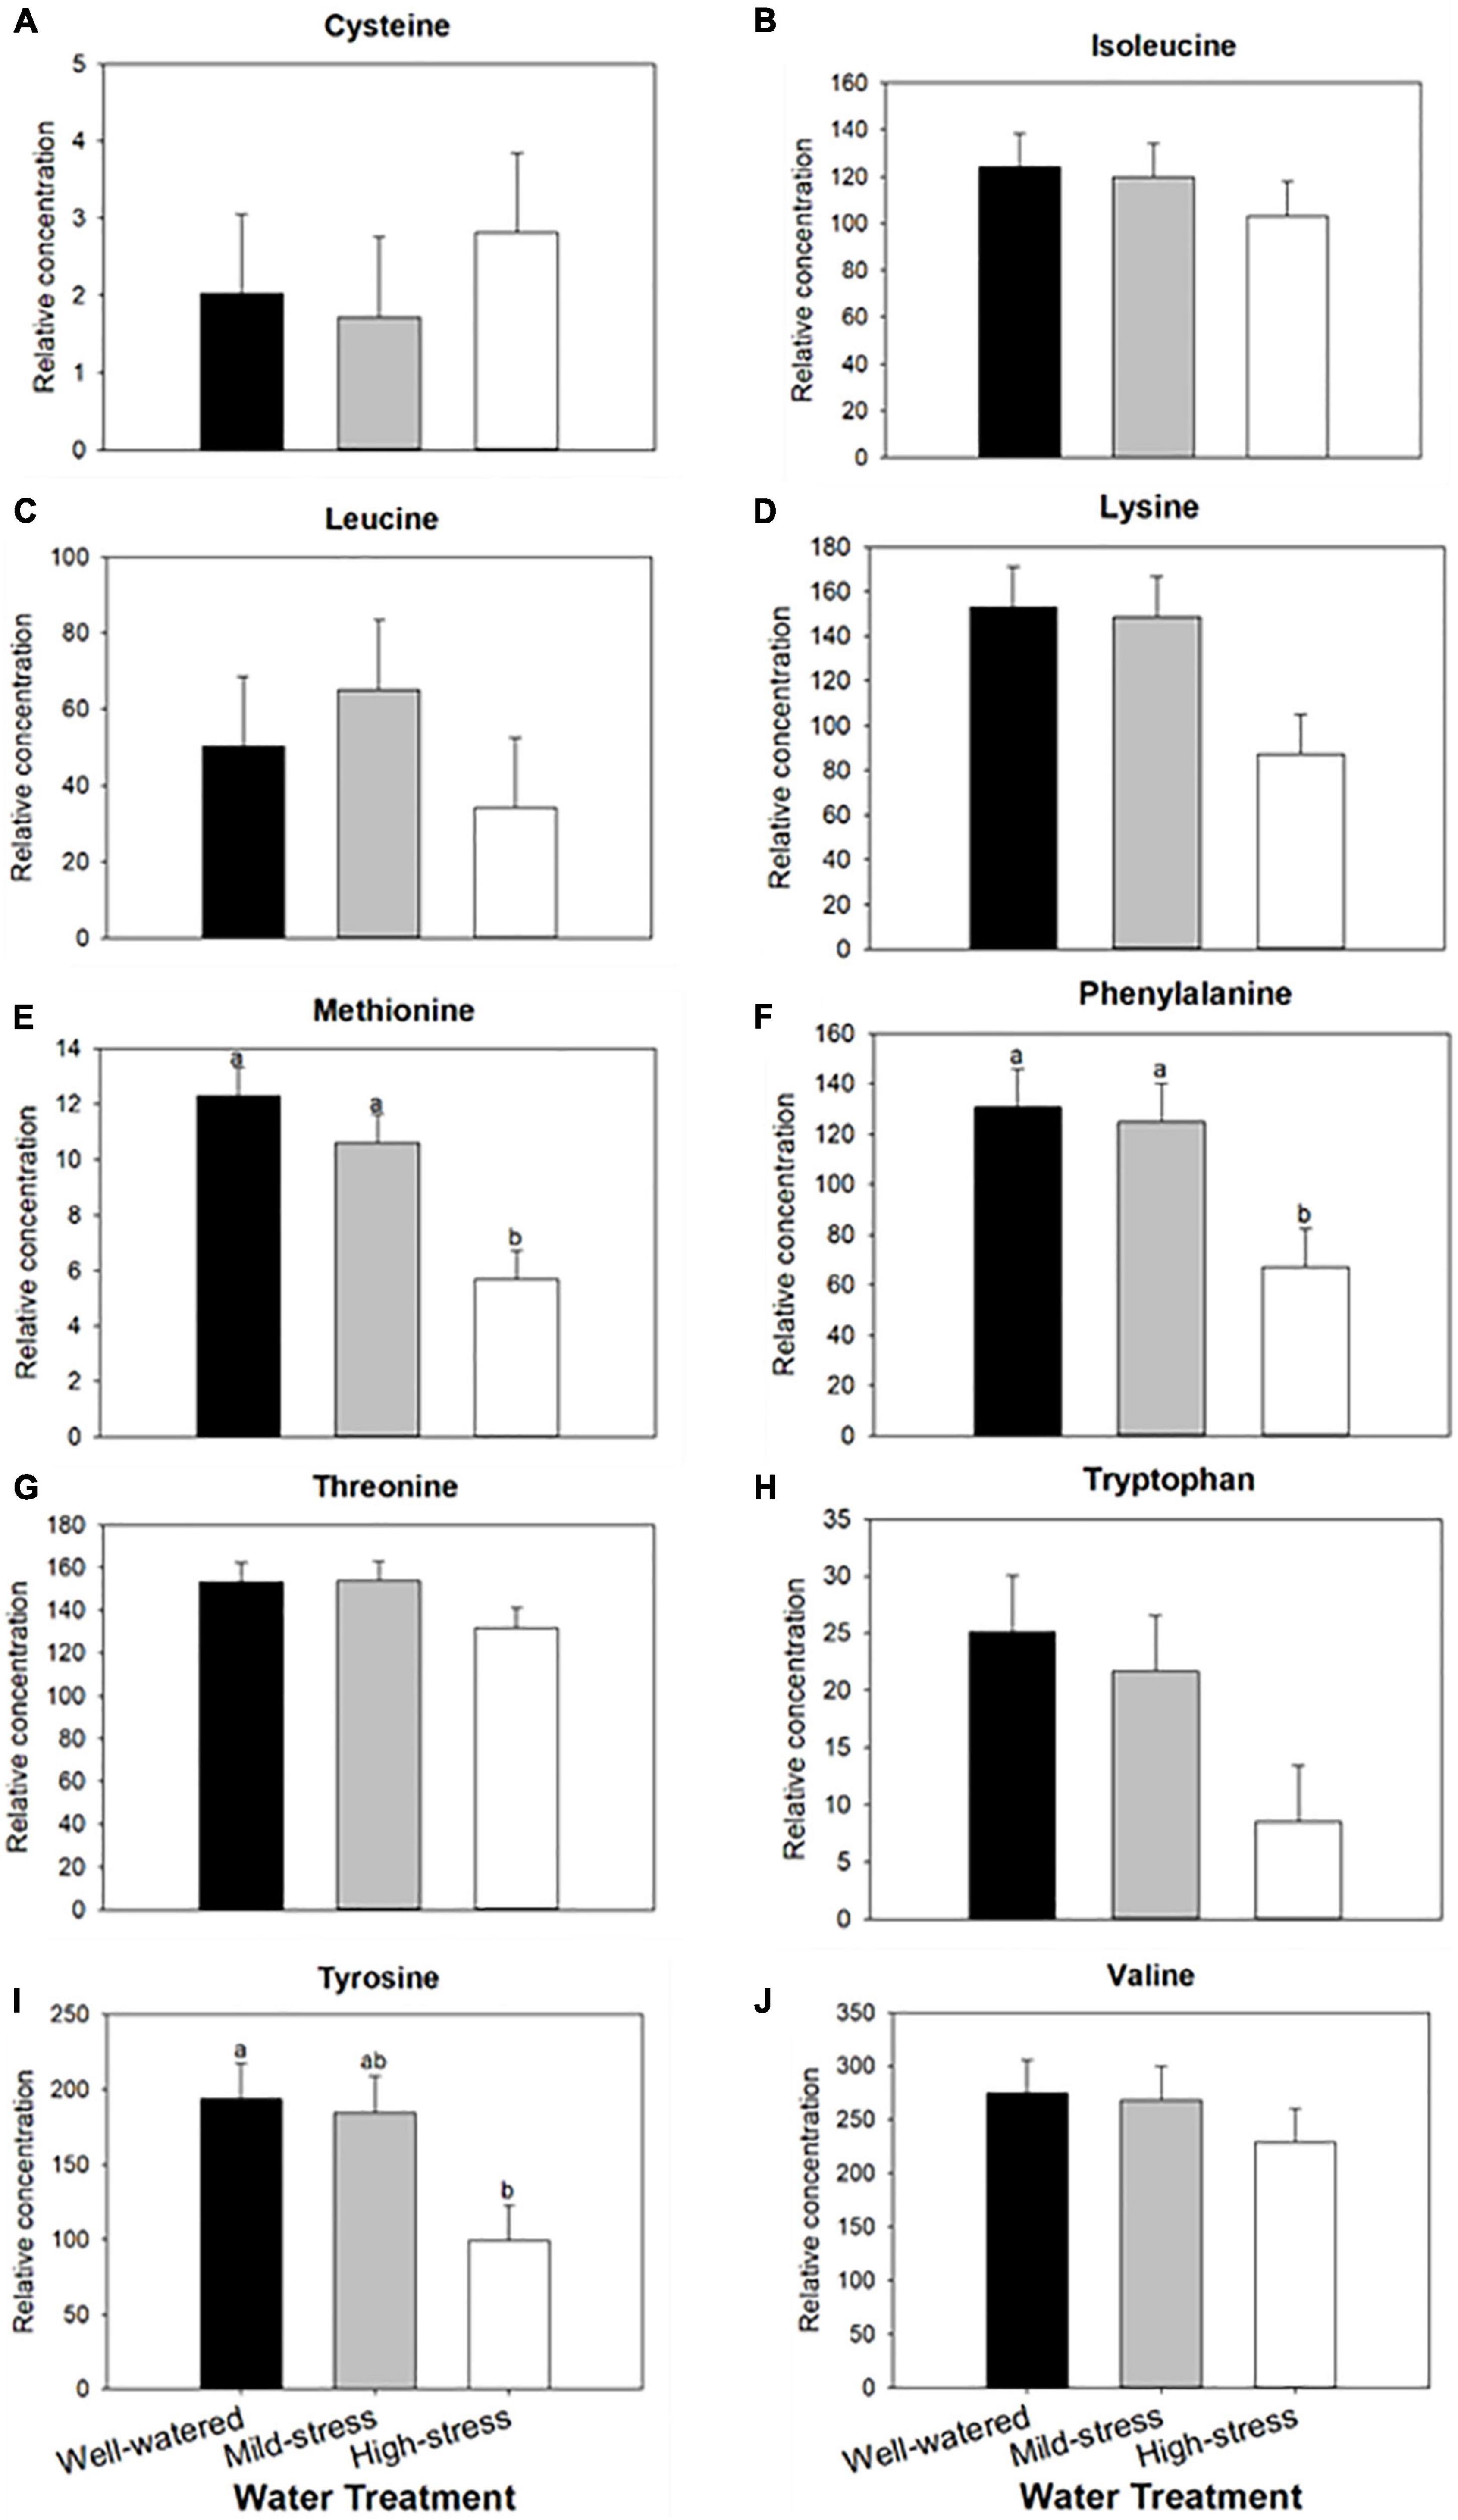
Figure 2. Effect of plant water treatment on the relative concentrations of plant amino acids. Levels (mean + SE, n = 15) of amino acids were measured in leaves of wheat plants that were subjected to well-watered, mild- and high- water stressed conditions. Amino acids tested are considered essential for aphids: (A) cysteine, (B) isoleucine, (C) leucine, (D) lysine, (E) methionine, (F) phenylalanine, (G) threonine, (H) tryptophan, (I) tyrosine, and (J) valine. Bars with different letters are significantly different based on α = 0.05 with a Tukey-HSD correction.
Composition of total sugars and polyols was not affected by water treatments (Supplementary Figure 2), but treatments did affect concentrations of myo-inositol, glycerol, and sucrose (Figure 3, ANOVA, water treatment, F2,12 = 4.92, P = 0.03, Figure 3B; F2,12 = 20.81, P < 0.01, Figure 3C; F2,12 = 3.95, P = 0.04, Figure 3D; respectively). Myo-inositol concentrations were reduced as plant water limitation became more severe, but sucrose concentration increased in stressed plants. Glycerol increased under mild-stress conditions and was the lowest under high stress conditions. No other sugars were affected by plant water treatments.
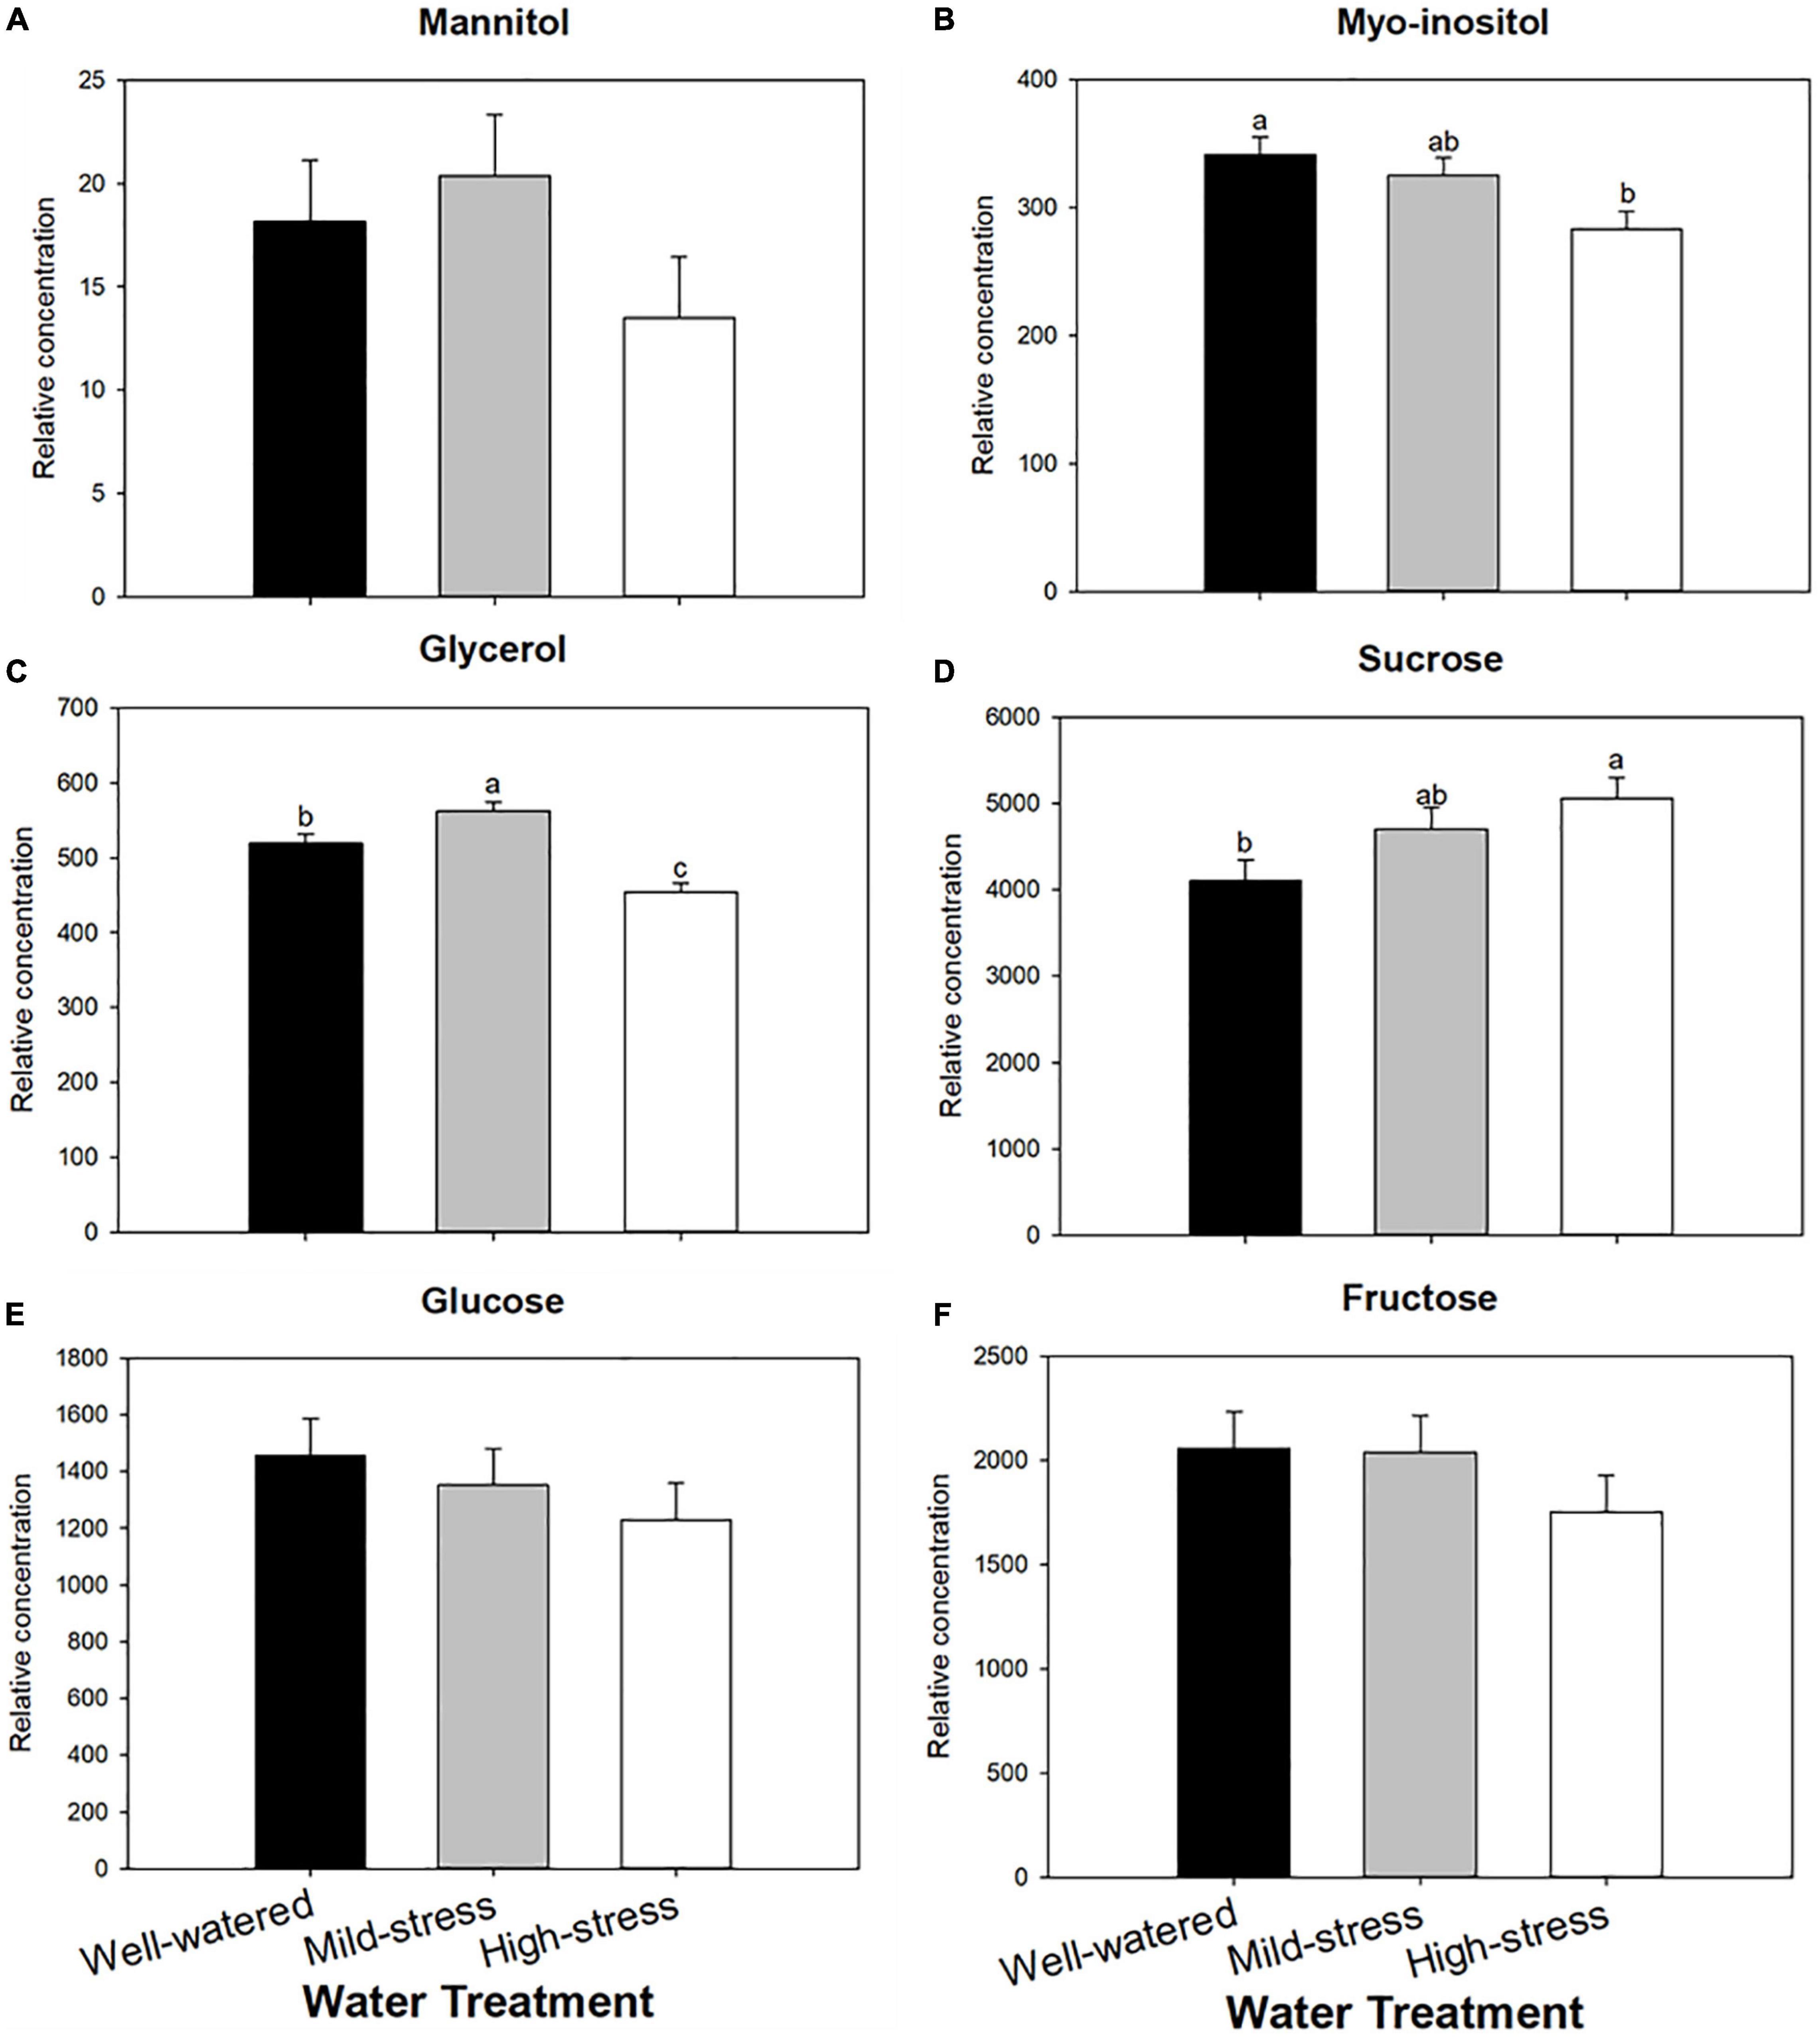
Figure 3. Effect of plant water treatment on relative concentrations of wheat osmolytes. Levels (mean + SE, n = 15) of osmolytes were measured in leaves of wheat plants that were subjected to well-watered, mild- and high- water stressed conditions. Shown are polypols (A) mannitol, (B) myo-inositol, (C) glycerol, and soluble sugars (D) sucrose, (E) glucose, (F) fructose. Bars with different letters are significantly different based on α = 0.05 with a Tukey-HSD correction.
Effects of Water Stress on Phytohormones and Associated Gene Transcripts (Experiment 5)
Phytohormones and associated gene transcripts were affected by plant water treatment and time. Levels of abscisic acid were significantly affected by both watering treatment and sample day, with the highest concentrations occurring in plants with the greatest water limitation (repeated measures ANOVA, water treatment, F2,47 = 19.44, P < 0.01; time, F3,47 = 6.60, P < 0.01; Figure 4A). This trend was reflected in expression of the abscisic acid-associated TaDHN3 gene transcript, but expression was only significantly higher 7 days after aphid release and expression appeared to decrease over time (Figure 4B). Jasmonic acid concentrations were significantly affected by interactions between water treatment and sampling day (repeated measures ANOVA, water treatment × sampling day F6,47 = 4.56, P < 0.01; Figure 4C), but no consistent pattern emerged in response to water limitation. However, there was an increase in jasmonic acid with aphid feeding in the well-watered treatment after 14 days. Relative expression of the jasmonic acid-associated TaOPR3 gene transcript was not significantly affected by water limitation (Figure 4D). Salicylic acid concentrations were significantly affected by the interaction between water treatment and sampling day (repeated measures ANOVA, water treatment × sampling day, F6,47 = 2.67, P = 0.03; Figure 4E). Salicylic acid concentrations were highest with the lowest water availability (Figure 4E), however, salicylic acid also increased under well-watered conditions after 14 days of aphid feeding. The relative expression of PR1 was affected by the water treatment after 1 week of aphid feeding (Figure 4F). Relative expression of the callose associated GSL8 gene transcript also increased in both mildly and highly stressed plants after 14 days of herbivory (χ2 = 12.04, df = 2, P < 0.01; Figure 5).
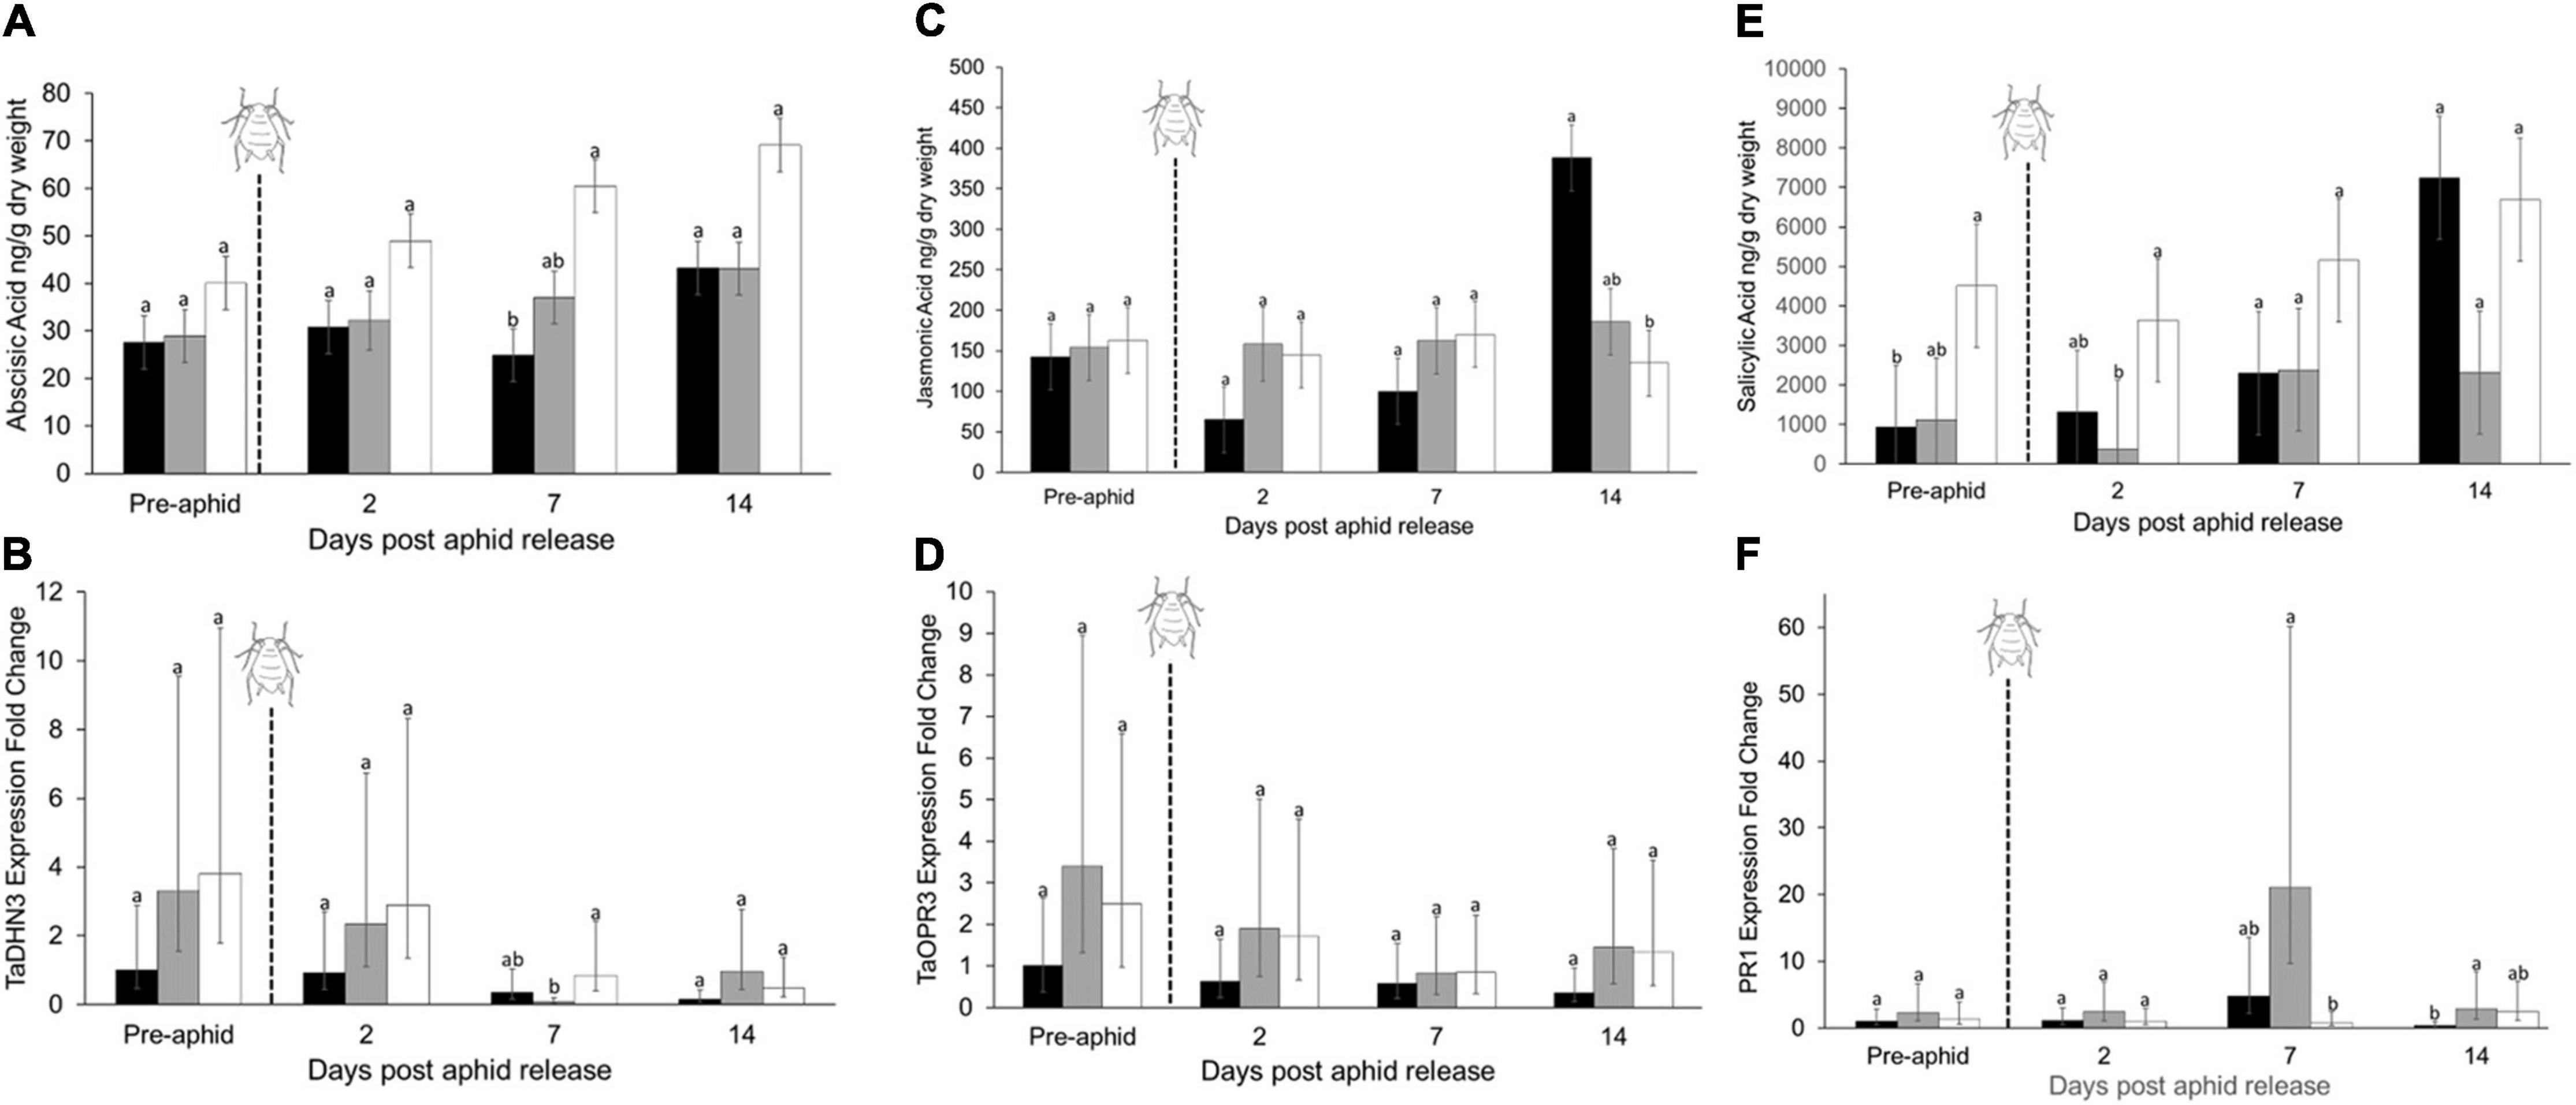
Figure 4. Effect of plant water treatment and aphid herbivory on phytohormones and their associated gene transcripts. Levels (mean + SE, n = 60) of phytohormones and relative gene expression were measured in leaves of wheat plants that were subjected to well-watered, mild- and high- water stressed conditions at four different time points (n = 5 replicates per treatment, per time point). Shown are (A) abscisic acid concentration, (B) the relative expression of abscisic acid-associated TaDNH3, (C) jasmonic acid concentration, (D) the relative expression of jasmonic acid-associated TaOPR3, (E) salicylic acid concentration, and (F) the relative expression of salicylic acid-associated PR1 over time. In all tests, aphids were added to the plants immediately following the first sample period (pre-aphid). Well-watered = black bars, mild-stress = gray bars, high-stress = white bars. Within each panel, differences between the treatments within each time point were tested using generalized linear models (gene expression) or ANOVA (phytohormones), with different letters are significantly different based on α = 0.05 with a Tukey-HSD correction.
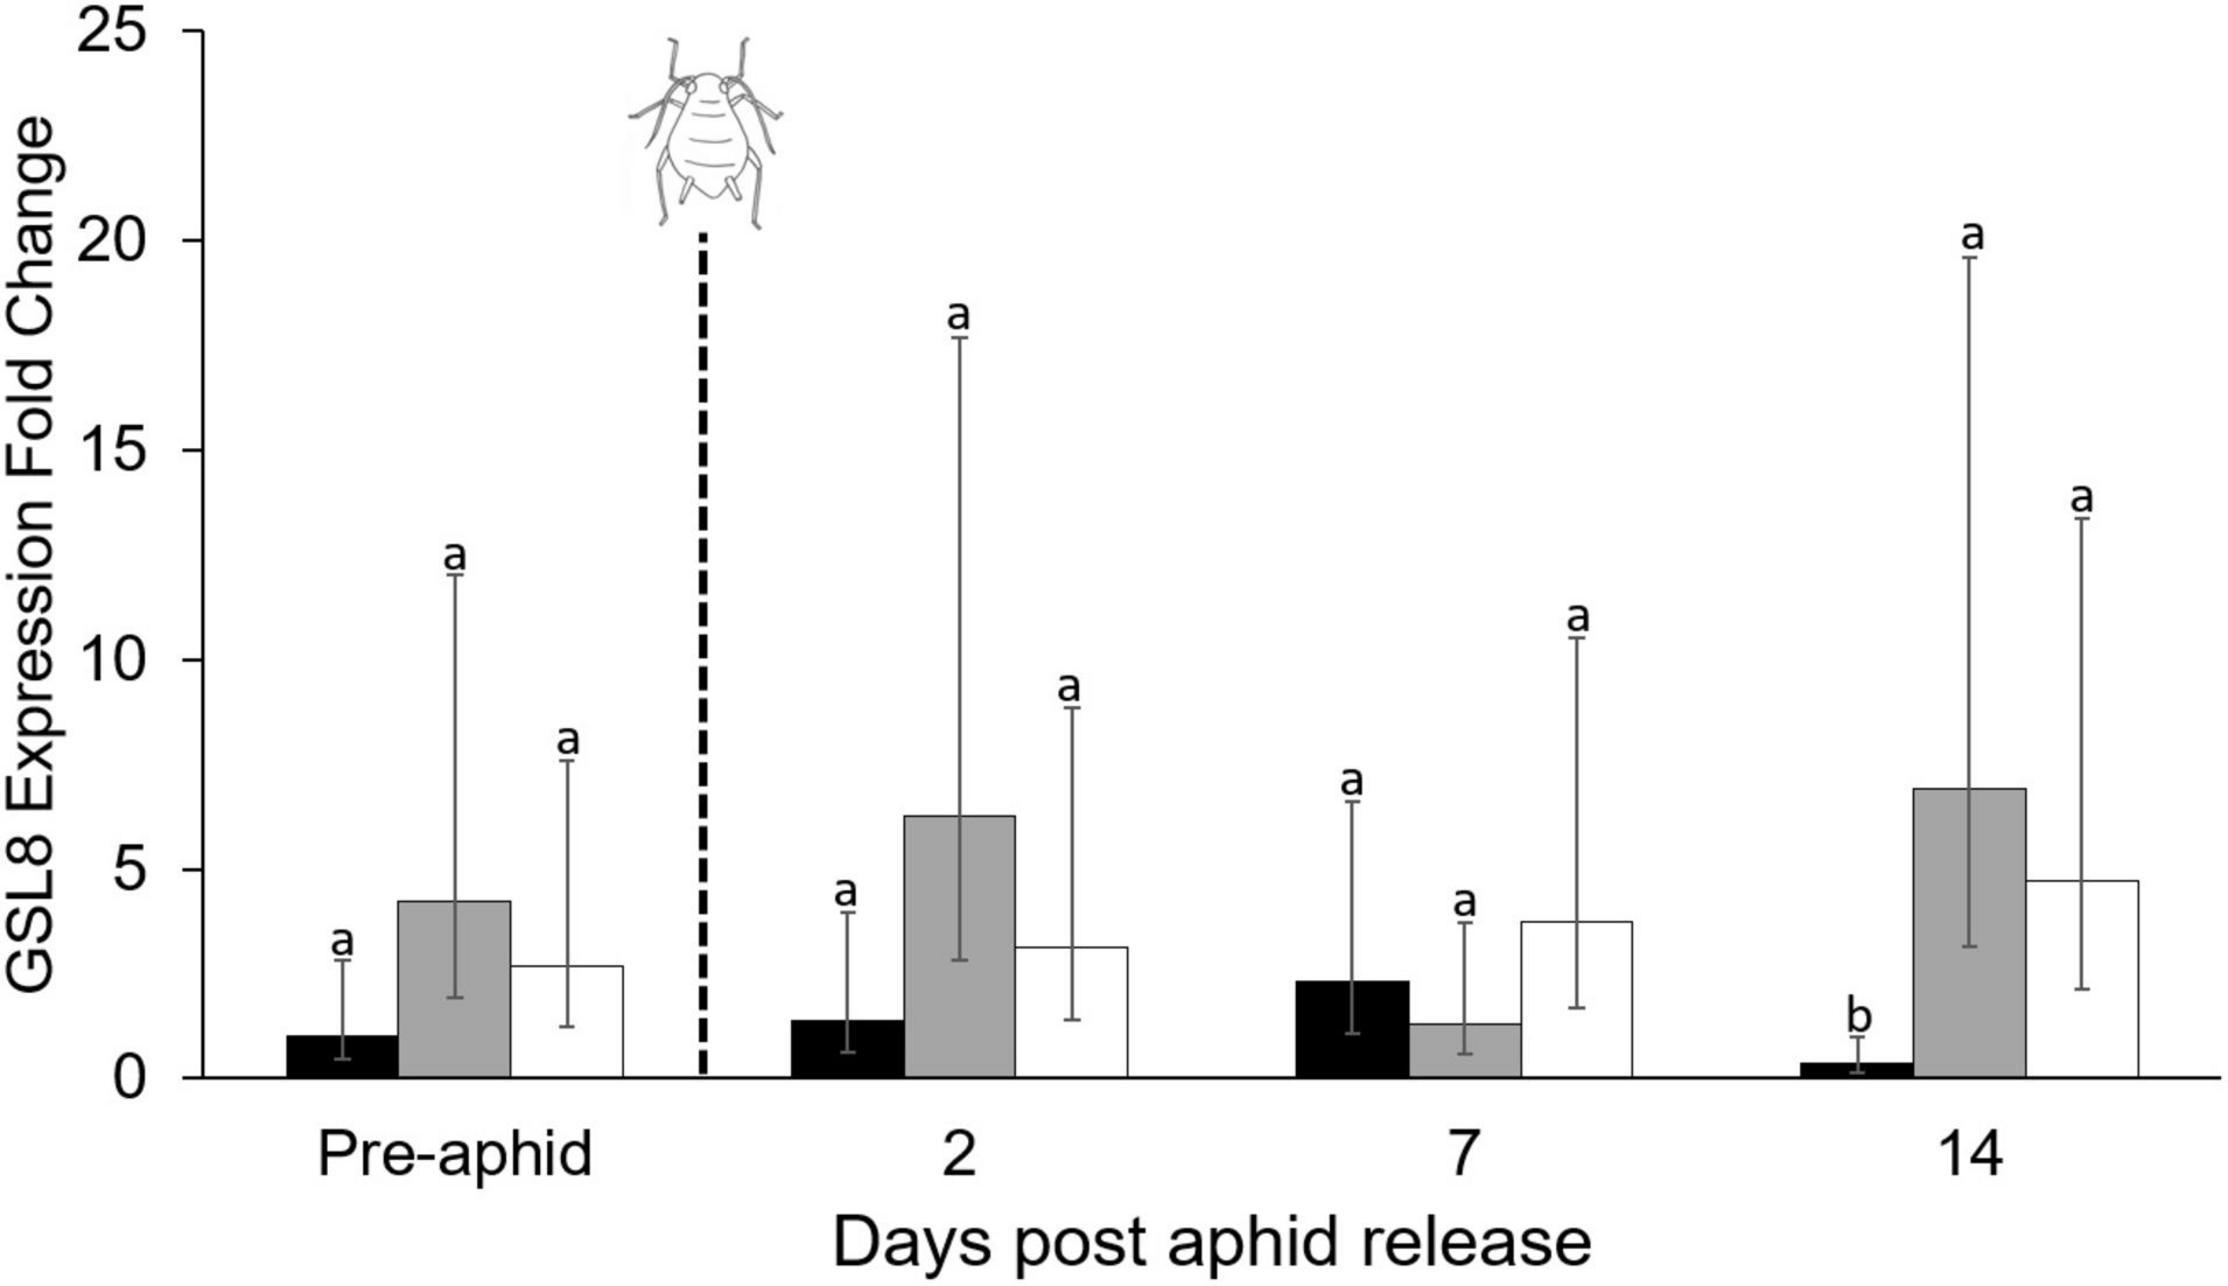
Figure 5. Effect of plant water treatment and aphid herbivory on the relative expression of the callose-associated gene transcript GSL8 over time. Gene expression (mean + SE, n = 60) was measured in leaves of wheat plants that were subjected to well-watered, mild- and high- water stressed conditions at four different time points (n = 5 replicates per treatment, per time point). Aphids were added to plants following the first sample period (pre-aphid). Well-watered = black bars, mild-stress = gray bars, high-stress = white bars. Differences between the treatments within each time point were tested using generalized linear models, and bars with different letters are significantly different based on α = 0.05 with a Tukey-HSD correction.
Discussion
Several hypotheses predict how insect herbivores will respond to plant water limitation due to changes in nitrogen availability (White, 1969; Larsson, 1989; Huberty and Denno, 2004; Price, 2019). However, water stress affects plant traits other than nitrogen availability that may alter herbivore performance. We show that R. padi performance was reduced when feeding on water-limited wheat. Despite predictions that water stress would increase nitrogen availability, plant stress reduced concentrations of essential amino acids and did not affect whole-plant nitrogen. Water-stressed plants did have increased sugar concentrations that may negatively affect aphid performance by decreasing feeding efficiency (Douglas, 2006). However, neither amino acid nor sugar concentration were affected by mild water stress. Concentrations of hormones jasmonic acid, salicylic acid, and abscisic acid were affected by water stress, which may negatively affect aphid performance due to plant defense induction. For example, relative expression of a callose biosynthesis gene increased under mild water stress. Our study shows that reduced aphid performance on mildly stressed plants is correlated with induced plant defense, whereas reduced performance on high-stress plants is correlated with both increased plant defenses and reduced plant nutrition (Figure 6).
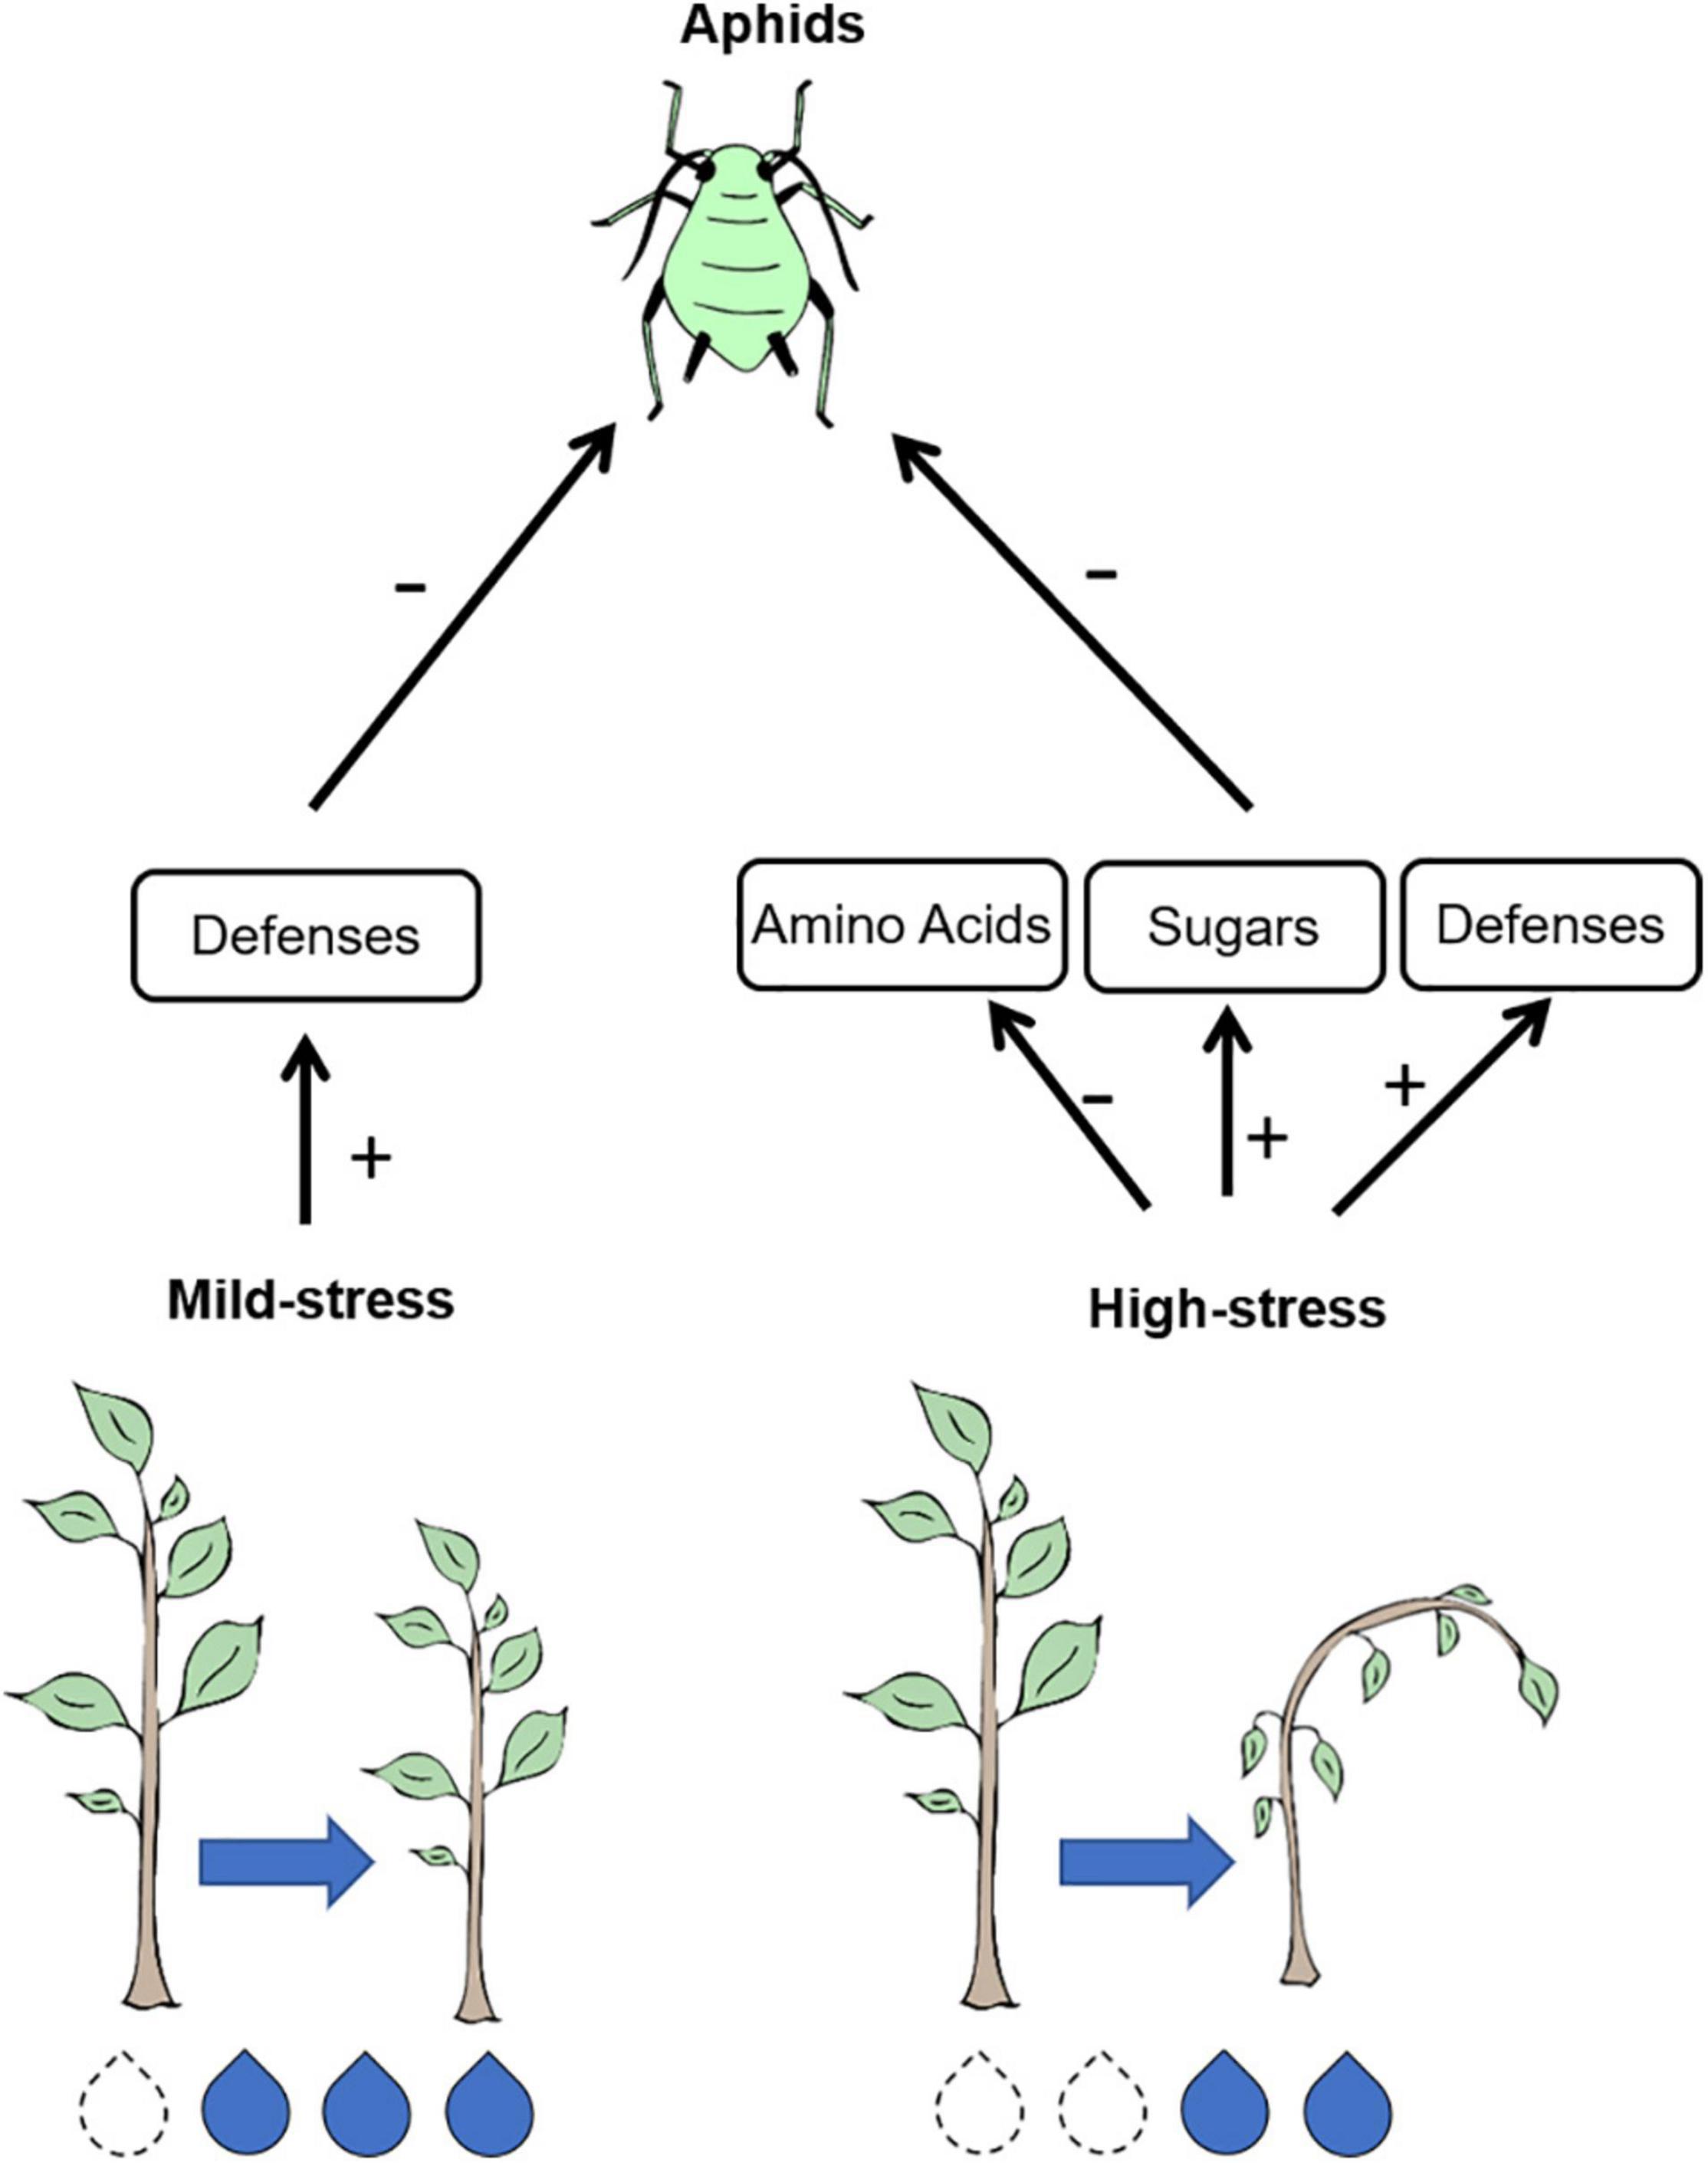
Figure 6. Aphid performance was negatively affected under any level of plant water stress, but the correlated changes in plant quality reliant on the intensity of water stress. Under mild levels of water stress, poor aphid performance was correlated with increased plant defenses, but no change in plant nutritional quality. Under high levels of water stress, poor aphid performance is correlated with lower amino acid concentrations, high sugar concentrations, and increased plant defenses.
Although insect herbivores are predicted to benefit from feeding on drought-stressed plants if nitrogen increases (White, 1969), this was not observed in our study. Rather, we saw a decline in four essential amino acids: lysine, methionine, phenylalanine, and tyrosine. Lysine, methionine, and tyrosine are limiting for R. padi feeding on wheat (Sandström and Moran, 2001), while phenylalanine and tyrosine are products of shikimate pathways that are also required for synthesis of salicylic acid. As high water limitation increased salicylic acid, this may have caused reduced production of phenylalanine and tyrosine (Sheflin et al., 2019). Unlike some other aphids, R. padi cannot manipulate plant phloem quality, making them highly sensitive to changes in plant quality (Sandström et al., 2000). Moreover, reduced concentrations of limiting amino acids for R. padi could contribute to the reduced performance on water-limited hosts.
Plant water limitation also increased sugar concentrations. Sucrose is the most abundant soluble sugar in phloem, and high sucrose concentrations can negatively affect aphid reproduction (Wilkinson et al., 1997). Mewis et al. (2012) noted significant increases in sucrose concentrations on drought-stressed Arabidopsis, but only after prolonged water stress (Mewis et al., 2012). Aphid feeding efficiency on water-stressed plants can also be altered by reduced phloem turgor pressure (Auclair, 1963; Huberty and Denno, 2004), as many of these insects rely on phloem pressure to feed (Auclair, 1963). Although we did not assess turgor pressure directly, we have found reduced honeydew production on water-limited hosts, evidence that R. padi feeding efficiency is impaired (Kansman et al., 2020). Understanding how modified sugar concentrations and turgor pressure under plant water stress directly affect aphid feeding efficiency is critical information that is currently lacking in this field of study.
Plant defensive chemistry is another mediator of aphid performance. Drought stress and aphid feeding independently induce hormone pathways that can provide plants defense against aphids, such as the salicylic acid and jasmonic acid pathways (Moran and Thompson, 2001; Patton et al., 2020). Aphid performance declined on water-stressed plants, and we predicted that drought-induced abscisic acid would have a synergistic impact on jasmonic acid. While salicylic acid and jasmonic acid increased with aphid feeding over time in the well-watered treatment, we saw a reduction in jasmonic acid with aphid feeding on the water-limited plants. Synergism between abscisic acid and jasmonic acid is reliant on the tissue, stress, and development stage of the plant, and some situations can result in antagonistic interactions (Nguyen et al., 2016). Further, aphid herbivory was present in all of the treatments, and drought inhibits the induction of jasmonic acid in response to herbivory (Casteel et al., 2012).
We did find that salicylic acid concentrations were consistently high in the high-stress treatment, which could increase plant tolerance to aphids (Züst and Agrawal, 2016). Although salicylic acid did not increase in the mild water limitation treatments, reduced aphid performance under mild-stress conditions may result from increased callose production. A 25% reduction in water availability as compared to well-watered conditions increased levels of callose-associated transcript expression. Callose is known to affect aphid feeding ability by thickening cell walls and restricting phloem access (Nalam et al., 2019). While we did not measure amino acids in aphids directly (only in plant tissue), increased callose may have further impeded aphids from obtaining essential nutrients on water-stressed plants, limiting aphid performance. Thus, even low levels of plant stress may affect plant chemistry in ways that reduce aphid performance.
Overall, we show plant water limitation reduced aphid performance, a result comparable to studies across plant and aphid species (Leybourne et al., 2021). Reduced aphid performance on highly stressed plants could result from reduced amino acids, increased sucrose, and/or increased plant defenses. However, under mild-stress conditions, only plant defenses were affected by water stress. This suggests plant defenses may play a role in mediating aphid performance on mildly water-stressed plants. To date, few studies have assessed how the severity of plant water limitation affects herbivore performance and plant quality (Walter, 2018). Our study suggests that understanding how abiotic stress intensity influences plant-herbivore interactions is key to furthering our understanding of how herbivore populations will respond to future climate change.
Data Availability Statement
The datasets generated during and/or analyzed during the current study are available from the corresponding author on reasonable request.
Author Contributions
JK and DF conceived of the experiments. JK was responsible for the majority of data collection and analysis, and the primary writing with guidance of DF. SB, CC, DC, CN, and BL were responsible for remaining data analysis and interpretation, and assisted with revisions of the manuscript. All authors contributed to the article and approved the submitted version.
Funding
This work was supported by the University of Missouri Research Board and USDA NIFA MO-HAPS0006 to DF, the USDA AFRI EWD Program #2019-67011-29729 to JK, and the Defense Advanced Research Projects Agency (DARPA) agreement HR0011-17-2-0053 and United States National Science Foundation award #1723926 to CC.
Conflict of Interest
The authors declare that the research was conducted in the absence of any commercial or financial relationships that could be construed as a potential conflict of interest.
Publisher’s Note
All claims expressed in this article are solely those of the authors and do not necessarily represent those of their affiliated organizations, or those of the publisher, the editors and the reviewers. Any product that may be evaluated in this article, or claim that may be made by its manufacturer, is not guaranteed or endorsed by the publisher.
Acknowledgments
We thank the reviewers for their comments on this manuscript. We thank B. Hibbard, F. Fritschi, and A. Koo for contributing to the research and manuscript. We also thank H. Smith, N. Rector, N. Preuss, and J. Brabant for assistance conducting experiments.
Supplementary Material
The Supplementary Material for this article can be found online at: https://www.frontiersin.org/articles/10.3389/fevo.2022.846908/full#supplementary-material
References
Ahmed, I. M., Nadira, U. A., Bibi, N., Cao, F., He, X., Zhang, G., et al. (2015). Secondary metabolism and antioxidants are involved in the tolerance to drought and salinity, separately and combined, in tibetan wild barley. Environ. Exp. Bot. 111, 1–12.
Auclair, J. L. (1963). Aphid feeding and nutrition. Annu. Rev. Entomol. 8, 439–490. doi: 10.1146/annurev.en.08.010163.002255
Banfield-Zanin, J. A., and Leather, S. R. (2015). Drought intensity and frequency have contrasting effects on development time and survival of the green spruce aphid. Agric. For. Entomol. 17, 309–316. doi: 10.1111/afe.12109
Basu, S., Clark, R. E., Blundell, R., Casteel, C. L., Charlton, A. M., and Crowder, D. W. (2021). Reciprocal plant-mediated antagonism between a legume plant virus and soil rhizobia. Funct. Ecol. 35, 2045–2055.
Blundell, R., Schmidt, J. E., Igwe, A., Cheung, A. L., Vannette, R. L., Gaudin, A. C. M., et al. (2020). Organic management promotes natural pest control through altered plant resistance to insects. Nat. Plants 6, 483–491. doi: 10.1038/s41477-020-0656-9
Casteel, C. L., Niziolek, O. K., Leakey, A. D. B., Berenbaum, M. R., and DeLucia, E. H. (2012). Effects of elevated CO2 and soil water content on phytohormone transcript induction in Glycine max after Popillia japonica feeding. Arthropod. Plant. Interact. 6, 439–447. doi: 10.1007/s11829-012-9195-2
Chen, X. Y., Liu, L., Lee, E. K., Han, X., Rim, Y., Chu, H., et al. (2009). The Arabidopsis callose synthase gene gsl8 is required for cytokinesis and cell patterning. Plant Physiol. 150, 105–113. doi: 10.1104/pp.108.133918
Douglas, A. E. (2006). Phloem-sap feeding by animals: Problems and solutions. J. Exp. Bot. 57, 747–754. doi: 10.1093/jxb/erj067
English-loeb, G., Stout, M. J., and Duffey, S. S. (1997). Drought stress in tomatoes: changes in plant chemistry and potential nonlinear consequences for insect herbivores. Oikos 79, 456–468.
Hale, B. K., Bale, J. S., Pritchard, J., Masters, G. J., and Brown, V. K. (2003). Effects of host plant drought stress on the performance of the bird cherry-oat aphid. Ecol. Entomol. 28, 666–677. doi: 10.1111/j.1365-2311.2003.00563.x
Hamann, E., Blevins, C., Franks, S. J., Jameel, M. I., and Anderson, J. T. (2021). Climate change alters plant–herbivore interactions. New Phytol. 229, 1894–1910. doi: 10.1111/nph.17036
Hanin, M., Brini, F., Ebel, C., Toda, Y., Takeda, S., and Masmoudi, K. (2011). Plant dehydrins and stress tolerance. Plant Signal. Behav. 6, 1503–1509. doi: 10.4161/psb.6.10.17088
Huberty, A. F., and Denno, R. F. (2004). Plant water stress and its consequences for herbivorous insects: a new synthesis. Ecology 85, 1383–1398. doi: 10.1890/03-0352
Inbar, M., Doostdar, H., and Mayer, R. T. (2001). Suitability of stressed and vigorous plants to various insect herbivores. Oikos 94, 228–235. doi: 10.1034/j.1600-0706.2001.940203.x
Johnson, C., Boden, E., and Arias, J. (2003). Salicylic acid and NPR1 induce the recruitment of trans-activating TGA factors to a defense gene promoter in arabidopsis. Plant Cell 15, 1846–1858. doi: 10.1105/tpc.012211
Johnson, S. N., Staley, J. T., McLeod, F. A. L., and Hartley, S. E. (2011). Plant-mediated effects of soil invertebrates and summer drought on above-ground multitrophic interactions. J. Ecol. 99, 57–65. doi: 10.1111/j.1365-2745.2010.01748.x
Kansman, J., Nalam, V., Nachappa, P., and Finke, D. (2020). Plant water stress intensity mediates aphid host choice and feeding behaviour. Ecol. Entomol. 45, 1437–1444. doi: 10.1111/een.12928
Khan, M. A. M., Ulrichs, C., and Mewis, I. (2010). Influence of water stress on the glucosinolate profile of brassica oleracea var. italica and the performance of brevicoryne brassicae and myzus persicae. Entomol. Exp. Appl. 137, 229–236. doi: 10.1111/j.1570-7458.2010.01059.x
Kozera, B., and Rapacz, M. (2013). Reference genes in real-time PCR. J. Appl. Genet. 54, 391–406. doi: 10.1007/s13353-013-0173-x
Lachat (1993). Total Kjeldahl Nitrogen in Soils and Plants. Quickchem Method 10-115-01-1-A. Milwaukee U.S.: Lachat Instrument Company, 1990.
Larsson, S. (1989). Stressful times for the Plant Stress. Oikos: Insect Performance hypothesis, doi: 10.2307/3565348
Leybourne, D. J., Preedy, K. F., Valentine, T. A., Bos, J. I. B., and Karley, A. J. (2021). Drought has negative consequences on aphid fitness and plant vigor: insights from a meta– analysis. Ecol Evol. 11, 11915–11929. doi: 10.1002/ece3.7957
Lin, P.-A., Paudel, S., Afzal, A., Shedd, N. L., and Felton, G. W. (2021). Changes in tolerance and resistance of a plant to insect herbivores under variable water availability. Environ. Exp. Bot 183:104334.
Livak, K. J., and Schmittgen, T. D. (2001). Analysis of relative gene expression data using real-time quantitative PCR and the 2–Δ Δ CT method. Methods 25, 402–408. doi: 10.1006/meth.2001.1262
Marček, T., Hamow, K., Végh, B., Janda, T., and Darko, E. (2019). Metabolic response to drought in six winter wheat genotypes. PLoS One 14:e0212411. doi: 10.1371/journal.pone.0212411
Mattson, W. J., and Haack, R. A. (1987). Role of drought in outbreaks of plant-eating insects. Bioscience 37, 110–118.
Mewis, I., Khan, M. A. M., Glawischnig, E., Schreiner, M., and Ulrichs, C. (2012). Water stress and aphid feeding differentially influence metabolite composition in Arabidopsis thaliana (L.). PLoS One 7:e48661. doi: 10.1371/journal.pone.0048661
Mody, K., Eichenberger, D., and Dorn, S. (2009). Stress magnitude matters: different intensities of pulsed water stress produce non-monotonic resistance responses of host plants to insect herbivores. Ecol. Entomol. 34, 133–143. doi: 10.1111/j.1365-2311.2008.01053.x
Moran, P. J., and Thompson, G. A. (2001). Molecular responses to aphid feeding in arabidopsis in relation to plant defense pathways. Plant Physiol. 125, 1074–1085. doi: 10.1104/pp.125.2.1074
Nalam, V., Louis, J., and Shah, J. (2019). Plant defense against aphids, the pest extraordinaire. Plant Sci. 279, 96–107. doi: 10.1016/j.plantsci.2018.04.027
Nathan, M., Stecker, J., and Sun, Y. (2006). Soil testing. A guide for Conducting Soil Tests in Missouri. Ec923. Division of Plant Science Extension. Columbia, MO: University of Missouri-Columbia.
Nelson, E. H., Hogg, B. N., Mills, N. J., and Daane, K. M. (2012). Syrphid flies suppress lettuce aphids. BioControl 57, 819–826.
Nguyen, D., Rieu, I., Mariani, C., and van Dam, N. M. (2016). How plants handle multiple stresses: hormonal interactions underlying responses to abiotic stress and insect herbivory. Plant Mol. Biol. 91, 727–740. doi: 10.1007/s11103-016-0481-8
Osakabe, Y., Osakabe, K., Shinozaki, K., and Tran, L. S. P. (2014). Response of plants to water stress. Front. Plant Sci. 5:1–8. doi: 10.3389/fpls.2014.00086
Patton, M. F., Bak, A., Sayre, J. M., Heck, M. L., and Casteel, C. L. (2020). A polerovirus, Potato leafroll virus, alters plant–vector interactions using three viral proteins. Plant. Cell Env. 43, 387–399.
Pineda, A., Pangesti, N., Soler, R., Dam, N. M., Van, Loon, J. J. A., et al. (2016). Negative impact of drought stress on a generalist leaf chewer and a phloem feeder is associated with, but not explained by an increase in herbivore-induced indole glucosinolates. Env. Exp. Bot. 123, 88–97. doi: 10.1016/j.envexpbot.2015.11.007
Sandström, J., and Moran, N. (1999). How nutritionally imbalanced is phloem sap for aphids? Entomol. Exp. Appl. 91, 203–210. doi: 10.1046/j.1570-7458.1999.00485.x
Sandström, J., Telang, A., and Moran, N. A. (2000). Nutritional enhancement of host plants by aphids — a comparison of three aphid species on grasses. J. Insect Physiol 46, 33–40.
Sandström, J. P., and Moran, N. A. (2001). Amino acid budgets in three aphid species using the same host plant. Physiol. Entomol 26, 202–211.
Sconiers, W. B., Rowland, D. L., and Eubanks, M. D. (2020). Pulsed drought: the effects of varying water stress on plant physiology and predicting herbivore response. Crop Sci. 60, 2543–2561. doi: 10.1002/csc2.20235
Sheflin, A. M., Chiniquy, D., Yuan, C., Goren, E., Kumar, I., Braud, M., et al. (2019). Metabolomics of sorghum roots during nitrogen stress reveals compromised metabolic capacity for salicylic acid biosynthesis. Plant Direct. 3:e00122.
Tariq, M., Wright, D. J., Rossiter, J. T., and Staley, J. T. (2012). Aphids in a changing world: Testing the plant stress, plant vigour and pulsed stress hypotheses. Agric. For. Entomol. 14, 177–185. doi: 10.1111/j.1461-9563.2011.00557.x
Walter, J. (2018). Effects of changes in soil moisture and precipitation patterns on plant-mediated biotic interactions in terrestrial ecosystems. Plant Ecol. 219, 1449–1462. doi: 10.1007/s11258-018-0893-4
Wang, Y., Mostafa, S., Zeng, W., and Jin, B. (2021). Function and mechanism of jasmonic acid in plant responses to abiotic and biotic stresses. Int. J. Mol. Sci 22:8568. doi: 10.3390/ijms22168568
White, T. C. R. (1969). An index to measure weather-induced stress of trees associated with outbreaks of psyllids in Australia. Ecology 50, 905–909. doi: 10.2307/1933707
Wilkinson, T., Ashford, D., Pritchard, J., and Douglas, A. (1997). Honeydew sugars and osmoregulation in the pea aphid Acyrthosiphon pisum. J. Exp. Biol 200, 2137–2143.
Keywords: Rhopalosiphum padi, Triticum aestivum, drought, plant nutrients, plant defenses
Citation: Kansman JT, Basu S, Casteel CL, Crowder DW, Lee BW, Nihranz CT and Finke DL (2022) Plant Water Stress Reduces Aphid Performance: Exploring Mechanisms Driven by Water Stress Intensity. Front. Ecol. Evol. 10:846908. doi: 10.3389/fevo.2022.846908
Received: 31 December 2021; Accepted: 11 March 2022;
Published: 18 April 2022.
Edited by:
Adam Steinbrenner, University of Washington, United StatesReviewed by:
Rocio Escobar Bravo, University of Bern, SwitzerlandIslam S. Sobhy, Cardiff University, United Kingdom
Copyright © 2022 Kansman, Basu, Casteel, Crowder, Lee, Nihranz and Finke. This is an open-access article distributed under the terms of the Creative Commons Attribution License (CC BY). The use, distribution or reproduction in other forums is permitted, provided the original author(s) and the copyright owner(s) are credited and that the original publication in this journal is cited, in accordance with accepted academic practice. No use, distribution or reproduction is permitted which does not comply with these terms.
*Correspondence: Jessica T. Kansman, jessica.kansman@gmail.com