Modern Pollen Assemblages From Lake Sediments and Soil in East Siberia and Relative Pollen Productivity Estimates for Major Taxa
 Rongwei Geng1,2,3
  Andrei Andreev1
  Stefan Kruse1
  Birgit Heim1
  Femke van Geffen1,4 Luidmila Pestryakova5 Evgenii Zakharov5,6 Elena Troeva6 Iuliia Shevtsova1
  Furong Li7 Yan Zhao2,3
  Ulrike Herzschuh1*
- 1Section of Polar Terrestrial Environmental Systems, Alfred Wegener Institute Helmholtz Centre for Polar and Marine Research, Potsdam, Germany
- 2Key Laboratory of Land Surface Pattern and Simulation, Institute of Geographical Sciences and Natural Resources Research, Chinese Academy of Sciences, Beijing, China
- 3College of Earth and Planetary Sciences, University of Chinese Academy of Sciences, Beijing, China
- 4Institute of Biochemistry and Biology, University of Potsdam, Potsdam, Germany
- 5Institute of Natural Sciences, North-Eastern Federal University of Yakutsk, Yakutsk, Russia
- 6Institute for Biological Problems of Cryolithozone, Russian Academy of Sciences, Yakutsk, Russia
- 7School of Ecology, Sun Yat-sen University, Shenzhen, China
Modern pollen–vegetation–climate relationships underpin palaeovegetation and palaeoclimate reconstructions from fossil pollen records. East Siberia is an ideal area for investigating the relationships between modern pollen assemblages and near natural vegetation under cold continental climate conditions. Reliable pollen-based quantitative vegetation and climate reconstructions are still scarce due to the limited number of modern pollen datasets. Furthermore, differences in pollen representation of samples from lake sediments and soils are not well understood. Here, we present a new pollen dataset of 48 moss/soil and 24 lake surface-sediment samples collected in Chukotka and central Yakutia in East Siberia. The pollen–vegetation–climate relationships were investigated by ordination analyses. Generally, tundra and taiga vegetation types can be well distinguished in the surface pollen assemblages. Moss/soil and lake samples contain generally similar pollen assemblages as revealed by a Procrustes comparison with some exceptions. Overall, modern pollen assemblages reflect the temperature and precipitation gradients in the study areas as revealed by constrained ordination analysis. We estimate the relative pollen productivity (RPP) of major taxa and the relevant source area of pollen (RSAP) for moss/soil samples from Chukotka and central Yakutia using Extended R-Value (ERV) analysis. The RSAP of the tundra-forest transition area in Chukotka and taiga area in central Yakutia are ca. 1300 and 360 m, respectively. For Chukotka, RPPs relative to both Poaceae and Ericaceae were estimated while RPPs for central Yakutia were relative only to Ericaceae. Relative to Ericaceae (reference taxon, RPP = 1), Larix, Betula, Picea, and Pinus are overrepresented while Alnus, Cyperaceae, Poaceae, and Salix are underrepresented in the pollen spectra. Our estimates are in general agreement with previously published values and provide the basis for reliable quantitative reconstructions of East Siberian vegetation.
Introduction
Palaeoenvironmental studies in Siberia are important to understand climate and vegetation changes in the Northern Hemisphere. Pollen is the most widely used proxy for quantitative reconstructions of vegetation and climate in the past (Abraham et al., 2017; Sun et al., 2019; Chevalier et al., 2020; Liang et al., 2020). However, the number of quantitative climate and vegetation reconstructions available from Siberia is still low (e.g., Andreev and Klimanov, 2000, 2001; Andreev et al., 2001, 2004, 2011, 2014; Andreev and Tarasov, 2013; Tarasov et al., 2013; Klemm et al., 2016; Kobe et al., 2020), partly because of a lack of modern pollen assemblages that provide the basis for the application of the modern analog technique or the generation of pollen–climate transfer functions (Overpeck et al., 1985; Magyari et al., 2014; Birks and Berglund, 2018). The relative pollen productivity (RPP) is an estimated value of pollen productivity relative to a reference taxon, which calibrates the relationship between vegetation cover and pollen data. Therefore, missing RPP estimates affect the ability of models such as the Landscape Reconstruction Algorithm (LRA; Sugita, 2007a,b) and the Multiple Scenario Approach (MSA; Bunting and Middleton, 2009) to make reasonable vegetation reconstructions.
Modern pollen datasets in Siberia have been published in previous studies (Tarasov et al., 2007, 2011; Müller et al., 2010; Klemm et al., 2016) and databases such as Eurasian Modern Pollen Database (Davis et al., 2020). However, compared to other Northern Hemisphere regions, studies on surface pollen are still rare for some regions such as Chukotka and central Yakutia. Moreover, only a few studies of modern pollen assemblages in arctic Siberia (Pisaric et al., 2001; Müller et al., 2010; Klemm et al., 2013, 2016) and southern Siberia (Pelánková et al., 2008) have been carried out that explore the relationships between pollen assemblages and vegetation or establish pollen–climate transfer functions.
Different pollen source areas and taphonomies can cause inconsistency in the pollen signals from different types of archives (Prentice, 1985; Minckley and Whitlock, 2000; Wilmshurst and McGlone, 2005; Klemm et al., 2013). As fossil pollen records in Siberia are mainly obtained from lake sediments, the quantitative reconstructions remain uncertain because the modern pollen datasets underpinning the reconstructions mostly originate from soils (e.g., Pelánková et al., 2008; Zhang et al., 2018; Cui et al., 2019; Geng et al., 2019). Modern pollen assemblages from lake sediments are less abundant (e.g., Clayden et al., 1996; Pisaric et al., 2001; Klemm et al., 2013, 2016; Niemeyer et al., 2015, 2017) despite commonly being used as palaeoenvironmental archives. Since RPP estimates can vary between regions, the vast area of Siberia is still in need of RPP estimates to make better quantitative vegetation reconstructions. Hitherto, only Niemeyer et al. (2015) have provided RPP estimates for common taxa of the Siberian Arctic and investigated the differences between moss and lake pollen. However, Siberia covers a large area and RPP information from forested boreal areas in eastern Siberia and the Far East tundra–taiga transition area in Chukotka are completely lacking. The bias with archive type might be particularly strong in areas where taxa with strongly different transportation characteristics dominate, such as in Siberia. For instance, Larix, the dominant tree in East Siberian forests, is rare in pollen assemblages, probably because it is produced in low numbers, is poorly preserved, and poorly transported, while Alnus on the other hand is strongly overrepresented in pollen spectra (Niemeyer et al., 2015). The abundance and representation of Poaceae and Cyperaceae are also complex due to their diverse habitats (Bush, 2002; Semeniuk et al., 2006).
Here, we present the results of a pollen analysis of 48 moss/soil and 24 lake samples collected from East Siberia and RPP estimates for major plant taxa based on moss/soil samples in Chukotka and central Yakutia. The main objectives of this work are: (1) to assess how modern pollen assemblages reflect regional vegetation and climate conditions; (2) to compare and understand possible differences of pollen assemblages from lake sediments and surface soils; and (3) to obtain the relevant source area of pollen (RSAP) and RPP estimates of major taxa in East Siberia for future plant cover reconstructions.
Materials and Methods
Study Area
The study areas, Chukotka (65.8–68.5°N, 163.4–168.8°E) and central Yakutia (59.9–63.9°N, 112.9–129.7°E), are situated in eastern Siberia (Figure 1). The elevations of the sampling sites range from 94 to 843 m above sea level. The climate is characterized by a mean annual temperature (MAT) of -14.3 to –11.7°C in Chukotka and –9.5 to –5.1°C in central Yakutia, with the lowest temperatures in January and the highest in July. The mean annual precipitation (MAP) ranges from 183 to 274 mm in Chukotka and from 240 to 477 mm in central Yakutia (Matsuura and Willmott, 2018a,b).
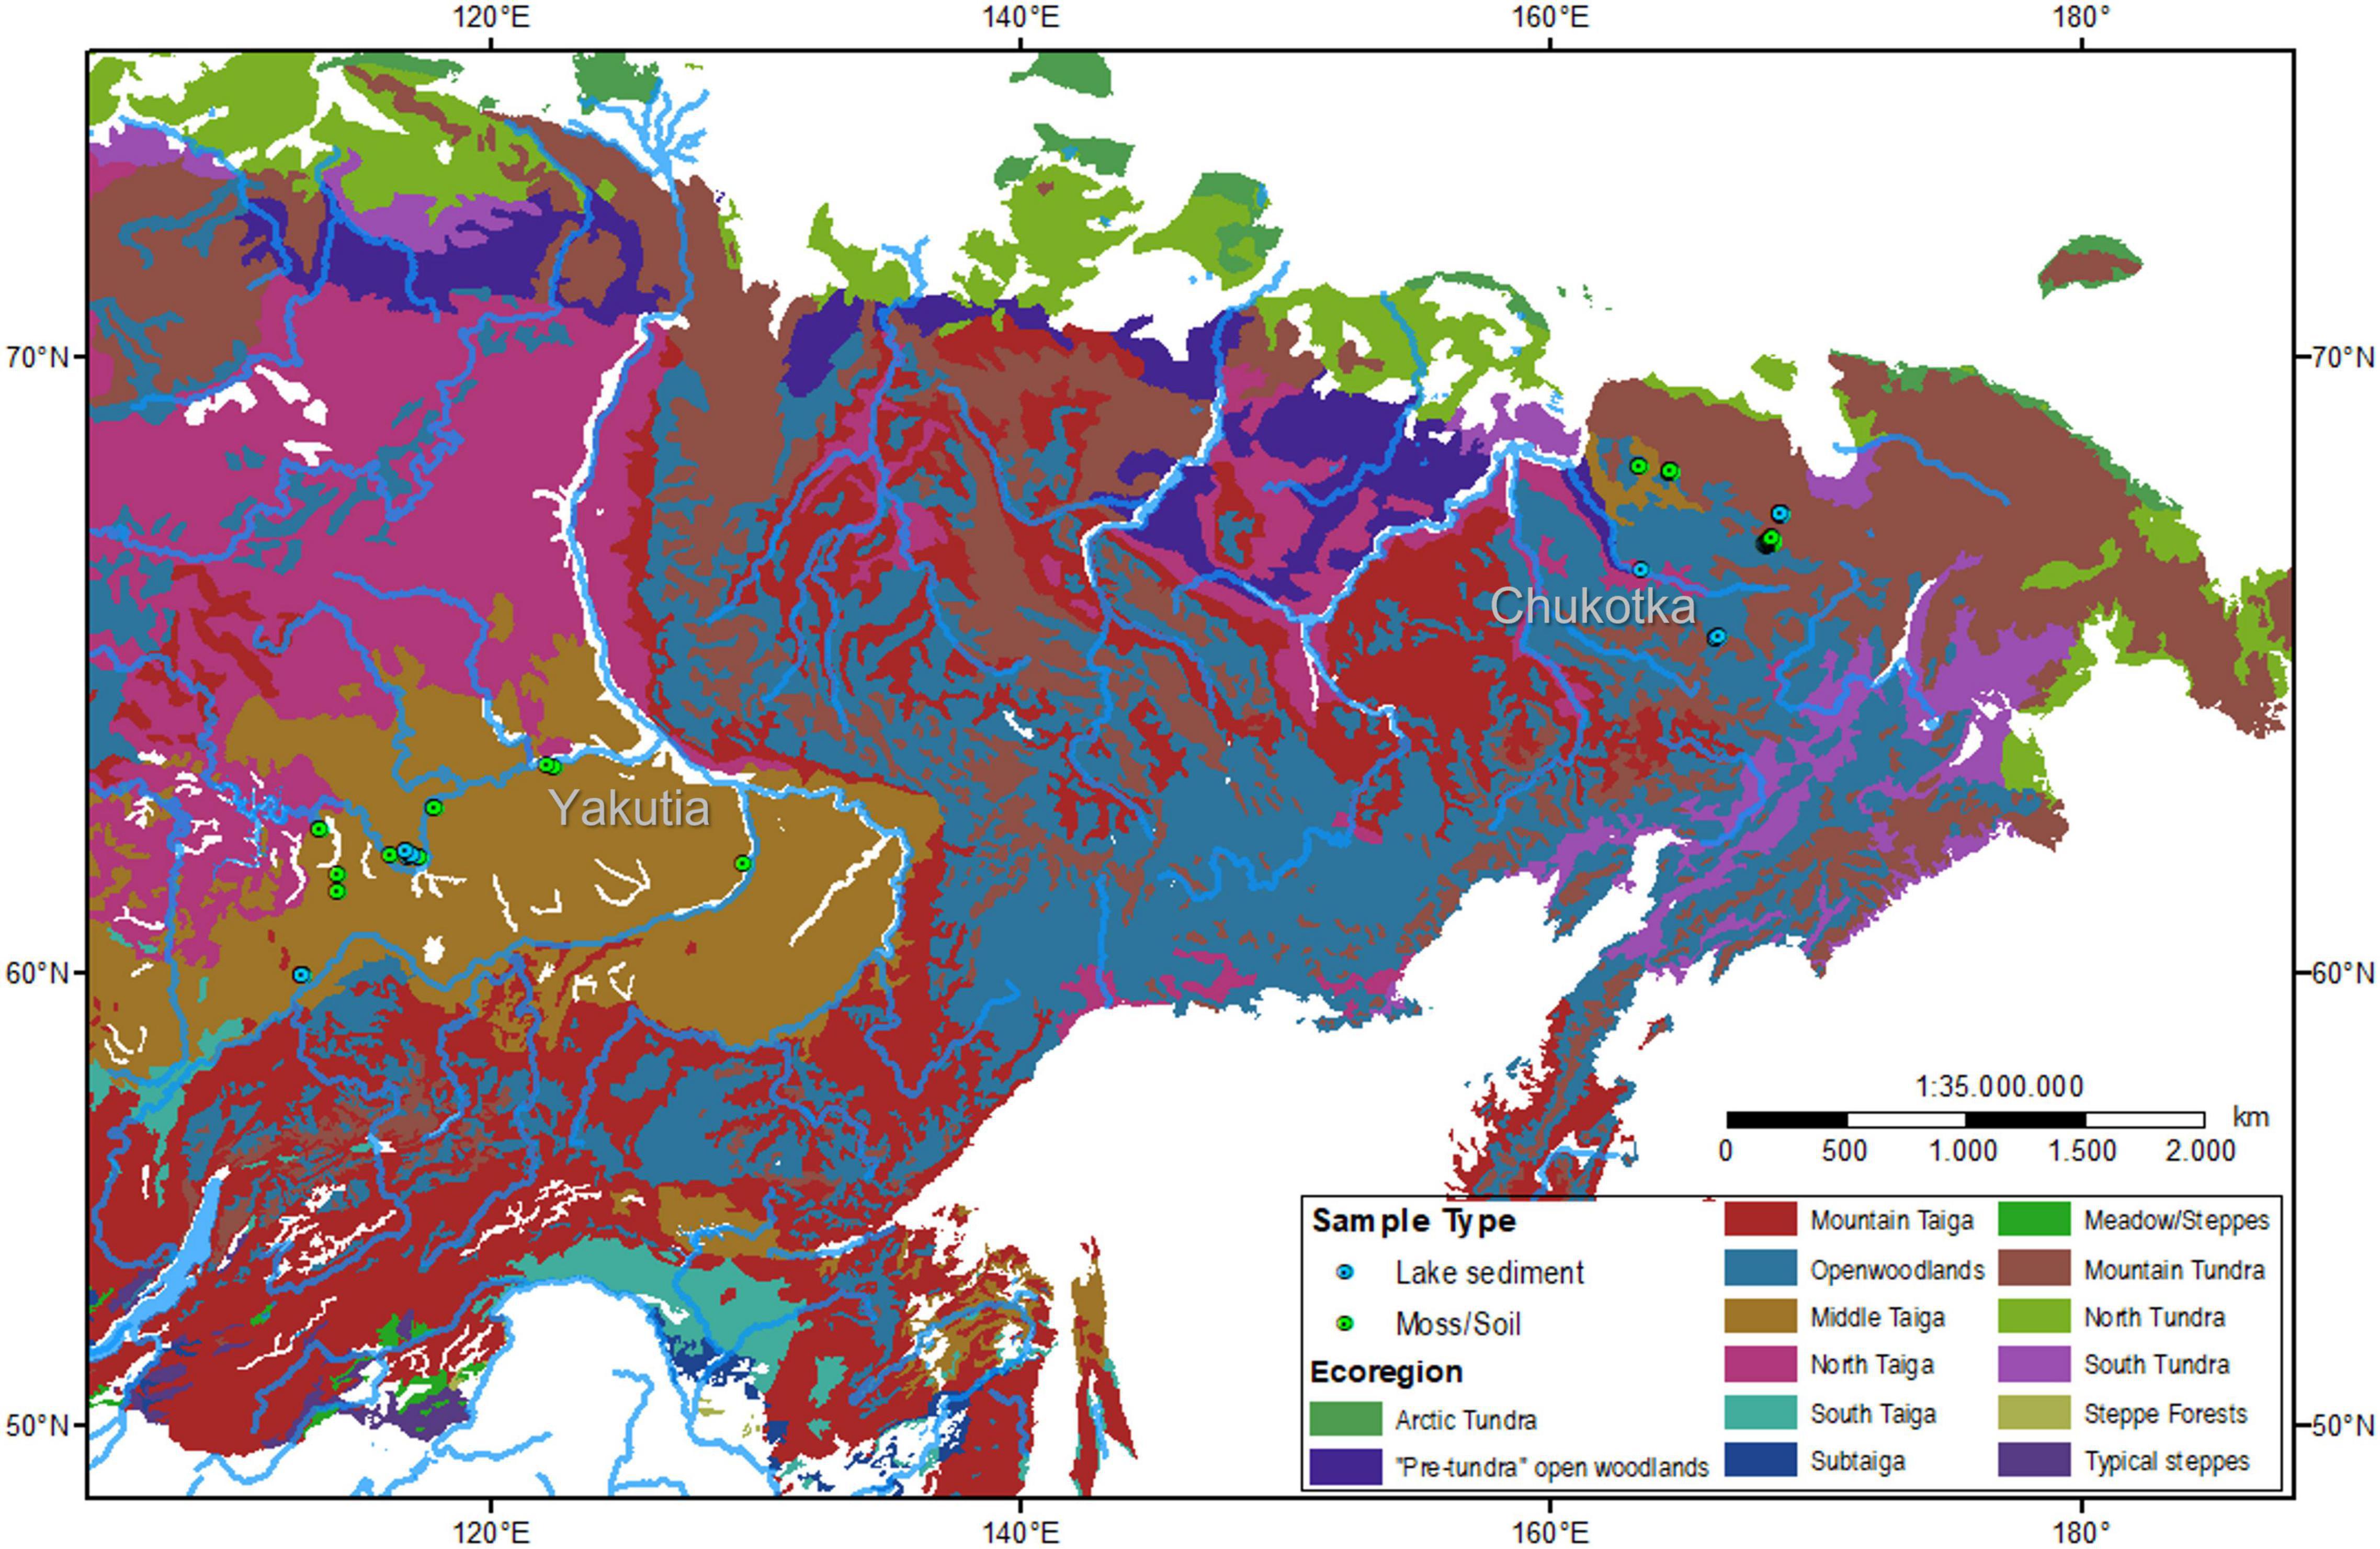
Figure 1. Vegetation map (after Stone and Schlesinger, 2004) and locations of sampling sites in north-eastern and central Siberia.
The main vegetation types are tundra–taiga transition in Chukotka and taiga in central Yakutia. The tundra is covered by mosses, sedges, and lichens with some prostrate and hemi-prostrate low shrubs (Salix, Dryas, Betula nana L., and different ericaceous taxa). Open larch (Larix gmelinii [Rupr.] Kuzen., Larix cajanderi Mayr) and spruce–larch (Larix gmelinii [Rupr.] Kuzen., Picea obovata Ledeb.) forests predominate in the taiga zone of central Yakutia. Larch (Larix cajanderi Mayr) forests and pine (Pinus pumila [Pall.] Regel) shrubs occupy the Chukotka study regions, while forests with Abies sibirica Ledeb., Pinus sylvestris L., P. sibirica Du Tour, and Larix gmelinii (Rupr.) Kuzen. occupy the study area in Yakutia (Safronova and Yurkovsksya, 2019).
Sample Collection
A total of 72 surface samples were collected from both study areas: 30 moss/soil samples and 16 lake surface samples from Chukotka and 18 moss/soil samples and 8 lake surface samples from central Yakutia in July 2016 (Overduin et al., 2017) and in July and August 2018 (Kruse et al., 2019). Coordinates of the sampling sites were obtained by a hand-held Global Positioning System (GPS). Vegetation and major plant taxa were described in the field. Ecoregions, including Floodplain and Anthropogenic Meadows, Mountain Tundra, Open Woodlands, and Middle Taiga, for each sampling site were extracted from a 1:4 million scale vegetation map for the land area of the former Soviet Union. (Stone and Schlesinger, 2004) using ArcGIS 10.3. Detailed information of the 72 sites is presented in Table 1.
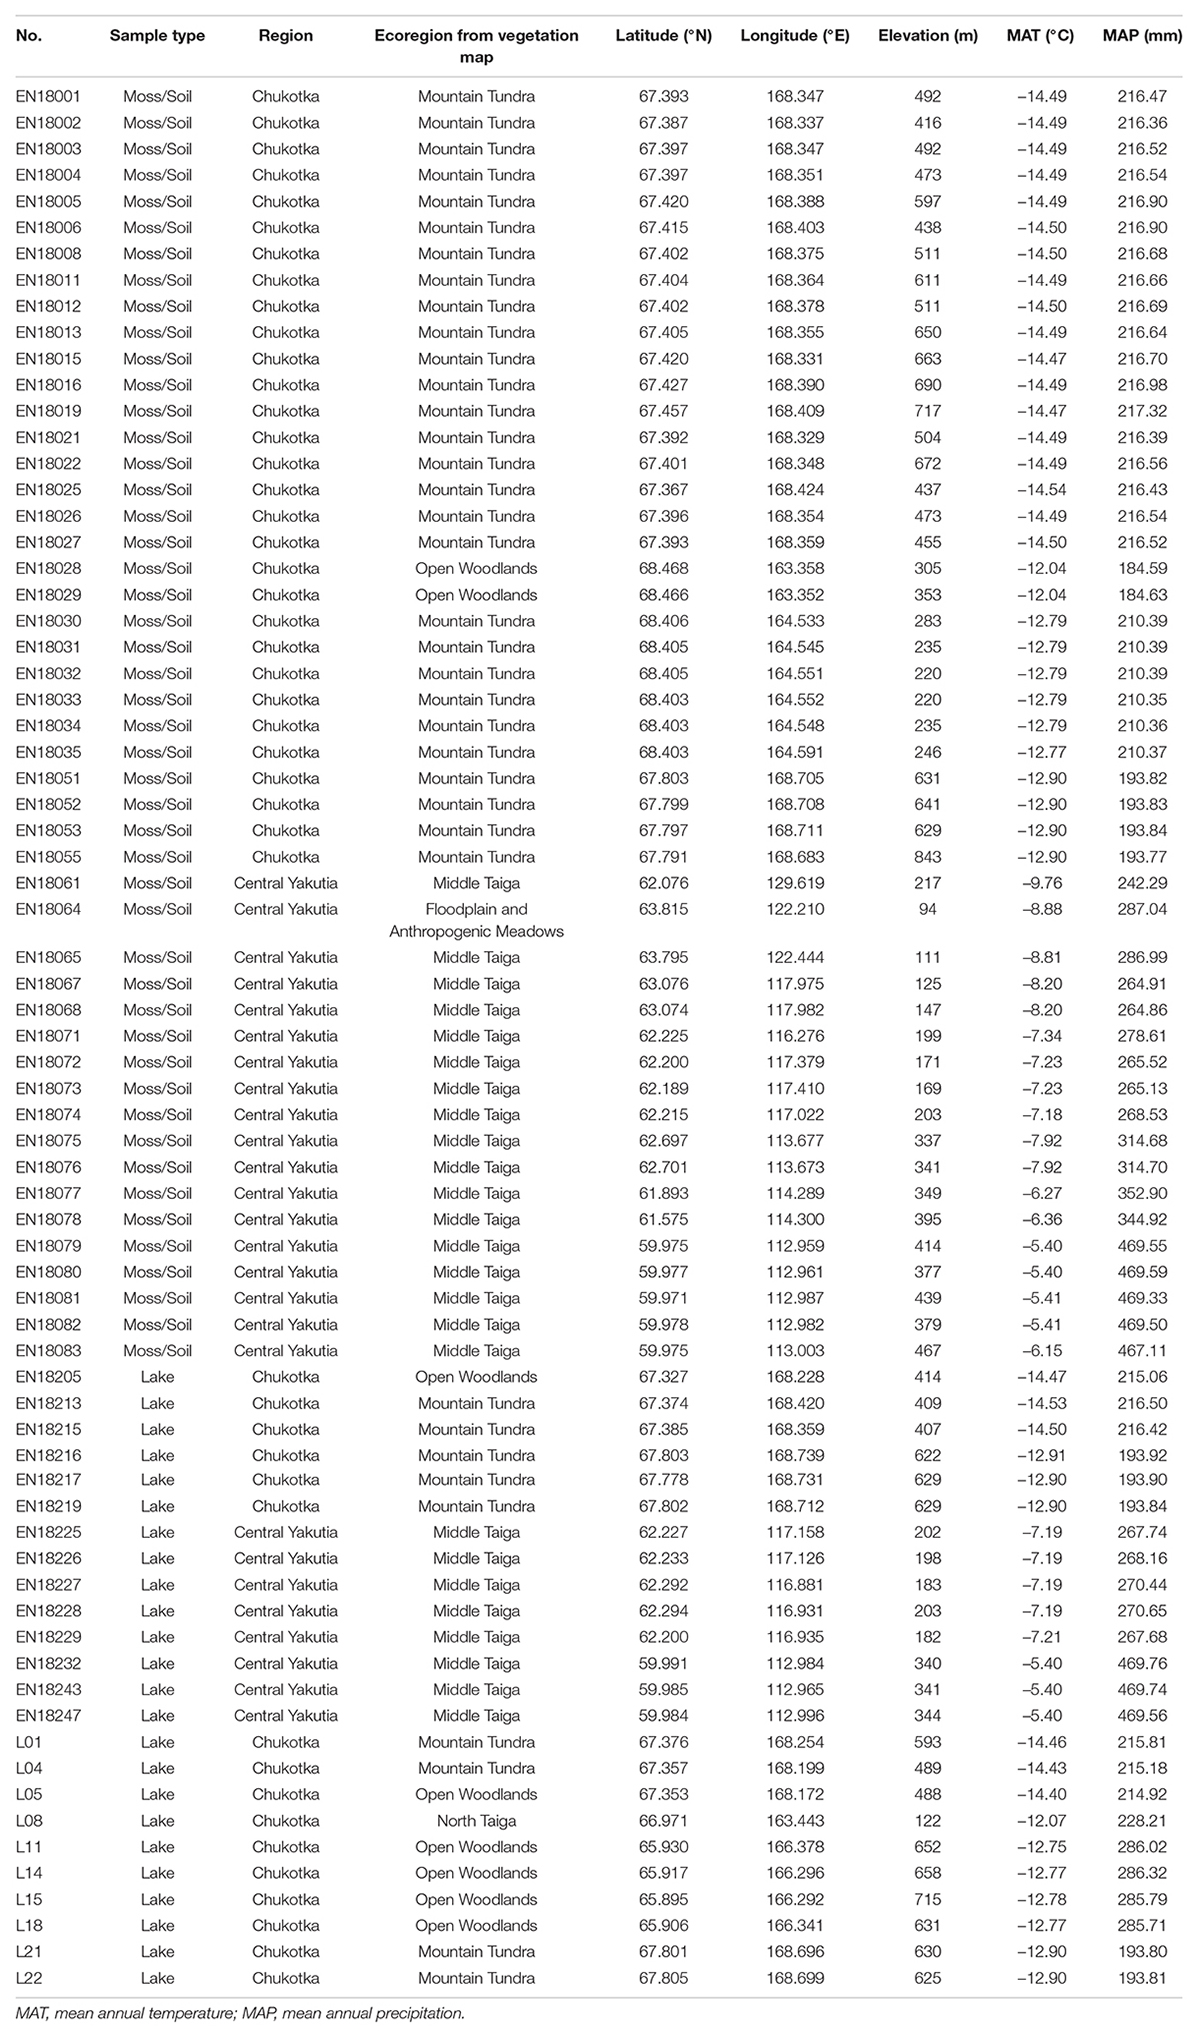
Table 1. Information about the 72 sampling sites in East Siberia.
Pollen Analysis
Pollen samples were taken from the first centimeter of the soil/moss polster below the plant litter, while the lake sediment samples were taken from the uppermost centimeter of the lake cores. The samples were weighed (approximately 1–2 g for moss/soil samples and 3 g for lake samples), and a tablet with Lycopodium spores was added to the sample for the estimation of pollen concentrations (Stockmarr, 1971). Each sample was sieved to remove moss/plant residues and coarse particles, and was processed following a modified acetolysis procedure (Faegri et al., 2000), including HCl, NaOH, HF, and acetolysis treatments. The residue was then sieved through a 10 μm mesh. Water-free glycerol was used for sample storage and preparation of the microscopic slides.
At least 300 terrestrial pollen grains were counted and identified in each sample under a microscope at 400X magnification using published pollen atlases and identification keys (Reille, 1992, 1995, 1998; Wang, 1995). Pollen percentages were calculated based on the total number of terrestrial pollen grains. Tilia software (Grimm, 2004) was used to plot the results as a pollen percentage diagram (Figure 2).
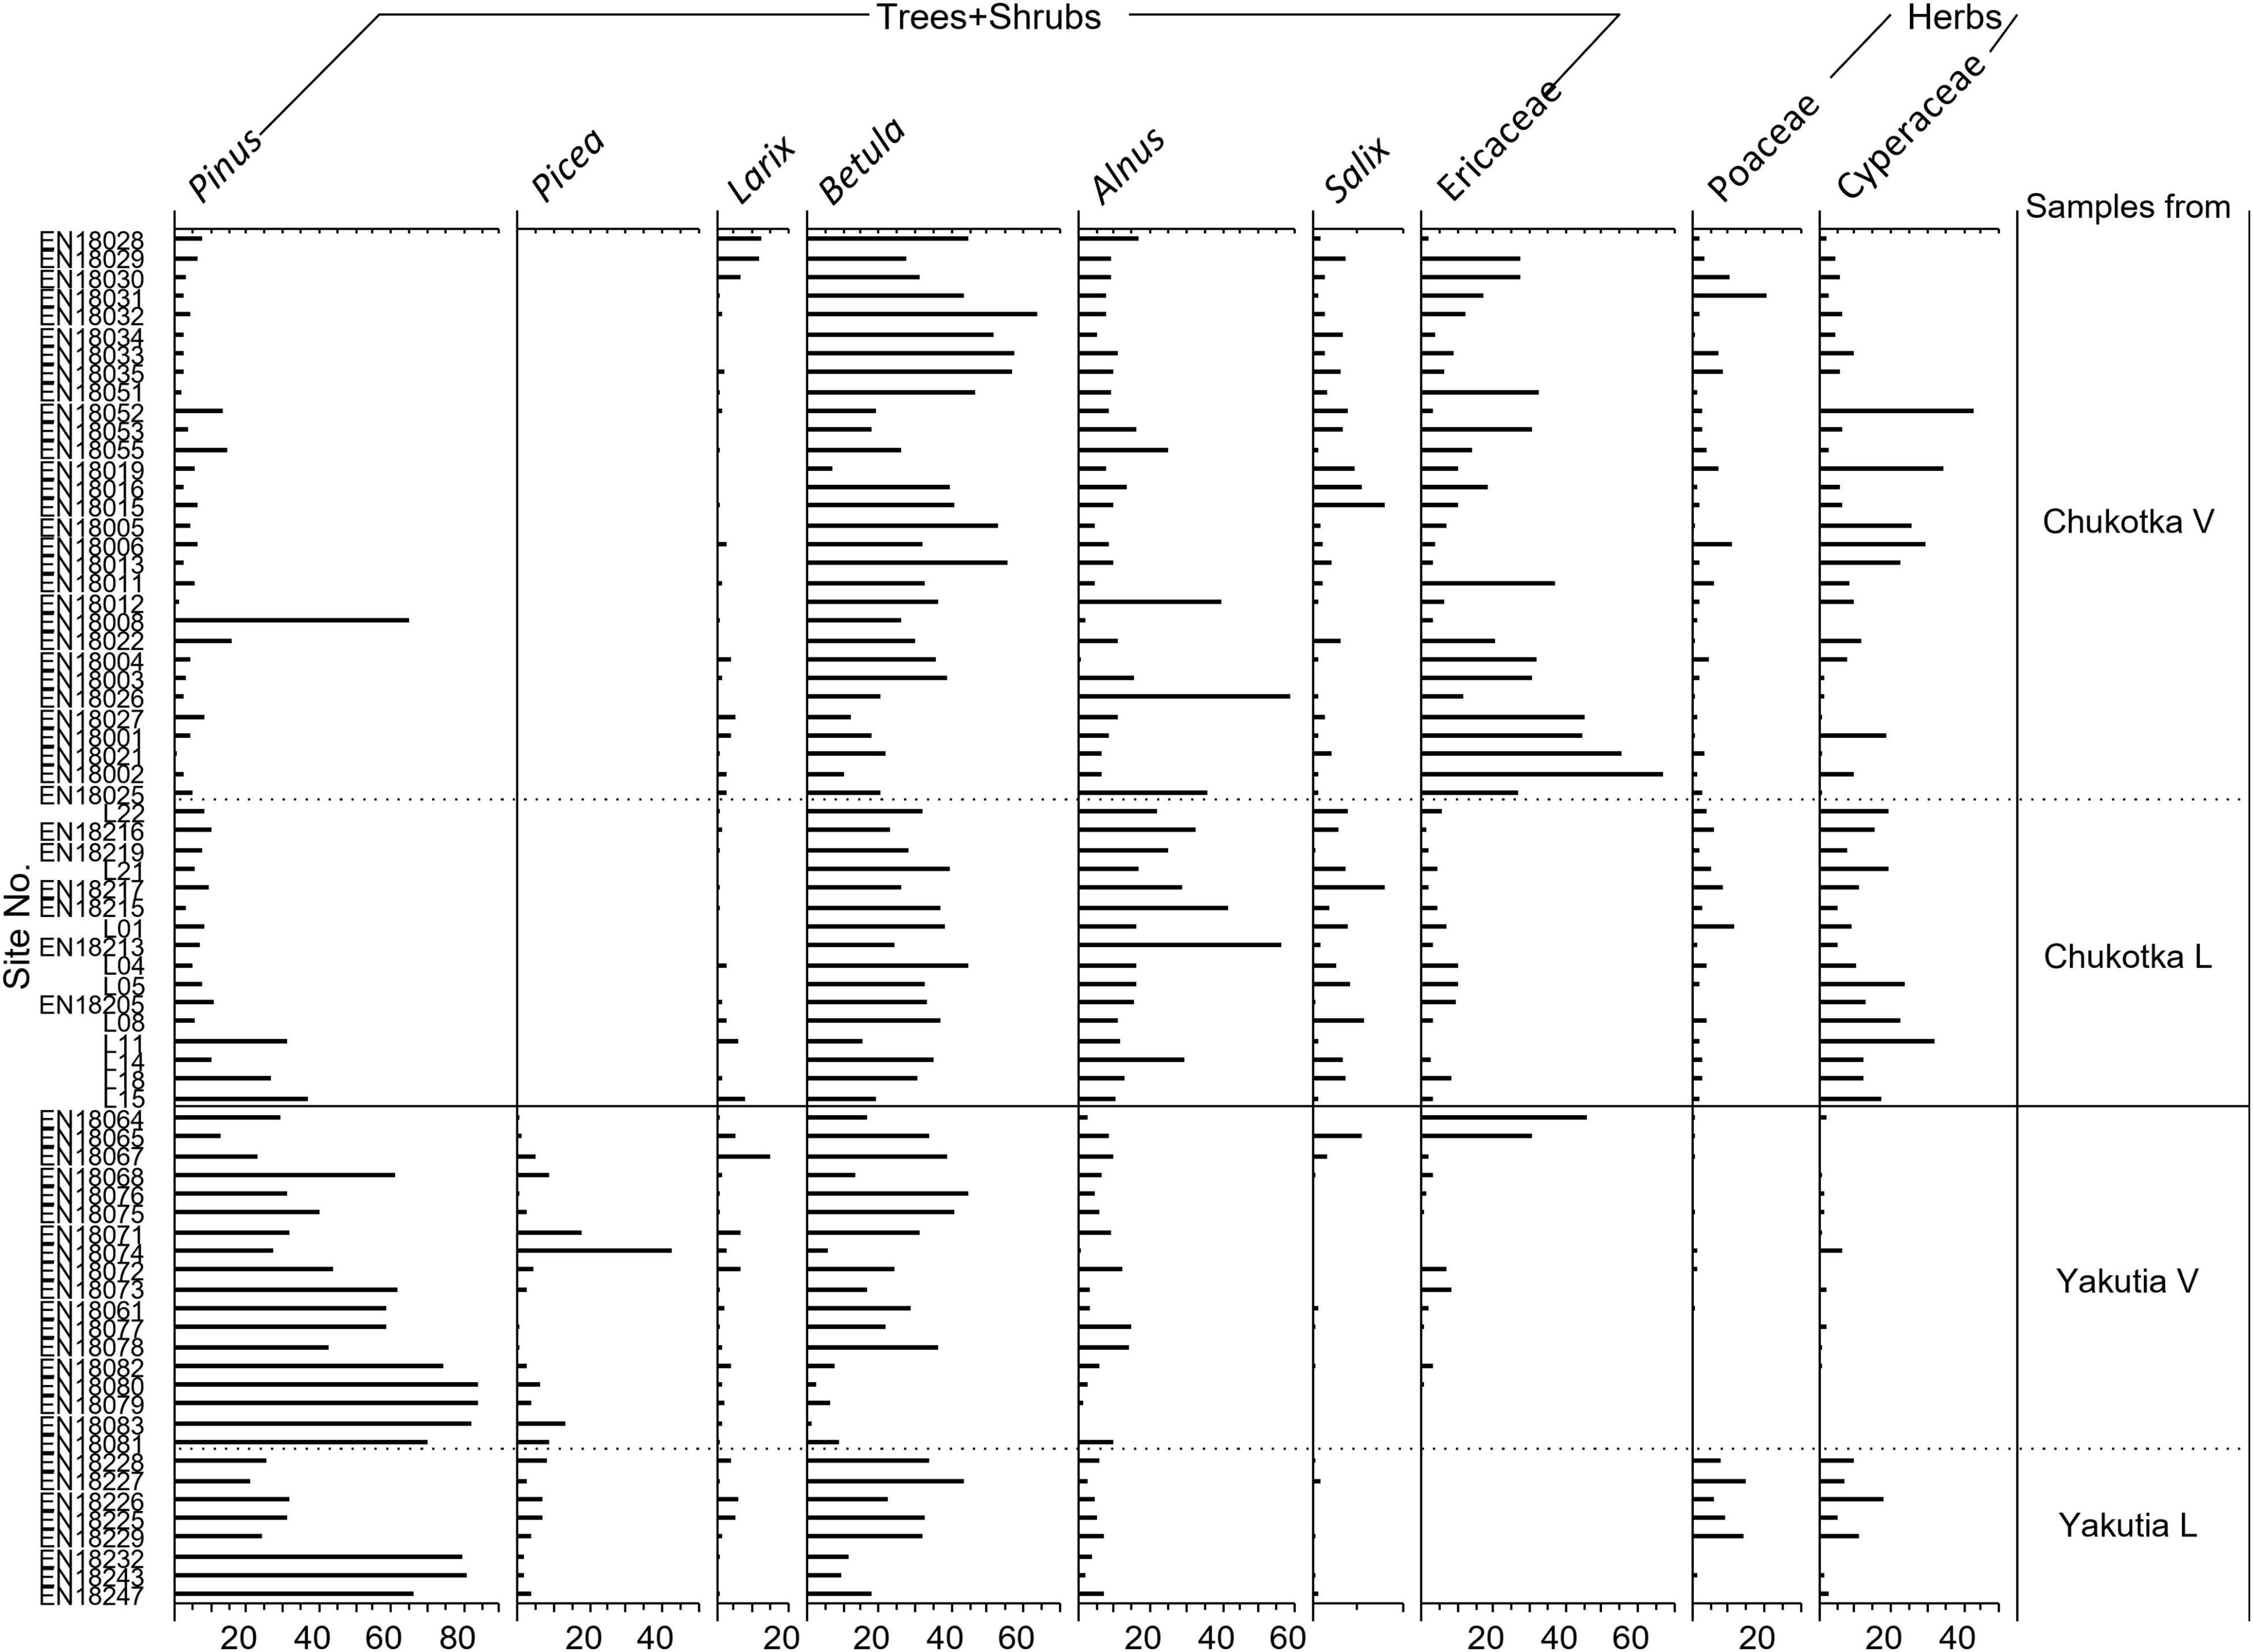
Figure 2. Pollen diagram of the main taxa from 72 surface samples, grouped according to location. Suffix V signifies samples from vegetation plots, i.e., moss/soil samples and suffix L signifies lake sediment samples. Samples in each group are sorted by latitude in descending order.
Vegetation Survey
For the moss/soil samples collected in 2018 (n = 48), a vegetation survey around the sampling point was carried out following the steps below. The vegetation within 0-2 m was surveyed in concentric rings of 0.5 m increments. Plant taxa composition was estimated as total cover in percentage. To investigate the vegetation within 2–100 m, vegetation plots were overflown with a consumer grade drone and Survey Red Green Blue (RGB) and Red Green Near Infrared (RGN) cameras to obtain spatially mapped detailed vegetation information in 2 and 3 dimensions (2D, 3D) besides the 2018 field vegetation inventories (Kruse et al., 2019; van Geffen et al., 2021a,b). The aerial imagery covered a minimum areal extent of 50 m × 50 m over the vegetation plots. RGB and RGN Structure for Motion (SFM) point clouds were constructed with Agisoft PhotoScan Professional (Agisoft, 2018) according to methods described in Brieger et al. (2019). From each full RGB and RGN point cloud and overhead photo images orthomosaics were created (Kruse et al., 2021). The distribution of plant communities was mapped by a maximum likelihood classification of the layers using the superClass function in the “RStoolbox” package (Leutner et al., 2019) in R (R Core Team, 2019). The training dataset and cover of plant taxa for each community was visually selected and estimated in the field using 2 m × 2 m quadrats. The cover of major taxa was extracted by concentric rings of 1 m increments within the first 25 m and extrapolated to 100 m radius by the averaged taxa cover.
The vegetation within 100–3000 m was inferred from a land-cover classification at a 20 m resolution based on Sentinel-2 satellite image data (European Space Agency, ESA). The training dataset of land-cover types was created based on the 2018 vegetation plots (van Geffen et al., 2021a,b). Plant cover data within the different radii were extracted from these vegetation class maps within a 3000 m radius of each sampling site. Plant taxa composition in each land-cover type was estimated based on the taxa cover extracted from the drone-based orthomosaics. For Chukotka, the classification of the Sentinel-2 satellite data was performed with machine learning algorithms in Python from the SciKit-Learn library (Pedregosa et al., 2011). Several algorithms were trained, including Random Forest, Decision Tree, and Gaussian Naive Bayes, and the best performing algorithms were selected per region based on the mean accuracy over all the classes. For all 35 vegetation plots in Chukotka the vegetation classes were all classified together with an accuracy score of 82% and the K- Nearest Neighbours algorithm. For the vegetation plots in central Yakutia, class variety was more diverse with not enough vegetation plots of the same class for a robust classification. Instead of a supervised trained classification we defined the value ranges of the Normalized Difference Vegetation Index NDVI (Near Infrared – red/Near Infrared + red) and the relative absorption depth (Murphy, 1995) of the red Chlorophyll absorption band (green + Near Infrared/2 × Red) (European Space Agency, 2015) of each of the vegetation classes for assigning classes from the NDVI and pigment absorption depth maps.
To create vegetation input files for the Extended R-Value (ERV) models, the mean absolute cover (in m2 m–2) of the plant taxa for ERV analysis was calculated for each chosen distance increment. In this study, we used different increments within different distances (1 m increment for the first 25 m radius, 5 m increment for between 20 and 100 m, 10 m increment for 100 to 1000 m, and 50 m increment for 1000–3000 m). We assume homogeneous vegetation cover in each concentric ring, as it is the assumption for data analysis using ERV models and related pollen-dispersal functions.
Climate Data
MAT, MAP, mean summer temperature (MST), mean winter temperature (MWT), mean summer precipitation (MSP), and mean winter precipitation (MWP) over 30 years (1987–2017) and 100 years (1917–2017) were interpolated using the weighted mean method from Terrestrial Air Temperature: 1900–2017 Gridded Monthly Time Series Version 5.01 (Matsuura and Willmott, 2018a) and Terrestrial Precipitation: 1900–2017 Gridded Monthly Time Series Version 5.01 (Matsuura and Willmott, 2018b) in R software.
Numerical Analysis
Taxa that occurred in at least three samples were used in the numerical analysis. A square root transformation of all the data was performed before all the numerical analyses to normalize skewed distributions and reduce the effect of extreme values.
Ordination analyses were used to investigate the main structure in the pollen data and its relation to vegetation type and environmental variables. A detrended correspondence analysis (DCA) was initially performed to estimate the underlying linearity of the data. The results of the DCA showed that the gradient lengths of the first four axes were less than 2.1 standard deviation units, suggesting linear underlying responses. Accordingly, the linear methods Principal Component Analysis (PCA) and Redundancy Analysis (RDA) were chosen to assess how well the pollen assemblages characterize the different vegetation types (Ter Braak and Prentice, 1988). The correlations between pollen assemblages and climate variables are explored in the RDA. Analyses were implemented using the “vegan” package in R (Oksanen et al., 2019).
PROCRUSTES rotation analysis (Peres-Neto and Jackson, 2001) was performed to compare the species scores of the PCA results for pollen data from different sample types using the “vegan” package in R (Oksanen et al., 2019). This analysis was to investigate the similarity and correlation between pollen data from moss/soil and lake samples. The non-randomness (significance) between the tested datasets was assessed by PROTEST (Jackson, 1995; Niemeyer et al., 2017).
Extended R-Value Analysis
Besides pollen and vegetation data, other input data required to run the ERV model are fall speed of pollen (FSP) and wind speed. We used a constant wind speed of 2.1 m s–1, which is the mean wind speed calculated from the Global Surface Hourly dataset (1988–2018, Noaa National Centers for Environmental Information, 2001) based on selected weather stations in study area. FSP for the selected taxa (Table 2) were taken from the literature (Eisenhut, 1961; Gregory, 1973; Sugita et al., 1999; Broström et al., 2004; Li et al., 2015).
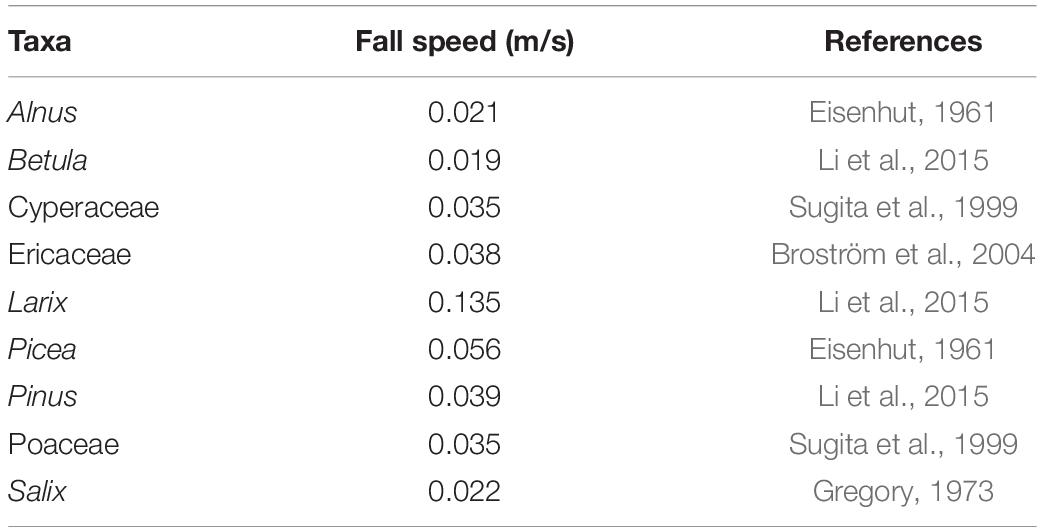
Table 2. Fall speed of major taxa used to estimate relative pollen productivity (RPP) in this study.
ERV.Analysis.v1.3.1. Program (Sugita, unpublished) was used to estimate RPP for the selected taxa in Chukotka and central Yakutia. This program provided 4 pollen dispersal models including Prentice-Sutton distance-weighting method (Prentice’s model) which was chosen as the best fit for this study. We ran the ERV analyses using selected moss/soil sampling sites from Chukotka (14 sites) and central Yakutia (17 sites). We selected taxa that occurred sufficiently frequently in both the pollen and vegetation data for most sites and are characterized by between-sample variation in pollen percentages and vegetation abundances (Li et al., 2017). Ericaceae was present at adequate quantities in the pollen assemblages and vegetation of most sites with a wide variation in abundance between sites in both areas. Poaceae is the most common reference taxon in studies of RPPs. Therefore, Ericaceae (Chukotka, Yakutia) and Poaceae (Chukotka) were selected as the reference taxa to run the ERV model and pollen productivity for the other taxa was estimated relative to the productivity of these reference taxa. We ran the ERV model using all sites with available vegetation and pollen data to assess the log-likelihood curves to identify the RSAP and evaluate the pollen–vegetation relationships. The taxa with non-linear relationships and the site outliers in terms of regional vegetation composition and structure were excluded and then a second ERV analysis was conducted. We also explored the effects of including different numbers of taxa in the ERV analysis, repeating calculations with 6, 7, or 8 taxa, and found that the results from the analysis of 6 taxa (Betula, Cyperaceae, Ericaceae, Larix, Poaceae, Salix) for Chukotka and 7 taxa (Alnus, Betula, Cyperaceae, Ericaceae, Larix, Picea, Pinus) for central Yakutia are most reasonable.
All three sub-models of the ERV model were tried in the analysis. The input pollen and vegetation datasets for ERV sub-models 1 and 2 were percentages while sub-model 3 used vegetation datasets expressed as absolute abundance (m2/m2). ERV sub-model 1 and 2 assumes the background pollen as a constant percentage (Parsons and Prentice, 1981) and a constant proportion of total plant abundance (Prentice and Parsons, 1983). Sub-model 3 assumes that the background pollen comes from beyond RSAP. The RSAP was defined visually from a log-likelihood curve where the values increased with distance and reached an asymptote. The RPP of each taxon was estimated as the average value with all distances greater than the RSAP.
Results
Pollen Assemblages
A total of 46 pollen and spore taxa were identified in the 72 surface samples, 31 of which occurred in at least three samples. The overall dominant taxa are Alnus, Artemisia, Betula, Cyperaceae, Ericaceae, Larix, Poaceae, Pinus, and Salix.
Pollen assemblages from Chukotka are characterized by high percentages of prostrate and hemi-prostrate low shrub taxa (36–94%), with Betula ranging from 7.3 to 64.0% and median value 32.2%, Ericaceae (0.3–66.7%, 9.4%, henceforth median value), Alnus (1.0–58.6%, 11.2%), and Salix (0.0–7.8%, 1.5%). Herb pollen taxa such as Cyperaceae (0.0–42.8%, 9.1%), Poaceae (0.0–20.7%, 2.4%), and Artemisia (0.0–18.7%, 1.4%) are also relatively common in some samples. The main tree pollen taxa are Larix (0.0–12.0%; 1.0%) and Pinus (0.6–65.2%, 5.8%).
Pollen assemblages from central Yakutia are characterized by high proportions of tree taxa (50–99%) especially conifers such as Pinus (12.8–84.3%, 43.2%), Picea (0.0–42.7%, 3.8%), and Larix (0.5–15.2%, 1.5%). Pollen of Betula (1.3–44.3%, 22.2%), Ericaceae (0.0–46.0%, 0.3%), Alnus (0.3–14.8%, 5.5%), Cyperaceae (0.0–18.3%, 1.0%), and Poaceae (0.0–14.6%, 0.4%) are also common but less abundant than in pollen assemblages from Chukotka.
Vegetation Data
A total of 46 harmonized taxa (some taxa were combined in order to correspond to pollen types) was recorded in the field survey. In the final vegetation dataset employed for the ERV-modeling, 11 land-cover types were included in the application (Table 3). For the Chukotka area, graminoid tundra, forest and shrub tundra, and prostrate herb tundra were adopted. The vegetation types of open canopy pine and larch with lichen, open canopy pine, closed canopy pine, open canopy mixed forest, closed canopy mixed forest, open canopy larch, closed canopy larch, and closed canopy spruce were classified in central Yakutia (see example of maps with classifications in Figure 3).
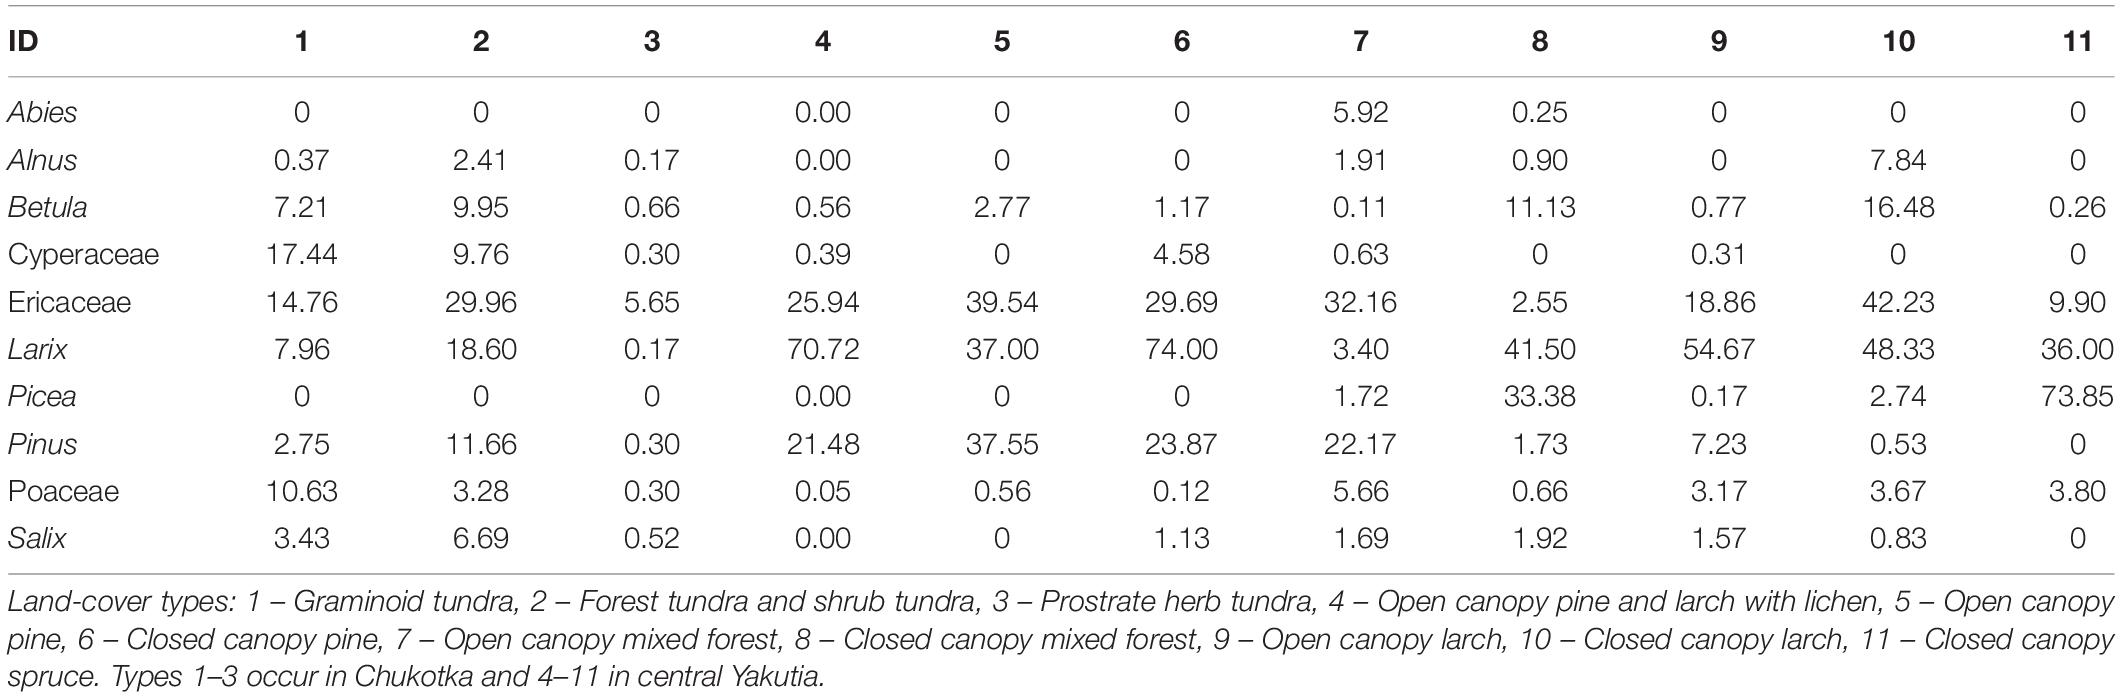
Table 3. Land-cover types from Sentinel-2 data and their major taxa composition in this study.
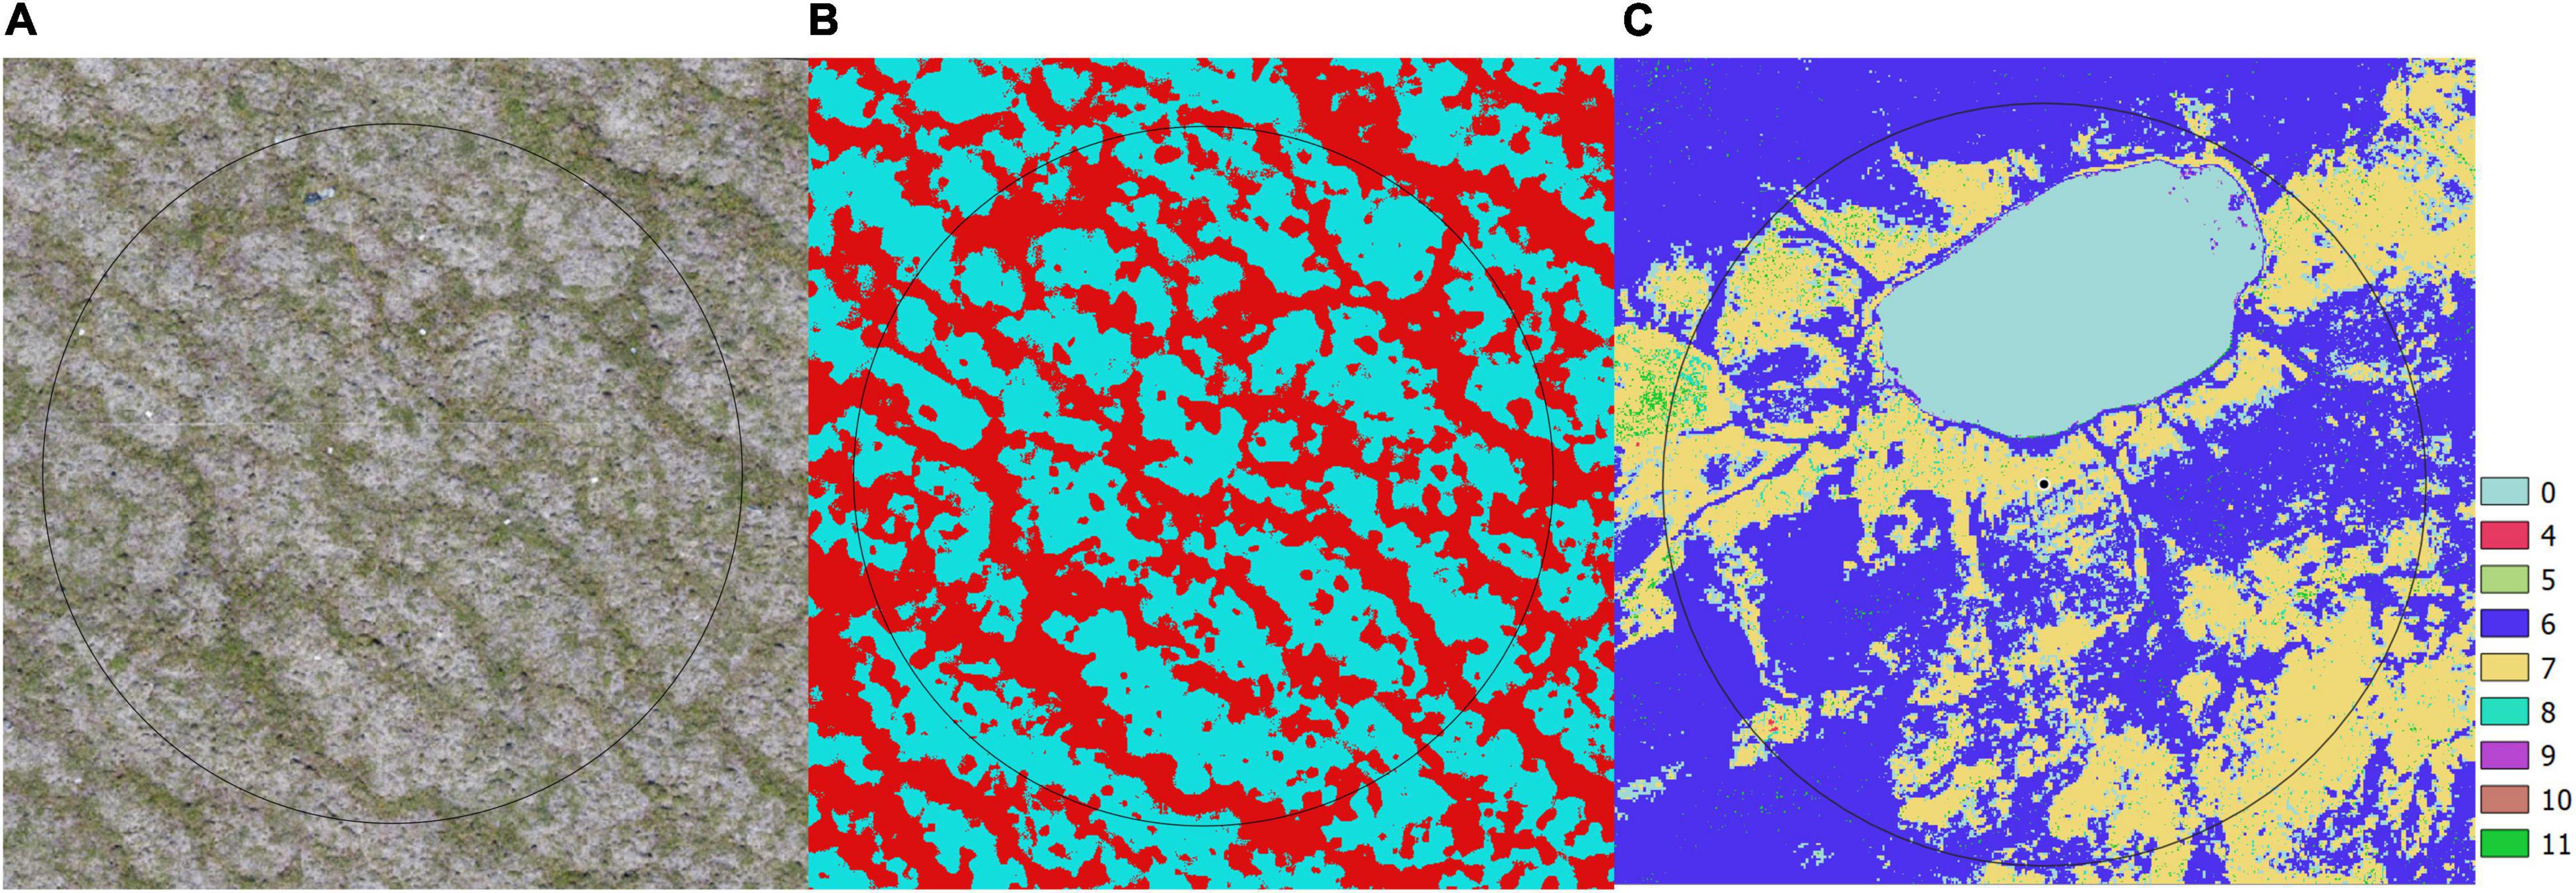
Figure 3. Examples of (A) Red Green Blue true-color orthoimage derived from the RGB drone camera with a 15 m radius circle, (B) classified vegetation map from orthoimage (barren in blue and shrub tundra in red) with a 15 m radius circle, and (C) land-cover map created from Sentinel-2 images with a 3000 m radius circle. The land-cover type IDs are described in Table 3: 0 – water body, 6 – Closed canopy pine, 7 – Open canopy mixed forest, 9 – Open canopy larch, 11 – Closed canopy spruce.
Pollen-Vegetation-Climate Relationships of Different Sediment Types
In order to explore the relationships between pollen assemblages, vegetation types, and climate variables, RDA was performed with climate variables as constraining variables (RDA in Figure 4). The first two RDA axes explain 50.46% (axis 1: 43.75%, axis 2: 6.709%) of the total variance observed in the pollen assemblages from moss/soil samples while the first two axes of the RDA based on lake samples explain 64.11% (axis 1: 50.29%, axis 2: 13.82%) of the total variance.
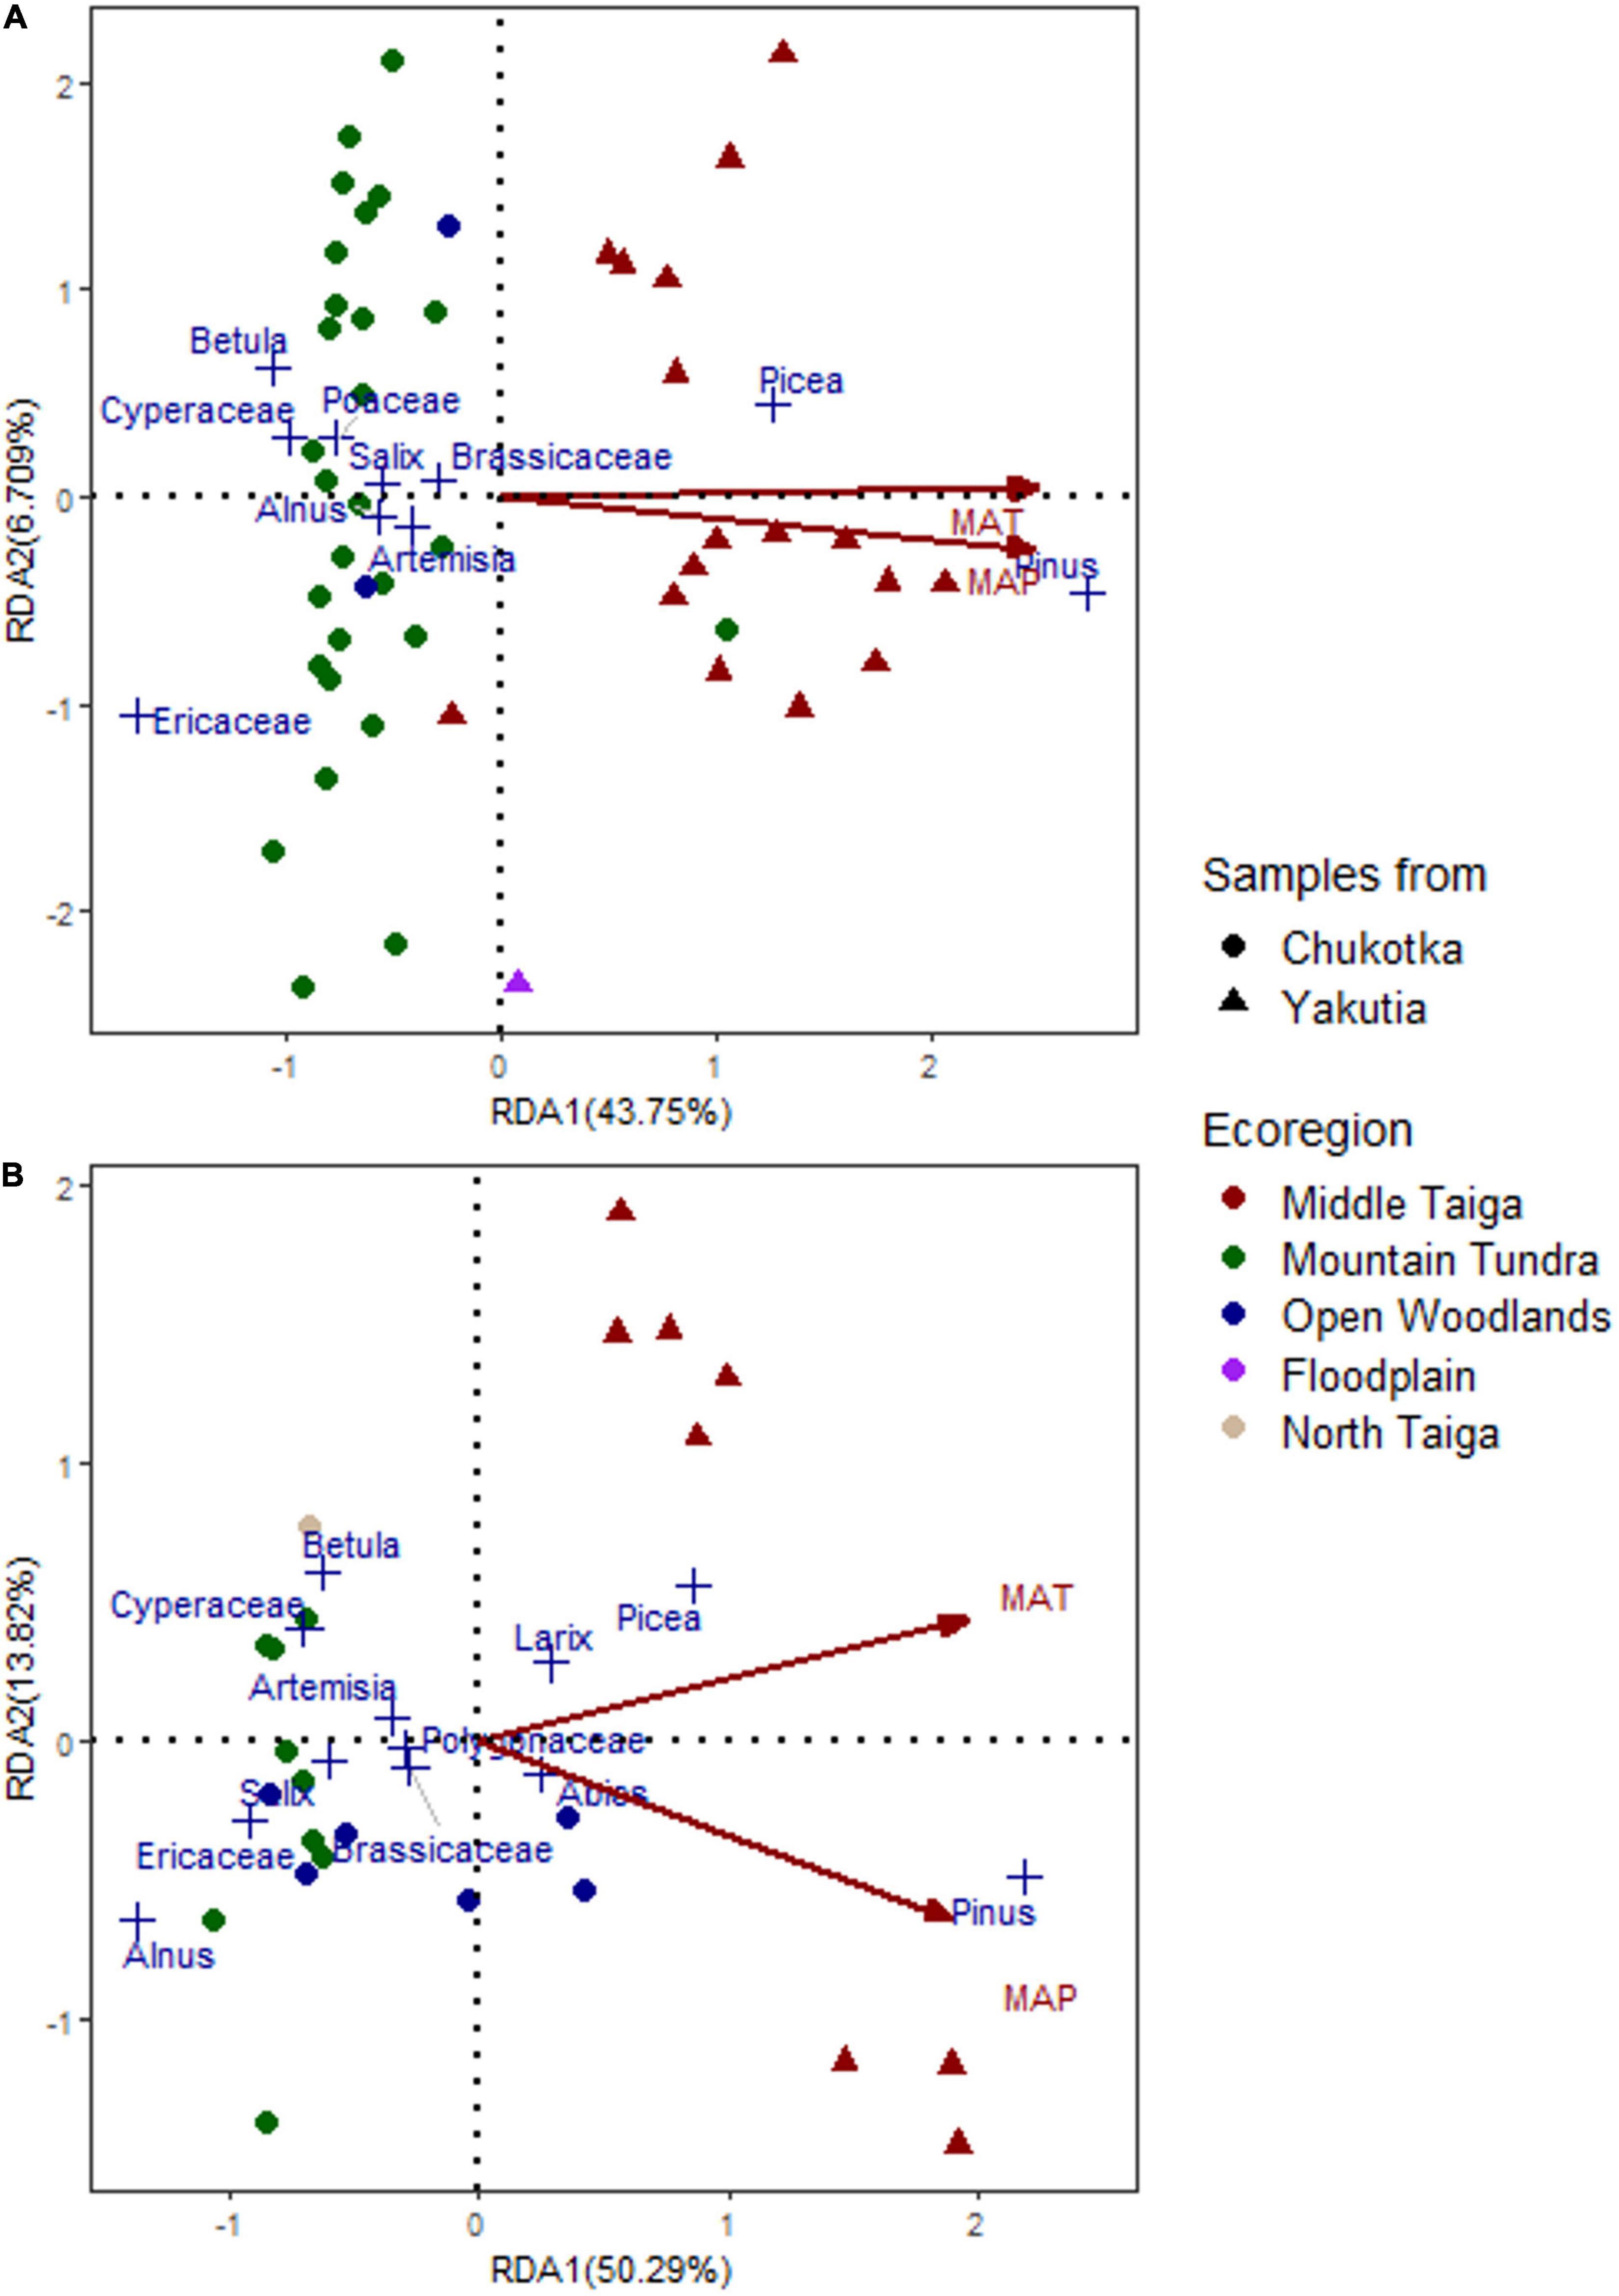
Figure 4. Triplots of redundancy analysis (RDA) based on surface pollen data from (A) moss/soil samples and (B) lake samples. Climate variables are projected as red arrows in the plots (MAP, mean annual precipitation; MAT, mean annual temperature).
The first axes of the lake and moss/soil datasets separate the samples from Chukotka and central Yakutia. The taxa scores of axis 1 reflect the pollen contents of the main taxa for different vegetation types, i.e., Pinus, Picea, and Larix (positive RDA scores) and Ericaceae, Betula, Alnus, Salix, and Cyperaceae (negative RDA scores) in both analyses with different scores.
All climate variables are positively related to axis 1 with high scores. RDA1 scores of constraining variables are 0.9426 and 0.9327 (MAT) and 0.8948 and 0.9083 (MAP) for moss/soil and lake datasets, respectively. MAT and MAP are shown in the RDA plots (Figure 4). The first RDA axis apparently reflects temperature and moisture gradients as shown by the projections in both plots. The RDA plot of moss/soil samples indicates that temperature is the main controlling factor of the changes in pollen assemblages as the arrow of MAT is parallel to the first axis (Figure 4). Moreover, the relationship between the climate variables and pollen assemblages of lake samples is stronger than for the moss/soil samples since the first two RDA axes of lake samples explain more of the total variance (64.11%) than the moss/soil samples (50.46%). In general, the samples from Chukotka are associated with lower temperature and precipitation, whereas the samples from central Yakutia are strongly related to higher temperature and precipitation.
PROCRUSTES rotation analyses and PROTEST were performed to find the best fit in a statistical sense between PCA taxa scores of moss/soil and lake samples (Figure 5). The results indicate a significant accordance in pollen data between the PCA taxa scores of different sample types. The PROCRUSTES rotation sum of squares(m12) is 0.378 and the root mean square error (RMSE) is 0.1104. Correlation between the two ordination results (r = 0.7887) is high. Pollen taxa residuals of Rumex, Poaceae, Alnus, Larix, and Asteraceae between different sample types are above 0.15 (Figure 5) showing a lack of consistency for these taxa in the tested datasets.
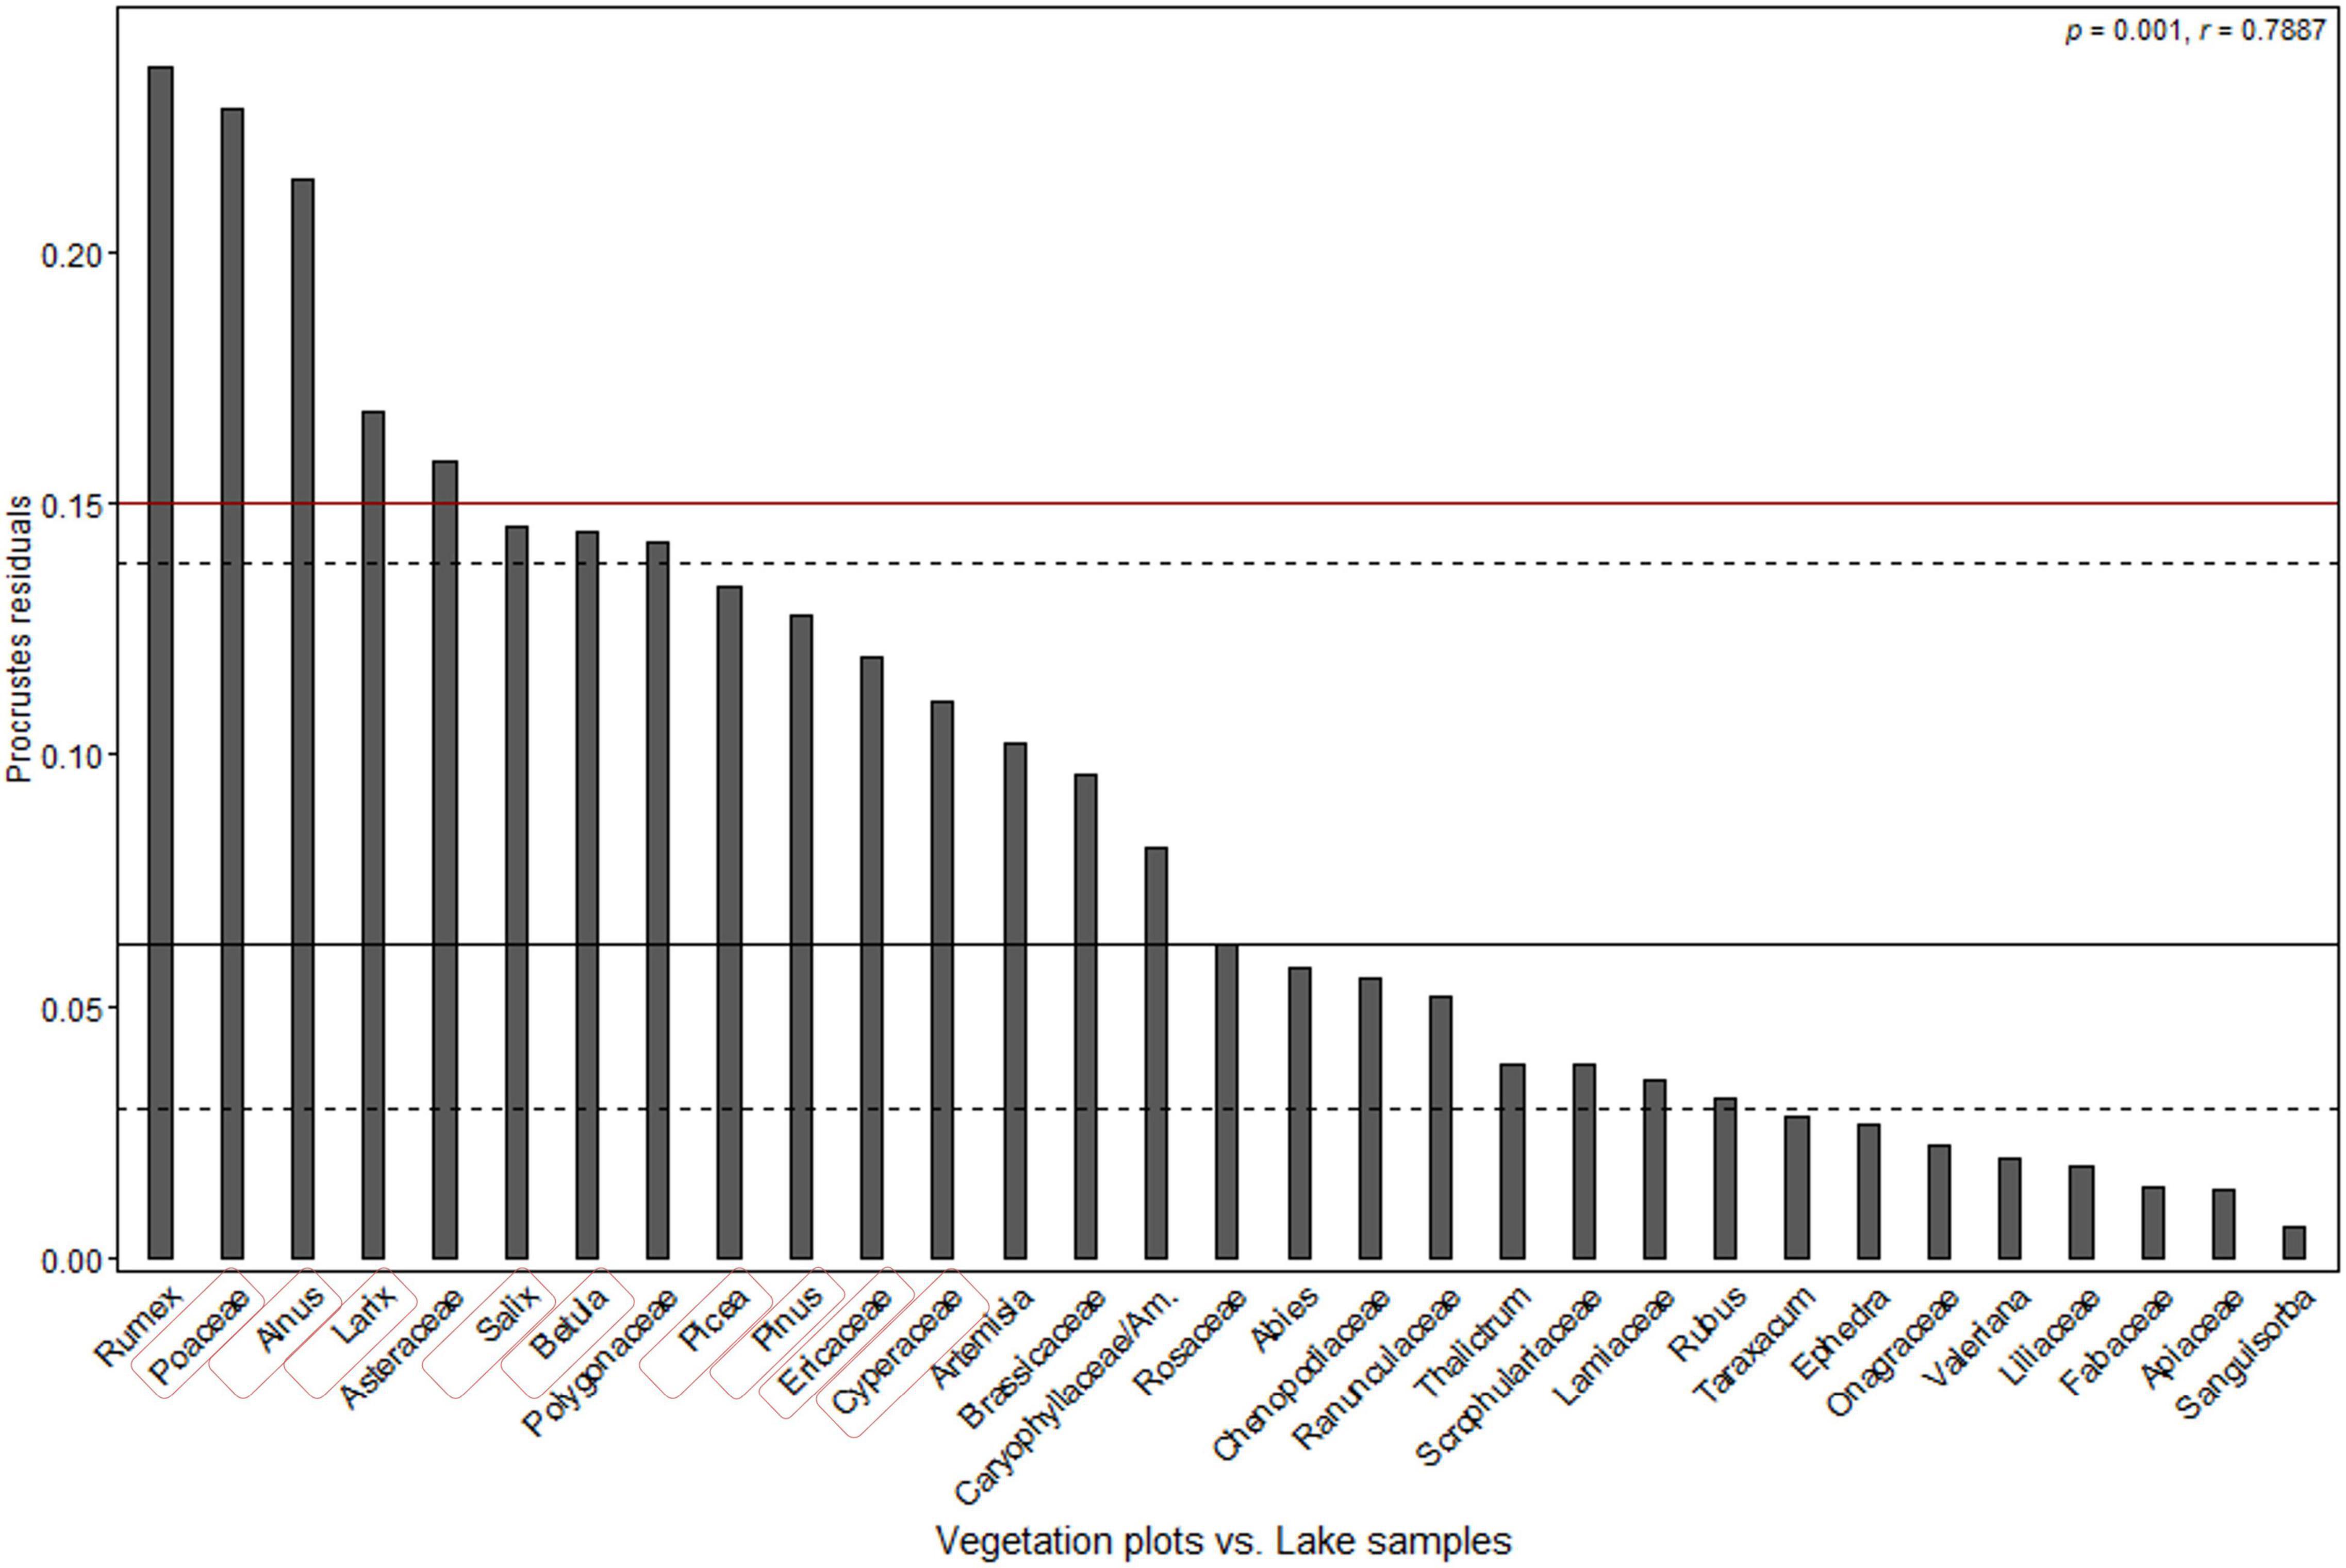
Figure 5. PROCRUSTES residuals plot of comparison between principal component analysis (PCA) taxa scores of moss/soil samples and lake samples (ordered according to the residual scores). Dashed and solid lines are the first, second, and third quartiles. The p-value indicates the likelihood of the relationship occurring by chance and the r-value reflects the correlation between the two ordination results. Taxa used in ERV model were highlighted in red rectangle.
Relevant Source Area of Pollen and Relative Pollen Productivity Estimates
Chukotka
Out of the three sub-models, sub-model 1 was excluded at first based on the plots of log-likelihood against distance (Figure 6). The RSAP is ca. 500 m with sub-model 3 and ca. 1300 m with sub-model 2 since the log-likelihood approached an asymptote (Figure 6A). Ericaceae and Betula exhibit a relationship that is closest to an ideal linear relationship in ERV adjusted pollen proportions and vegetation proportions using sub-model 2 (Supplementary Figure 1A).
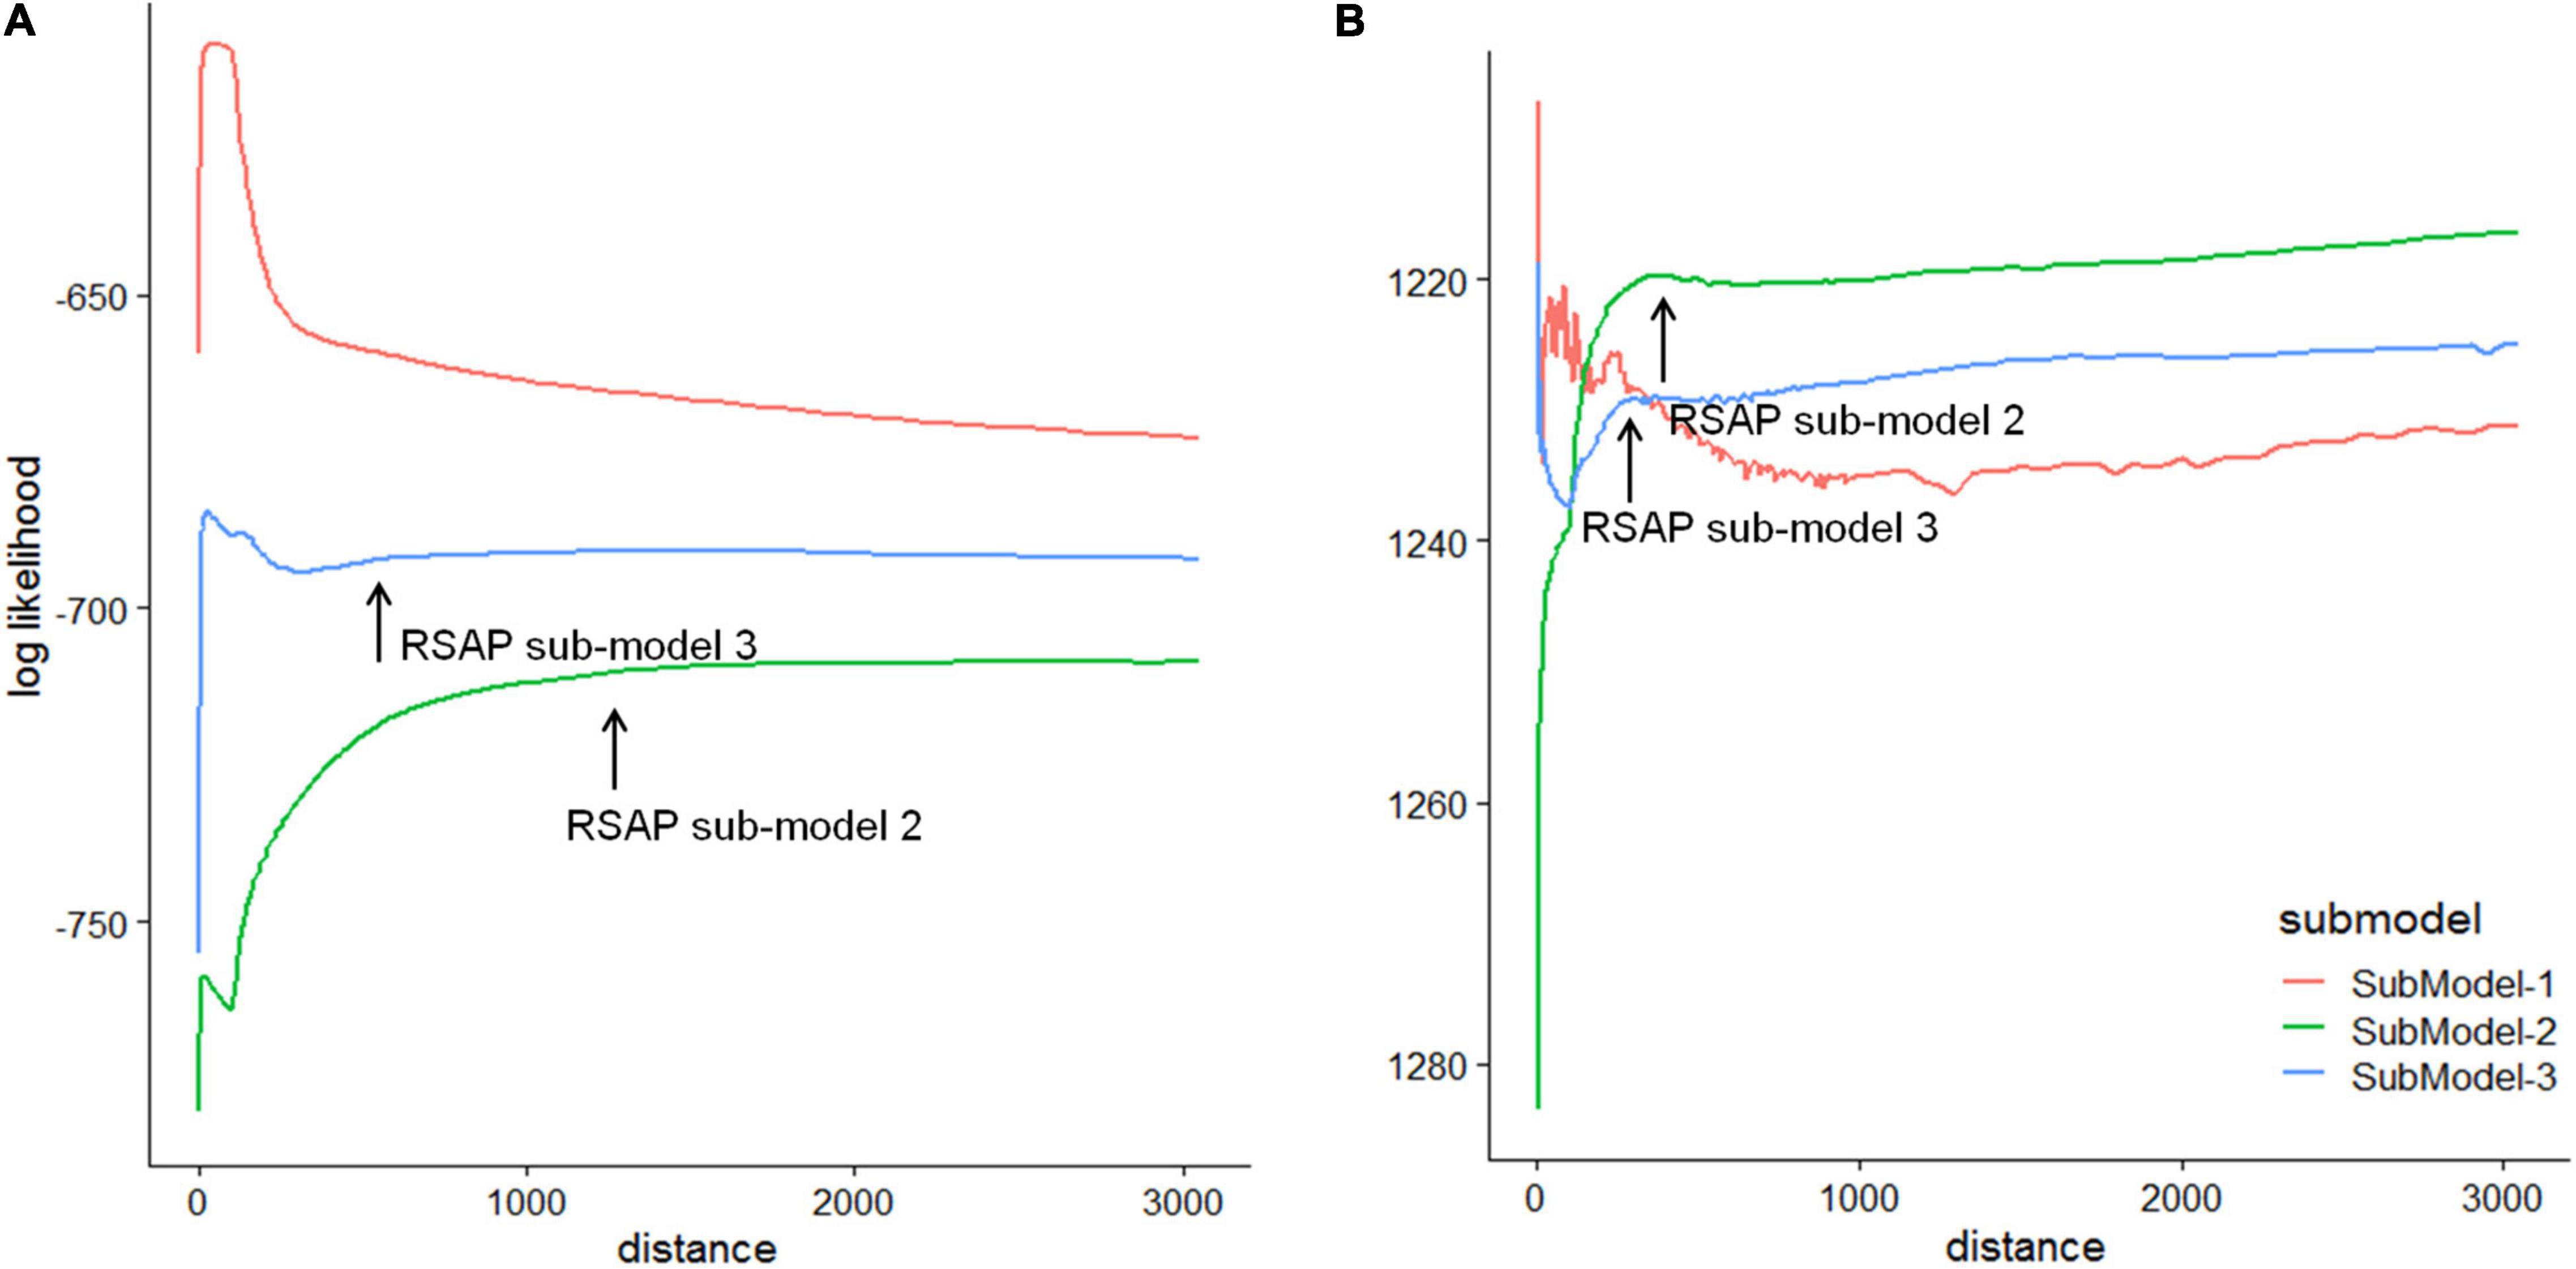
Figure 6. Plots of the log-likelihood against distance from the sampling point using three ERV sub-models for (A) Chukotka and (B) Yakutia, based on pollen data from moss/soil samples and vegetation data within a 3000 m radius.
The RPP estimates relative to both Poaceae and Ericaceae for 6 taxa and their standard deviations (SDs) were calculated using two ERV sub-models (Table 4). ERV sub-model 2 mostly produces higher RPPs than sub-model 3 except for Cyperaceae. The ranking of the RPPs is the same for both ERV sub-models: Betula > Larix > Ericaceae > Poaceae > Salix > Cyperaceae with Ericaceae having a RPP of 1 (Figure 7). Cyperaceae and Salix have very low RPPs but their large standard deviations suggest that they may not be credible values.
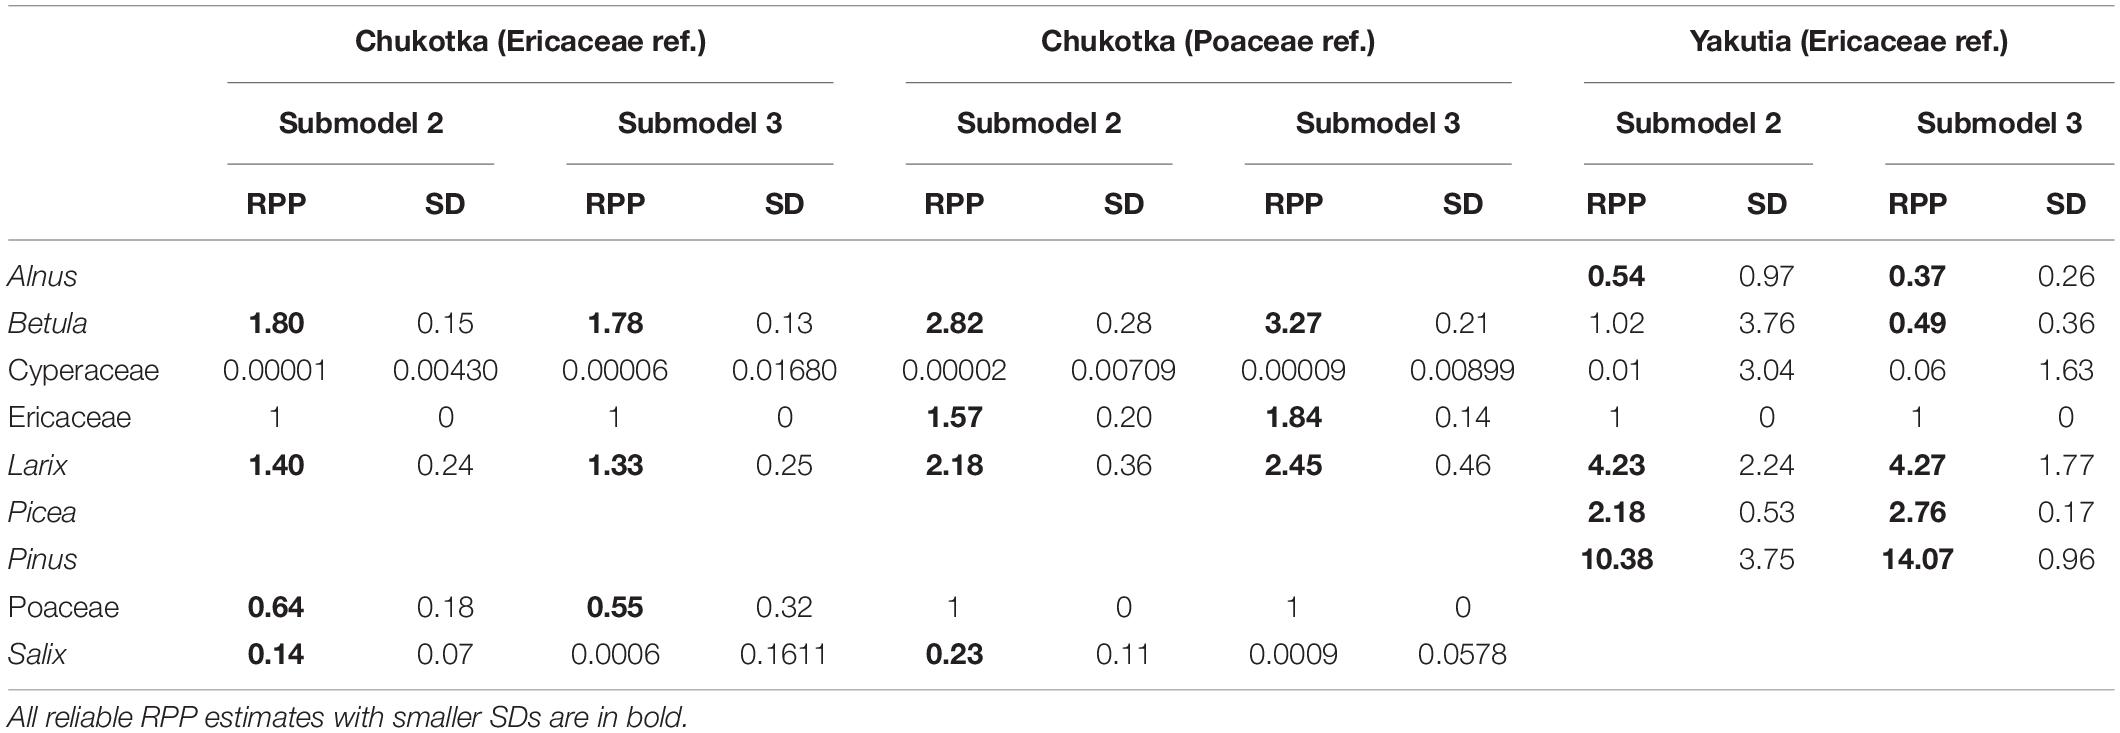
Table 4. Relative pollen productivity (RPP) estimates and standard deviations (SDs) for selected taxa in Chukotka and central Yakutia.
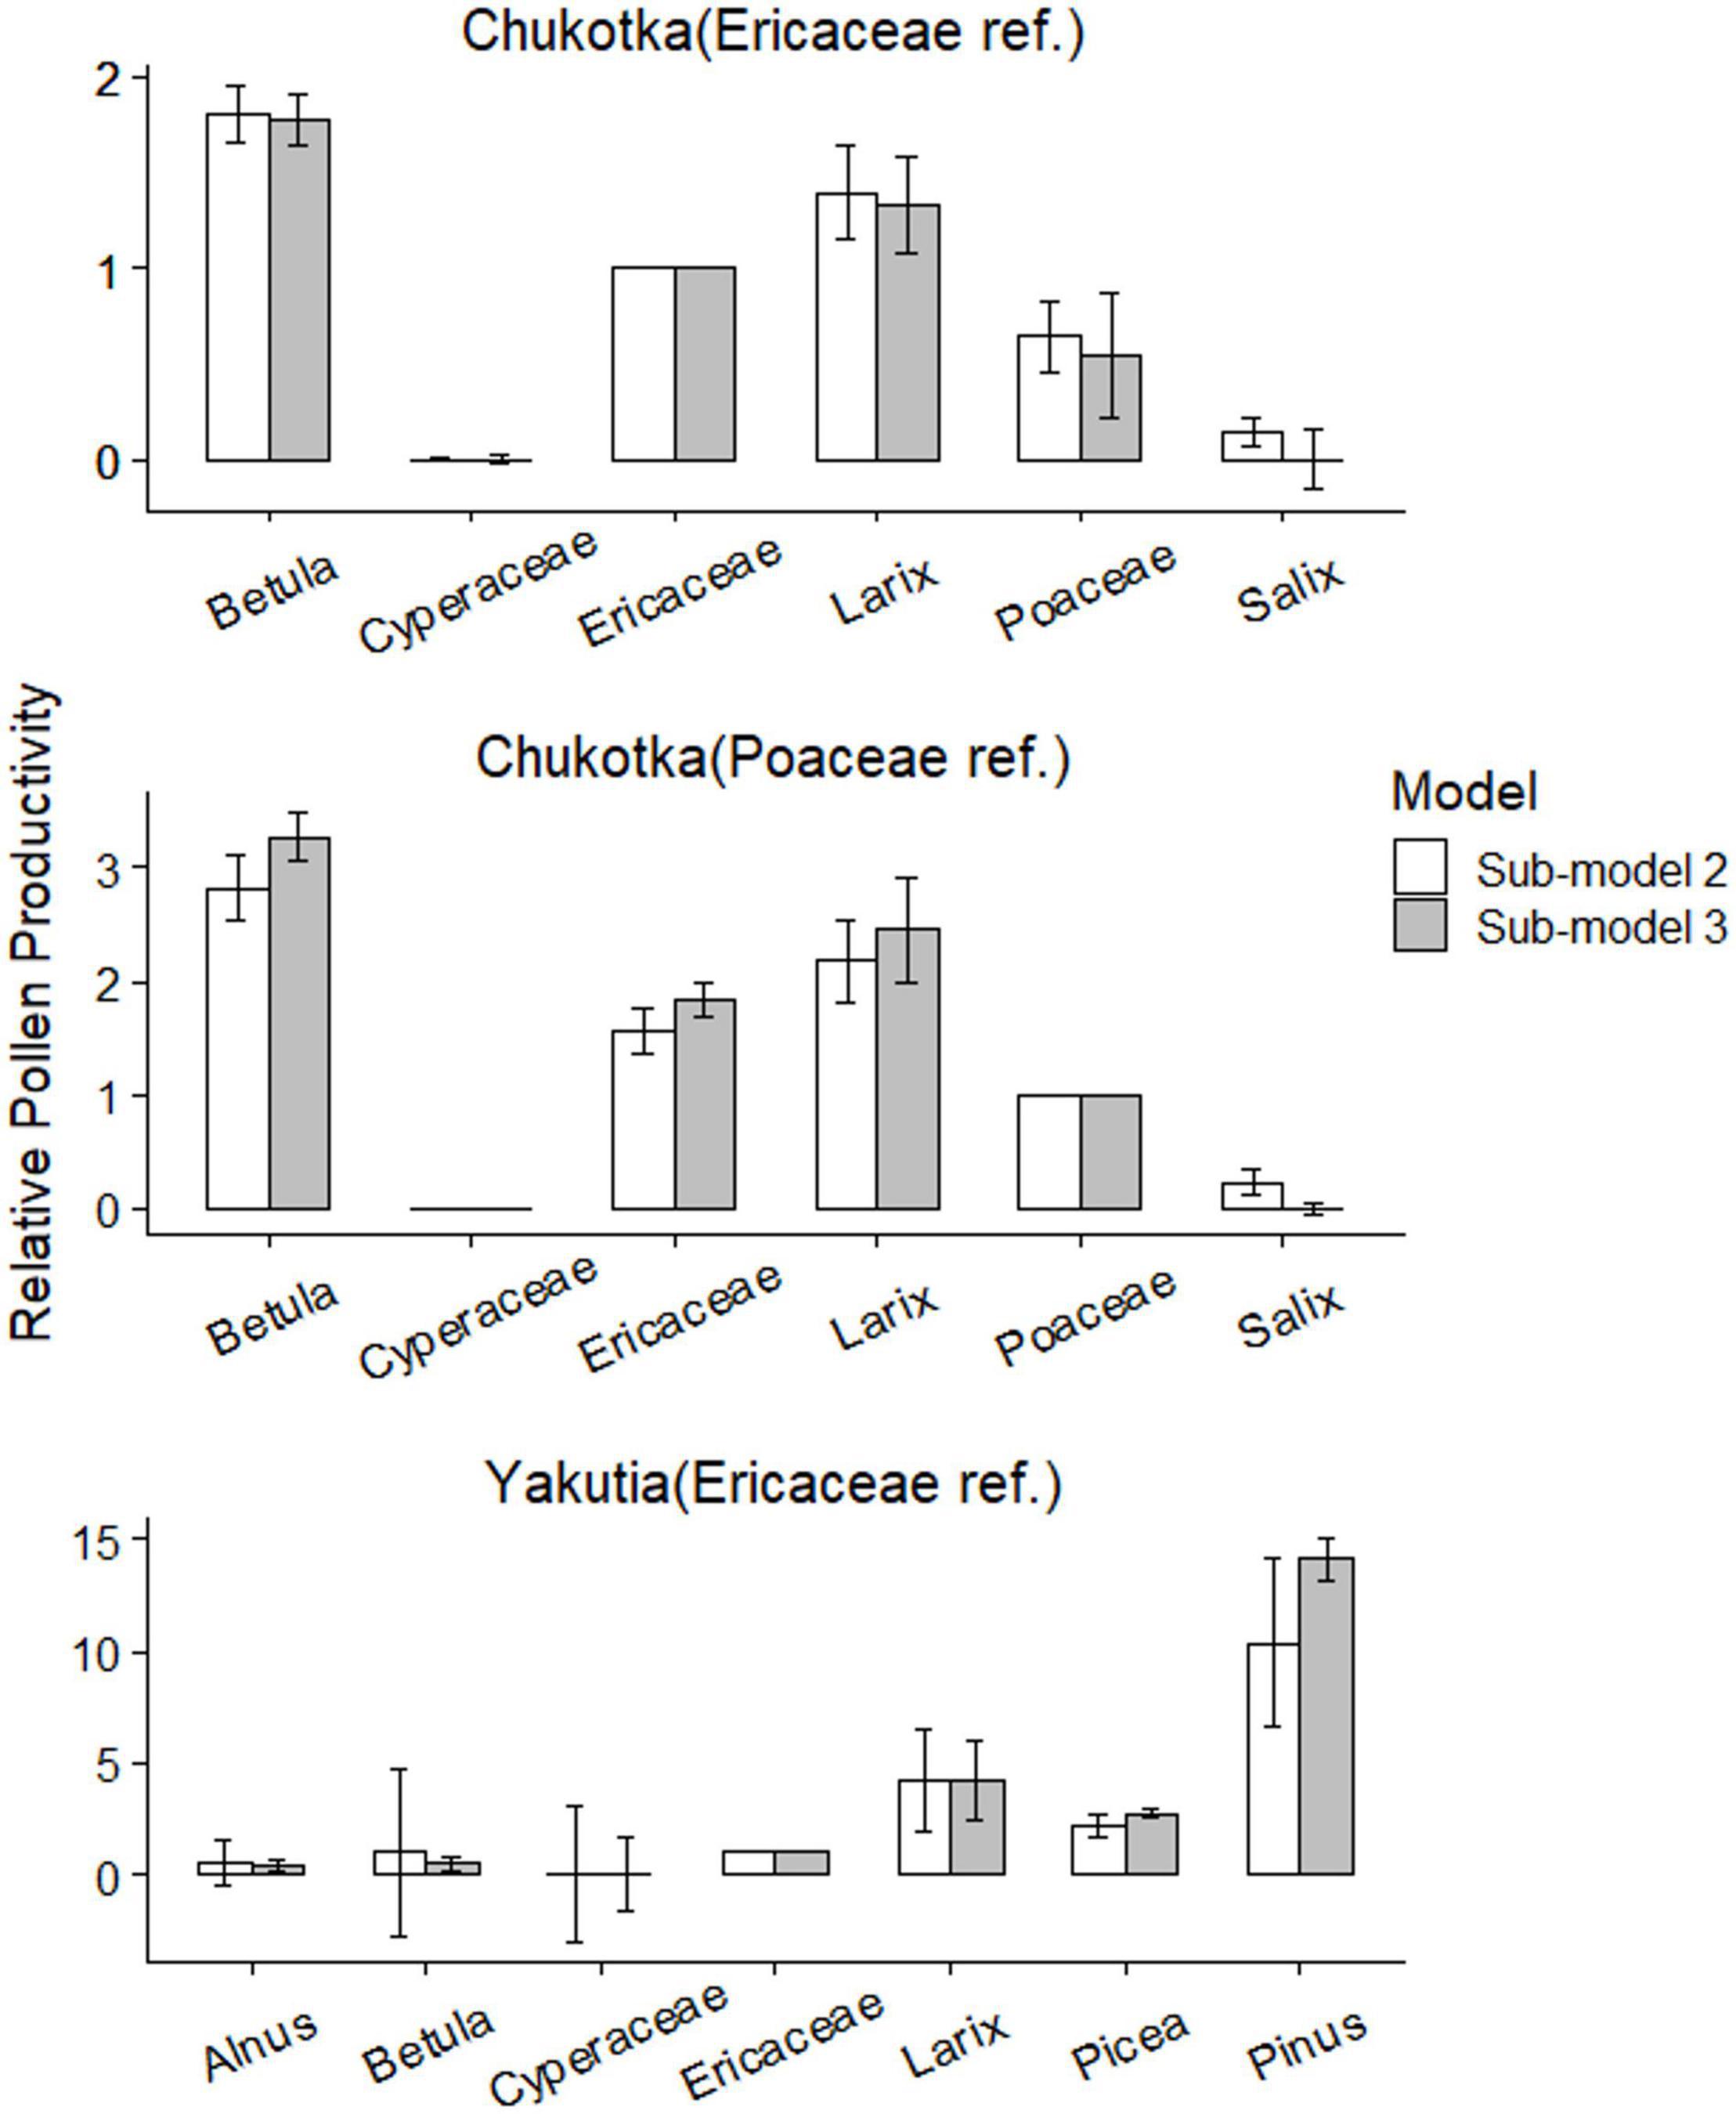
Figure 7. Relative pollen productivity estimates and errors for selected taxa, using plant cover data weighted by two ERV sub-models.
Central Yakutia
Out of the three sub-models, sub-model 1 was excluded at first based on the plots of log-likelihood against distance (Figure 6). The RSAP is ca. 250 m with sub-model 3 and ca. 360 m with sub-model 2 since the log-likelihood approached an asymptote (Figure 6B). Picea and Pinus exhibit a relationship that is closest to an ideal linear relationship in ERV adjusted pollen proportions and vegetation proportions using sub-model 2 (Supplementary Figure 1B).
The RPP estimates relative to Ericaceae for 7 taxa and their standard deviations (SDs) were calculated using two ERV sub-models (Table 4). ERV sub-models 2 and 3 produce similar but varying RPPs. The ranking of the RPPs is the same for both ERV sub-models: Pinus > Larix > Picea > Ericaceae > Betula > Alnus > Cyperaceae with Ericaceae having a RPP of 1 (Figure 7). Cyperaceae and Alnus have very low RPPs but their large standard deviations suggest that they may not be credible values. Betula also has a very large standard deviation.
Discussion
Pollen-Vegetation-Climate Relationship
Our surface pollen assemblages reflect the vegetation types well in terms of dominant taxa in the study regions. Furthermore, pollen spectra from Middle Taiga and Mountain Tundra are unique as revealed by RDA. Pinus and Picea have positive RDA scores (Figure 4), as do most samples from central Yakutia, reflecting the Middle Taiga ecoregion. Ericaceae, Betula, Alnus, Salix, and Cyperaceae have negative RDA scores, reflecting the ecoregion of Mountain Tundra from Chukotka. The samples from Open Woodlands are scattered around the center of the RDA plots, which is reasonable since this represents a spatially and ecologically transitional vegetation type between tundra and taiga. There are only two sites that are inconsistent with this pattern: EN18008 and EN18065. The vegetation survey of EN18008 found Pinus pumila shrubs, which has resulted in a high proportion of Pinus in the pollen data and may explain why it was distributed among the samples from central Yakutia in the RDA plot. Our ordination results are similar to other studies. For example, Pelánková and Chytrý (2009) compare proportions of plant species in actual vegetation and their pollen types in surface pollen spectra along transects in the steppe, forest, and tundra of the valleys of the Russian Altai Mountains and conclude that pollen taxa abundances of Betula nana, Larix, Picea, and Salix are significantly correlated to the surrounding vegetation. In a PCA of modern pollen spectra in north-eastern Siberia from Klemm et al. (2013), regional differences between tundra and taiga are reflected.
Betula and Ericaceae in Chukotka and Picea and Pinus in central Yakutia exhibit relationships that are closest to a perfect linear relationship (Supplementary Figure 1). It is common in RPP studies that only a few taxa can fit the theoretical ERV-model linear relationship. A non-perfect relationship might be due to the discrepancy between pollen productivity and pollen dispersion, leading to unevenness in the pollen data and vegetation data (e.g., Alnus, Salix, Cyperaceae). Other factors influencing the pollen–vegetation relationship may be stochastic pollen dispersal processes, for example by insects rather than wind transport, or pollen transported in clumps rather than as single grains (Tufto et al., 1997; Theuerkauf et al., 2013; Li et al., 2017).
Pollen composition is numerically related to temperature and precipitation (Figure 4). Pinus and Picea are characteristic of the samples from central Yakutia with relatively high MAT, whereas Betula, Cyperaceae, and Ericaceae, are indicator taxa in samples from Chukotka and dominate under low MAT. This is in accordance with results from previous studies of Siberian surface pollen spectra (e.g., Pelánková and Chytrý, 2009; Klemm et al., 2013). It suggests that the relationship between pollen assemblages and climate variables is rather tight, and that palaeoclimates can be reasonably accurately reconstructed from fossil pollen records.
Although these correlations may provide climate indicators, the relationships between climate variables and a single taxon can be different in different areas. For example, Pelánková et al. (2008), based on their studies in southern Siberia, suggest that a high proportion of Pinus pollen indicates low summer temperatures and higher precipitation and the occurrence of Larix pollen indicates low winter temperatures and low precipitation, which contrasts with the positive correlation between MAT and Pinus and the insignificant correlation between Larix and temperature in this study. This contrast can be attributed to the range of climate variables and vegetation types in geographically different areas.
Pollen Assemblages in Different Sediment Types
PROCRUSTES analysis of PCA taxa scores reveals that pollen data from moss/soil and lake samples have a similar distribution (m12 = 0.378, r = 0.7887). However, there are some differences in the representation of several pollen taxa originating from different sediment types as indicated by, for example, the high PROCRUSTES residuals of Poaceae, Alnus, Larix, and Salix (Figure 5). The pollen percentages of Larix in lake samples from central Yakutia are generally larger than those from the moss/soil samples (Supplementary Figure 2). This finding is in accordance with the RPP estimates from moss surface and lacustrine surface-sediment samples in arctic Siberia (Niemeyer et al., 2015). The pollen percentages of Ericaceae from different sample types varied apparently in terms of mean value and variation range (Supplementary Figure 2). The variation of pollen assemblages in different sediment types may be attributed to the size of the source area which depends on the diameter of a sampling site (Sugita, 1993, 1994). Pollen data from large lakes show little site-to-site variation even if vegetation is highly heterogeneous compared with pollen data from smaller source area (Sugita, 2007a,b). Therefore, the majority of the pollen in moss/soil samples is likely to originate from local plants, while the lake surface-sediments contain pollen from a larger source area (Bunting, 2002; Zhao et al., 2009). Lisitsyna et al. (2012) state that lake sediment samples from mountain birch woodland tend to overestimate pine and underestimate birch while those from pine forest tend to have higher birch percentages than moss samples, which aligns with our results.
The vegetation type of the sampling sites from central Yakutia is Middle Taiga with more trees and less herbs than the Mountain Tundra and Open Woodlands of sampling sites from Chukotka. Lake samples are characterized by higher amounts of Poaceae and Cyperaceae, especially in samples from central Yakutia (Supplementary Figure 2). This might be explained by the higher presence of sedges around the lakes. The Poaceae family includes a number of plant species with very different ecological tolerances. As most fossil pollen records are collected from wet settings, it is difficult but critically important that palynologists recognize whether Poaceae pollen is derived from meadow and marshes that surround their coring site. Interpretations of the pollen signals of Poaceae are likely to overstate “dry” episodes (Bush, 2002).
Relative Pollen Productivity Estimates and Relevant Source Area of Pollen
Based on the plots of log-likelihood against distance from the sampling point (Figure 6), sub-model 2 provided a more satisfactory curve and reached an asymptote with the most relatively constant values for both regions. Therefore, sub-model 2 is the most appropriate model to estimate the RSAPs and RPPs for Chukotka and central Yakutia. Estimated RSAPs for moss/soil samples are respectively 1300 and 360 m for the Chukotka tundra and central Yakutia taiga, and are similar to other estimates (see Table 5). Several studies (Sugita et al., 1999; Bunting et al., 2004; Broström et al., 2005) suggest that different RSAPs are caused by the distribution and size of the vegetation patches when the basin size is constant. Larger patches and grids will lead to an increase in RSAP (Qin et al., 2020). Other factors such as the taxa included in the analysis and the method used to select sample locations can also influence the estimated RSAP (Broström et al., 2005; Nielsen and Sugita, 2005). Differences in RSAPs may also be due to the number of taxa included and the plant characteristics of the studied landscape (Li et al., 2017). Mixed herb-tree vegetation may have a larger RSAP than all-herb or all-tree vegetation (Bunting and Hjelle, 2010). In our case, taxa included in the ERV analysis of sites from Chukotka are fewer than those from central Yakutia and the vegetation type in Chukotka is mostly tundra with mixed herb and tree taxa while the vegetation in central Yakutia is mainly different types of forest. Moreover, large patch size and the openness can also lead to a relatively larger RSAP in Chukotka.
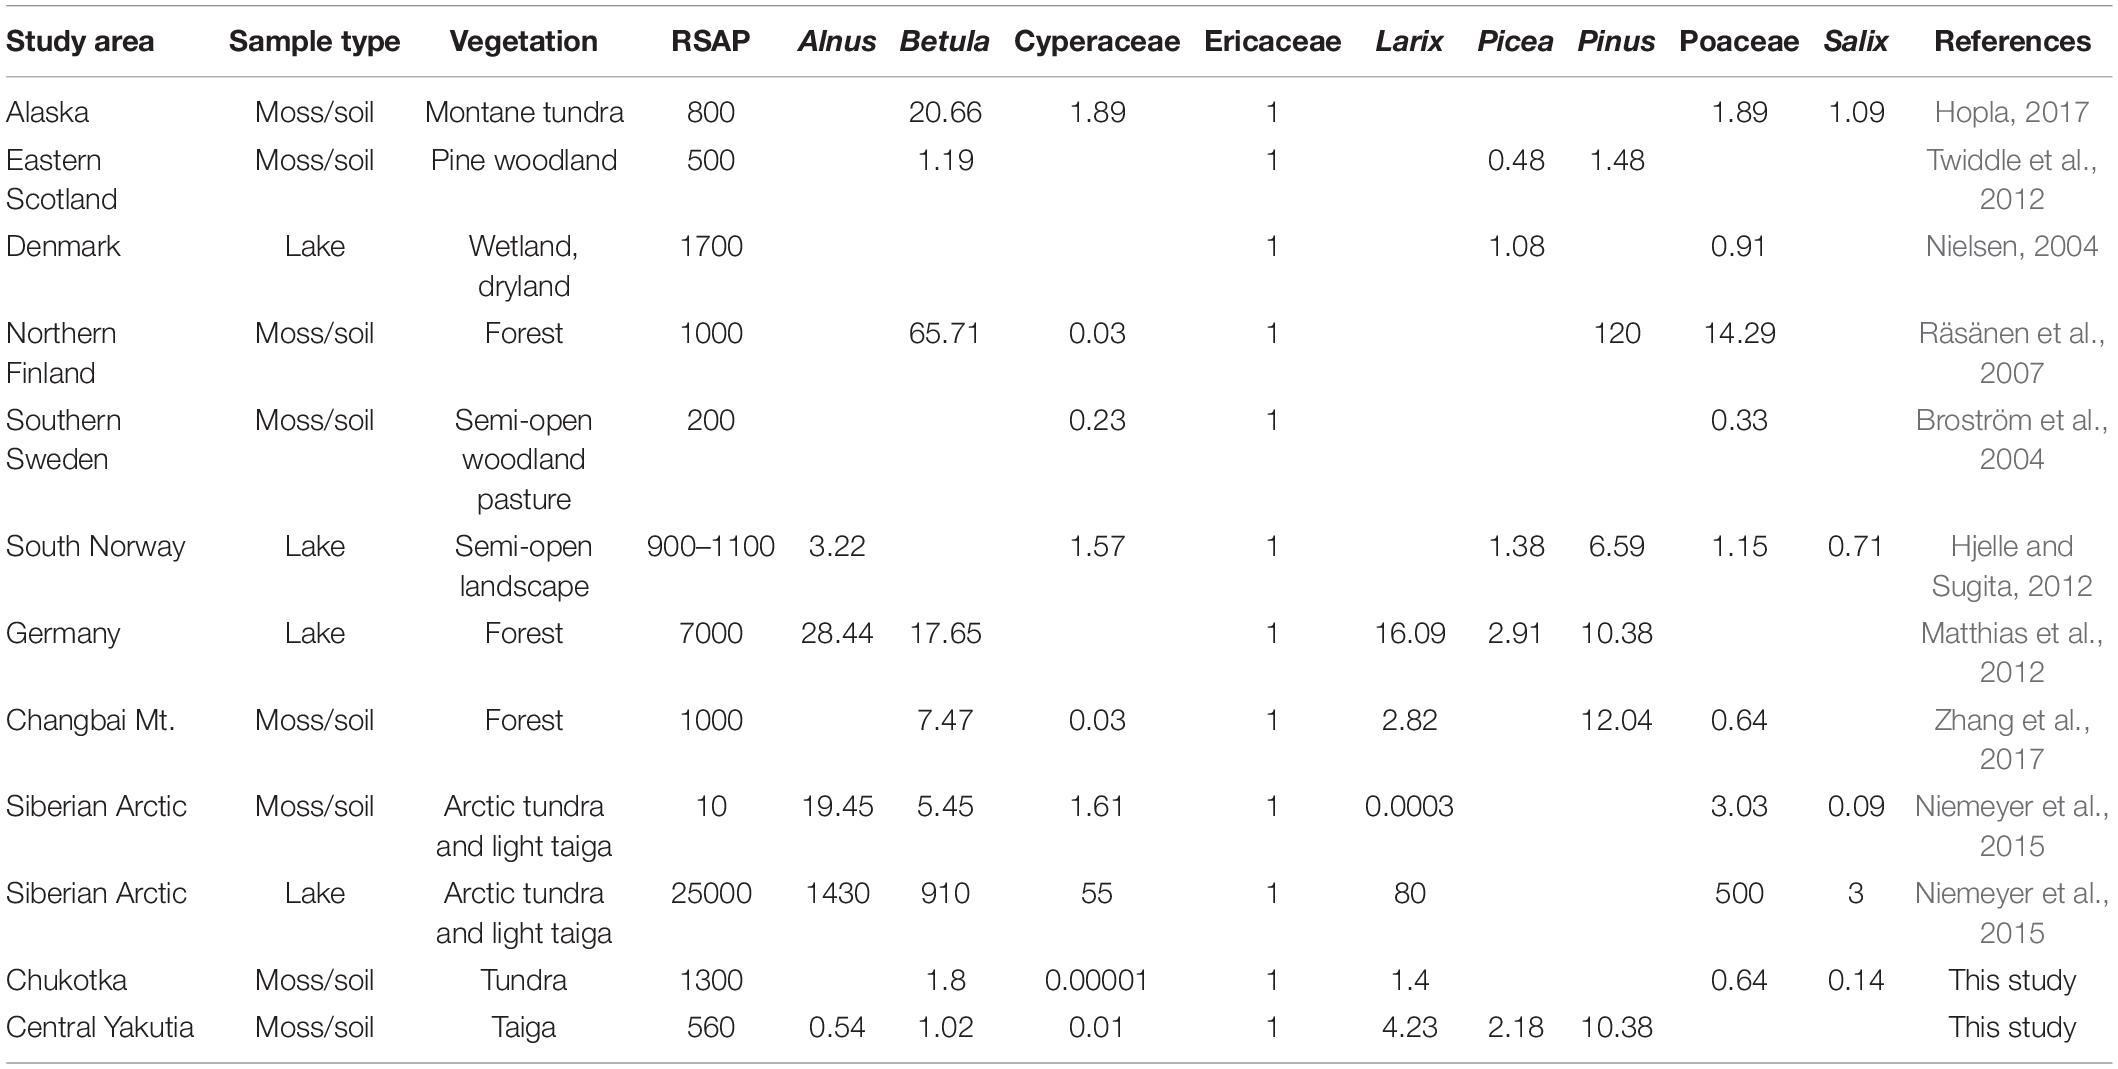
Table 5. Relative pollen productivity (RPP) estimates rescaled relative to Ericaceae (RPPs from Changbai Mt. and Germany were rescaled based on the relationship between their original reference taxa and Ericaceae in this study) in previously published studies for selected taxa that are compared with this study.
Our RPPs of Larix (RPPchukotka: 1.40 ± 0.24, RPPyakutia: 4.23 ± 2.24), Betula (RPPchukotka: 1.80 ± 0.15, RPPyakutia: 1.02 ± 3.76), Picea (RPPyakutia: 2.18 ± 0.53), and Pinus (RPPyakutia: 10.38 ± 3.75) suggested that they are overrepresented in the pollen spectra, while Alnus (RPPyakutia: 0.54 ± 0.97), Cyperaceae (RPPchukotka: 0.00001 ± 0.00430, RPPyakutia: 0.01 ± 3.04), Poaceae (RPPchukotka:0.64 ± 0.18), and Salix (RPPchukotka:0.14 ± 0.07) are underrepresented. The RPPs for most taxa in this study compare reasonably well with published studies except Alnus, Cyperaceae, and Salix.
Even for the same taxa such as Betula (RPPchukotka: 1.80 ± 0.15, RPPyakutia: 1.02 ± 3.76) and Larix (RPPchukotka: 1.40 ± 0.24, RPPyakutia: 4.23 ± 2.24), the RPP estimates show variation. The reliability of RPP estimates can be assessed by their standard deviations. If the SD is larger than the RPP value, it implies that the estimated RPP is not different from zero and should be considered as unreliable (Li et al., 2017). In our study, the large standard deviations for Alnus (RPPyakutia: 0.54 ± 0.97) and Betula (RPPyakutia: 1.02 ± 3.76) for Yakutia and for Cyperaceae (RPPchukotka: 0.00001 ± 0.00430, RPPyakutia: 0.01 ± 3.04) for both areas suggest that they may not be credible values. We can also compare the results from sub-model 2 with sub-model 3. Sub-model 2 (Prentice and Parsons, 1983) was developed for datasets where both pollen and vegetation data are available as percentages while sub-model 3 (Sugita, 1994) can be used if absolute vegetation abundance (m–2 m2) is known. Sub-model 2 assumes that the background pollen of each taxon is a constant proportion of total plant abundance (Prentice and Parsons, 1983) and sub-model 3 assumes that the background pollen comes from beyond the RSAP. Large variation in total plant abundance among sites may result in less good estimates from sub-model 2 (Prentice and Parsons, 1983). The taxa with similar RPPs are Betula, Larix, and Poaceae for Chukotka and Larix, Picea, and Pinus for central Yakutia. The RPP of Salix (0.14, 0.0006) is significantly different with both sub-models, hence its use should be treated with care.
To compare our results with other studies, RPP estimates in previously published studies were rescaled relative to Ericaceae for major taxa (Table 5 and Figure 8). The large differences between RPP estimates may be due to different species and vegetation types between regions. Differences in methodology for vegetation data collection (Bunting and Hjelle, 2010) and fall speed of pollen can also influence the result of RPP estimates. Our RPP estimates for Betula (RPPchukotka: 1.80 ± 0.15, RPPyakutia: 1.02 ± 3.76) and Poaceae (RPPchukotka: 0.64 ± 0.18) are relatively small while our RPP estimates for Picea (RPPyakutia: 2.18 ± 0.53) and Pinus (RPPyakutia: 10.38 ± 3.75) are relatively large compared with other studies. Even though Larix is normally regarded as a very underrepresented taxon, according to our results, the RPP for Larix is not as low as the value from moss/soil samples in Niemeyer et al. (2015) and is similar to other studies (e.g., Matthias et al., 2012; Zhang et al., 2017). Besides, RPP estimates for Larix (RPPchukotka: 1.40 ± 0.24, RPPyakutia: 4.23 ± 2.24) vary not only in our own study but also in other studies. Nevertheless, most RPP estimates of selected taxa in this study are comparable with published studies except Alnus, Cyperaceae, and Salix. The large standard deviations and/or the dissimilar values returned by the different sub-models may indicate that our results for these taxa are of limited reliability. Estimates of RPP values can be tested by using them in pollen-based reconstructions of modern or palaeovegetation.
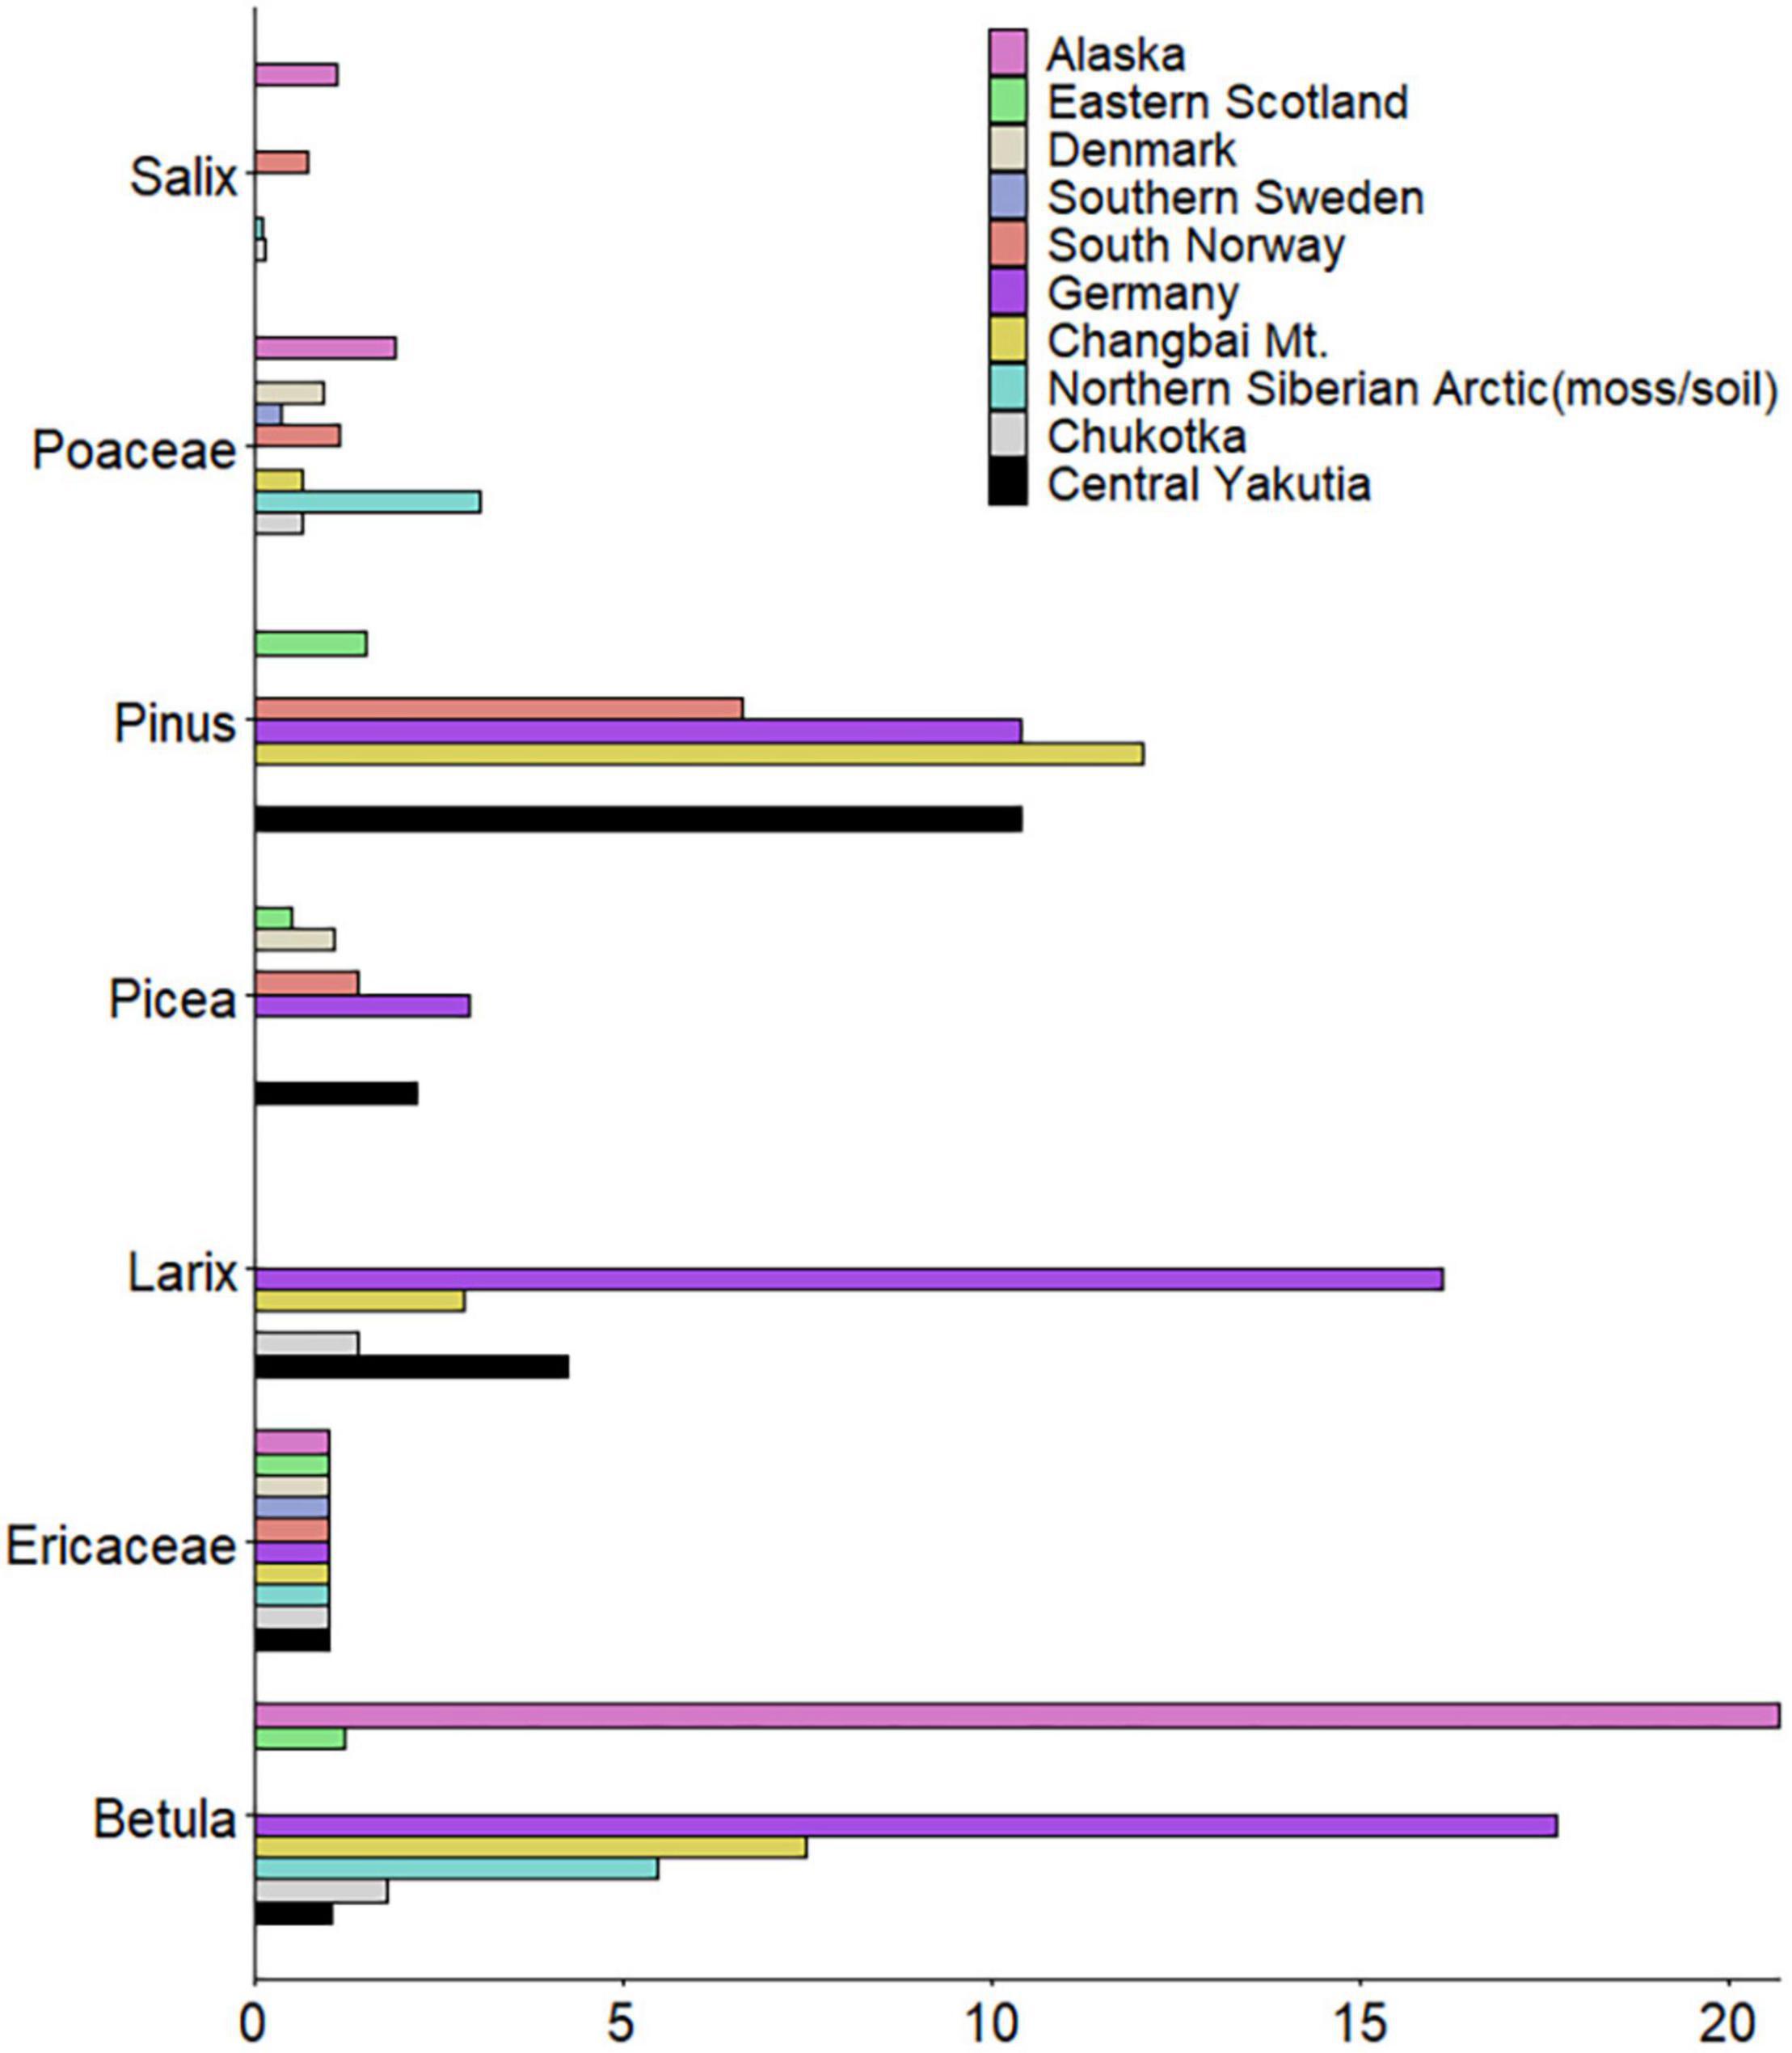
Figure 8. Relative pollen productivity (RPP) estimates of seven selected taxa (Alnus and Cyperaceae were excluded because of high standard deviations) compared to RPPs from other studies (Northern Finland and lake samples from Siberian Arctic were excluded as outliers).
Conclusion
Our study reveals that the surface pollen assemblages from Chukotka and central Yakutia numerically reflect the main vegetation types as well as the climate, particularly temperature.
Pollen data from moss/soil and lake samples have a generally similar distribution and significant consistency. Still, for some pollen taxa differences are observed: we find a high abundance of Poaceae and Cyperaceae in lake samples, which at least partly originates from overrepresented wetland taxa in the direct vicinity of the lakes. In contrast to expectation, Larix has higher abundances in lake samples than in moss/soil samples. Furthermore, pollen percentages of major taxa in moss/soil samples show a higher variability compared to lake samples.
The RSAP of the tundra-forest transition area in Chukotka and the taiga area in central Yakutia are ca. 1300 and 360 m, respectively. For Chukotka, RPPs relative to both Poaceae and Ericaceae have been estimated while RPPs for central Yakutia are relative to Ericaceae. Larix, Betula, Picea, and Pinus are overrepresented while Alnus, Cyperaceae, Poaceae, and Salix are underrepresented in the pollen spectra. The RPPs for Alnus, Cyperaceae, and Salix should be used with caution. Our estimates are in general agreement with previously published values and provide a base for a reliable quantitative reconstruction of East Siberian vegetation.
Our new modern pollen data contribute to the existing modern pollen databases (Davis et al., 2020) and can be used as analogs of tundra and taiga under cold climate conditions. Our results have implications for the interpretation of fossil pollen records and the quantitative reconstruction of past vegetation and climate.
Data Availability Statement
The datasets presented in this study can be found in online repositories. The names of the repository/repositories and accession number(s) can be found below: https://doi.pangaea.de/10.1594/PANGAEA.941577.
Author Contributions
RG identified all the pollen samples and wrote the draft. AA helped with identifying pollen, discussed about the results, and revised the draft. SK, BH, FvG, and IS provided and classified the vegetation data. LP, EZ, and ET helped to collect samples and identify the vegetation data. FL helped with running the ERV model. YZ and UH discussed the results and revised the manuscript. All authors contributed to the article and approved the submitted version.
Funding
This work was supported by the China Scholarship Council (File No. 201904910635), the ERC consolidator grant Glacial Legacy of Ulrike Herzschuh (Grant No. 772852) the Strategic Priority Research Program of the Chinese Academy of Sciences (No. XDA20070101). The work of AA was financed by Glacial Legacy grant from European Research Council Consolidator Grant 2018-2023. This work has also been supported by the Ministry of Education and Science of the Russian Federation #FSRG2020-0019.
Conflict of Interest
The authors declare that the research was conducted in the absence of any commercial or financial relationships that could be construed as a potential conflict of interest.
Publisher’s Note
All claims expressed in this article are solely those of the authors and do not necessarily represent those of their affiliated organizations, or those of the publisher, the editors and the reviewers. Any product that may be evaluated in this article, or claim that may be made by its manufacturer, is not guaranteed or endorsed by the publisher.
Acknowledgments
We thank our colleagues from the joint Russian–German expedition 2016 and 2018 for their support in the field. We thank Kathleen Stoof-Leichsenring, Sarah Olischläger, and Antonia Schönberg for support with the laboratory work. Special thanks to Feng Qin, Qiaoyu Cui, and Thomas Böhmer for their help in conducting the analyses. We also thank Cathy Jenks for her help in English writing.
Supplementary Material
The Supplementary Material for this article can be found online at: https://www.frontiersin.org/articles/10.3389/fevo.2022.837857/full#supplementary-material
References
Abraham, V., Novák, J., Houfková, P., Petr, L., and Dudová, L. (2017). A Landscape Reconstruction Algorithm and pedoanthracological data reveal Late Holocene woodland history in the lowlands of the NE Czech Republic. Rev. Palaeobot. Palynol. 244, 54–64. doi: 10.1016/j.revpalbo.2017.04.009
Agisoft (2018). Agisoft PhotoScan User Manual Professional Edition, Version 1.4. Available online at: https://www.agisoft.com/pdf/photoscan-pro_1_4_en.pdf
Andreev, A., and Klimanov, V. A. (2001). Vegetation and climate in the low reaches of Yana River during Holocene. Polar Geogr. 25, 62–71.
Andreev, A. A., and Klimanov, V. A. (2000). Quantitative Holocene climatic reconstruction from Arctic Russia. J. Paleolimnol. 24, 81–91. doi: 10.1023/A:1008121917521
Andreev, A. A., Klimanov, V. A., and Sulerzhitsky, L. D. (2001). Vegetation and climate history of the Yana River lowland, Russia, during the last 6400yr. Quat. Sci. Rev. 20, 259–266. doi: 10.1016/S0277-3791(00)00118-9
Andreev, A. A., Schirrmeister, L., Tarasov, P. E., Ganopolski, A., Brovkin, V., Siegert, C., et al. (2011). Vegetation and climate history in the Laptev Sea region (Arctic Siberia) during Late Quaternary inferred from pollen records. Quat. Sci. Rev. 30, 2182–2199. doi: 10.1016/j.quascirev.2010.12.026
Andreev, A. A., and Tarasov, P. E. (2013). “Northern asia,” in The Encyclopedia of Quaternary Science, eds S. Elias and C. J. Mock (Amsterdam: Elsevier), 164–172.
Andreev, A. A., Tarasov, P. E., Klimanov, V. A., Melles, M., Lisitsyna, O. M., and Hubberten, H.-W. (2004). Vegetation and climate changes around the Lama Lake, Taymyr Peninsula, Russia during the Late Pleistocene and Holocene. Quat. Int. 122, 69–84. doi: 10.1016/j.quaint.2004.01.032
Andreev, A. A., Tarasov, P. E., Wennrich, V., Raschke, E., Herzschuh, U., Nowaczyk, N. R., et al. (2014). Late Pliocene and Early Pleistocene vegetation history of northeastern Russian Arctic inferred from the Lake El’gygytgyn pollen record. Clim. Past 10, 1017–1039. doi: 10.5194/cp-10-1017-2014
Birks, H. J. B., and Berglund, B. E. (2018). One hundred years of Quaternary pollen analysis 1916–2016. Veg. Hist. Archaeobotany 27, 271–309. doi: 10.1007/s00334-017-0630-2
Brieger, F., Herzschuh, U., Pestryakova, L. A., Bookhagen, B., Zakharov, E. S., and Kruse, S. (2019). Advances in the derivation of northeast siberian forest metrics using high-resolution UAV-based photogrammetric point clouds. Remote Sens. 11:1447. doi: 10.3390/rs11121447
Broström, A., Sugita, S., and Gaillard, M.-J. (2004). Pollen productivity estimates for the reconstruction of past vegetation cover in the cultural landscape of southern Sweden. Holocene 14, 368–381. doi: 10.1191/0959683604hl713rp
Broström, A., Sugita, S., Gaillard, M.-J., and Pilesjö, P. (2005). Estimating the spatial scale of pollen dispersal in the cultural landscape of southern Sweden. Holocene 15, 252–262. doi: 10.1191/0959683605hl790rp
Bunting, M. J. (2002). Detecting woodland remnants in cultural landscapes: modern pollen deposition around small woodlands in northwest Scotland. Holocene 12, 291–301. doi: 10.1191/0959683602hl545rp
Bunting, M. J., Gaillard, M.-J., Sugita, S., Middleton, R., and Broström, A. (2004). Vegetation structure and pollen source area. Holocene 14, 651–660. doi: 10.1191/0959683604hl744rp
Bunting, M. J., and Hjelle, K. L. (2010). Effect of vegetation data collection strategies on estimates of relevant source area of pollen (RSAP) and relative pollen productivity estimates (relative PPE) for non-arboreal taxa. Veg. Hist. Archaeobotany 19, 365–374. doi: 10.1007/s00334-010-0246-2
Bunting, M. J., and Middleton, R. (2009). Equifinality and uncertainty in the interpretation of pollen data: the Multiple Scenario Approach to reconstruction of past vegetation mosaics. Holocene 19, 799–803. doi: 10.1177/0959683609105304
Bush, M. B. (2002). On the interpretation of fossil Poaceae pollen in the lowland humid neotropics. Palaeogeogr. Palaeoclimatol. Palaeoecol. 177, 5–17. doi: 10.1016/S0031-0182(01)00348-0
Chevalier, M., Davis, B. A. S., Heiri, O., Seppä, H., Chase, B. M., Gajewski, K., et al. (2020). Pollen-based climate reconstruction techniques for late Quaternary studies. Earth Sci. Rev. 210:103384. doi: 10.1016/j.earscirev.2020.103384
Clayden, S. L., Cwynar, L. C., and MacDonald, G. M. (1996). Stomate and pollen content of lake surface sediments from across the tree line on the Taimyr Peninsula, Siberia. Can. J. Bot. 74, 1009–1015. doi: 10.1139/b96-125
Cui, Q., Zhao, Y., Qin, F., Liang, C., Li, Q., and Geng, R. (2019). Characteristics of the modern pollen assemblages from different vegetation zones in Northeast China: implications for pollen-based climate reconstruction. Sci. China Earth Sci. 62, 1564–1577. doi: 10.1007/s11430-018-9386-9
Davis, B. A. S., Chevalier, M., Sommer, P., Carter, V. A., Finsinger, W., Mauri, A., et al. (2020). The Eurasian Modern Pollen Database (EMPD), version 2. Earth Syst. Sci. Data 12, 2423–2445. doi: 10.5194/essd-12-2423-2020
Eisenhut, G. (1961). Untersuchungen über die Morphologie und Ökologie der Pollenkörner heimischer und fremdländischer Waldbäume. Berlin: P. Parey.
Faegri, K., Iversen, J., Kaland, P. E., and Krzywinski, K. (2000). Textbook of Pollen Analysis, 4th Edn. Caldwell, NJ: The Blackburn Press.
Geng, R., Zhao, Y., Cui, Q., and Qin, F. (2019). Representation of modern pollen assemblages with respect to vegetation and climate in Northeast China. Quat. Int. 532, 126–137. doi: 10.1016/j.quaint.2019.11.003
Grimm, E. C. (2004). TGView Version 2.0.2. Springfield: Illinois State Museum, Research, and Collections Centre. Available online at: www.TiliaIT.com.
Hjelle, K. L., and Sugita, S. (2012). Estimating pollen productivity and relevant source area of pollen using lake sediments in Norway: how does lake size variation affect the estimates? Holocene 22, 313–324. doi: 10.1177/0959683611423690
Hopla, E.-J. (2017). A New Perspective on Quaternary Land Cover in Central Alaska. Available online at: https://eprints.soton.ac.uk/422162/ (accessed June 21, 2021).
Jackson, D. A. (1995). PROTEST: a PROcrustean randomization TEST of community environment concordance. Écoscience 2, 297–303. doi: 10.1080/11956860.1995.11682297
Klemm, J., Herzschuh, U., and Pestryakova, L. A. (2016). Vegetation, climate and lake changes over the last 7000 years at the boreal treeline in north-central Siberia. Quat. Sci. Rev. 147, 422–434. doi: 10.1016/j.quascirev.2015.08.015
Klemm, J., Herzschuh, U., Pisaric, M. F. J., Telford, R. J., Heim, B., and Pestryakova, L. A. (2013). A pollen-climate transfer function from the tundra and taiga vegetation in Arctic Siberia and its applicability to a Holocene record. Palaeogeogr. Palaeoclimatol. Palaeoecol. 386, 702–713. doi: 10.1016/j.palaeo.2013.06.033
Kobe, F., Bezrukova, E. V., Leipe, C., Shchetnikov, A. A., Goslar, T., Wagner, M., et al. (2020). Holocene vegetation and climate history in Baikal Siberia reconstructed from pollen records and its implications for archaeology. Archaeol. Res. Asia 23:100209. doi: 10.1016/j.ara.2020.100209
Kruse, S., Bolshiyanov, D., Grigoriev, M. N., Morgenstern, A., Pestryakova, L., Tsibizov, L., et al. (2019). Russian-German Cooperation: Expeditions to Siberia in 2018. Bremerhaven: Alfred-Wegener-Institut.
Kruse, S., Farkas, L., Brieger, F., Geng, R., Heim, B., Pestryakova, L. A., et al. (2021). SiDroForest: Orthomosaics, SfM Point Clouds and Products from Aerial Image Data of Expedition Vegetation Plots in 2018 in Central Yakutia and Chukotka, Siberia. Available online at: https://doi.pangaea.de/10.1594/PANGAEA.933263 (accessed July 19, 2021).
Leutner, B., Horning, N., Schwalb-Willmann, J., and Hijmans, R. J. (2019). RStoolbox: Tools for Remote Sensing Data Analysis. Available online at: https://CRAN.R-project.org/package=RStoolbox (accessed July 26, 2021).
Li, F., Gaillard, M.-J., Sugita, S., Mazier, F., Xu, Q., Zhou, Z., et al. (2017). Relative pollen productivity estimates for major plant taxa of cultural landscapes in central eastern China. Veg. Hist. Archaeobotany 26, 587–605. doi: 10.1007/s00334-017-0636-9
Li, Y., Nielsen, A. B., Zhao, X., Shan, L., Wang, S., Wu, J., et al. (2015). Pollen production estimates (PPEs) and fall speeds for major tree taxa and relevant source areas of pollen (RSAP) in Changbai Mountain, northeastern China. Rev. Palaeobot. Palynol. 216, 92–100. doi: 10.1016/j.revpalbo.2015.02.003
Liang, C., Zhao, Y., Qin, F., Zheng, Z., Xiao, X., Ma, C., et al. (2020). Pollen-based Holocene quantitative temperature reconstruction on the eastern Tibetan Plateau using a comprehensive method framework. Sci. China Earth Sci. 63, 1144–1160. doi: 10.1007/s11430-019-9599-y
Lisitsyna, O. V., Hicks, S., and Huusko, A. (2012). Do moss samples, pollen traps and modern lake sediments all collect pollen in the same way? A comparison from the forest limit area of northernmost Europe. Veg. Hist. Archaeobotany 21, 187–199. doi: 10.1007/s00334-011-0335-x
Magyari, E. K., Kuneš, P., Jakab, G., Sümegi, P., Pelánková, B., Schäbitz, F., et al. (2014). Late Pleniglacial vegetation in eastern-central Europe: are there modern analogues in Siberia? Quat. Sci. Rev. 95, 60–79. doi: 10.1016/j.quascirev.2014.04.020
Matsuura, K., and Willmott, C. J. (2018a). Terrestrial Air Temperature: 1900-2017 Gridded Monthly Time Series. Available online at: http://climate.geog.udel.edu/∼climate/html_pages/Global2017/README. GlobalTsT2017.html (accessed July 22, 2020).
Matsuura, K., and Willmott, C. J. (2018b). Terrestrial Precipitation: 1900-2017 Gridded Monthly Time Series. (accessed July 22, 2020).
Matthias, I., Nielsen, A. B., and Giesecke, T. (2012). Evaluating the effect of flowering age and forest structure on pollen productivity estimates. Veg. Hist. Archaeobotany 21, 471–484. doi: 10.1007/s00334-012-0373-z
Minckley, T., and Whitlock, C. (2000). Spatial variation of modern pollen in Oregon and southern Washington, USA. Rev. Palaeobot. Palynol. 112, 97–123. doi: 10.1016/S0034-6667(00)00037-3
Müller, S., Tarasov, P. E., Andreev, A. A., Tütken, T., Gartz, S., and Diekmann, B. (2010). Late Quaternary vegetation and environments in the Verkhoyansk Mountains region (NE Asia) reconstructed from a 50-kyr fossil pollen record from Lake Billyakh. Quat. Sci. Rev. 29, 2071–2086. doi: 10.1016/j.quascirev.2010.04.024
Murphy, R. J. (1995). The effects of surficial vegetation cover on mineral absorption feature parameters. Int. J. Remote Sens. 16, 2153–2164. doi: 10.1080/01431169508954548
Nielsen, A. B. (2004). Modelling pollen sedimentation in Danish lakes at c.ad 1800: an attempt to validate the POLLSCAPE model. J. Biogeogr. 31, 1693–1709. doi: 10.1111/j.1365-2699.2004.01080.x
Nielsen, A. B., and Sugita, S. (2005). Estimating relevant source area of pollen for small Danish lakes around AD 1800. Holocene 15, 1006–1020. doi: 10.1191/0959683605hl874ra
Niemeyer, B., Epp, L. S., Stoof-Leichsenring, K. R., Pestryakova, L. A., and Herzschuh, U. (2017). A comparison of sedimentary DNA and pollen from lake sediments in recording vegetation composition at the Siberian treeline. Mol. Ecol. Resour. 17, e46–e62. doi: 10.1111/1755-0998.12689
Niemeyer, B., Klemm, J., Pestryakova, L. A., and Herzschuh, U. (2015). Relative pollen productivity estimates for common taxa of the northern Siberian Arctic. Rev. Palaeobot. Palynol. 221, 71–82. doi: 10.1016/j.revpalbo.2015.06.008
Noaa National Centers for Environmental Information (2001). Global Surface Hourly Dataset. Available online at: https://data.noaa.gov/dataset/dataset/integrated-surface-dataset-global (accessed April 9, 2021).
Oksanen, J., Blanchet, F. G., Friendly, M., Kindt, R., Legendre, P., McGlinn, D., et al. (2019). vegan: Community Ecology Package. Available online at: https://CRAN.R-project.org/package=vegan (accessed August 3, 2020).
Overduin, P. P., Blender, F., Bolshiyanov, D. Y., Grigoriev, M. N., Morgenstern, A., and Meyer, H. (2017). Russian-German Cooperation: Expeditions to Siberia in 2016. Bremerhaven: Alfred-Wegener-Institut, Helmholtz-Zentrum für Polar- und Meeresforschung. doi: 10.2312/BzPM_0709_2017
Overpeck, J. T., Webb, T., and Prentice, I. C. (1985). Quantitative interpretation of fossil pollen spectra: dissimilarity coefficients and the method of modern analogs. Quat. Res. 23, 87–108. doi: 10.1016/0033-5894(85)90074-2
Parsons, R. W., and Prentice, I. C. (1981). Statistical approaches to R-values and the pollen— vegetation relationship. Rev. Palaeobot. Palynol. 32, 127–152. doi: 10.1016/0034-6667(81)90001-4
Pedregosa, F., Varoquaux, G., Gramfort, A., Michel, V., Thirion, B., Grisel, O., et al. (2011). Scikit-learn: machine learning in Python. J. Mach. Learn. Res. 12, 2825–2830. doi: 10.1080/13696998.2019.1666854
Pelánková, B., and Chytrý, M. (2009). Surface pollen–vegetation relationships in the forest-steppe, taiga and tundra landscapes of the Russian Altai Mountains. Rev. Palaeobot. Palynol. 157, 253–265. doi: 10.1016/j.revpalbo.2009.05.005
Pelánková, B., Kuneš, P., Chytrý, M., Jankovská, V., Ermakov, N., and Svobodová-Svitavská, H. (2008). The relationships of modern pollen spectra to vegetation and climate along a steppe–forest–tundra transition in southern Siberia, explored by decision trees. Holocene 18, 1259–1271. doi: 10.1177/0959683608096600
Peres-Neto, P. R., and Jackson, D. A. (2001). How well do multivariate data sets match? The advantages of a Procrustean superimposition approach over the Mantel test. Oecologia 129, 169–178. doi: 10.1007/s004420100720
Pisaric, M. F. J., MacDonald, G. M., Cwynar, L. C., and Velichko, A. A. (2001). Modern pollen and conifer stomates from North-central Siberian Lake sediments: their use in interpreting late quaternary fossil pollen assemblages. Arct. Antarct. Alp. Res. 33, 19–27. doi: 10.1080/15230430.2001.12003400
Prentice, I. C. (1985). Pollen representation, source area, and basin size: toward a unified theory of pollen analysis. Quat. Res. 23, 76–86. doi: 10.1016/0033-5894(85)90073-0
Prentice, I. C., and Parsons, R. W. (1983). Maximum likelihood linear calibration of pollen spectra in terms of forest composition. Biometrics 39, 1051–1057. doi: 10.2307/2531338
Qin, F., Bunting, M. J., Zhao, Y., Li, Q., Cui, Q., and Ren, W. (2020). Relative pollen productivity estimates for alpine meadow vegetation, northeastern Tibetan Plateau. Veg. Hist. Archaeobotany 29, 447–462. doi: 10.1007/s00334-019-00751-4
R Core Team (2019). R: A Language and Environment for Statistical Computing. Vienna: R Foundation for Statistical Computing.
Räsänen, S., Suutari, H., and Nielsen, A. B. (2007). A step further towards quantitative reconstruction of past vegetation in Fennoscandian boreal forests: pollen productivity estimates for six dominant taxa. Rev. Palaeobot. Palynol. 146, 208–220. doi: 10.1016/j.revpalbo.2007.04.004
Reille, M. (1992). Pollen et Spores d’Europe et d’Afrique du Nord (Pollen and Spores of Europe and North Africa). Marseille: Laboratoire de Botanique Historique et Palynologie.
Reille, M. (1995). Pollen et Spores d’Europe et d’Afrique du Nord, Supplément 1. Marseille: Laboratoire de Botanique Historique et Palynologie.
Reille, M. (1998). Pollen et Spores d’Europe et d’Afrique du Nord, Supplément 2. Marseille: Laboratoire de Botanique Historique et Palynologie.
Safronova, I., and Yurkovsksya, T. (2019). “The latitudinal distribution of vegetation cover in Siberia,” in Results and Prospects of Geobotanical Research in Siberia, Dedicated to the 75th Anniversary of the Laboratory of Ecology and Geobotany of Csbg Sb Ras 2019, eds N. N. Lashinsky and N. I. Makunina (Les Ulis: E D P Sciences).
Semeniuk, C. A., Milne, L., Ladd, P., and Semeniuk, V. (2006). Pollen in the surface sediments of wetlands in the Becher Point area, southwestern Australia: a baseline for use in interpreting Holocene sequences. J. R. Soc. West. Aust. 89, 27–43.
Stockmarr, J. (1971). Tablets with spores used in absolute pollen analysis. Pollen Spores 13, 615–621.
Stone, T. A., and Schlesinger, P. (2004). RLC Vegetative Cover of the Former Soviet Union, 1990. Oak Ridge: ORNL DAAC.
Sugita, S. (1993). A model of pollen source area for an entire Lake Surface. Quat. Res. 39, 239–244. doi: 10.1006/qres.1993.1027
Sugita, S. (1994). Pollen representation of vegetation in quaternary sediments: theory and method in patchy vegetation. J. Ecol. 82, 881–897. doi: 10.2307/2261452
Sugita, S. (2007a). Theory of quantitative reconstruction of vegetation I: pollen from large sites REVEALS regional vegetation composition. Holocene 17, 229–241. doi: 10.1177/0959683607075837
Sugita, S. (2007b). Theory of quantitative reconstruction of vegetation II: all you need is LOVE. Holocene 17, 243–257. doi: 10.1177/0959683607075838
Sugita, S., Gaillard, M.-J., and Broström, A. (1999). Landscape openness and pollen records: a simulation approach. Holocene 9, 409–421. doi: 10.1191/095968399666429937
Sun, J., Ma, C., Cao, X., Zhao, Y., Deng, Y., Zhao, L., et al. (2019). Quantitative precipitation reconstruction in the east-central monsoonal China since the late glacial period. Quat. Int. 521, 175–184. doi: 10.1016/j.quaint.2019.05.033
Tarasov, P., Williams, J. W., Andreev, A., Nakagawa, T., Bezrukova, E., Herzschuh, U., et al. (2007). Satellite- and pollen-based quantitative woody cover reconstructions for northern Asia: verification and application to late-Quaternary pollen data. Earth Planet. Sci. Lett. 264, 284–298. doi: 10.1016/j.epsl.2007.10.007
Tarasov, P. E., Andreev, A. A., Anderson, P. M., Lozhkin, A. V., Leipe, C., Haltia, E., et al. (2013). A pollen-based biome reconstruction over the last 3.562 million years in the Far East Russian Arctic – new insights into climate–vegetation relationships at the regional scale. Clim. Past 9, 2759–2775. doi: 10.5194/cp-9-2759-2013
Tarasov, P. E., Nakagawa, T., Demske, D., Österle, H., Igarashi, Y., Kitagawa, J., et al. (2011). Progress in the reconstruction of Quaternary climate dynamics in the Northwest Pacific: a new modern analogue reference dataset and its application to the 430-kyr pollen record from Lake Biwa. Earth Sci. Rev. 108, 64–79. doi: 10.1016/j.earscirev.2011.06.002
Ter Braak, C. J. F., and Prentice, I. C. (1988). “A theory of gradient analysis,” in Advances in Ecological Research, eds M. Begon, A. H. Fitter, E. D. Ford, and A. Macfadyen (Cambridge, MA: Academic Press), 271–317.
Theuerkauf, M., Kuparinen, A., and Joosten, H. (2013). Pollen productivity estimates strongly depend on assumed pollen dispersal. Holocene 23, 14–24.
Tufto, J., Engen, S., and Hindar, K. (1997). Stochastic dispersal processes in plant populations. Theor. Popul. Biol. 52, 16–26. doi: 10.1006/tpbi.1997.1306
Twiddle, C. L., Jones, R. T., Caseldine, C. J., and Sugita, S. (2012). Pollen productivity estimates for a pine woodland in eastern Scotland: the influence of sampling design and vegetation patterning. Rev. Palaeobot. Palynol. 174, 67–78. doi: 10.1016/j.revpalbo.2011.12.006
van Geffen, F., Geng, R., Pflug, B., Kruse, S., Pestryakova, L. A., Herzschuh, U., et al. (2021a). SiDroForest: Sentinel-2 Level-2 Bottom of Atmosphere Labelled Image Patches with Seasonal Information for Central Yakutia and Chukotka Vegetation Plots (Siberia, Russia). Available online at: https://doi.pangaea.de/10.1594/PANGAEA.933268 (accessed July 19, 2021).
van Geffen, F., Heim, B., Brieger, F., Geng, R., Shevtsova, I. A., Schulte, L., et al. (2021b). SiDroForest: a comprehensive forest inventory of Siberian boreal forest investigations including drone-based point clouds, individually labelled trees, synthetically generated tree crowns and Sentinel-2 labelled image patches. Earth Syst. Sci. Data Discuss. [Epub ahead of print]. doi: 10.5194/essd-2021-281
Wilmshurst, J. M., and McGlone, M. S. (2005). Origin of pollen and spores in surface lake sediments: comparison of modern palynomorph assemblages in moss cushions, surface soils and surface lake sediments. Rev. Palaeobot. Palynol. 136, 1–15. doi: 10.1016/j.revpalbo.2005.03.007
Zhang, P., Xu, Q., Gaillard, M.-J., Mu, H., Zhang, Y., and Lu, J. (2017). Research of main plant species’s relative pollen productivities and relevant source area of temperate coniferous and broad-leaved mixed forest in Northern China. Quat. Sci. 6, 1429–1443.
Zhang, Y., Duo, L., Pang, Y.-Z., Felde, V. A., Birks, H. H., and Birks, H. J. B. (2018). Modern pollen assemblages and their relationships to vegetation and climate in the Lhasa Valley, Tibetan Plateau, China. Quat. Int. 467, 210–221. doi: 10.1016/j.quaint.2018.01.040
Zhao, Y., Xu, Q., Huang, X., Guo, X., and Tao, S. (2009). Differences of modern pollen assemblages from lake sediments and surface soils in arid and semi-arid China and their significance for pollen-based quantitative climate reconstruction. Rev. Palaeobot. Palynol. 156, 519–524. doi: 10.1016/j.revpalbo.2009.05.001
Keywords: modern pollen assemblages, pollen-vegetation-climate relationships, East Siberia, tundra, taiga, relative pollen productivity, quantitative vegetation reconstruction
Citation: Geng R, Andreev A, Kruse S, Heim B, van Geffen F, Pestryakova L, Zakharov E, Troeva E, Shevtsova I, Li F, Zhao Y and Herzschuh U (2022) Modern Pollen Assemblages From Lake Sediments and Soil in East Siberia and Relative Pollen Productivity Estimates for Major Taxa. Front. Ecol. Evol. 10:837857. doi: 10.3389/fevo.2022.837857
Received: 17 December 2021; Accepted: 10 May 2022;
Published: 16 June 2022.
Edited by:
Franco Biondi, University of Nevada, Reno, United StatesReviewed by:
Anneli Poska, Lund University, SwedenVivika Väli, Estonian University of Life Sciences, Estonia
Copyright © 2022 Geng, Andreev, Kruse, Heim, van Geffen, Pestryakova, Zakharov, Troeva, Shevtsova, Li, Zhao and Herzschuh. This is an open-access article distributed under the terms of the Creative Commons Attribution License (CC BY). The use, distribution or reproduction in other forums is permitted, provided the original author(s) and the copyright owner(s) are credited and that the original publication in this journal is cited, in accordance with accepted academic practice. No use, distribution or reproduction is permitted which does not comply with these terms.
*Correspondence: Ulrike Herzschuh, ulrike.herzschuh@awi.de