Metabolic Phenotype of Daphnia Under Hypoxia: Macroevolution, Microevolution, and Phenotypic Plasticity
 Tingyat M. Lee1*†
  Kurtis M. Westbury1†
  Christopher J. Martyniuk2 William A. Nelson1
  Christopher D. Moyes1
- 1Department of Biology, Queen’s University, Kingston, ON, Canada
- 2Department of Physiological Sciences, Center for Environmental and Human Toxicology, College of Veterinary Medicine, University of Florida, Gainesville, FL, United States
Daphnia is a freshwater crustacean that is able to upregulate hemoglobin (Hb) in response to hypoxia, imparting a red color. We combine multiple field surveys across season with a lab experiment to evaluate changes in the metabolic phenotype of Daphnia in relation to environmental hypoxia. Looking at the zooplankton community, we found that D. pulicaria was restricted to lakes with a hypoxic hypolimnion. Comparing D. pulicaria with different amounts of Hb, red animals showed higher mRNA levels for several Hb genes, whereas most glycolytic genes showed red/pale differences of less than 50%. We also observed seasonal changes in the metabolic phenotype that differed between red and pale animals. Hb was upregulated early in the season in hypoxic lakes, and a relationship between Hb and lactate dehydrogenase only emerged later in the season in a temporal pattern that was lake specific. To evaluate whether these differences were due to specific lake environments or microevolutionary differences, we tested the induction of genes under controlled hypoxia in isofemale lines from each of four lakes. We found a strong response to 18 h hypoxia exposure in both Hb and lactate dehydrogenase mRNA, although the magnitude of the acute response was greater than the steady state differences in mRNA levels between pale and red Daphnia. The baseline expression of Hb and lactate dehydrogenase also varied between isofemale lines with different lake origins. These results, in combination with comparison of glycogen measurements, suggests that Hb functions primarily to facilitate oxygen delivery, mitigating systemic hypoxia, rather than an oxygen store. The combination of lab and field studies suggest that the metabolic phenotype of the animal is influenced by both microevolutionary differences (within and between lakes) as well as the spatial and temporal environmental heterogeneity of the lakes. The differences between Daphnia species, and the unexpected lack of hypoxia sensitivity of select glycolytic genes provide evidence of macroevolutionary differences in metabolic strategies to cope with hypoxia.
Introduction
Clonal aquatic invertebrates, such as Daphnia, are helpful for disentangling genetic variation vs. phenotypic responses to complex natural environmental stress, which often include rapid evolution, phenotypic plasticity, and evolution of plasticity (Stoks et al., 2016). Since Daphnia has a well annotated genome (Colbourne et al., 2011), researchers have been able to identify the genetic basis for multiple phenotypic responses (e.g., Lyu et al., 2019; Frisch et al., 2020; Tams et al., 2020) making it a powerful model system to study the associations between genetics, molecular physiology, and the ecological phenotype (Miner et al., 2012).
Oxygen levels can vary tremendously over space and time in aquatic environments, and aquatic invertebrates often move across these gradients to utilize resources and avoid fish predation (Hanazato et al., 1989; Hembre and Megard, 2003). As such, aquatic invertebrates often experience periods of time under oxygen stress (Galic et al., 2019). To tolerate hypoxia, organisms remodel their physiology. The phenotypic remodeling to hypoxia often includes improved oxygen delivery (extraction, perfusion, and storage) and a greater capacity for anaerobic metabolism (substrate supply, glycolytic enzyme activities, and handling of end products). In vertebrates, oxygen delivery, including extraction, perfusion, and storage of oxygen, can be improved by increasing vascularization (via angiogenesis) and erythrocyte numbers (via erythropoiesis) (reviewed by Scott et al., 2015). Oxygen limitation can also lead to a metabolic shift from oxygen-dependent metabolism (oxidative phosphorylation) to anaerobic metabolism (glycolysis).
Central to all these responses is the ability of metazoan cells to sense hypoxia to remodel tissues. The transcriptional master regulator hypoxia-inducible factor (HIF) is central to coordination of the phenotypic plasticity that bolsters hypoxic tolerance (Semenza et al., 1994; Semenza, 2012). While HIF is ubiquitous amongst animals, the HIF-related network differs between taxa. Two of the most important targets of the HIF network in vertebrates are the capillaries and erythrocytes (Scott et al., 2015). However, these targets are absent in many invertebrates. Although Daphnia lack blood cells, HIF stimulates Hb genes directly (Gorr et al., 2004), leading to secretion of Hb into the circulation (Fox and Phear, 1953; Green, 1956; Kobayashi and Hoshi, 1982; Zeis et al., 2004). This extracellular hemoglobin confers greater hypoxia tolerance to hypoxia (Fox et al., 1951; Kring and O’Brien, 1976; Pirow et al., 2001). The other metabolic component of a typical vertebrate HIF response is coordinated induction of genes encoding proteins that support anaerobic glycolysis (Webster, 1987; Webster et al., 1990; Discher et al., 1998). Although acute hypoxic exposure of Daphnia causes lactate accumulation (Paul et al., 1997, 1998), it is not yet known if hypoxia also triggers coordinated induction of glycolytic genes.
Here we combine analysis of field collected animals with a controlled experiment in the lab to evaluate changes in the metabolic phenotype of Daphnia across a range of oxygen environments, and to disentangle the relative contribution of evolutionary differences from environmental drivers in phenotypic plasticity. The patterns we observe suggest important distinctions between Daphnia and better studied models. From species- and lake-specific metabolic phenotype, to seasonal shifts in enzyme relationships, and incoordinate regulation of anerobic pathways, our results demonstrate that Daphnia is a dynamic metabolic system that has been shaped by the complexity of its oxygen environment in both space and time. Hypoxic episodes will be more frequent in lakes as climate change and temperature increases. Our results are important to help understand how species and populations may adapt to these future environmental changes.
Materials and Methods
Field Sampling
Our study utilizes data from two observational surveys. The first was done in June and July 2018 and collected zooplankton from twenty lakes in the Frontenac Arch Biosphere, Ontario, Canada (Supplementary Table 1). These lakes were selected because they have a number of Daphnia species and a depth of at least 9 m, which permits thermal stratification. Ten of the lakes develop a hypoxic hypolimnion (<1 mg/mL O2) and ten have a normoxic hypolimnion (≥ 1 mg/mL O2) (Figure 1). The second survey was focused on five lakes with a hypoxic hypolimnion where D. pulicaria was the dominant zooplankton species.
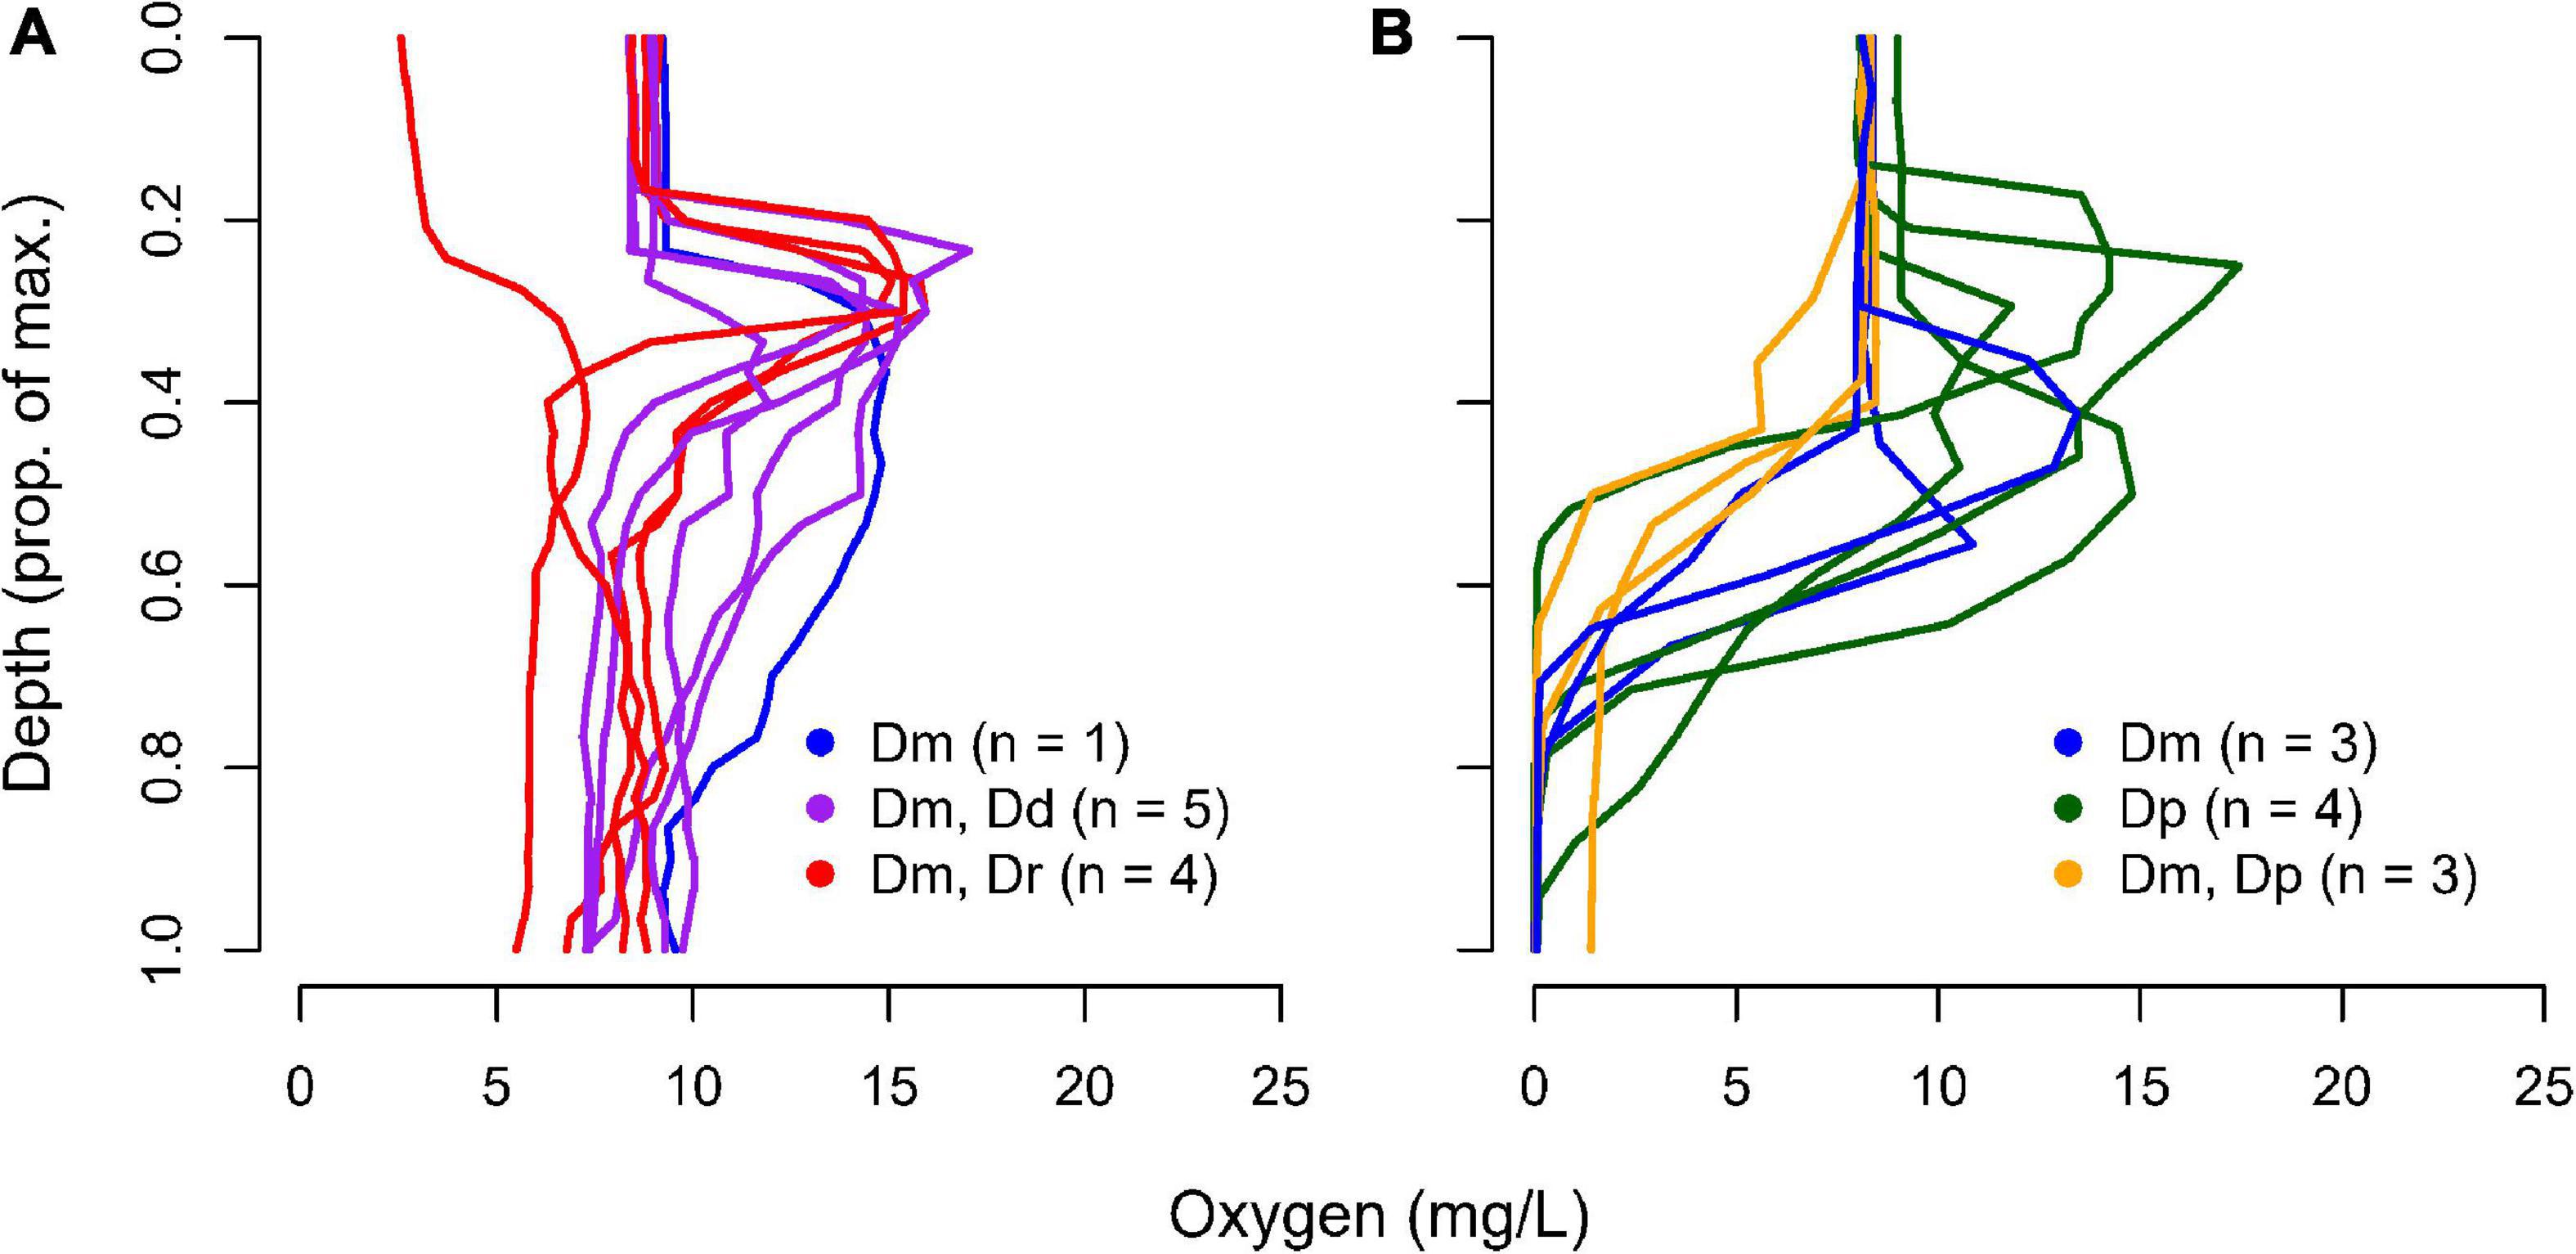
Figure 1. Oxygen-depth profile and Daphnia species occurrence in 20 Frontenac Arch lakes. Lakes are divided into those with (A) normoxic or (B) hypoxic conditions at the bottom of the water column. Species found were D. pulicaria (Dp), D. mendotae (Dm), D. dubia (Dd), and D. retrocurva (Dr). The identity of the specific lakes with different Daphnia compositions can be found in Supplementary Materials.
Zooplankton were collected during the day from the deep point of each lake using a large macrozooplankton net (50 μm mesh size, 35 cm opening diameter). Daphnia were collected using vertical hauls that sampled the entire water column. Quantification of proteins vs. RNA requires different approaches to sampling and preservation. Daphnia collected for protein analyses were brought back alive to Queen’s University for sorting and identification (Haney et al., 2013), then frozen in liquid nitrogen before storage at −80°C until further analysis. Daphnia collected for RNA analyses were sorted in the field and either flash-frozen or immersed in RNAlater. Sample sizes are given in Supplementary Table 2.
Lake-Dependent Microevolution in Hypoxic Gene Induction
Animals were collected from the field in June 2019 to establish replicate isofemale lines from four focal lakes: Doe, Round, Long, and Black. Twenty individuals were placed in approximately 100 mL of water from the lake from which it was sampled. The animals were fed ad libitum by adding Chlamydomonas reinhardtii (CPCC 243; Canadian Phycological Culture Centre University of Waterloo) every second day. These Daphnia were reared to a third generation by isolating and transferring batches of no less than 5 offspring to 7 vials of approximately 50 mL of filtered (0.22 μm) Lake Ontario water each generation. After 3 generations, individuals were prepared for oxygen treatments.
The isofemale lines were used to explore the impact of lake origin of Daphnia on their hypoxic response. A total of 6 isofemale lines from each of the four lakes were subjected to a 18 h treatment of hypoxia or normoxia. We used 3% oxygen because this concentration was sufficient to induce Hb induction in a closely related species (D. pulex) in other studies (Zeis et al., 2003, 2009; Gerke et al., 2011). Animals were placed in 100 mL beakers with filtered (0.22 μm) Lake Ontario water, which was equilibrated at the desired oxygen pressure (3 or 21% O2, balance nitrogen) for 24 h. Oxygen levels were set using an MCO-5M controlled environment chamber, thermostatted to 18°C (Sanyo Electric Biomedical Co., Japan). Individuals were preserved immediately after 18 h of treatment. For each replicate, 15 whole animals were stored in 1 mL of TRIzol (Thermo Fisher Scientific) and frozen at −80°C until assayed for the mRNA levels of lactate dehydrogenase (LDH), hemoglobin (Hb), pyruvate kinase (PK), and enolase (ENOL), as described in detail below.
Enzymes Analyses
Assays for enzymes and Hb were conducted on a Spectramax Plus plate spectrophotometer (Molecular Devices, United States) at 25°C. Animals used for enzyme analyses were individually placed in microcentrifuge tubes and frozen (−80°C) for storage. For enzyme analyses, animals were homogenized using a polypropylene disposable pestle in a 1.5 mL microcentrifuge tube with buffer composed of 20 mM Hepes [4-(2-hydroxyethyl)-1-piperazineethanesulfonic acid], 1 mM EDTA (ethylene diamine tetraacetic acid), and 0.1% Triton X-100 (pH 7.4). Unless stated otherwise, the homogenate was centrifuged (10,000 × g for 5 min) then used for Hb, enzyme, and protein analyses. Centrifugation did not result in a measurable loss in activity of any enzyme, but removing particulates reduced light scatter. Enzyme assays were based on Davies et al. (2011).
For Hb quantification, extracts were transferred to a 96-well plate. Hb concentration was estimated using measurements at 560, 576, 600 nm (Yampolsky et al., 2014). The difference between A576 and the average of A560 and A600 was the Hb-specific absorbance. Without purified Daphnia Hb to use as a standard curve, we relied on bovine hemoglobin (64,500 g/mol) to approximate hemoglobin concentrations and expressed the values per nmol heme (4 mol heme per mol Hb). A 1 mg/mL solution of bovine crystalline hemoglobin (largely met-hemoglobin) was reduced by a 10-molar excess of ascorbic acid (27 μg per mL) for 6 h. Using 96-well plates, 0.2 mg Hb (= 12.4 nmol heme) resulted in an absorbance difference [A576 – (0.5 × (A560 + A600)] of 0.11 absorbance units. Hb levels were corrected for the fraction of sample analyzed and standardized per ng protein in the extract.
LDH catalyzes a reversible reaction of pyruvate + NADH + H+ to lactate + NAD+. Its activity was measured in 50 mM Hepes (pH 7.0) assay buffer with 0.2 mM NADH and 2.0 mM sodium pyruvate. NADH and pyruvate were prepared fresh every 4 h in assay buffer. The reaction rate was determined by the loss of NADH, which was measured at 340 nm over the linear phase, typically for 3 min. Early studies showed no indication of a decline in NADH absorbance in the absence of pyruvate, so this control was omitted.
PK catalyzes the irreversible transphosphorylation reaction of phospho-enol-pyruvate (PEP) + MgADP to MgATP + pyruvate. Its activity was assayed by coupling pyruvate production to LDH activity. PK was measured in assay buffer (50 mM Hepes (pH 7.4), 150 mM KCl and 5 mM MgCl2) with 0.2 mM NADH, 0.5 mM PEP and 1 mM ADP. NADH and PEP were prepared fresh every 4 h in assay buffer. The reaction rate was determined by the loss of NADH, which was measured at 340 nm over the linear phase, typically 3 min. Early studies showed no indication of a decline in NADH in the absence of PEP, so this control was omitted.
ENOL catalyzes the conversion of 2-phosphoglycerate to PEP. The reaction (PEP production) was coupled to LDH and PK. The assay buffer contained 50 mM Hepes (pH 7.4), 50 mM KCl and 3 mM MgCl2, with 0.2 mM NADH, 5 mM 2-phosphoglycerate, 5 mM ADP, 1 U/mL LDH, and 1 U/mL PK. As with the other enzymes, no activity was seen in the absence of the substrate, 2-phosphoglycerate. The reaction rate was determined by the loss of NADH, which was measured at 340 nm over the linear phase, typically 3 min.
Citrate synthase (CS) converts acetyl CoA + oxaloacetate to citrate + coenzyme A (CoASH). It was assayed in 50 mM Tris (pH 8.0), 0.12 mM acetyl CoA, and 0.5 mM oxaloacetate, with 0.1 mM DTNB (dithio-nitrobenzoic acid) included to detect the production of CoASH, Preliminary studies showed that the rate in the absence of oxaloacetate (thiolase) was below detection limits, and thus this control was omitted in subsequent experiments. CS was detected by the increase in absorbance at 412 nm, and remained linear for at least 5 min.
Soluble protein in the homogenate was detected using Bio-Rad Protein Assay Dye Reagent (Bio-Rad), using bovine serum albumin as a standard, assayed 595 nm.
Glycogen Analysis
Animals were collected from the field and returned to Queen’s University live. Since the delays between capture and sample preservation could impact glycogen levels, we returned animals to the lab and held them with abundant food and oxygen to permit them to replenish glycogen stores. Animals were separated into bins of red and pale and cultured for 3 days. Each vial contained 20 mL filtered Lake Ontario water and 6 individuals, supplemented daily with an ad libitum supply of Chlamydamonas reinhardtii (CPCC 243; Canadian Phycological Culture Centre for Algae, Cyanobacteria, and Lemna at the University of Waterloo). Individuals were harvested after 3 days of feeding and frozen at −80°C for glycogen measurements.
To measure glycogen, individuals were transferred to 200 μL of 3% perchloric acid (PCA) and homogenized using polypropylene pestle. Without centrifugation, 100 μL of the suspension were transferred to a new tube for glycogen determination and the remainder reserved for glucose measurements. To each tube, 100 μL of 2M sodium acetate (pH 4.8) and 50 μL 1M KHCO3 were added. The glycogen tubes were also given 10 U amyloglucosidase, then incubated 2 h at 40°C. Both tubes were frozen at −80°C for subsequent glucose determinations. Samples were thawed, neutralized with 20 μL of 1 M KOH, then centrifuged 5 min at 10,000 × g. The supernatants were used for the glucose assay.
The glucose assay consisted of sample (unknown or standard) added to a solution of 1 mM ATP, 2 mM NAD+, 1 U/mL hexokinase (HK), and 1 U/mL G6PDH (Leuconostoc glucose 6-phosphate dehydrogenase). The plate was incubated at room temperature for 60 min, at which point the reaction had reached its endpoint. Values of glycogen were translated back to levels per individual Daphnia. We could not measure protein directly in the acid-extracted Daphnia. Instead, 6 individual animals from each group (4 lakes, 2 color phenotypes) were used to determine protein per individual Daphnia, with the mean used to estimate glycogen per mg protein, which would correct for Daphnia of different sizes in the treatment groups.
Transcriptome Analyses
Thirty animals were collected from each of the four lakes and added directly to 8 mL of RNALater solution. Total RNA was extracted with TRIzol Reagent (Thermo Fisher) following the instruction. The RNA samples were then purified with NEBNext rRNA Depletion kit (NEB E6310). The libraries were constructed as per the manufacturer using the NEBNext Ultra II Directional RNA Library Prep kit for Illumina (NEB E7760) and the NEBNext® Multiplex Oligos for Illumina® (Index Primers Set 1) (NEB E7335).
Sequencing was performed by The Centre for Applied Genomics (The Hospital for Sick Children, Toronto, Canada). The libraries were sequenced on a HighSeq 2500 using the single-end 150-bp mode. Following sequencing, data processing was done using the standard Illumina pipeline and Fastq files were generated for data processing and assembly.
Quantitative PCR
For RNA extraction, 500 μL of the TRIzol was discarded and the animals were homogenized in the remaining solution. RNA was then extracted following standard TRIzol protocol and checked and quantified based on 260/280 nm absorbance. The integrity of total RNA was assessed using gel electrophoresis. Total RNA was DNase-treated (DNA-free DNA Removal Kit, Thermo Fisher Scientific) and reverse transcription of 2 μg of total RNA was performed using OneScript cDNA Synthesis Kit (ABM). The cDNA was diluted to 20 ng/μL for qPCR and stored at −20°C.
Primers for qPCR (Supplementary Table 3) were based on sequences derived from the RNA-seq data and verified for use in qPCR. We identified three genes of interest based on the results of RNA-seq: LDHA and two Hb subunits selected based on high levels of mRNA and responsiveness to oxygen. We also measured mRNA levels for PK and ENOL to test for their responsiveness to hypoxia. PCR reactions were optimized for temperature and a dilution series was performed to verify amplification efficiencies. For qPCR reactions, 5 μl of diluted cDNA was mixed with 0.5 μl each of forward and reverse primers (10 μM), 4 μl of water, and 10 μl of SsoAdvanced™ Universal SYBR® Green Supermix (Bio-Rad). qPCR reactions were performed using a CFX96 (Bio-Rad) under the following conditions: 30 s at 95°C; 40 cycles of 95°C for 10 s, 55°C for 45 s, with a melt curve from 65°C to 95°C at 0.5°C increments for 5 s each. Each biological replicate was assayed in duplicate. No signal was detected in no template controls samples. The expression levels of each gene of interest were normalized by the expression of a reference gene (α-tubulin).
Data Analysis
Sequence Alignment and Annotation
FastQC (Andrews, 2010) was used to evaluate the RNA sequencing quality and Trimmomatic (Bolger et al., 2014) was used to trim low quality reads with a phred score < 20, within a window of 4 base pairs. The reads after trimming with length < 100 were removed from downstream analysis. The remaining high-quality reads were aligned to a Daphnia pulex reference genome (Gilbert, 2009)1 using Bowtie (Langmead, 2010) with default parameters. Transcript expression data were obtained at both the gene and isoform level using RSEM (Li and Dewey, 2011). Expression level estimation was generated as fragments per kilobase of transcript sequence per million mapped fragments (FPKM) value. A small value (0.001) was added to the gene expression for the genes with expression value of 0 to statistically evaluate the data. PCA and cluster analysis were performed to identify outlier samples and no outliers were detected.
Statistical Analyses
Normality of the data was tested by Shapiro-Wilk test. For each analysis, we compared AICc of models containing independent variables and that of a null model containing no independent variable (Burnham et al., 2011). If the model with the lowest AICc contains any independent variable, we followed with post hoc Tukey’s all-pair comparisons test using the glht function (Hothorn et al., 2008) with Benjamini-Hochberg adjustments for multiple tests.
First, linear mixed models (lme4; Bates et al., 2015) were used to test for the main effect of species on LDH and PK activity, while accounting for the random effects of lake origins of the Daphnia. D. mentodae were separated into two groups based on whether the animals were collected from normoxic or hypoxic lakes. Second, linear models were used to test for the main effects of lake and phenotype on enzymatic activity (ENOL, PK, and LDH), glycogen, and Hb levels. Third, an analysis of covariance test (ANCOVA) was used to see if Hb influenced LDH activity with a lake or seasonal effect. The response variable was LDH activity. The categorical variables were lake and season, with Hb levels as a covariate.
Finally, we considered two response variables: baseline and response, when evaluating gene expression data in the lab experiment. The gene expression under normoxic treatments is considered “baseline,” and the ratio of hypoxic/normoxic expression is considered “response,” We used linear models to test for the effects of lake and line on the two response variables for each gene of interest.
All statistical analyses and graphs were done using R version 3.4.2.
Results
Metabolic Phenotypes of Daphnia Amongst 20 Lakes
We collected Daphnia from 20 lakes in the region in June and July 2018, with the goal of surveying enzyme activities across lakes and Daphnia species (Figure 1). The early sampling was intended to target animals before seasonal accumulation of Hb occurred, although there were a few animals that appeared to be pink, suggesting low levels of Hb even early in the season. D. dubia and D. retrocurva were found only in lakes that possessed a normoxic hypolimnion. D. mendotae populations were found across both lake categories, though not all lakes. D. pulicaria were not found in lakes that possessed a normoxic hypolimnion and appeared in all but 2 lakes with a hypoxic hypolimnion.
To understand the metabolic phenotype of these animals, we measured enzyme activities in pools of individuals separated by species. The data were expressed relative to CS activity, which was found to not differ among lakes or species (Supplementary Figure 1). The enzyme data were separated by lake type (normoxic vs. hypoxic hypolimnion) to evaluate whether the LDH and PK activities differed between lake types across the four species (Figure 2). The main effect of species was not significant on LDH activity (Figures 2A,B and Supplementary Table 4). However, D. mendotae, which was found in both categories of lake, had a trend of showing higher LDH activities in lakes with a hypoxic hypolimnion (t = 1.91, df = 56.02, p = 0.06; Figures 2A,B). In contrast, the main effect of species was significant on PK activity (Figures 2C,D and Supplementary Table 4). D. mendotae that were found in hypoxic lakes had greater PK activity than Daphnia found in normoxic lakes (Figures 2C,D and Supplementary Table 5). D. pulicaria, only found in lakes with a hypoxic hypolimnion, showed PK activities that were higher than other species (Figure 2D and Supplementary Table 5). They also demonstrated higher among-lake variation in LDH levels compared to the other species (Figure 2B). Although no red animals were found during this sampling period, there were some animals that were pink, suggesting some history of hypoxic exposure that may have influenced glycolytic enzyme levels.
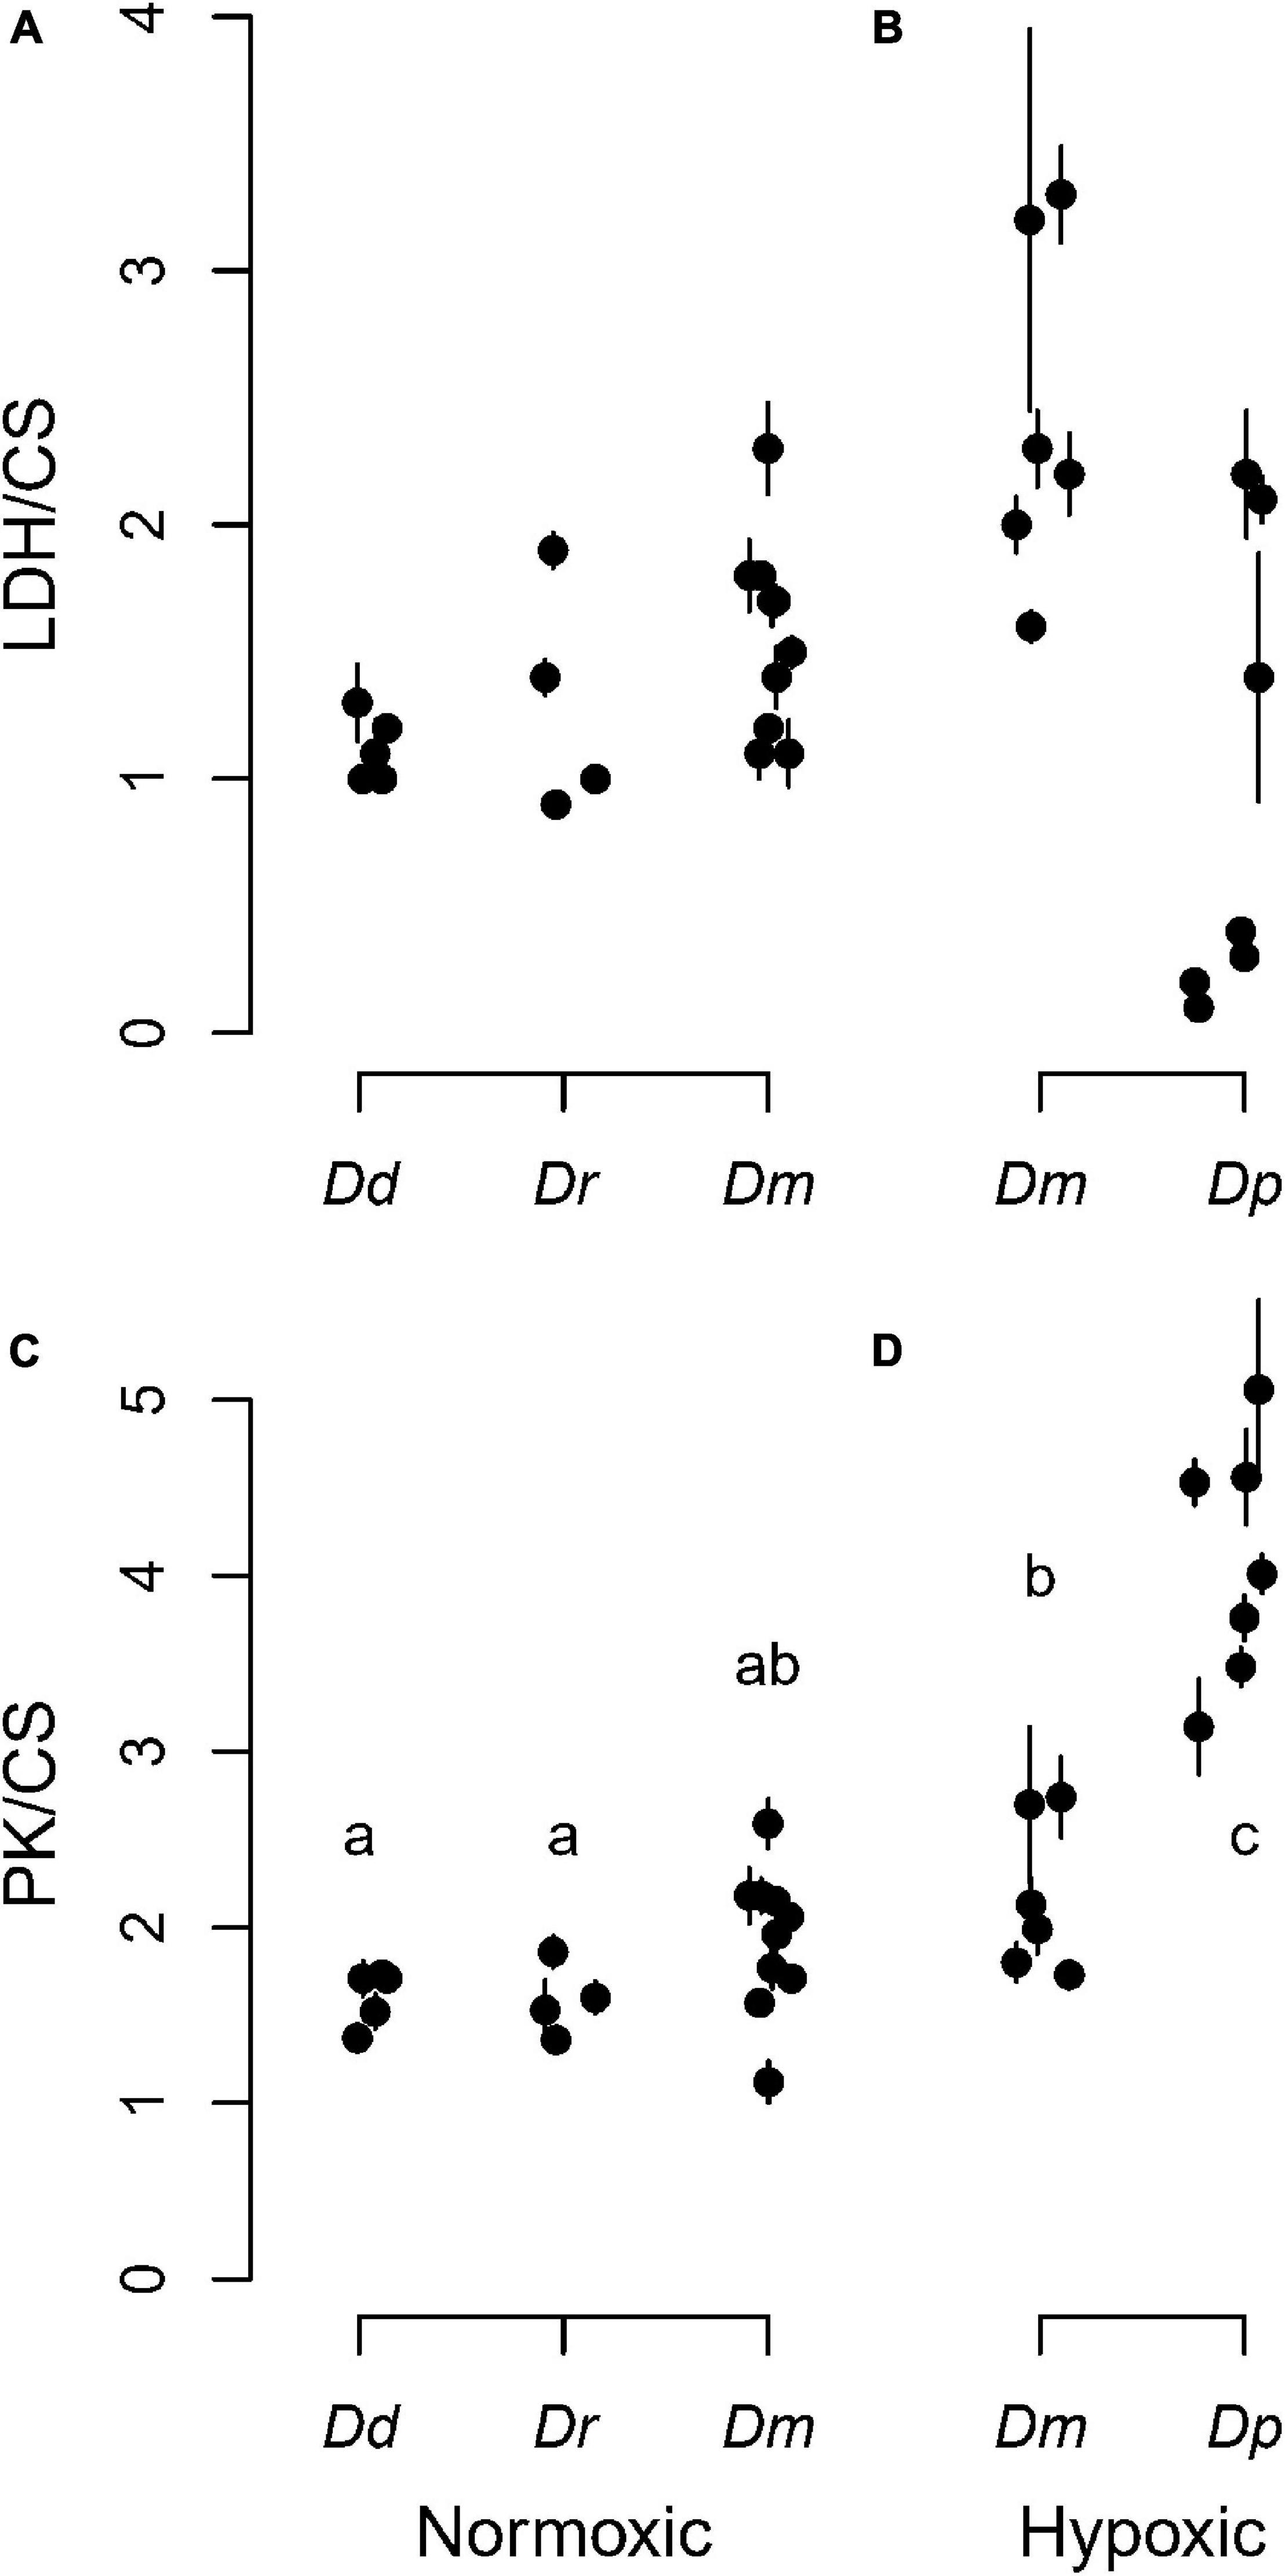
Figure 2. Glycolytic enzyme activities across species and lake type. The top row shows lactate dehydrogenase (LDH) relative to the housekeeping gene citrate synthase (CS) for each (A) normoxic or (B) hypoxic lake. The bottom row shows pyruvate kinase (PK) relative to the housekeeping gene citrate synthase (CS) for each (C) normoxic or (D) hypoxic lake. Solid circles are individual lakes, and vertical bars are ± SD from six replicates. Daphnia species are identified in Figure 1. Data points are jittered horizontally to avoid visual overlap within a lake category. Different letters indicate significant differences (p < 0.05).
Exploring Glycolytic Enzyme Stoichiometries
To better understand the relationship between glycolytic enzymes and Hb expression, we conducted a separate study that focused on D. pulicaria in five hypoxic lakes (Black, Doe, Long, Round, South Otter). We collected samples of D. pulicaria with the goal of measuring the activities of select glycolytic enzymes to assess if they differed between red and pale, and whether the differences were stoichiometric amongst glycolytic enzymes.
Daphnia were collected in Fall 2017, at which point the differences between pale and red are typically greatest. Of the glycolytic enzymes we measured, ENOL was the least variable in D. pulicaria within and between lakes (Figure 3A). The greatest difference in ENOL activity between pale and red animals was in Round and South Otter Lakes, where reds had about 50% higher activity than pales. Although both LDH (Figure 3B) and PK (Figure 3C) showed a significant interaction between phenotype and lake, the interactive effect was stronger for LDH than PK (Supplementary Tables 6, 7). Reds had 2–2.5 times greater LDH activity than pales in Black and Round Lakes, but activities were similar between red and pale animals in Doe and Long Lakes (Figure 3C and Supplementary Table 9). Thus, red D. pulicaria in Black and Round Lakes showed the clearest evidence of metabolic remodeling in these enzymes, whereas little metabolic differentiation was seen in red animals from Doe and Long Lakes.
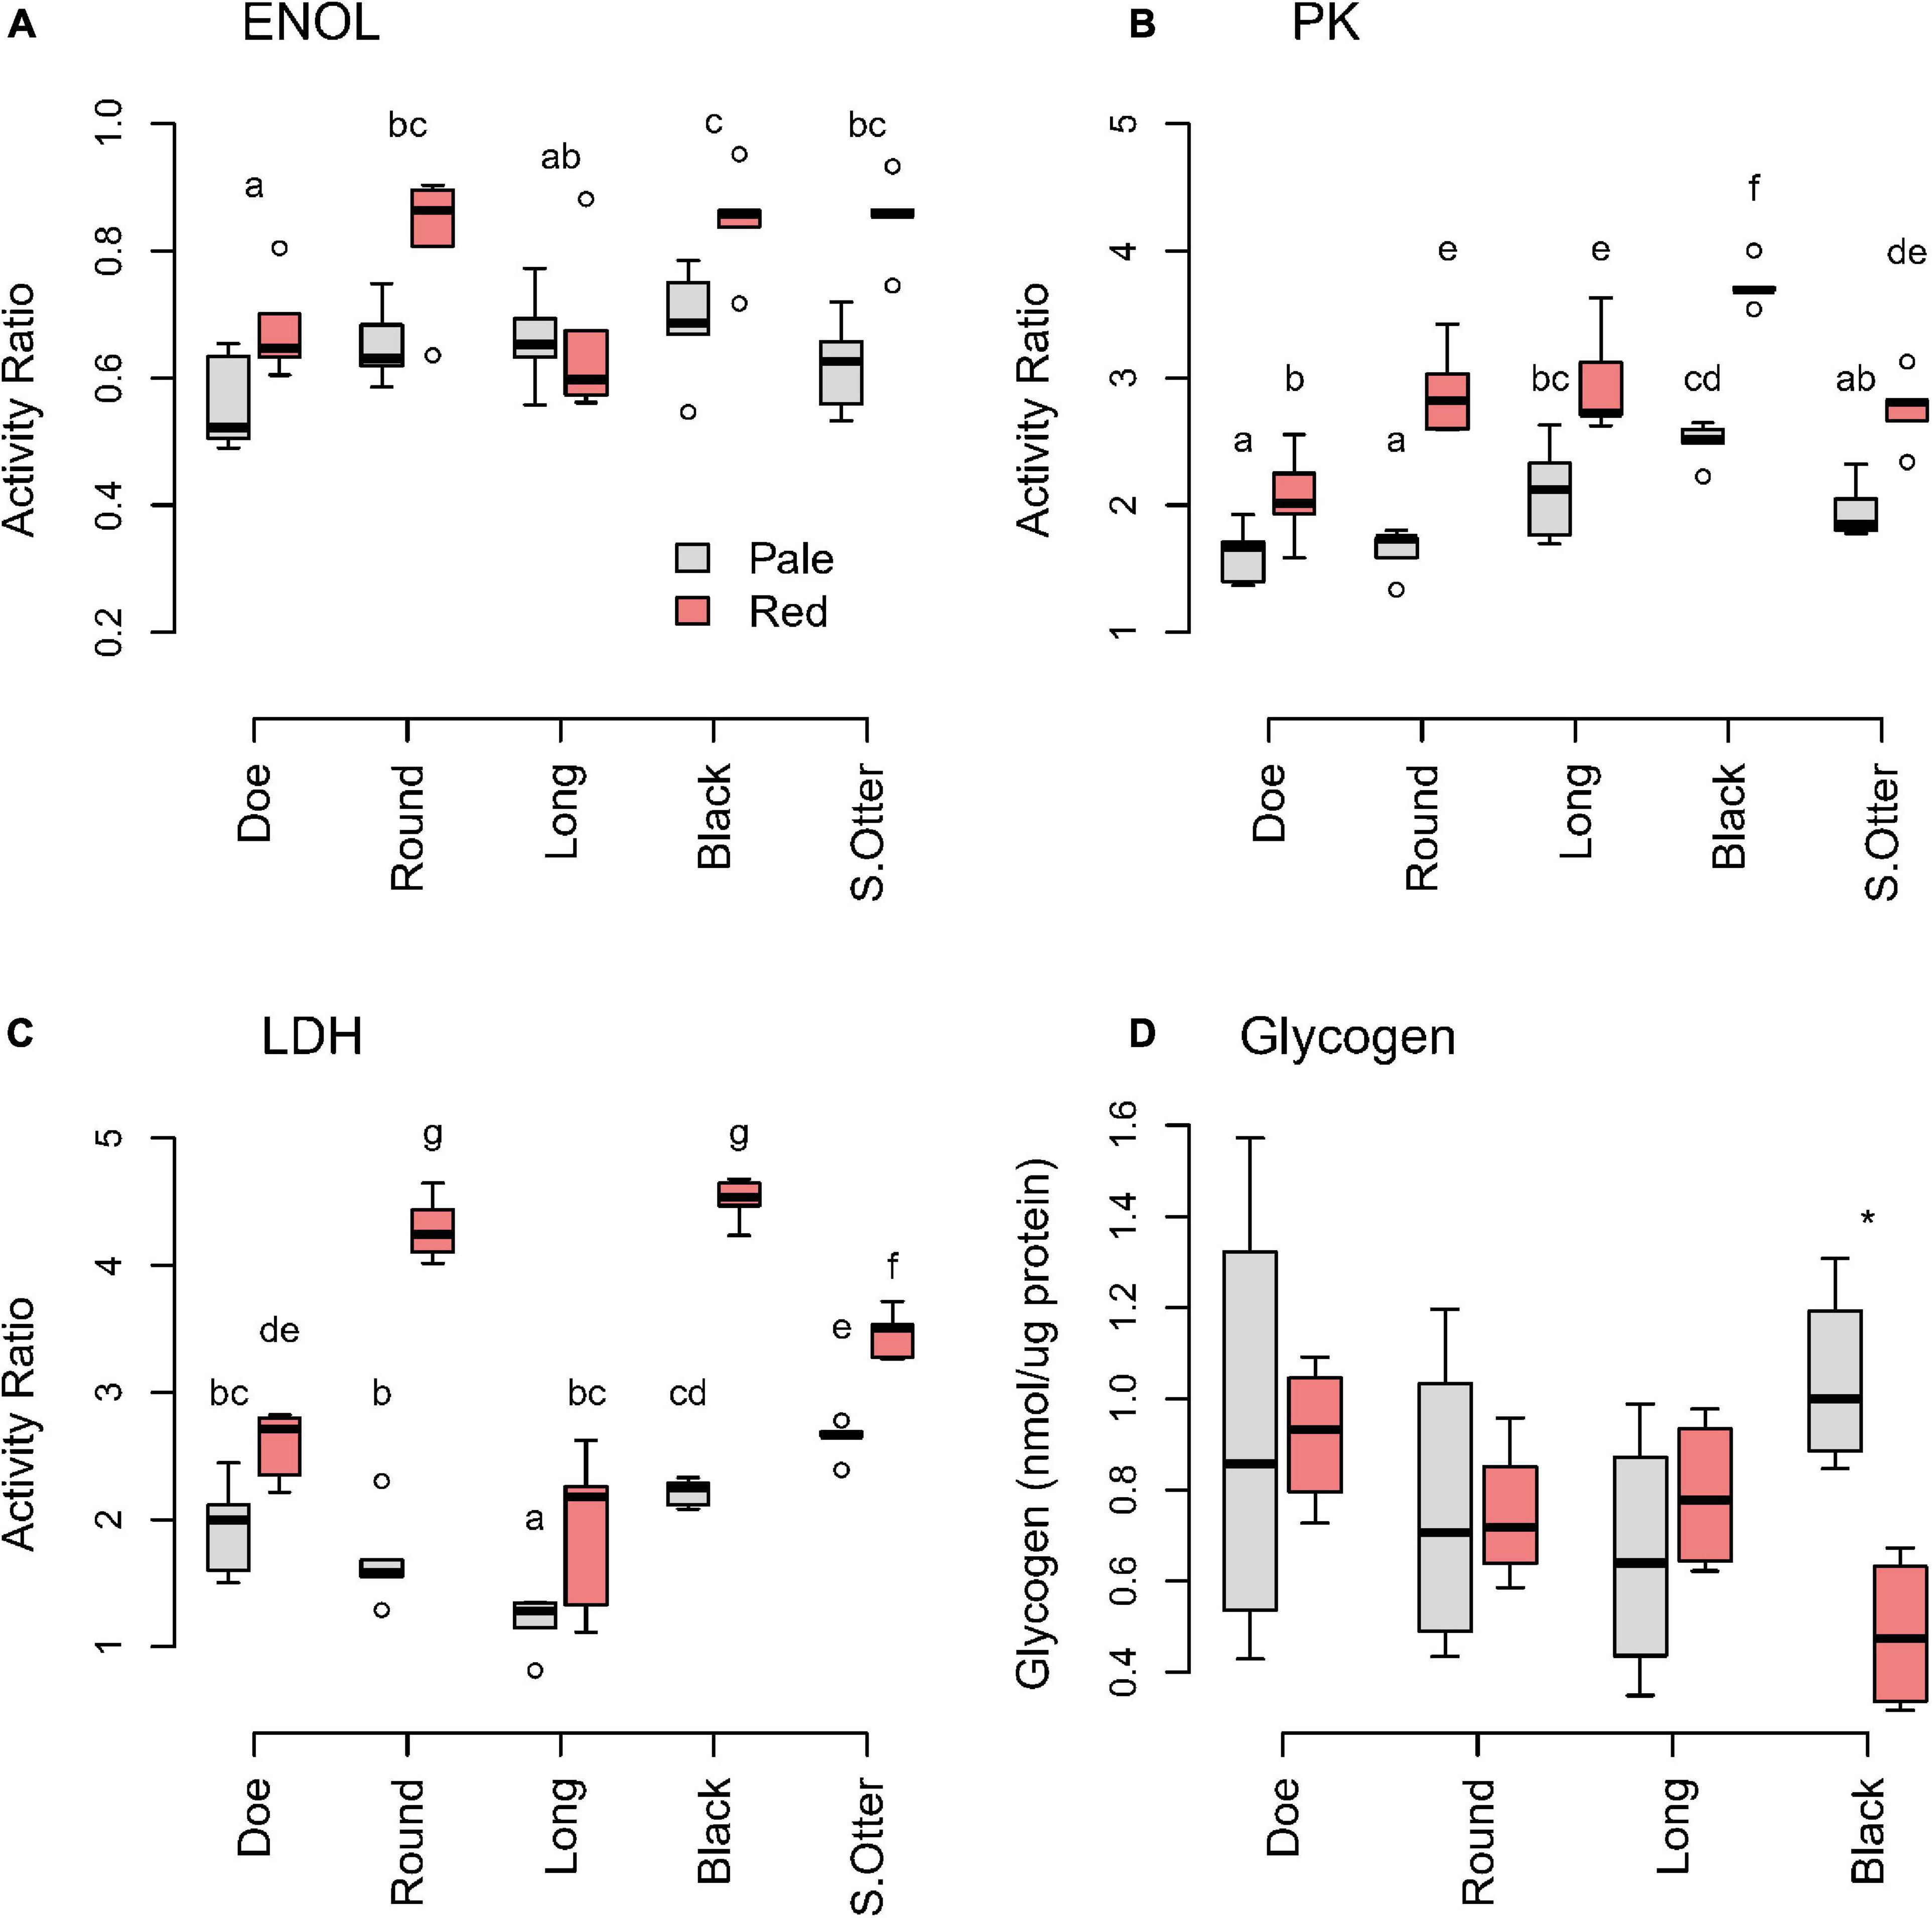
Figure 3. Glycolytic enzyme (A: ENOL; B: PK; C: LDH) ratios and (D) glycogen of D. pulicaria by color morph across hypoxic lakes. Activities of glycolytic enzymes are expressed relative to the housekeeping gene citrate synthase (CS). Different letters indicate significant differences (p < 0.05) (Supplementary Tables 6–10). The asterisk (*) indicates significant difference between color morphs in Black Lake.
To evaluate whether glycogen storage is used as a strategy to tolerate periods of hypoxia, we measured glycogen levels in animals with different color phenotype across the lakes. Animals might accumulate glycogen to high levels when food was available to prepare for hypoxia. However, we saw no significant difference between reds and pales in 3 of 4 lakes, while red animals from Black Lake had significantly lower glycogen levels (t = 4.34, df = 5.94, p = 0.005) than pale animals from the same lake (Figure 3D). Thus, animals with an established red phenotype were not predisposed to storing more glycogen than pale animals, when resources were plentiful.
Transcript Analysis
In Fall 2017, we collected animals to investigate differences in transcriptomic profiles using RNA-seq (Supplementary Table 11). These samples were collected in parallel with the animals used for Figures 3A–C. Among the 33,069 transcripts in the assembly (Gilbert, 2009), 14,355 transcripts were detected in all samples. Global transcript patterns (Supplementary Figure 2) clustered by lake rather than by color morphs, although Long Lake red animals showed a more unique transcriptional profile (i.e., did not cluster with any other group) compared to those from other lakes. Thus, the overall transcriptional profiles were more dependent on lake-by-lake differences rather than the effects of oxygen exposure history, inferred from color.
Focusing on transcripts of the enzymes associated with carbohydrate utilization, we found that pale animals generally had similar mRNA levels for each gene (Figure 4). The differences between colors were negligible for most of the glycolytic genes. Only phosphoglucomutase, glycogen phosphorylase and LDH showed elevations in reds more than 50% the values seen in pales, driven largely by elevations in Black and Round Lakes. Comparing LDH mRNA (Figure 4) and enzyme activities (Figure 3C), red animals in Black Lake had 2.9-fold more mRNA and twofold higher enzyme activity than pales from the same lake, while more modest 1.3-fold elevation in mRNA seen in Doe Lake was consistent with the 1.3-fold difference in enzyme activities. Interestingly, red animals in Long Lake had a relatively modest 1.6-fold increase in enzyme activity from pale animals but the second greatest difference in LDH mRNA (1.9-fold), whereas reds in Round Lake had the greatest increase in LDH activity from pales by 2.6-fold but only 1.5-fold more LDH mRNA.
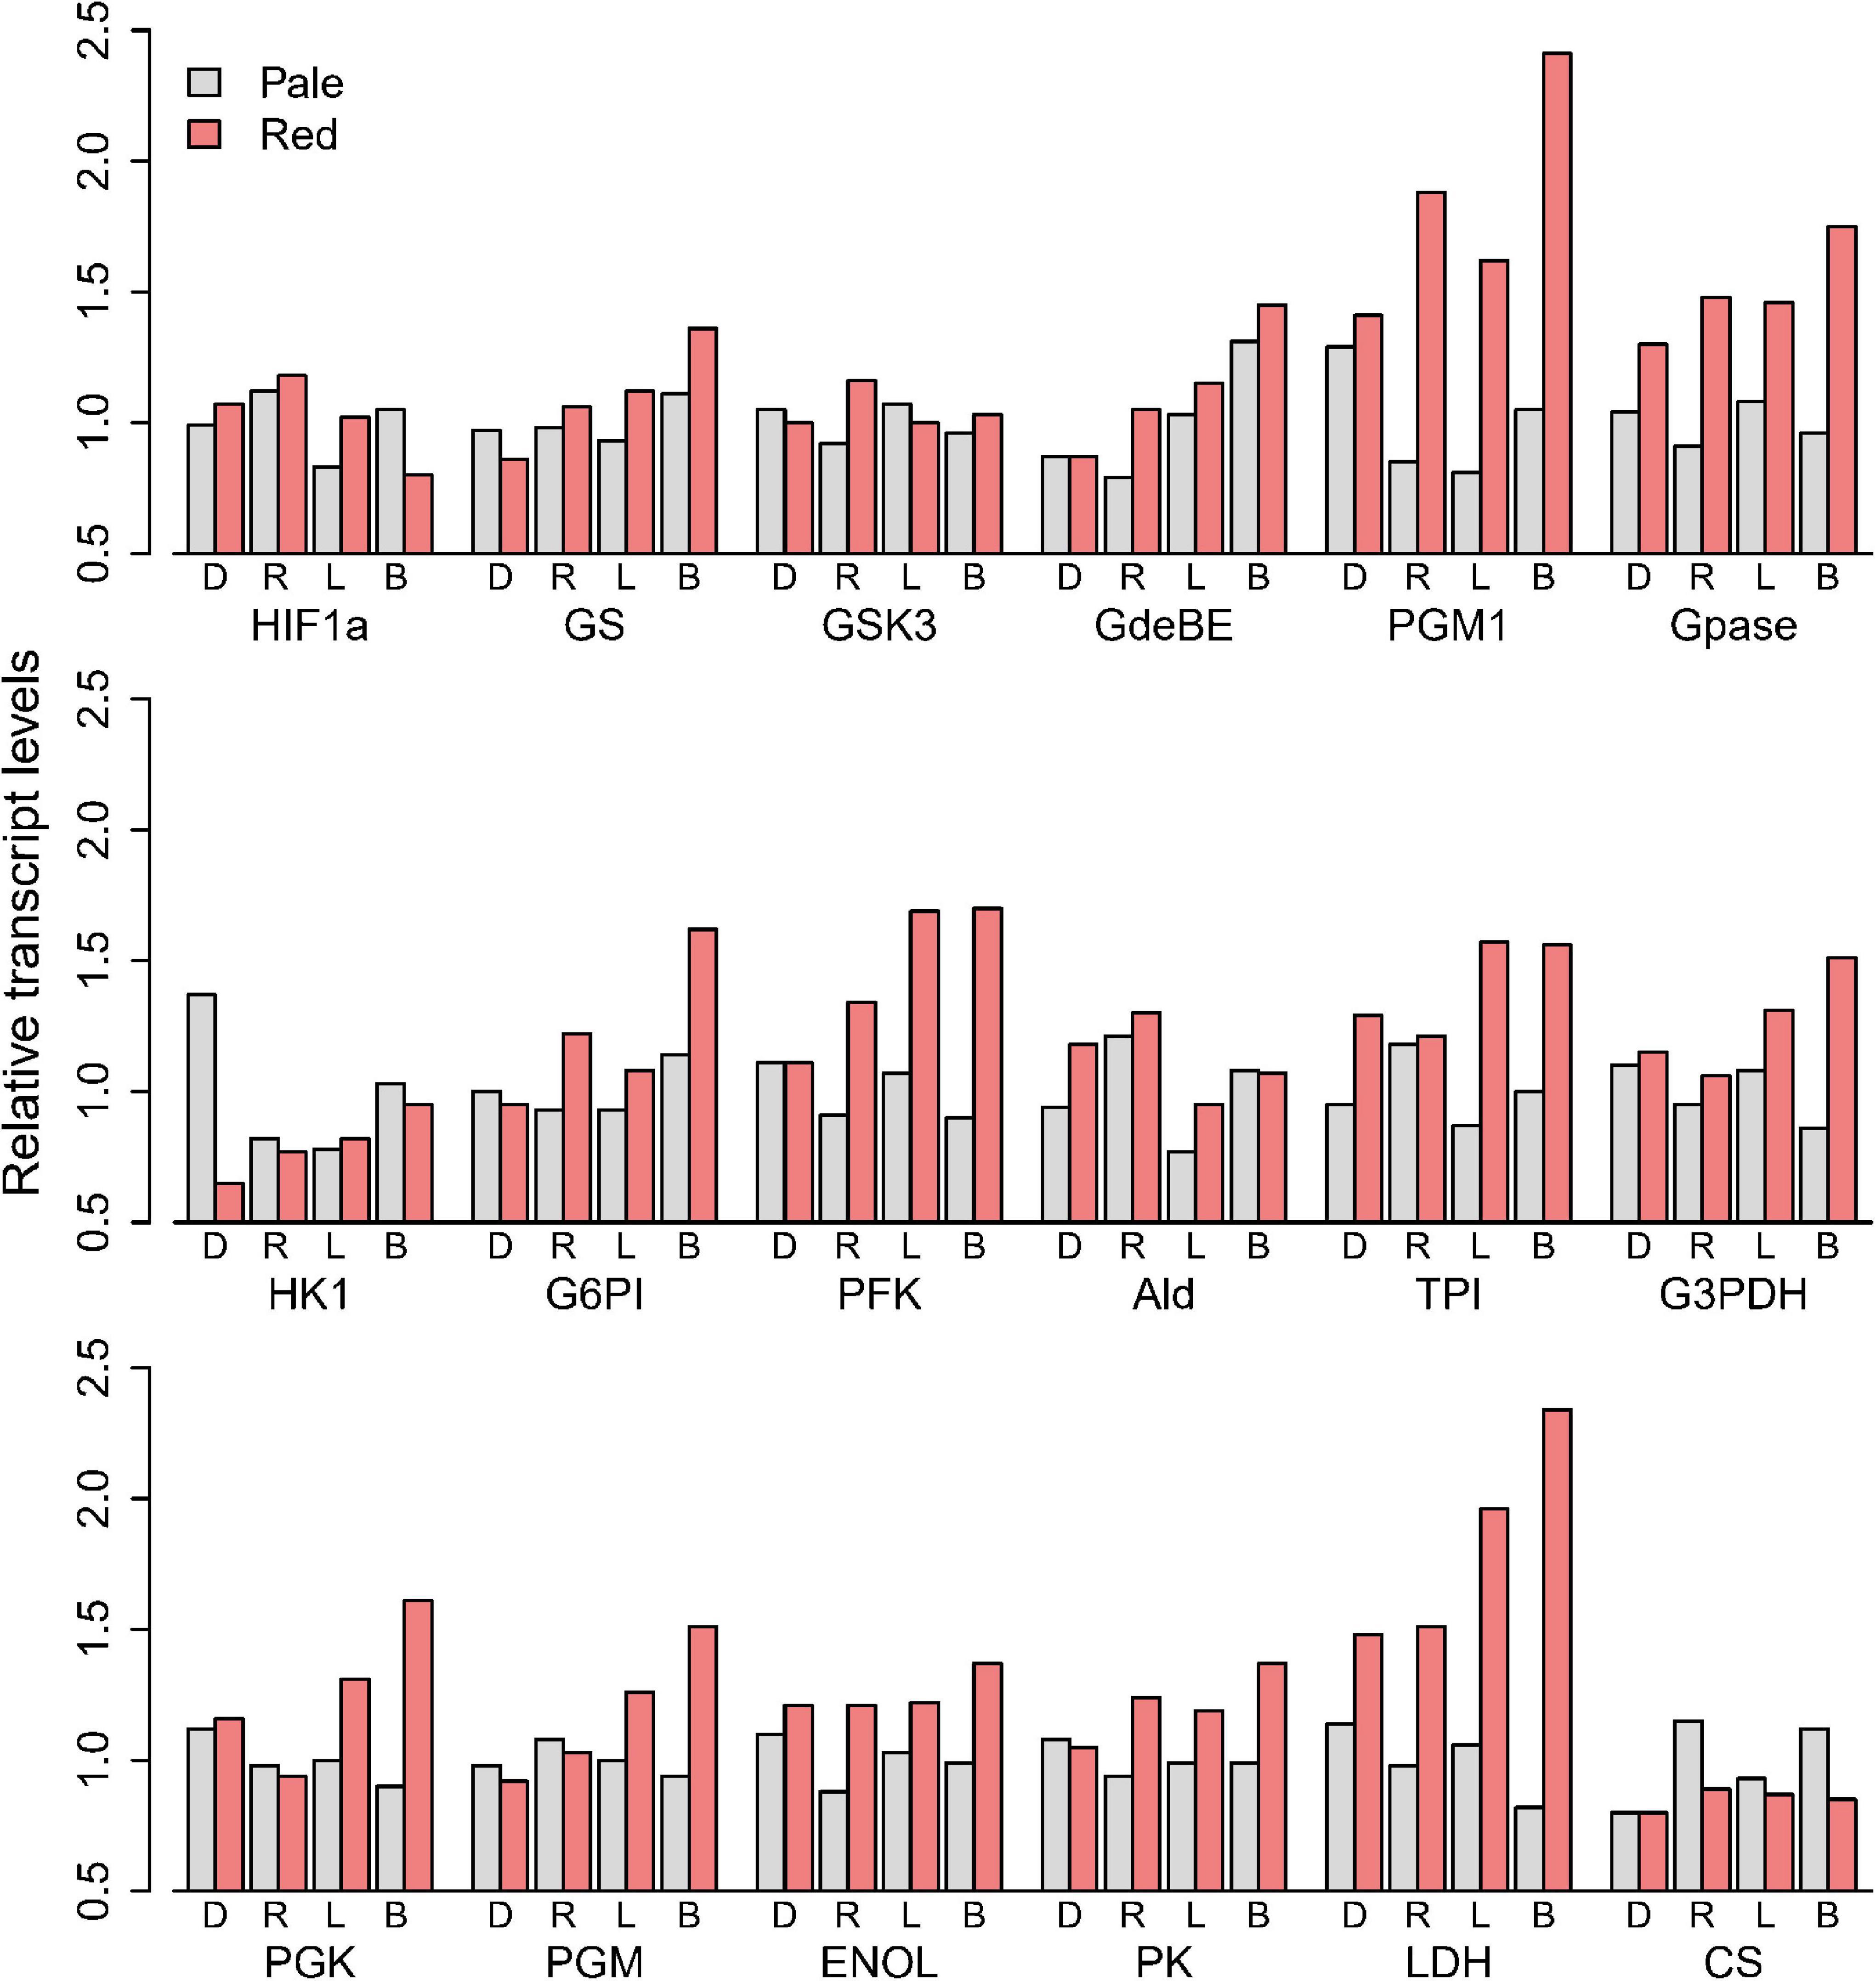
Figure 4. Transcript levels of glycolytic enzymes of pale and red D. pulicaria, relative to the mean of the pale animals from the four hypoxic lakes: Doe Lake (D) Round Lake (R), Long Lake (L), and Black Lake (B).
Hb paralogs were annotated based on a previously published database (Gilbert, 2009). We focused on 10 paralogs among 23 that were expressed at the highest levels (Figure 5A). There were few patterns that were uniform across lakes, with a fair bit of heterogeneity in the nature of the patterns within color morphs. Some paralogs showed consistent patterns between lakes. For example, the mRNA for Daplx7pEVm013242 was present at similar levels in all lakes and both color morphs. However, Daplx7pEVm058987, Daplx7pEVm013392, Daplx7pEVm011494, Daplx7pEVm013338, and Daplx7pEV m012731 were all highly variable between lakes.
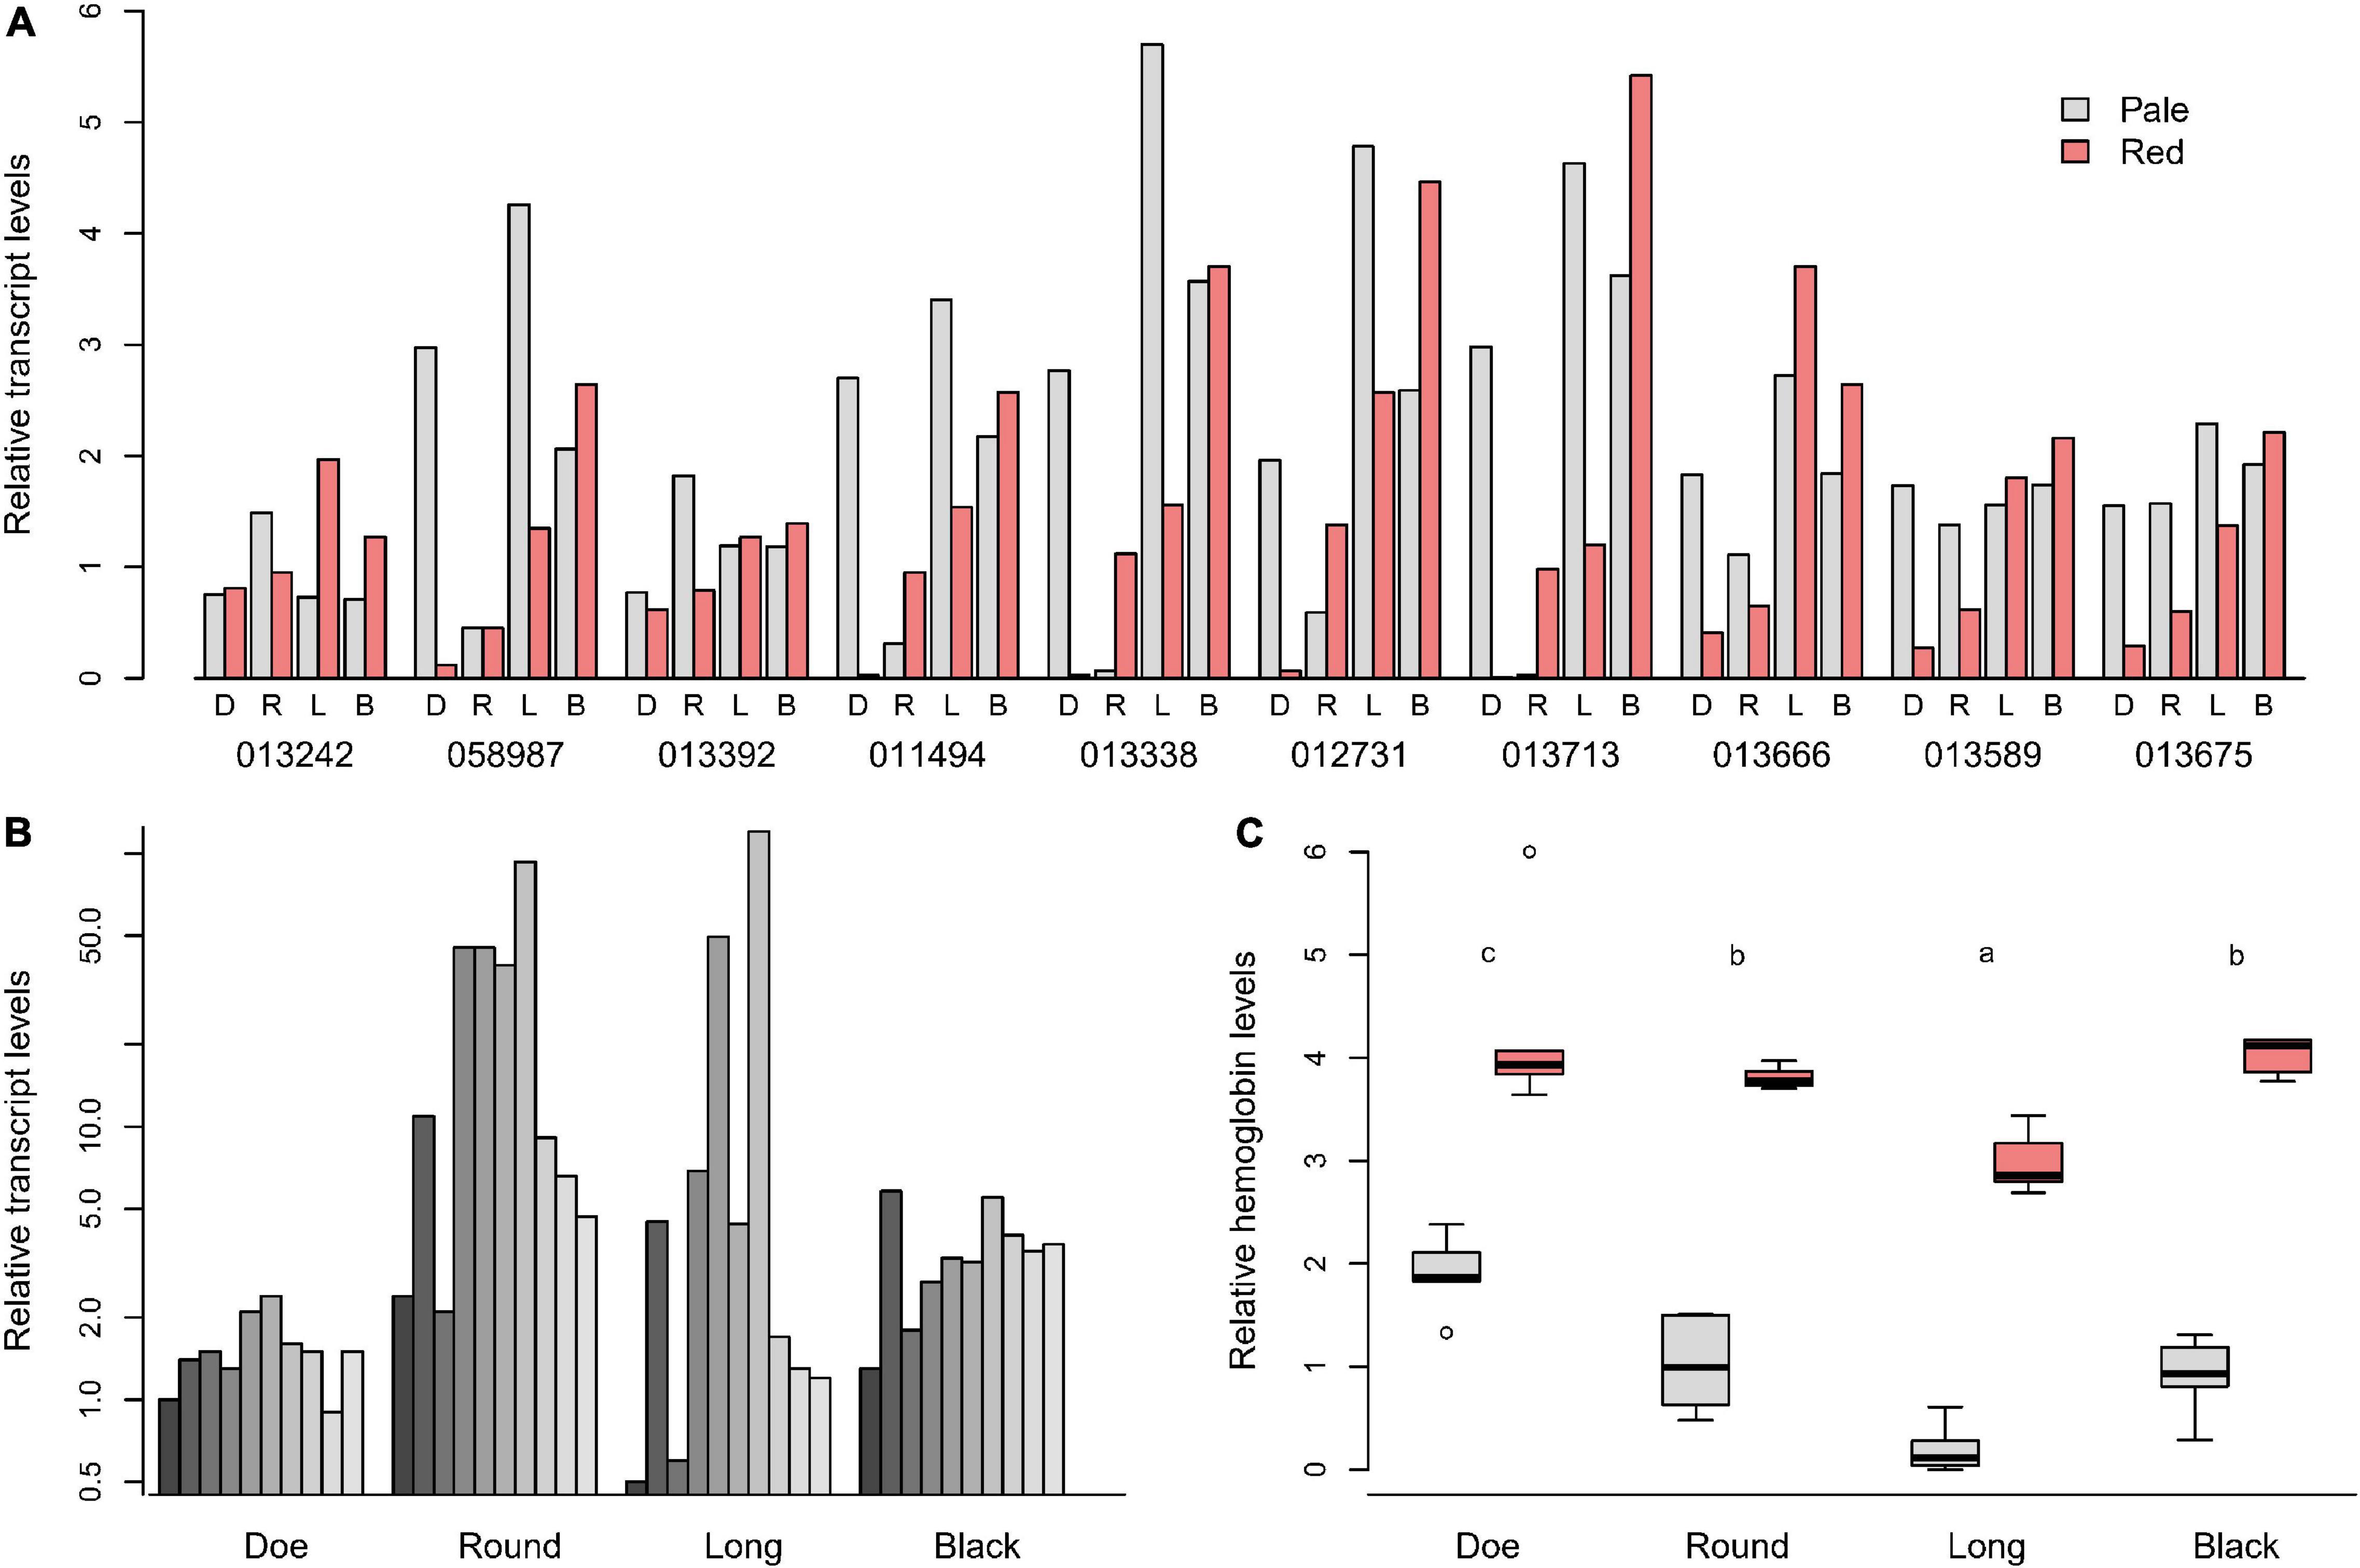
Figure 5. (A) Transcript levels in D. pulicaria for the 10 most abundant hemoglobin transcripts (reported as Daplx7pEVm0#####), expressed relative to the mean of the pale animals. (B) Induction of Hb mRNA seen in red animals relative to the pale from the same lake for each gene in (A). (C) Relative Hb protein levels, scaled to the mean of the pales. Different letters in (C) indicate significant differences (p < 0.05).
The patterns also differed lake by lake. When the mRNA levels were depicted as the ratio of red/pale for each paralog in all lakes, clearer patterns emerged (Figure 5B). Hb paralogs were differentially expressed the least between pales and reds of Doe Lake (∼2-fold), followed by Black Lake (∼4-fold). However, in Round and Long Lakes, the mRNA for Daplx7pEVm011494, Daplx7pEVm013338, Daplx7 pEVm012731, and Daplx7pEVm013713 were up to 40–100-fold higher in red Daphnia. Paradoxically, the mRNA levels for the collection of Hb paralogs did not reflect the differences in relative Hb protein levels seen in animals captured at the same time (Figure 5C and Supplementary Tables 12, 13). Reds in all lakes had a similar magnitude of difference in Hb levels than pales, yet the red/pale difference in Hb mRNA vary from up to 100-fold greater in red animals of Round Lake to two fold in Doe Lake (Figure 5B).
Effects of Season on Enzyme Patterns
The lack of stoichiometry between Hb and glycolytic enzymes prompted us to explore the impact of the history of hypoxic exposure. We returned to these same lakes the following year to characterize the patterns in Hb and LDH that emerge as the season progresses. To capture individual variation to a greater extent, our subsequent studies pooled 3 animals that were color-matched visually to obtain sufficient extract to measure both enzymes and Hb levels. In May 2019, we were unable to find D. pulicaria in Doe Lake, however in the other three lakes we found sufficient animals that ranged in color from pale to red (Figures 6A–D).
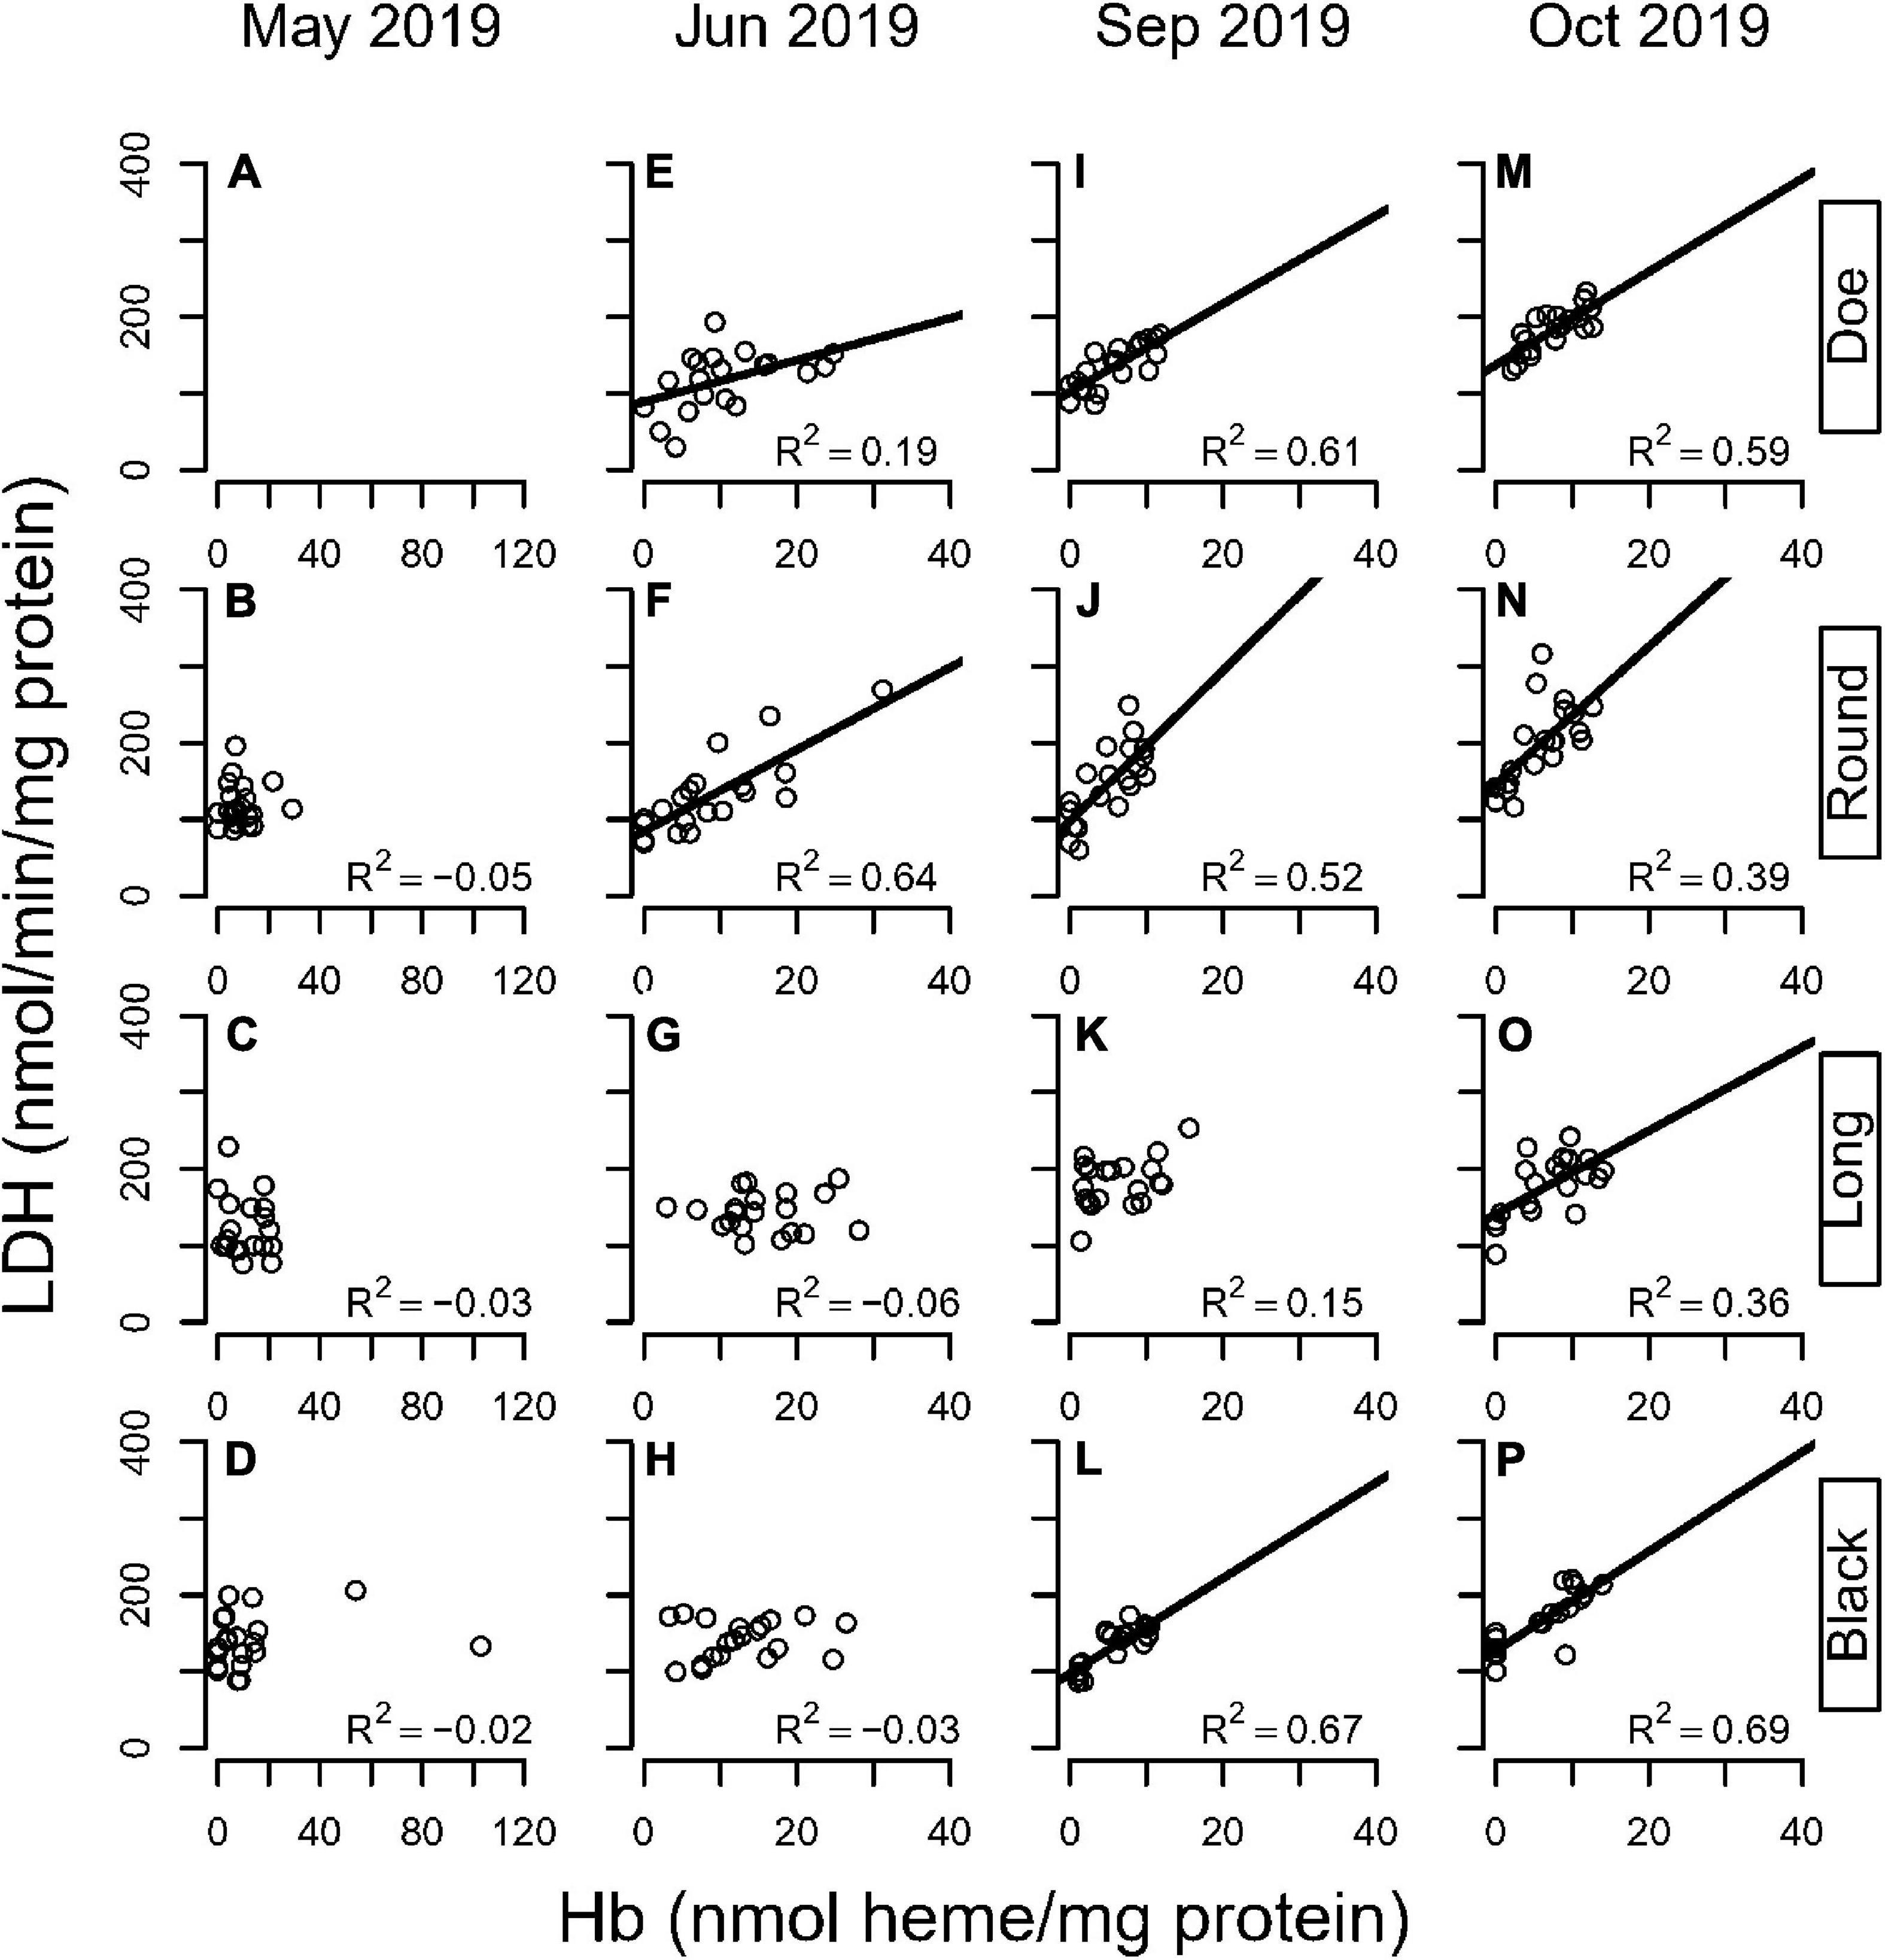
Figure 6. Correlation between LDH and hemoglobin in four hypoxic lakes across months (A–D: May; E–H: June; I–L: September; M–P: October) in D. pulicaria. Each circle is a sample of three animals. Lines denote statistically significant relationships (p < 0.05).
There was a lake and season interaction for changes in LDH activity with Hb (Supplementary Tables 14, 15). In Spring, there was no relationship between Hb levels and LDH activities in any lake. Although Hb varied from undetectable to 20x the detection limit, LDH variation did not correlate with Hb levels. In June, significant correlations between LDH and Hb emerged in Doe and Round Lakes (Figures 6E,F). By September a relationship was seen in these lakes as well as Black Lake (Figures 6I,J,L). By October, all 4 lakes showed a significant correlation between LDH and Hb (Figures 6M–P). Thus, it appears that early in the season, animals increase Hb but not LDH. As the season progresses, LDH activities increase, presumably as part of a metabolic response to hypoxic exposure in combination with warmer temperatures reducing oxygen solubility and increasing metabolic demands.
Gene Induction Under Controlled Hypoxia Exposure
To determine whether the differences in glycolytic enzymes and Hb among lakes was due to evolutionary variation in responsiveness to a similar environment, or exposure to a different environmental history, we exposed isofemale lines from each of the 4 lakes to hypoxia under the same conditions in the lab. Replicate isofemale lines from each experiment were cultured and exposed to normoxia or hypoxia and evaluated for changes in mRNA transcripts of Hb and LDH. Under normoxia, gene expression of one Hb subunit (Daplx7pEVm058987; Figure 7A, Supplementary Table 17) and LDHA (Figure 7C, Supplementary Table 18) varied significantly by up to 10- and 2-fold, respectively, between lakes, whereas expression of another Hb subunit (Daplx7pEVm011494; Figure 7B) did not vary significantly between lakes (Supplementary Table 16). Interestingly, isofemale lines may also exhibit microevolutionary variation within lakes, which is especially pronounced in the baseline expression of Daplx7pEVm058987 in Round Lake (Figure 7A) as well as the baseline expression of LDHA in Doe and Black Lakes (Figure 7C).
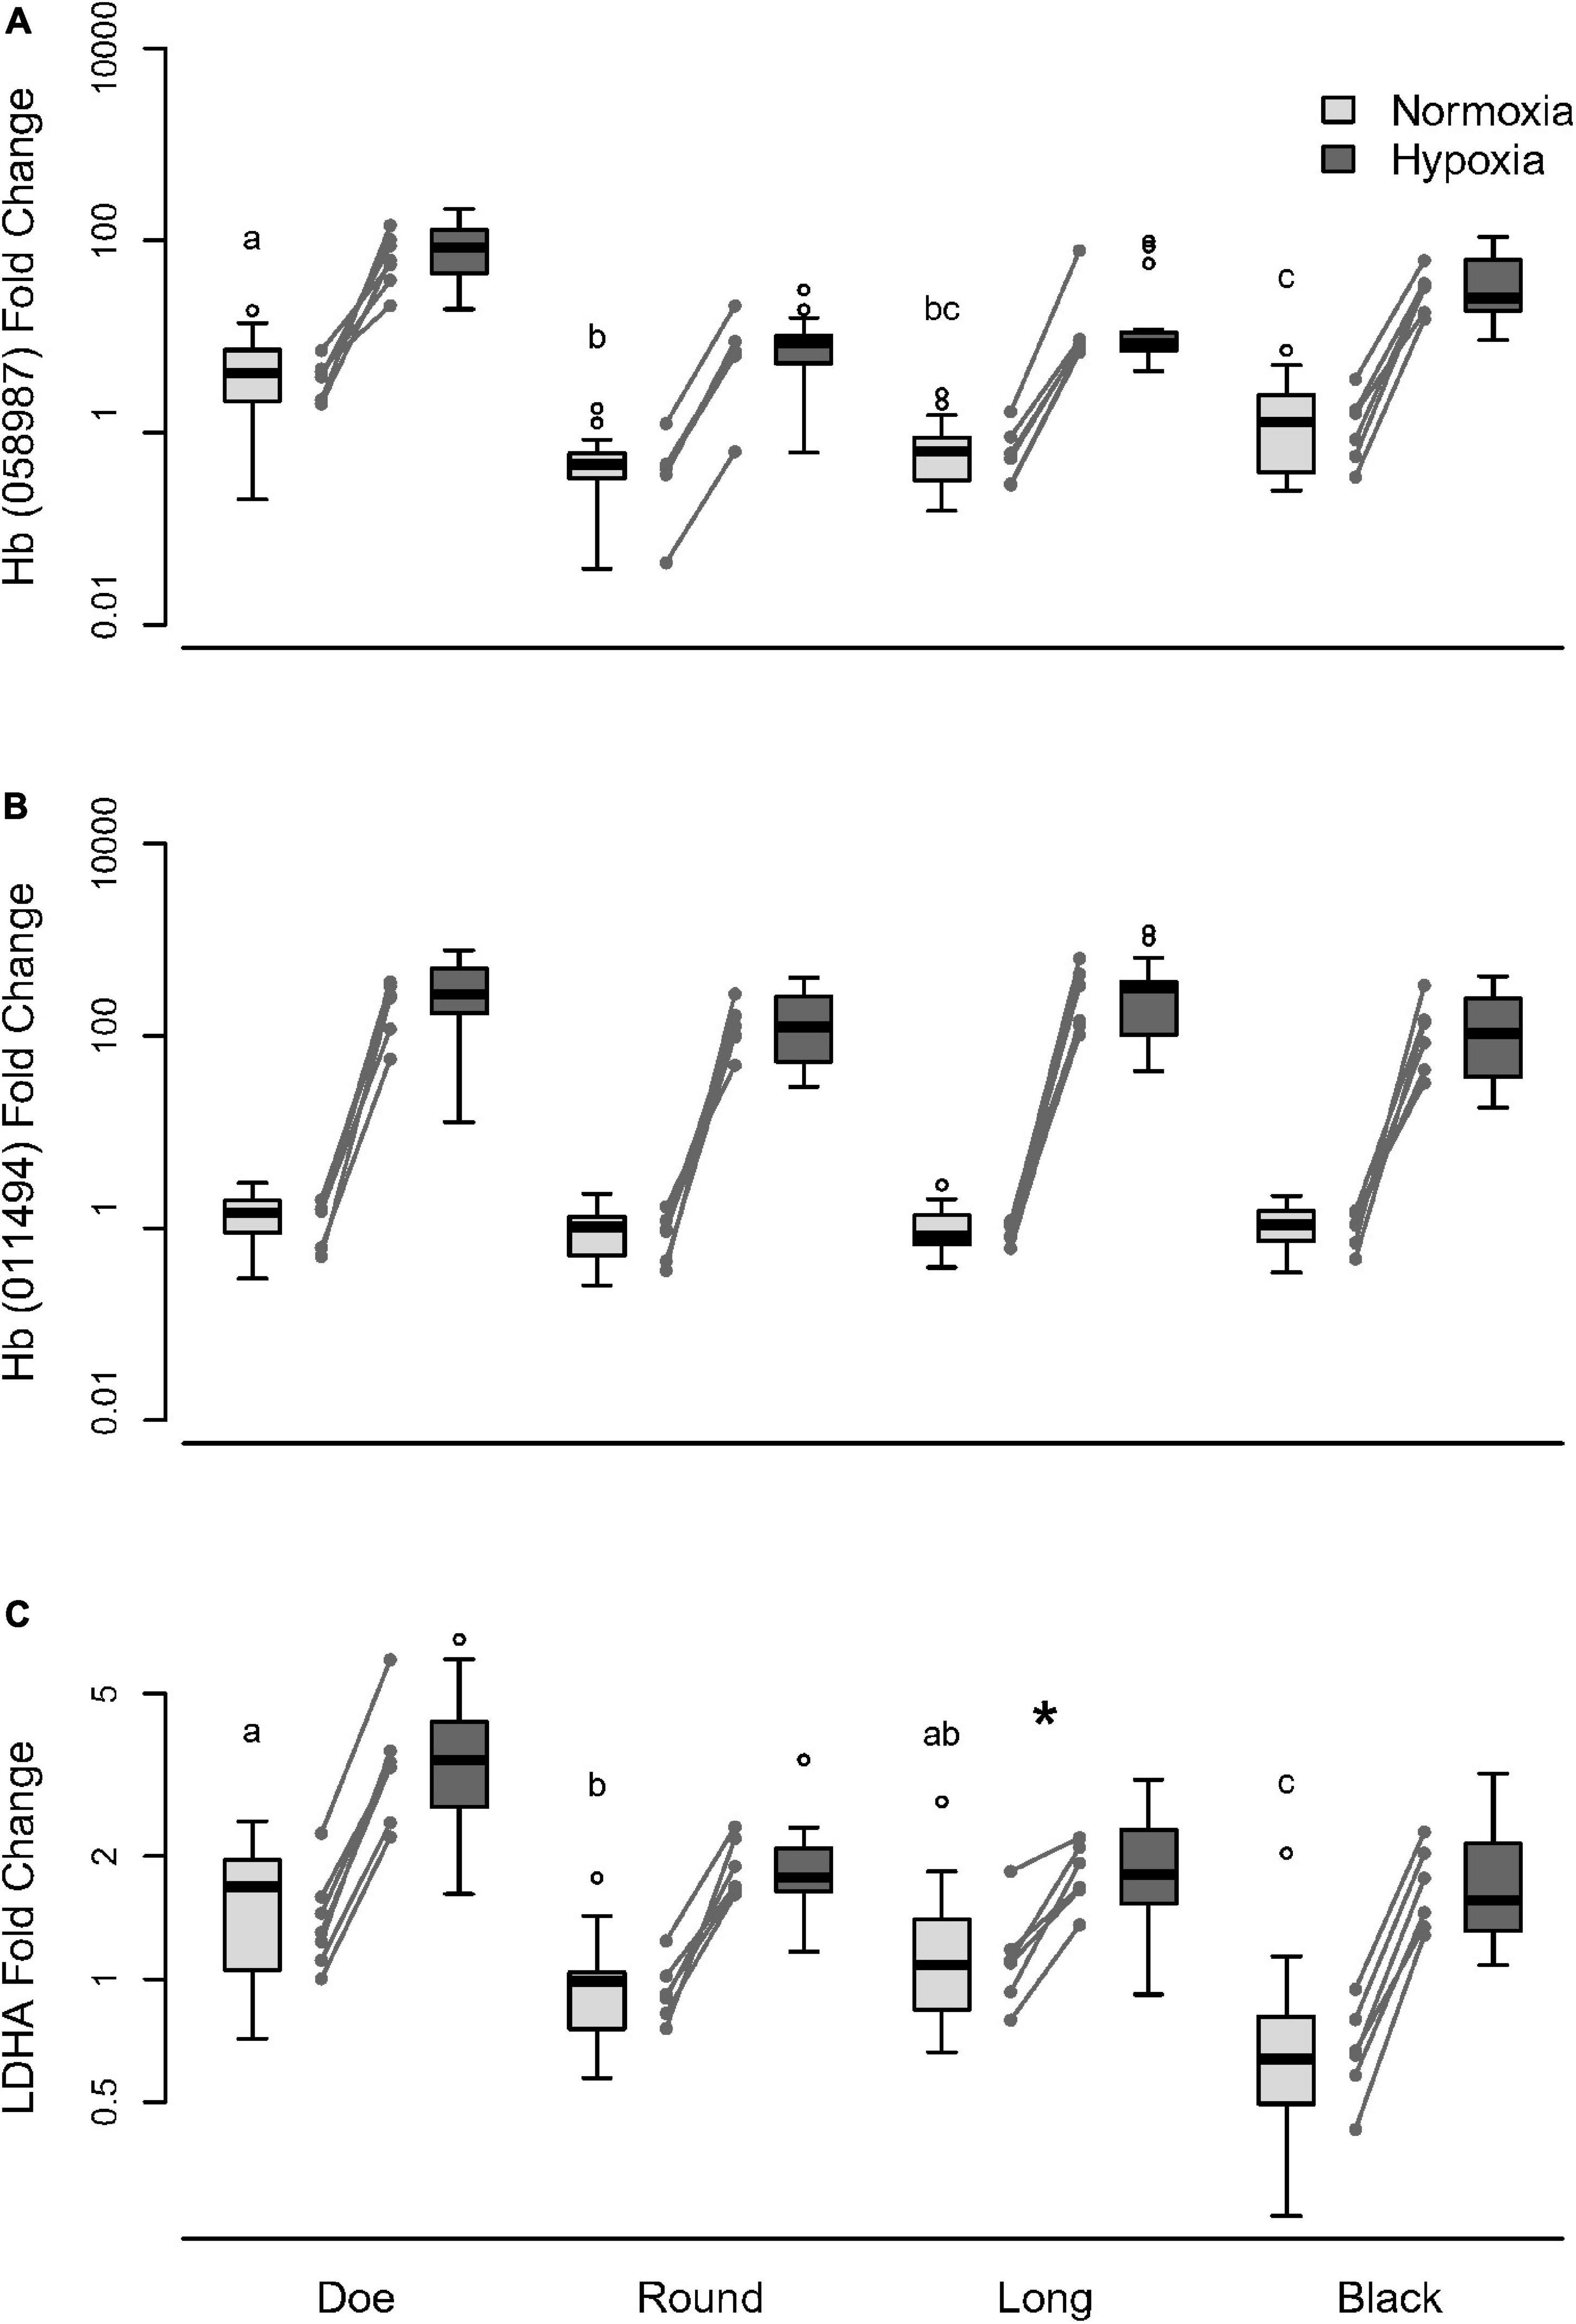
Figure 7. Change in (A) Hb Daplx7pEVm058987, (B) Hb Daplx7pEVm011494, and (C) LDHA mRNA transcripts under hypoxic stress manipulation in D. pulicaria from four hypoxic lakes. D. pulicaria were isolated from each lake and reared in the lab under standard conditions for at least two generations prior to treatment. The treatment oxygen environment was either normoxia (ambient; 21% O2) or hypoxia (3% O2). Baseline expression labeled with different letters indicate significant differences (p < 0.05). The asterisk (*) indicates significantly lower LDHA sensitivity to hypoxia in Long lake compared to Doe and Black lakes.
When exposed to hypoxia, isofemale lines from different lakes upregulated genes by a similar magnitude over normoxic expression; however, the genes differed in sensitivity (Supplementary Table 19). Expression of one Hb subunit Daplx7pEVm058987 increased by about 20-fold under hypoxia (Figure 7A), while another subunit Daplx7pEVm011494 increased by more than 200-fold (Figure 7B), although the sensitivity of these two genes did not differ by lakes. The expression of LDHA increased by about two-fold under hypoxia in most lakes (Figure 7C), with animals from Long Lake showing a significantly weaker response than Doe and Black Lakes (Supplementary Table 20). In comparing the mRNA changes in response to acute hypoxia with the differences seen in transcriptome analyses, it is worth noting that in the transcriptomes, these two Hb genes showed a muted difference in pale vs. red: 2–10-fold higher in red D. pulicaria (Figure 5B).
We also analyzed gene expression of ENOL and PK, focusing on the impact of oxygen. Preliminary studies showed no effect of hypoxia in animals from Doe Lake. When expressed as a fold change for hypoxic/normoxic treatments, there was no effect of hypoxia for either PK (0.99 ± 0.09) or ENOL (1.26 ± 0.13) (Supplementary Figure 3).
Discussion
As first proposed by Verne (1923), Daphnia turn red due to an increase in Hb. Fox (1948) showed that this was due to exposure to low oxygen, conferring greater tolerance to low oxygen environments (Fox et al., 1951; Kring and O’Brien, 1976; Pirow et al., 2001). A great deal has been learned about the subunit composition of Hb (Kobayashi et al., 1988, 1994; Kimura et al., 1999; Zeis et al., 2003), localization of Hb synthesis (Goldmann et al., 1999), and HIF dependency of the Hb response (Gorr et al., 2004). At the organismal level, ecological studies (Landon and Stasiak, 1983; Salonen and Lehtovaara, 1992) used the Hb response to explore differences between pale and red phenotype ecology (Prepas and Rigler, 1978; Duffy, 2010; Meyer and Nelson, 2019; Meyer et al., 2021). These studies collectively support the idea that Hb is essential to the ability of Daphnia to tolerate low environmental oxygen. While the trigger for Hb is undoubtedly hypoxia in the tissues that make Hb, it is unclear whether the Hb response is sufficient to preclude physiological compensation through metabolic remodeling. What was unappreciated at the outset of this study was the complex interplay between oxygen levels and exposure history, the confounding influence of Hb levels, all intertwined with the potential of macroevolutionary and microevolutionary variation in all aspects of the metabolic phenotype.
Connecting Hb Differences to Remodeling of the Metabolic Phenotype
We used D. puIicaria as the focal species to examine the connections between changes in Hb and glycolytic enzymes. Based on vertebrate models, we hypothesized that conditions that were sufficiently hypoxic to trigger Hb gene induction would also induce expression of other HIF-responsive genes, which in mammals include most glycolytic genes (Robin et al., 1984; Webster, 2003). Thus, we were surprised to see little evidence of coordination of genes that are expected to be HIF-responsive. In comparing red and pales from the four lakes, only 2 genes for enzymes associated with glycolysis (LDHA and PGM) showed elevated mRNA (Figure 4). ENOL and PK are HIF-responsive in mammals (Webster et al., 1990; Semenza et al., 1994), but red and pale animals differed by less than 50% for in both enzyme activities (Figure 3) and mRNA levels (Figure 4). Zeis et al. (2009) acclimated Daphnia pulex (the pond relative to D. pulicaria) to 3kPa PO2 and found that they only upregulated ENOL by 1.4-fold under hypoxia, consistent with our results. When exposed to acute hypoxia in the lab, animals from all lakes increased mRNA levels of two Hb genes we studied (Daplx7pEVm058987 and Daplx7pEVm011494) by 20- and 200-fold, respectively, within 18 h (Figure 7). However, the steady state mRNA levels in our transcriptome analysis of field-collected animals showed that the increase in Hb expression in reds varied from 1.4- to 10.9-fold, and 1.3- to 45.2-fold, respectively, for the same two genes between lakes.
There would seem to be a paradox between the major Hb differences, implying a hypoxic response, and the minor differences in the metabolic phenotype. The somewhat muted hypoxia response in field-collected animals that possess Hb compared to lab animals exposed to acute hypoxia suggests that red Daphnia experiences a lesser degree of hypoxia. Nevertheless, there are many confounding factors and alternative explanations to consider in explaining these observations.
Hb is synthesized in the epithelial cells of epipodites, and to a lesser extent the fat cells lining the vessels that carry hemolymph (Goldmann et al., 1999). The location on an external appendage means that the regulation of Hb genes may be more acutely sensitive to environmental hypoxia than other glycolytic genes. In both the transcriptome comparisons of field (Figure 5) and lab animals (Figure 7), it is clear that Hb gene expression is elevated in red animals, suggesting a recent exposure to hypoxia in that tissue. The presence of Hb in the circulation could then mitigate the systemic effects of low ambient oxygen. However, our seasonal sampling shows this to be a fluid relationship. Early in the season (May) when Daphnia undergoes strong population growth, they had little Hb. This could be attributed to Hb’s dual function in reproduction as protein stores in eggs (Fox and Phear, 1953; Kobayashi et al., 1990), with animals transferring Hb to their eggs. As the season progressed, with warmer temperatures and the onset of stratification reducing oxygen solubility, first Hb levels then LDH activity increased, resulting in significant correlations between Hb and LDH levels (Figure 6). Furthermore, each lake reached that point at different timepoints.
The short life span and migratory behavior of Daphnia further complicates the kinetics of Hb. In mammals, the half-life of Hb is on the order of weeks or months, corresponding to the lifespan of an erythrocyte. Hb protein in red Daphnia can decay within days when the animals are placed in normoxic waters (Fox and Phear, 1953). However, Daphnia undergoes diel vertical migrations in and out of hypoxic waters (Lampert, 1993; Meyer and Nelson, 2019; Meyer et al., 2021), which would certainly influence the behavior of Hb genes. Not only do pale and red Daphnia stay at and migrate through different depths that vary in oxygen levels, but red animals also exhibit more intraspecific variation in their diel vertical migration pattern than pale animals (Meyer and Nelson, 2019). Such behavior can introduce extensive variability to the oxygen-deficiency signals that individuals experience, both spatially and temporally. The kinetics of Hb synthesis and degradation in animals that periodically experience hypoxia of different degrees and magnitudes makes it difficult to predict how Hb protein may change once Hb genes are induced. If Hb is maintained in red animals in hypoxic waters, the previously produced Hb may be able to outlive the animal. The benefits of the initial hypoxia-induced expression of Hb may then persist long after the hypoxic signal is removed, reducing cellular exposure to hypoxia. For example, it is possible that the animals in Black and Doe Lakes may have previously produced enough Hb (in response to hypoxia) to avoid hypoxia in the tissues (Figure 5C), resulting in a lack of induction of hypoxia responsive Hb genes (Figure 5B). Conversely, the modest increases in Hb protein in Long Lake may be insufficient to preclude hypoxia, triggering a greater response in hypoxia responsive Hb genes.
However, it is important to keep in mind that changes in relative quantities of individual Hb paralogs may not translate to changes in Hb protein levels, which represent all isoforms. The contribution of each paralog to the overall transcript and eventually protein pool, as well as the effect on Hb function under hypoxia, are unknown. Therefore, the connection between changes in individual Hb transcripts and effects at the protein level remains to be investigated. Nevertheless, Hb protein levels may not reflect the recent history of oxygen exposure in the environment or the degree to which the internal tissues experience hypoxia. In contrast, enzyme protein and mRNA are generally thought to have greater turnover rates than Hb proteins, and thus may be better indices of recent hypoxic history.
Interestingly, our lab experiment enabled us to show that, in contrast to better studied models, Daphnia PK and ENOL orthologs (Supplementary Figure 3) lack oxygen sensitivity, which may explain the smaller and variable difference in PK in the field. Although PK mRNA was not affected by acute hypoxia in the lab, red animals in several lakes showed elevated PK to varying degrees, and the responses were not as strong as LDH within the same lakes (Figure 3). Thus, it seems likely that elevated PK activities were induced by oxygen-independent mechanisms. We do note that PK activities were uniformly higher in D. pulicaria than other species (Figure 2), suggesting a constitutive difference in gene expression.
Are Daphnia Experiencing Systemic Hypoxia?
The seasonal changes in the Hb and LDH relationship suggests that early in the season Hb reduces systemic hypoxia, obviating any metabolic adjustments. This is consistent with the role of Hb in either facilitating diffusion from the periphery in hypoxia or acting as an oxygen store when the animals are anoxic. Kobayashi and Hoshi (1982) found that when animals were faced with a decline in oxygen, pales could sustain their oxygen consumption rate until oxygen levels fell by 80%. Pirow et al. (2001) examined the performance and redox state ([NADH]) of limb muscles in red and pale Daphnia magna that were exposed to a transition from normoxia to anoxia (< 1% atmospheric oxygen) over 51 min. Though both phenotypes were able to maintain limb beating frequency, the pale Daphnia showed a decline in NADH in hypoxia, suggesting that Hb permitted animals to avoid anaerobic metabolism (Pirow et al., 2001). Usuki and Yamaguchi (1979) measured survival time and lactic acid in red and pale Daphnia magna exposed to a gradient of oxygen concentrations. Red and pale animals showed a similar pattern in lactate production where both phenotypes had high production at low oxygen concentration and low lactate production at high oxygen concentration. However, the two phenotypes differed in survival time. Red Daphnia could survive up to 24 h when oxygen levels were approximately 5% air saturation. Pale Daphnia died after 1-h of oxygen levels less than 7% air saturation. Collectively, these studies suggest that Hb acts primarily to facilitate oxygen delivery.
Our analysis of metabolic parameters argues against a role for Hb to act purely as an oxygen store. In brief, there is not enough Hb to store enough oxygen to permit the animals to sustain their normoxic metabolic rate in the absence of oxygen for a realistic period. Based on previous studies (Ullrich and Millemann, 1983; Baillieul et al., 2005; Jensen and Hessen, 2007; Villarroel et al., 2013; Lari et al., 2017), we estimate Daphnia metabolic rate to be in the range of 0.7–1.7 nmol O2 per mg per min, or 3.5–8.5 nmol ATP per min per mg (assuming ATP:O2 = 5). Each of these studies reports units in a different manner, so our assumptions and calculations are provided in Supplementary Table 21. Our Hb measurements provide an index of Hb levels and oxygen carrying capacity. Using bovine Hb as a standard, we estimate that Hb levels in Daphnia are less than 40 nmol heme per animal, which would carry 40 nmol O2. Thus, at a metabolic rate of 1.7 nmol O2 per min, a fully loaded Hb could sustain aerobic metabolism for approximately 24 min at 20°C. Our glycogen measurements (Figure 3D) show these animals to have about 1,000 nmol glucosyl/mg protein, so a 1 mg animal (0.1 mg protein/mg animal) would have approximately 100 nmol glucosyl, which under anaerobic conditions would contribute 300 nmol ATP. Thus, at a metabolic rate of 8.5 nmol ATP per min, a 1 mg animal could survive on glycogen for 24 min without oxygen. These capacities for oxygen-dependent metabolism (using O2 on Hb) and glycogen-based anaerobic metabolism would be extended at lower temperatures. With a Q10 of 2–3, and animal living at 4°C could extend the limits to approximately 1 h.
Putting these values together, a Daphnia with fully loaded Hb and storing a typical amount of glycogen could survive at its normal metabolic rate in the absence of external oxygen for approximately 48 min. However, the exact limits are difficult to predict for a free-living animal. On one hand, the limits could be extended with metabolic suppression (reducing demand) and feeding (increasing glucose), in combination with the benefits of lower temperature. Conversely, animals that needed to actively swim upwards in the water column to return to normoxic surface water would incur greater energetic costs associated with antennal movement. Since these animals live in and migrate through deep hypoxic zones, the implication is that Hb is present not as an oxygen store but rather as a means of extracting oxygen from hypoxic waters. Furthermore, the ability of Hb to facilitate oxygen extraction may be sufficient for an animal to ensure its tissues remain normoxic, obviating a hypoxic response in terms of the metabolic phenotype. Increases in LDH mRNA and protein would only be necessary when oxygen demands, enhanced by warm temperatures, exceed oxygen supply. In our seasonal sampling, Daphnia in each lake seemed to reach this point of an induced metabolic response along a different time course, and those dynamics likely change from year to year.
Macroevolutionary and Microevolutionary Variation in the Hypoxic Response
Enzyme measurements can be used to characterize the metabolic poise of a tissue and animal (Newsholme and Crabtree, 1986). Previous studies have explored the differences in Daphnia species that may explain their distribution within and between lakes (Hanazato et al., 1989; Leibold, 1991; Leibold and Tessier, 1991; Lampert, 1993; Tessier and Leibold, 1997; Duffy, 2010; Meyer et al., 2021). The ability to produce Hb alters where the animals can move within the water column, but it also alters appearance, which can influence predation (Green, 1956; Leibold, 1991; Larsson and Lampert, 2011). High activities of glycolytic enzymes, particularly LDH, reflect a reliance on anaerobic glycolysis to produce ATP. Changes/differences in glycolytic enzymes between individuals/species usually implies some degree of specialization for either burst activity (where ATP demand outstrips aerobic ATP supply) or oxygen limitations (where aerobic ATP production is compromised). We explored the metabolic properties of Daphnia species within and between lakes of different physical and chemical properties. Although we discriminate based on oxygen levels arising from thermal stratification, there are also associated differences in salinity, conductivity, pH and nutrients, all of which may affect Daphnia populations (Aladin and Potts, 1995; Vijverberg et al., 1996; Elser et al., 2001; Dodson et al., 2009).
Given the lack of simple relationship between Hb and LDH levels within D. pulicaria, it is perhaps not surprising that there is no simple pattern in this relationship between species. However, a few comparisons stand out. First, when comparing species, we were surprised to find two species (D. dubia and D. retrocurva) excluded from the 10 lakes that possessed a hypoxic hypolimnion, each of which have a normoxic epilimnion. If this was a metabolic limitation, then it could be hypothesized that these species might be specialized for normoxic environments, and perhaps possess relatively low glycolytic enzyme activities. However, LDH and PK for these species were indistinguishable from D. mendotae in the same lakes (Figure 2), providing no evidence for metabolic limitation. Second, D. mendotae was found in both normoxic and hypoxic lakes, and they showed a trend toward having higher LDH activities in lakes with a hypoxic hypolimnion even before stratification arose within the lakes (Figures 2A,B), suggesting some degree of compensation in this species. Third, D. pulicaria, only found in hypoxic lakes, showed higher PK activity than other species (Figures 2C,D), suggesting some degree of metabolic specialization, yet LDH was not higher, and in some cases markedly lower, with considerable lake-to-lake variation (Figures 2A,B). Since our controlled experiment showed that the PK gene was not hypoxia sensitive, it is likely that a higher constitutive expression of PK benefits anaerobic glycolytic metabolism. Thus, the differences in PK activities between red and pale animals seen in select lakes is likely due to factors other than oxygen-sensitive PK expression. It also opens the possibility of lineage-specific losses in hypoxia responsiveness of glycolytic genes that, in other species, respond to HIF as part of phenotypic remodeling as part of hypoxic responses. Although HIF and the HIF network are thought to have evolved in early metazoans (Loenarz et al., 2011; Mills et al., 2018), there are many examples of evolutionary changes in the pathway. It is noteworthy that other crustaceans appear to have evolved differences in their HIF network. For example, the copepod Tigriopus californicus has lost multiple components of the HIF network (Graham and Barreto, 2019).
Our initial impressions were that the changes seen in D. pulicaria between lakes at a sampling point might be driven in part by microevolutionary variation. With Daphnia there is a great potential for population-level variation because of their reproductive cycle, where only a few genotypes survive the overwintering period then proliferate by parthenogenesis. Although much of the variation we see in metabolic traits can be attributed to the dynamics of changes in oxygen, we did see evidence of population level variation. Under controlled lab conditions, we saw clear differences in baseline expression of LDH and one inducible Hb gene between lakes (Figure 7). The basal transcriptional regulation of these genes is governed by many factors that act in tissue-specific ways, so it is not a contradiction that each gene seemed to be induced to a similar extent by hypoxia. The variation in LDH basal expression seen between lakes is consistent with the highly variable LDH activities seen amongst lakes in pale animals (Figure 2).
Isofemale line within lakes also appear to show variation in expression of Hb and LDH (Figure 7), which suggests the possibility for microevolution due to the availability of distinct ecological niches within lakes. However, the extent of within-lake variation in this study may be limited by the use of only six isofemale lines, propagated from one sampling attempt at the deep point of each lake. Nevertheless, our results provide preliminary evidence for microevolution within lakes, prompting further deliberate sampling from multiple parts of each lake, as well as incubation experiments testing for the ecological forces that may drive such microevolution.
Conclusion
Collectively, these studies provide evidence for a combination of macroevolutionary and microevolutionary variation in the relationship between ecological niche and the hypoxic metabolic phenotype. Hb accumulation in response to hypoxia appears to obviate the hypoxia-dependent expression of LDH early in the seasons, but inadequate to preclude a hypoxic response later in the season. The metabolic phenotype also supports the idea that Hb is present primarily to extract oxygen from hypoxic waters, permitting the animal to be functionally normoxic.
Data Availability Statement
The datasets presented in this study can be found in online repositories. The names of the repository/repositories and accession number(s) can be found below: https://www.ncbi.nlm.nih.gov/, GSE159485. Further inquiries can be directed to the corresponding author/s.
Author Contributions
KW, WN, and CDM contributed to conception and design of the study. TL and KW conducted the experiments. TL, KW, CJM, and WN performed the statistical analyses. TL, KW, WN, and CDM wrote sections of the final manuscript. All authors contributed to manuscript revision, read, and approved the submitted version.
Funding
This research was supported by the NSERC Canada in the form of a Canada Graduate Scholarship (TL) and Discovery Grants (CDM and WN).
Conflict of Interest
The authors declare that the research was conducted in the absence of any commercial or financial relationships that could be construed as a potential conflict of interest.
Publisher’s Note
All claims expressed in this article are solely those of the authors and do not necessarily represent those of their affiliated organizations, or those of the publisher, the editors and the reviewers. Any product that may be evaluated in this article, or claim that may be made by its manufacturer, is not guaranteed or endorsed by the publisher.
Acknowledgments
We thank our colleagues Shelley Arnott for her support in the field work in this study and Shirley French for her advice and support in rearing zooplankton. We also thank Zhengxin Sun for his help in preparing the transcriptome library, Sara Hadi for technical assistance, and the reviewers for providing helpful insights.
Supplementary Material
The Supplementary Material for this article can be found online at: https://www.frontiersin.org/articles/10.3389/fevo.2022.822935/full#supplementary-material
Footnote
References
Aladin, N. V., and Potts, W. T. W. (1995). Osmoregulatory capacity of the Cladocera. J. Comp. Physiol. B 164, 671–683. doi: 10.1242/jeb.009175
Andrews, S. (2010). FastQC: a Quality Control Tool for High Throughput Sequence Data [Online]. Available online at: http://www.bioinformatics.babraham.ac.uk/projects/fastqc/ (accessed October, 2019).
Baillieul, M., Smolders, R., and Blust, R. (2005). The effect of environmental stress on absolute and mass-specific scope for growth in Daphnia magna Strauss. Comp. Biochem. Physiol. C Toxicol. Pharmacol. 140, 364–373. doi: 10.1016/j.cca.2005.03.007
Bates, D., Mächler, M., Bolker, B., and Walker, S. (2015). Fitting linear mixed-effects models using lme4. J. Stat. Softw. 67, 1–48.
Bolger, A. M., Lohse, M., and Usadel, B. (2014). Trimmomatic: a flexible trimmer for Illumina sequence data. Bioinformatics 30, 2114–2120. doi: 10.1093/bioinformatics/btu170
Burnham, K. P., Anderson, D. R., and Huyvaert, K. P. (2011). AIC model selection and multimodel inference in behavioral ecology: some background, observations, and comparisons. Behav. Ecol. Sociobiol. 65, 23–35. doi: 10.1007/s00265-010-1029-6
Colbourne, J. K., Pfrender, M. E., Gilbert, D., Thomas, W. K., Tucker, A., Oakley, T. H., et al. (2011). The ecoresponsive genome of Daphnia pulex. Science 331, 555–561.
Davies, R., Moyes, C. D., and Wang, Y. (2011). Intra- and Inter-specific variation in metabolic gene expression in relationship to environmental hypoxia. Comp. Biochem. Physiol. 159, 25–31. doi: 10.1016/j.cbpa.2011.01.012
Discher, D. J., Bishopric, N. H., Wu, X., Peterson, C. A., and Webster, K. A. (1998). Hypoxia regulates β-enolase and pyruvate kinase-M promoters by modulating Sp1/Sp3 binding to a conserved GC element. J. Biochem. 273, 26087–26093. doi: 10.1074/jbc.273.40.26087
Dodson, S. I., Newman, A. L., Will-Wolf, S., Alexander, M. L., Woodford, M. P., and Van Egeren, S. (2009). The relationship between zooplankton community structure and lake characteristics in temperate lakes (Northern Wisconsin, USA). J. Plankton Res. 31, 93–100. doi: 10.1093/plankt/fbn095
Duffy, M. A. (2010). Ecological consequences of intraspecific variation in lake Daphnia. Freshw. Biol. 55, 995–1004.
Elser, J. J., Hayakawa, K., and Urabe, J. (2001). Nutrient limitation reduces food quality for zooplankton: daphnia response to seston phosphorus enrichment. Ecology 82, 898–903.
Fox, H. M. (1948). The haemoglobin of Daphnia. Proc. R. Soc. B Biol. Sci. 135, 195–212. doi: 10.1098/rspb.1948.0006
Fox, H. M., Gilchrist, B. M., and Phear, E. A. (1951). Functions of haemoglobin in Daphnia. Proc. R. Soc. B Biol. Sci. U.S.A. 138, 514–528.
Fox, H. M., and Phear, E. A. (1953). Factors influencing haemoglobin synthesis by Daphnia. Proc. R. Soc. B Biol. Sci. U.S.A. 141, 179–189. doi: 10.1098/rspb.1953.0034
Frisch, D., Becker, D., and Wojewodzic, M. W. (2020). Dissecting the transcriptomic basis of phenotypic evolution in an aquatic keystone grazer. Mol. Biol. Evol. 37, 475–487. doi: 10.1093/molbev/msz234
Galic, N., Hawkins, T., and Forbes, V. E. (2019). Adverse impacts of hypoxia on aquatic invertebrates: a meta-analysis. Sci. Total. Environ. 652, 736–743. doi: 10.1016/j.scitotenv.2018.10.225
Gerke, P., Boerding, C., Bettina, Z., and Paul, R. J. (2011). Adaptive haemoglobin gene control in Daphnia pulex at different oxygen and temperature conditions. Comp. Biochem. Physiol. 159, 56–65. doi: 10.1016/j.cbpa.2011.01.017
Gilbert, D. (2009). OrthoMCL clustering among 14 arthropod proteomes (ARP2). Available online at: http://arthropods.eugenes.org/arthropods/ (accessed October, 2019).
Goldmann, T., Becher, B., Wiedorn, K. H., Pirow, R., Deutschbein, M. E., Vollmer, E., et al. (1999). Epipodite and fat cells as sites of hemoglobin synthesis in the branchiopod crustacean Daphnia magna. Histochem. Cell Biol. 112, 335–339. doi: 10.1007/pl00007905
Gorr, T. A., Cahn, J. D., Yamagata, H., and Bunn, H. F. (2004). Hypoxia-induced synthesis of hemoglobin in the crustacean Daphnia magna is hypoxia-inducible factor-dependent. J. Biol. Chem. 279, 36038–36047. doi: 10.1074/jbc.M403981200
Graham, A. M., and Barreto, F. S. (2019). Loss of the HIF pathway in a widely distributed intertidal crustacean, the copepod Tigriopus californicus. Proc. Natl. Acad. Sci. U S A 116, 12913–12918. doi: 10.1073/pnas.1819874116
Green, J. (1956). Variation in the haemoglobin content of Daphnia. Proc. R. Soc. B Biol. Sci. U S A. 145, 214–232.
Hanazato, T., Yasuno, M., and Hosomi, M. (1989). Significance of a low oxygen layer for a Daphnia population in Lake Yunoko. Japan. Hydrobiologia 185, 19–27. doi: 10.1007/bf00006064
Haney, J. F., Aliberti, M. A., Allan, E., Allard, S., Bauer, D. J., Beagen, W., et al. (2013). An Image-Based Key to the Zooplankton of North America, version 5.0 released 2013. Durham: University of New Hampshire Center for Freshw.
Hembre, L. K., and Megard, R. O. (2003). Seasonal and diel patchiness of a Daphnia population: an acoustic analysis. Limnol. Oceanogr. 48, 2221–2233.
Hothorn, T., Bretz, F., and Westfall, P. (2008). Simultaneous inference in general parametric models. Biomed. J. 50, 346–363. doi: 10.1002/bimj.200810425
Jensen, T. C., and Hessen, D. O. (2007). Does excess dietary carbon affect respiration of Daphnia? Oecologia 152, 191–200. doi: 10.1007/s00442-006-0652-4
Kimura, S., Tokishita, S. I., Ohta, T., Kobayashi, M., and Yamagata, H. (1999). Heterogeneity and differential expression under hypoxia of two-domain hemoglobin chains in the water flea, Daphnia magna. J. Biol. Chem. 274, 10649–10653. doi: 10.1074/jbc.274.15.10649
Kobayashi, M., Fujiki, M., and Suzuki, T. (1988). Variation in and oxygen-binding properties of Daphnia magna hemoglobin. Physiol. Zool. 61, 415–419.
Kobayashi, M., and Hoshi, T. (1982). Relationship between the haemoglobin concentration of Daphnia magna and the ambient oxygen concentration. Comp. Biochem. Physiol. Part A 72, 247–249. doi: 10.1016/0300-9629(82)90040-8
Kobayashi, M., Ishigaki, K., Kobayashi, M., Igarashi, Y., and Imai, K. (1994). Oxygen transport efficiency of multiple-component hemoglobin in Daphnia magna. Can. J. Zool. 72, 2169–2171. doi: 10.1139/z94-289
Kobayashi, M., Kato, S., Ninomiya, M., Fujiki, M., Igarashi, Y., and Kajita, A. (1990). Hemoglobin in the parthenogenetic eggs of Daphnia magna. J. Exper. Zool. 254, 18–24. doi: 10.1002/jez.1402540105
Kring, R. L., and O’Brien, W. J. (1976). Effect of varying oxygen concentrations on the filtering rate of Daphnia pulex. Ecology 57, 808–814. doi: 10.2307/1936194
Lampert, W. (1993). Ultimate causes of diel vertical migration of zooplankton: new evidence for the predator avoidance hypothesis. Archiv für Hydrobiologie Beiheft 39, 79–88.
Landon, M. S., and Stasiak, R. H. (1983). Daphnia hemoglobin concentration as a function of depth and oxygen availability in Arco Lake, Minnesota. Limnol. Oceanogr. 28, 731–737.
Langmead, B. (2010). Aligning short sequencing reads with Bowtie. Curr. Protoc. Bioinformatics 32, 11–17. doi: 10.1002/0471250953.bi1107s32
Lari, E., Mohaddes, E., and Pyle, G. G. (2017). Effects of oil sands process-affected water on the respiratory and circulatory system of Daphnia magna Straus, 1820. Sci. Tot. Environ. 60, 824–829. doi: 10.1016/j.scitotenv.2017.06.207
Larsson, P., and Lampert, W. (2011). Experimental evidence of a low-oxygen refuge for large zooplankton. Limnol. Oceanogr. 56, 1682–1688
Leibold, M., and Tessier, A. J. (1991). Contrasting patterns of body size for Daphnia species that segregate by habitat. Oecologia 86, 342–348. doi: 10.1007/BF00317599
Leibold, M. A. (1991). Trophic interactions and habitat segregation between competing Daphnia species. Oecologia 86, 510–520. doi: 10.1007/BF00318317
Li, B., and Dewey, C. N. (2011). RSEM: accurate transcript quantification from RNA-seq data with or without a reference genome. BMC Bioinformatics 12:323. doi: 10.1186/1471-2105-12-323
Loenarz, C., Coleman, M. L., Boleininger, A., Schierwater, B., Holland, P. W. H., Ratcliffe, P. J., et al. (2011). The hypoxia-inducible transcription factor pathway regulates oxygen sensing in the simplest animal, Trichoplax adhaerens. EMBO Rep. 12, 63–70. doi: 10.1038/embor.2010.170
Lyu, K., Gu, L., Wang, H., Zhu, X., Zhang, L., Sun, Y., et al. (2019). Transcriptomic analysis dissects the mechanistic insight into the Daphnia clonal variation in tolerance to toxic Microcystis. Limnol. Oceanogr. 64, 272–283. doi: 10.1002/lno.11038
Meyer, G. A., and Nelson, W. A. (2019). Behavioral diversity is maintained by a conditional strategy in a freshwater zooplankton. Behav. Ecol. 30, 1001–1011. doi: 10.1093/beheco/arz041
Meyer, G. A., Westbury, K., and Nelson, W. A. (2021). Partial diel vertical migration over strong environmental gradients structured by physiology, not adult size or genotype, in a freshwater zooplankton. Hydrobiologia 848, 2773–2784. doi: 10.1007/s10750-021-04596-9
Mills, D. B., Francis, W. R., Vargas, S., Larsen, M., Elemans, C. P. H., Canfield, D. E., et al. (2018). The last common ancestor of animals lacked the HIF pathway and respired in low-oxygen environments. eLife 6:e31176. doi: 10.7554/eLife.31176
Miner, B. E., De Meester, L., Pfrender, M. E., Lampert, W., and Hairston, N. G. (2012). Linking genes to communities and ecosystems: Daphnia as an ecogenomic model. Proc. R. Soc. Biol. Sci. Series B 279, 1873–1882. doi: 10.1098/rspb.2011.2404
Newsholme, E. A., and Crabtree, B. (1986). Maximum catalytic activity of some key enzymes in provision of physiologically useful information about metabolic fluxes. J. Exp, Zool. 239, 159–167. doi: 10.1002/jez.1402390203
Paul, R. J., Colmorgen, M., Hüller, S., Tyroller, F., and Zinkler, D. (1997). Circulation and respiratory control in millimetre-sized animals (Daphnia magna, Folsomia candida) studied by optical methods. J. Comp. Physiol. B Biochem. Syst. Environ. Physiol. 167, 399–408. doi: 10.1007/s003600050089
Paul, R. J., Colmorgen, M., Pirow, R., Chen, Y. H., and Tsai, M. C. (1998). Systemic and metabolic responses in Daphnia magna to anoxia. Comp. Biochem. Physiol. A 120, 519–530. doi: 10.1016/s1095-6433(98)10062-4
Pirow, R., Bäumer, C., and Paul, R. J. (2001). Benefits of haemoglobin in the cladoceran crustacean Daphnia magna. J. Exper. Biol. 204, 3425–3441. doi: 10.1242/jeb.204.20.3425
Prepas, E., and Rigler, F. I. (1978). The enigma of Daphnia death rates. Limnol. Oceanogr. 23, 970–988. doi: 10.4319/lo.1978.23.5.0970
Robin, E. D., Murphy, B. J., and Theodore, J. (1984). Coordinate regulation of glycolysis by hypoxia in mammalian cells. J. Cell. Physiol. 118, 287–290. doi: 10.1002/jcp.1041180311
Salonen, K., and Lehtovaara, A. (1992). Migrations of haemoglobin-rich Daphnia longispina in a small, steeply stratified, humic lake with an anoxic hypolimnion. Hydrobiologia 229, 271–288. doi: 10.1007/bf00007005
Scott, G. R., Hawkes, L. A., Frappell, P. B., Butler, P. J., Bishop, C. M., and Milsom, W. K. (2015). How bar-headed geese fly over the Himalayas. Physiology 30, 107–115. doi: 10.1152/physiol.00050.2014
Semenza, G. L. (2012). Hypoxia-inducible factors in physiology and medicine. Cell 148, 399–408. doi: 10.1016/j.cell.2012.01.021
Semenza, G. L., Roth, P. H., Fang, H. M., and Wang, G. L. (1994). Transcriptional regulation of genes encoding glycolytic enzymes by hypoxia-inducible factor 1. J. Biol. Chem. 269, 23757–23763. doi: 10.1016/s0021-9258(17)31580-6
Stoks, R., Govaert, L., Pauwels, K., Jansen, B., and De Meester, L. (2016). Resurrecting complexity: the interplay of plasticity and rapid evolution in the multiple trait response to strong changes in predation pressure in the water flea Daphnia magna. Ecol. Lett. 19, 180–190. doi: 10.1111/ele.12551
Tams, V., Nickel, J. H., Ehrinh, A., and Cordellier, M. (2020). Insights into the genetic basis of predator-induced response in Daphnia galeata. Ecol. Evol. 10, 13095–13108. doi: 10.1002/ece3.6899
Tessier, A. J., and Leibold, M. A. (1997). Habitat use and ecological specialization within lake Daphnia populations. Oecologia 109, 561–570. doi: 10.1007/s004420050117
Ullrich, S. O. Jr., and Millemann, R. E. (1983). Survival, respiration, and food assimilation of Daphnia magna exposed to petroleum- and coal-derived oils at three temperatures. Can. J. Fish. Aquat. Sci. 40, 17–26. doi: 10.1139/f83-004
Usuki, I., and Yamaguchi, K. (1979). Physiological significance of the extracellular haemoglobin on the survival and lactic acid production of Daphnia magna Straus in low oxygen conditions. Sci. Rep. Niigata Univ. Ser. D 16, 5–12.
Verne, J. (1923). Les pigments rouges et la formation de l’hémoglobine chez les Daphnies. Bull. Soc. Zool. France 48, 140–144.
Vijverberg, J., Kalf, D. F., and Boersma, M. (1996). Decrease in Daphnia egg viability at elevated pH. Limnol. Oceanogr. 41, 789–794. doi: 10.4319/lo.1996.41.4.0789
Villarroel, M. J., Sancho, E., Andreu-Moliner, E., and Ferrando, M. D. (2013). Caloric content of Daphnia magna as reflect of propanil stress during a short-term exposure and its relationship to long-term responses. Environ. Toxicol. Pharmacol. 35, 465–472. doi: 10.1016/j.etap.2013.02.012
Webster, K. A. (1987). Regulation of glycolytic enzyme RNA transcriptional rates by oxygen availability in skeletal muscle cells. Mol. Cell. Biochem. 77, 19–28. doi: 10.1007/BF00230147
Webster, K. A. (2003). Evolution of the coordinate regulation of glycolytic enzyme genes by hypoxia. J. Exper. Biol. 206, 2911–2922. doi: 10.1242/jeb.00516
Webster, K. A., Gunning, P., Hardeman, E., Wallace, D. C., and Kedes, L. (1990). Coordinate reciprocal trends in glycolytic and mitochondrial transcript accumulations during the in vitro differentiation of human myoblasts. J. Cell. Physiol. 142, 566–573. doi: 10.1002/jcp.1041420316
Yampolsky, L. Y., Schaer, T. M. M., and Ebert, D. (2014). Adaptive phenotypic plasticity and local adaptation for temperature tolerance in freshwater zooplankton. Proc. R. Soc. B Biol. Sci. U S A. 281, 1–9. doi: 10.1098/rspb.2013.2744
Zeis, B., Becher, B., Lamkemeyer, T., Rolf, S., Pirow, R., and Paul, R. J. (2003). The process of hypoxic induction of Daphnia magna hemoglobin: subunit composition and functional properties. Comp. Biochem. Physiol Part B 134, 243–252. doi: 10.1016/s1096-4959(02)00253-1
Zeis, B., Lamkemeyer, T., and Paul, R. J. (2004). Molecular adaptation of Daphnia magna hemoglobin. Micron 35, 47–49. doi: 10.1016/j.micron.2003.10.015
Zeis, B., Lamkemeyer, T., Paul, R. J., Nunes, F., Schwerin, S., Koch, M., et al. (2009). Acclimatory responses of the Daphnia pulex proteome to environmental changes. I. Chronic exposure to hypoxia affects the oxygen transport system and carbohydrate metabolism. BMC Physiol. 9:7. doi: 10.1186/1472-6793-9-7
Keywords: anaerobic metabolism, transcriptome, gene-by-environment, microevolution, phenotypic plasticity, hemoglobin, lactate dehydogenase
Citation: Lee TM, Westbury KM, Martyniuk CJ, Nelson WA and Moyes CD (2022) Metabolic Phenotype of Daphnia Under Hypoxia: Macroevolution, Microevolution, and Phenotypic Plasticity. Front. Ecol. Evol. 10:822935. doi: 10.3389/fevo.2022.822935
Received: 26 November 2021; Accepted: 04 January 2022;
Published: 04 February 2022.
Edited by:
Rui Rosa, University of Lisbon, PortugalReviewed by:
Bettina Zeis, WWU Muenster, GermanyVera Maria Fonseca Almeida-Val, National Institute of Amazonian Research (INPA), Brazil
Copyright © 2022 Lee, Westbury, Martyniuk, Nelson and Moyes. This is an open-access article distributed under the terms of the Creative Commons Attribution License (CC BY). The use, distribution or reproduction in other forums is permitted, provided the original author(s) and the copyright owner(s) are credited and that the original publication in this journal is cited, in accordance with accepted academic practice. No use, distribution or reproduction is permitted which does not comply with these terms.
*Correspondence: Tingyat M. Lee, tingyat.lee@queensu.ca
†These authors have contributed equally to this work and share first authorship