Continuous Variation in an Aposematic Pattern Affects Background Contrast, but Is Not Associated With Differences in Microhabitat Use
 Justin Yeager
 James B. Barnett
- 1Grupo de Biodiversidad Medio Ambiente y Salud, Universidad de Las Américas, Quito, Ecuador
- 2Department of Psychology, Neuroscience & Behaviour, McMaster University, Hamilton, ON, Canada
Variation in aposematic signals was once predicted to be rare, yet in recent years it has become increasingly well documented. Despite increases in the frequency with which polytypism and polymorphism have been suggested to occur, population-wide variance is rarely quantified. We comprehensively sampled a subpopulation of the poison frog Oophaga sylvatica, a species which is polytypic across its distribution and also shows considerable within-population polymorphism. On one hand, color pattern polymorphism could be the result of multifarious selection acting to balance different signaling functions and leading to the evolution of discrete sub-morphs which occupy different fitness peaks. Alternatively, variance could simply be due to relaxed selection, where variation would be predicted to be continuous. We used visual modeling of conspecific and heterospecific observers to quantify the extent of within population phenotypic variation and assess whether this variation produced distinct signals. We found that, despite considerable color pattern variation, variance could not be partitioned into distinct groups, but rather all viewers would be likely to perceive variation as continuous. Similarly, we found no evidence that frog color pattern contrast was either enhanced or diminished in the frogs’ chosen microhabitats compared to alternative patches in which conspecifics were observed. Within population phenotypic variance therefore does not seem to be indicative of strong selection toward multiple signaling strategies, but rather pattern divergence has likely arisen due to weak purifying selection, or neutral processes, on a signal that is highly salient to both conspecifics and predators.
Introduction
Aposematic (warning) signals evolve to convey important information related to prey defenses to potential predators (Stevens and Ruxton, 2012; Caro and Ruxton, 2019). Predators evolve, or learn, to associate certain prey characteristics with chemical or physical defenses and subsequently avoid prey bearing these signals (Stevens and Ruxton, 2012; Caro and Ruxton, 2019). By the simplest functional interpretation of aposematism, warning signals should be readily recognizable, reliable, and memorable to facilitate rapid associative learning (Mappes et al., 2005; Stevens and Ruxton, 2012). Positive frequency dependent selection is, therefore, expected to drive further homogenization of signal characteristics with common local phenotypes being avoided more consistently than rare phenotypes (Mappes et al., 2005; Chouteau and Angers, 2011; Chouteau et al., 2016).
In nature, however, aposematic signals can vary considerably between individuals of a single species, both within and between populations (Briolat et al., 2019). Considerable attention has been paid to how warning coloration evolves and functions (Caro and Ruxton, 2019), yet basic questions related to polymorphism and polytypism remain. Does variation serve an adaptive function such as local specialization to distinct environmental conditions, or is it merely permitted due to a relaxation in selection where neutral processes can lead to signal divergence? Once variation has arisen in allopatry, it may then be reinforced through mechanisms related to local predation pressure, assortative mating or intraspecific agonistic interactions, or a combination of several factors, which can further drive divergence between genetically and physically isolated populations (Gray and McKinnon, 2007; Briolat et al., 2019). Variation can, however, also arise in sympatric populations without physical barriers to gene flow (Rojas, 2017; Briolat et al., 2019). The mechanisms underlying the evolution and persistence of this variance are, however, less well understood, and in many cases it is still unclear whether such variation has evolved for an adaptive function.
The characteristics of animal color patterns are shaped by the simultaneous influence of multiple selection pressures, leading to potential trade-offs rather than the optimization of single functions (Endler and Mappes, 2004; Stevens, 2007; Stevens and Ruxton, 2012; Briolat et al., 2019). For example, individual components of aposematic signals can be locally adapted for saliency when viewed against particular microhabitats, serve to incorporate additional defensive signals, or contain traits used in sexual selection. Based on its primary function, each element could theoretically have its own distinct optimal form which influences fitness under specific sources of selection. Polymorphism can evolve due to adaptive benefits, whereby different forms arise as a by-product of unique adaptive processes (Briolat et al., 2019). Alternatively, instead of being fostered by selection, polymorphism may simply be permitted where purifying selection is weak, or optimal signal efficacy is difficult to achieve, leading to variation arising via neutral processes (Briolat et al., 2019). With such distinct plausible mechanisms at play, it is perhaps not unsurprising we have a weak overall understanding of why intra-population variance in aposematic signals exists.
Some of the most salient examples of phenotypic variation are found in the Neotropical poison frogs (Dendrobatidae), which exhibit notable examples of both discrete and continuous variation in color and pattern, found both in sympatry (polymorphism) and allopatry (polytypism) (Summers et al., 2003; Maan and Cummings, 2012; Rojas, 2017). Color patterns have evolved both for defensive and communicative functions, and in many cases under the influence of multiple selection pressures (Summers et al., 1999; Saporito et al., 2007; Maan and Cummings, 2008, 2009, 2012; Wollenberg et al., 2008; Tazzyman and Iwasa, 2010; Crothers et al., 2011; Cummings and Crothers, 2013; Rudh, 2013; Crothers and Cummings, 2015; Dreher et al., 2015). Consequently, signals with multiple components or functions have arisen due to context specific interactions between sources of selection and/or neutral processes (Wollenberg et al., 2008; Tazzyman and Iwasa, 2010; Crothers et al., 2011; Crothers and Cummings, 2013, 2015; Cummings and Crothers, 2013; Barnett et al., 2018). For example, aposematic signals have been co-opted and exaggerated by intraspecific communication (Maan and Cummings, 2008, 2009), can blend together when viewed from a distance to act as camouflage (Barnett et al., 2018), and can disrupt an observer’s ability to track escape movements (Hämäläinen et al., 2015).
In poison frogs, discrete color forms have evolved in geographically isolated populations as founder effects and honest signaling of local resource availability have been reinforced through sexual imprinting, selective mate choice, and predator learning (Summers et al., 1999, 2003; Darst et al., 2006; Reynolds and Fitzpatrick, 2007; Maan and Cummings, 2008, 2009, 2012; Wang and Shaffer, 2008; Tazzyman and Iwasa, 2010; Crothers et al., 2011; Richards-Zawacki and Cummings, 2011; Crothers and Cummings, 2013; Hegna et al., 2013; Yang et al., 2019). For example, in Oophaga pumilio, where dietary derived toxicity is low, selection for camouflage has outweighed selection for conspicuous signaling, and more cryptic colors and behaviors have evolved (Maan and Cummings, 2012; Rudh et al., 2012; Rudh, 2013). Within color morphs of O. pumilio, continuous variation in color saturation and brightness have been associated with intraspecific communication, with brighter individuals more likely to win physical contests and attract mates (Crothers et al., 2011; Crothers and Cummings, 2013, 2015; Dreher et al., 2017). Moreover, in O. pumilio certain phenotypes and behaviors are correlated with microhabitats which enhance signal efficacy (Pröhl and Ostrowski, 2011; Willink et al., 2014), although they do not appear to be behaviorally manipulating saliency on fine scales (Dugas et al., 2020). In another polymorphic and polytypic poison frog species, Dendrobates tinctorius, sympatric color variation can also correlate with specialization in specific microhabitats, or behavioral syndromes that optimize signal saliency within their chosen microhabitats (Rojas et al., 2014a,b; Rojas, 2017).
The poison frog Oophaga sylvatica shows polytypic variation across its range as well as remarkable within-populational polymorphism (Roland et al., 2017). Limited insights into color pattern evolution can be gleaned from population-level genetic assessments, which indicate well-defined clades broadly split between north and south, but also reveal large geographic regions with high levels of genetic admixture, including within polymorphic populations (Roland et al., 2017). Polymorphic populations are proposed to either be the result of admixture between phenotypically distinct adjacent populations in secondary contact, or due to a range extension from a polymorphic population into adjacent populations (Roland et al., 2017). Either scenario suggests that color patterns may not be under strong selection within the northern clade populations, and/or that coloration does not play a significant role in the geographic structure of phenotypically divergent O. sylvatica populations across at least substantial portions of its distribution.
We explored the role of phenotypic variation in a highly variable population of O. sylvatica found in northwestern Ecuador. These frogs display high contrast dorsal patterns that are highly distinct from their leaf litter substrates (Yeager and Barnett, 2020). However, as early as in the formal description of O. sylvatica it has been noted that human observers could easily confuse frogs from a similar red/black morph with the forest floor (Funkhouser, 1956), suggesting a potential balance between camouflage and conspicuous signaling.
We used computational visual models, representing the vision of diverse predator classes and conspecifics, to study the perception of phenotypic variation by sources of natural and sexual selection. We first addressed whether frog variation was continuous, or if it could be grouped into visually distinct clusters, and then quantified which components of the phenotype (chromatic (hue), achromatic (brightness), or pattern contrast) best defined phenotypic variation. Next, we investigated whether variance between the aposematic signals of individual frogs correlated with the microhabitats in which they were found to either maximize or minimize visual contrast. We expected that regardless of whether variation is continuous or discrete, if it has evolved to facilitate distinct behavioral, defensive, or reproductive strategies then it should be associated with differences in saliency based on microhabitat use (Rojas et al., 2014a,b; Rojas, 2017; Briolat et al., 2019; Barnett et al., 2021a). Conversely, variation may be permitted under relaxed selection, and attributable to non-adaptive processes such as drift. In such instances we would expect variation to be continuous and not associated with signaling differences within their occupied microhabitats. Deciphering how this variation arises and is maintained within a single population has important implications for our understanding of how predators generalize behaviors across variable aposematic signals, how multiple selection pressures interact, how the evolution of discrete polymorphism may arise from a monomorphic ancestor, and the evolutionary implications of polymorphism (Gray and McKinnon, 2007; Briolat et al., 2019).
Materials and Methods
Data Collection
In March 2020, we photographed 35 Oophaga sylvatica (Perla morph) at the private forest reserve “Bosque Protector la Perla” near La Concordia, Ecuador. This represented a comprehensive survey of every individual observed in the area by a team of five experienced observers, over 2 days. The Perla morph is approximately 26 mm in length and is predominantly black with a red pattern that varies from small spots to larger irregular blotches, and to whole patches of homogenous color (Figure 1). Previous work suggests that the frogs’ colors have very high internal and external contrast, and that UV reflectance is minimal both from the frogs and their natural leaf litter background (Yeager and Barnett, 2020). Frogs were spotted using exhaustive visual surveys. We cannot ensure that frog orientation was not altered due to the presence of the observers, however, the background is isotropic, and we used the location where the frog was first spotted as the microhabitat context in which potential predators would process frogs’ visual signals.
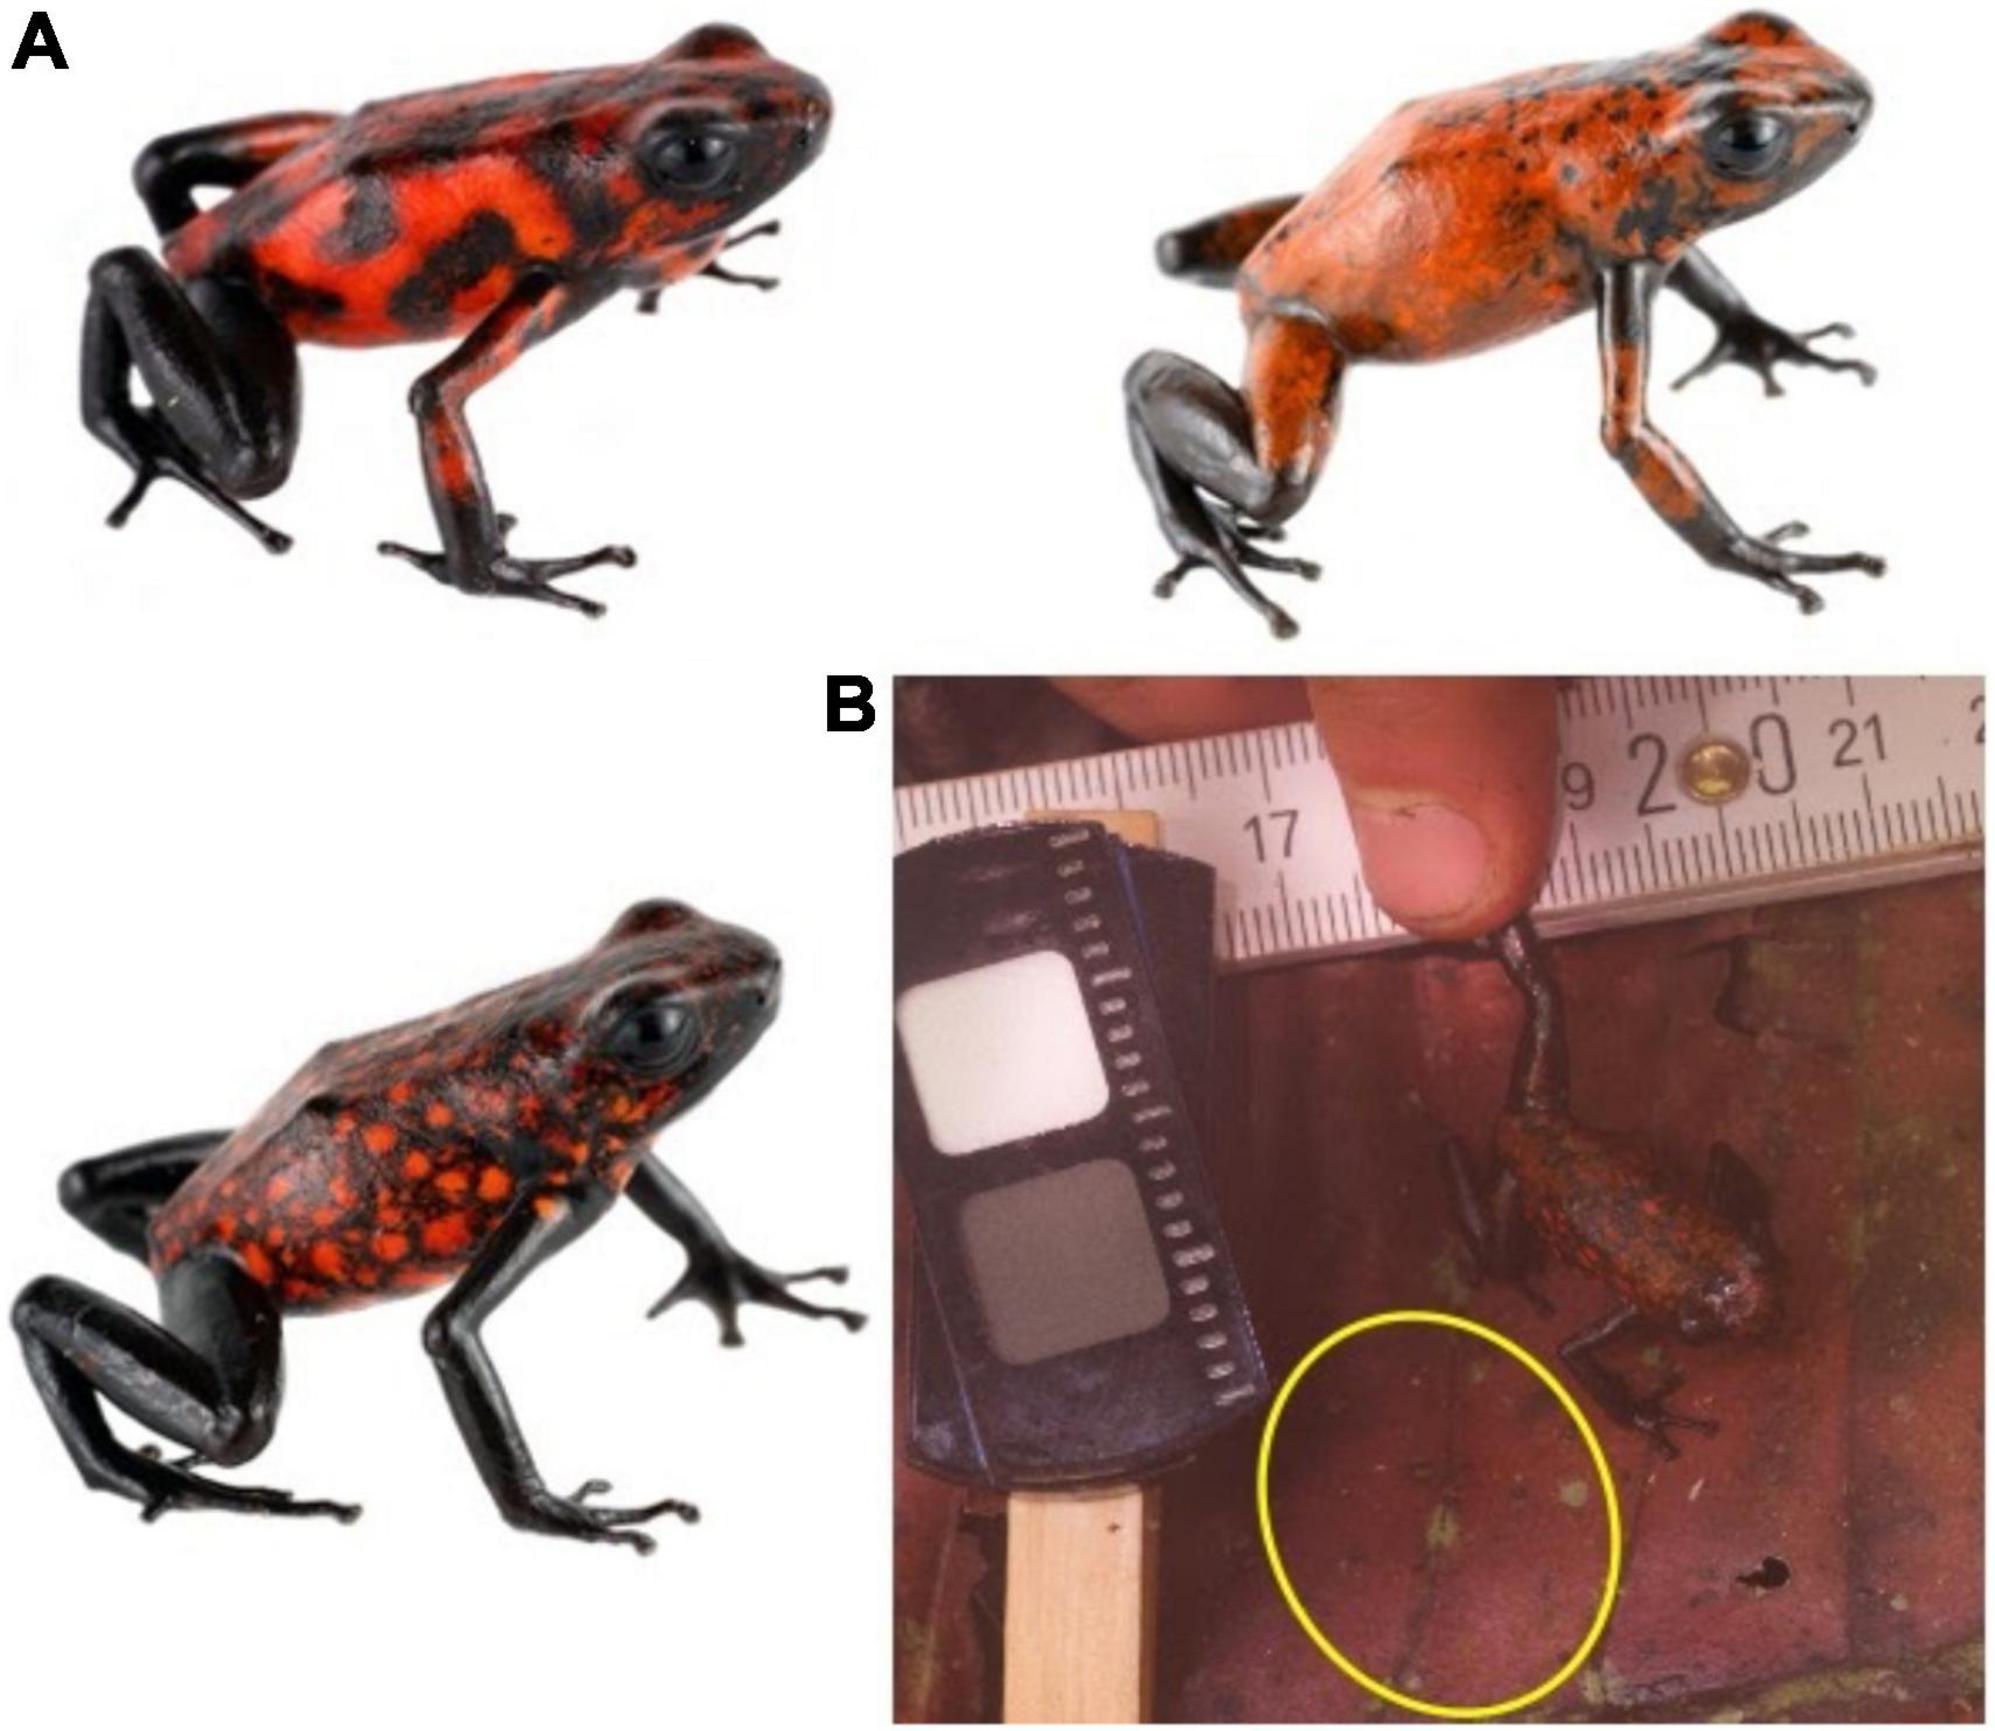
Figure 1. Study system. (A) Populations of O. sylvatica in northern Ecuador are characterized by red and black color patterns. Significant variation can be found within a single population, including the population sampled here. (B) Standardized photographs were taken where subsequent analyses featured chromatic, achromatic, and pattern contrasts between the entire frogs’ dorsum when compared against patches of the microhabitat (yellow circle) and random patches of habitat. Frog photos (A) courtesy of J. Culebras (Photo Wildlife Tours).
We photographed each frog within the microhabitat where it was first observed (Figure 1B), following methods detailed in Yeager and Barnett (2020, 2021). In brief, each image was taken using a quartz converted UV sensitive Canon EOS 7D camera combined with a metal body NIKKOR EL 80 mm lens. As UV reflectance is negligible in this population (n = 4 tested in Yeager and Barnett, 2020) we did not include UV wavelengths and only utilized images in the human visible range (400 – 700 nm). The camera was mounted on a tripod and the lens was fitted with a Baader UV-IR blocking filter that allowed transmission from 420 to 680 nm. All photographs were taken under natural ambient lighting, each image included a 10% and a 77% neutral reflectance standard, and we saved all photographs in RAW format.
Image Processing and Visual Modeling
We used the MICA toolbox (Troscianko and Stevens, 2015) to standardize and scale the images in ImageJ v1.52k (Schneider et al., 2012). From each image, we selected regions of interest (ROIs) from within the red and black patches of the frog, around the frog’s whole body, and around a patch of adjacent substrate of a size equal to, or slightly greater than, that of the frog (Figure 1). We then assessed color and pattern using three well characterized computational models of visual perception representing important sources of natural selection (predatory birds and snakes) and sexual selection (conspecific frogs).
For our model of bird vision, we used the tetrachromatic visual system of the Eurasian blue tit (Cyanistes caeruleus, Paridae). The blue tit has four single cones (λmax: UV = 372 nm, SWS = 413 nm, MWS = 508 nm, and LWS = 573 nm) that populate the retina with a ratio of 1:2:2:3, and one double cone (λmax: D = 565 nm) (Hart et al., 2000; Hart, 2001). As UV was negligible, we excluded these wavelength (<400 nm) to produce a tetrachromatic VIS-sensitive model which covered 400–700 nm (Yeager and Barnett, 2020, 2021). The snake model used the trichromatic vision of the coachwhip (Masticophis flagellum, Colubridae) and included three single cones (λmax: UV = 362 nm, MWS = 458 nm, and LWS = 561 nm) with a ratio of 17:2:1 (Macedonia et al., 2009; Maan and Cummings, 2012). To represent the frogs’ own visual system, we used the trichromatic vision of the closely related O. pumilio (Dendrobatidae). The O. pumilio visual model included three single cones (λmax: SWS = 466 nm, MWS = 489 nm, and LWS = 561 nm) with a cone ratio of 4:3:1 (Siddiqi et al., 2004; Maan and Cummings, 2012).
We calculated chromatic (ΔS) and achromatic (ΔL) contrast between the red and black regions of each frog (internal contrast), and between the mean of the whole frog and the mean of each background (external contrast), using the log-linear receptor noise limited model implemented through the MICA toolbox (Vorobyev et al., 1998; Vorobyev and Osorio, 1998; Troscianko and Stevens, 2015). Chromatic contrast was calculated using the responses of the single cones and we calculated achromatic contrast from the response of the D cone in the bird model and from the LWS cones in the snake and frog models. As specific predator species which could influence frog coloration are not known for O. sylvatica, and to keep our results comparable to our previous studies (Yeager and Barnett, 2020, 2021; Barnett et al., 2021b) all Weber fractions were set at 0.05. The model computes visual discrimination in a manner equivalent to “just noticeable differences” (JNDs) where higher values indicate greater ease of color discrimination. A score of 1 is the absolute discrimination threshold defined by intrinsic noise within the photoreceptor and a score of 3 is a realistic discrimination threshold under natural lighting conditions (Vorobyev and Osorio, 1998).
Pattern energy was calculated over each of the whole frog ROIs and each of the background ROIs using Fast Fourier bandpass filtering (granularity analysis) from the achromatic channel of each visual model in the MICA toolbox. We measured pattern energy as the standard deviation of the pixel values for five filter bands that doubled in spatial frequency at each step from 16 px (0.5 mm) to 256 px (8.0 mm). To compare pattern energy distributions between the frogs and their backgrounds we calculated the area between pattern energy curves using a piecewise linear function (function approxfun) from base R v4.0.5 (R Core Team, 2021). Hereafter, the area between frog and background pattern energy curves is referred to as “pattern contrast,” higher values indicate that the frog’s pattern was more distinct from the background.
Quantifying Intra-Populational Variation
To examine whether frog color pattern variation was continuous or divided into visually distinct sub-morphs we used k-means clustering and factor analysis in R v4.0.5 (Barnett et al., 2021a; R Core Team, 2021). For each of the frogs, we used the internal chromatic (ΔS) and achromatic (ΔL) contrast as well as the pattern energy at each of the five spatial scales (0.5, 1.0, 2.0, 4.0, and 8.0 mm). In the k-means clustering, we used the gap statistic (function clusGap) from R package cluster (Maechler et al., 2021), to estimate the optimal number of clusters (Tibshirani et al., 2001). We set the maximum number of clusters to 10 and ran 5000 Monte Carlo bootstrap samples to compute our reference distribution. We then interpreted the smallest local maximum in gap score as the optimal number of clusters (Tibshirani et al., 2001; Maechler et al., 2021). Next, we used factor analysis with two factors and varimax rotation (function factanal) from base R v4.0.5 (R Core Team, 2021) to investigate which parameters of the color pattern contributed the most to intra-populational variation (Barnett et al., 2021a). We repeated these analyses separately for the bird, snake, and frog visual models. Two frogs were removed from the snake analysis due to image calibration issues.
Background Contrast
We next asked whether frog variation affected contrast against the background. As the majority of the frogs’ variation was found in the distribution of pattern (see Factor 1 in Results: Intra-populational variation), and as the red and black are highly distinct from the background (Yeager and Barnett, 2020; Figure 2 and Supplementary Figures 1–3), we focused on how pattern variation affects background pattern matching and distance-dependent color blending by comparing the whole frog ROIs to their local backgrounds. We compared the mean hue, mean luminance, and pattern energy distribution of each frog to that of the microhabitat where it was first encountered (external chromatic, achromatic, and pattern contrast), and then ran a series of linear models comparing each form of external contrast to Factor 1 from our factor analysis (function lm) using base R v4.0.5 (R Core Team, 2021). The suitable approximation of model assumptions was checked by plotting the distribution of the model residuals, and the significance of the dependent variables was estimated against a null model by the F statistic. A significant relationship would suggest that frog variation is associated with differences in background matching, whereas a non-significant relationship would suggest that any differences in external contrast were affected by background heterogeneity, independent from frog variation.
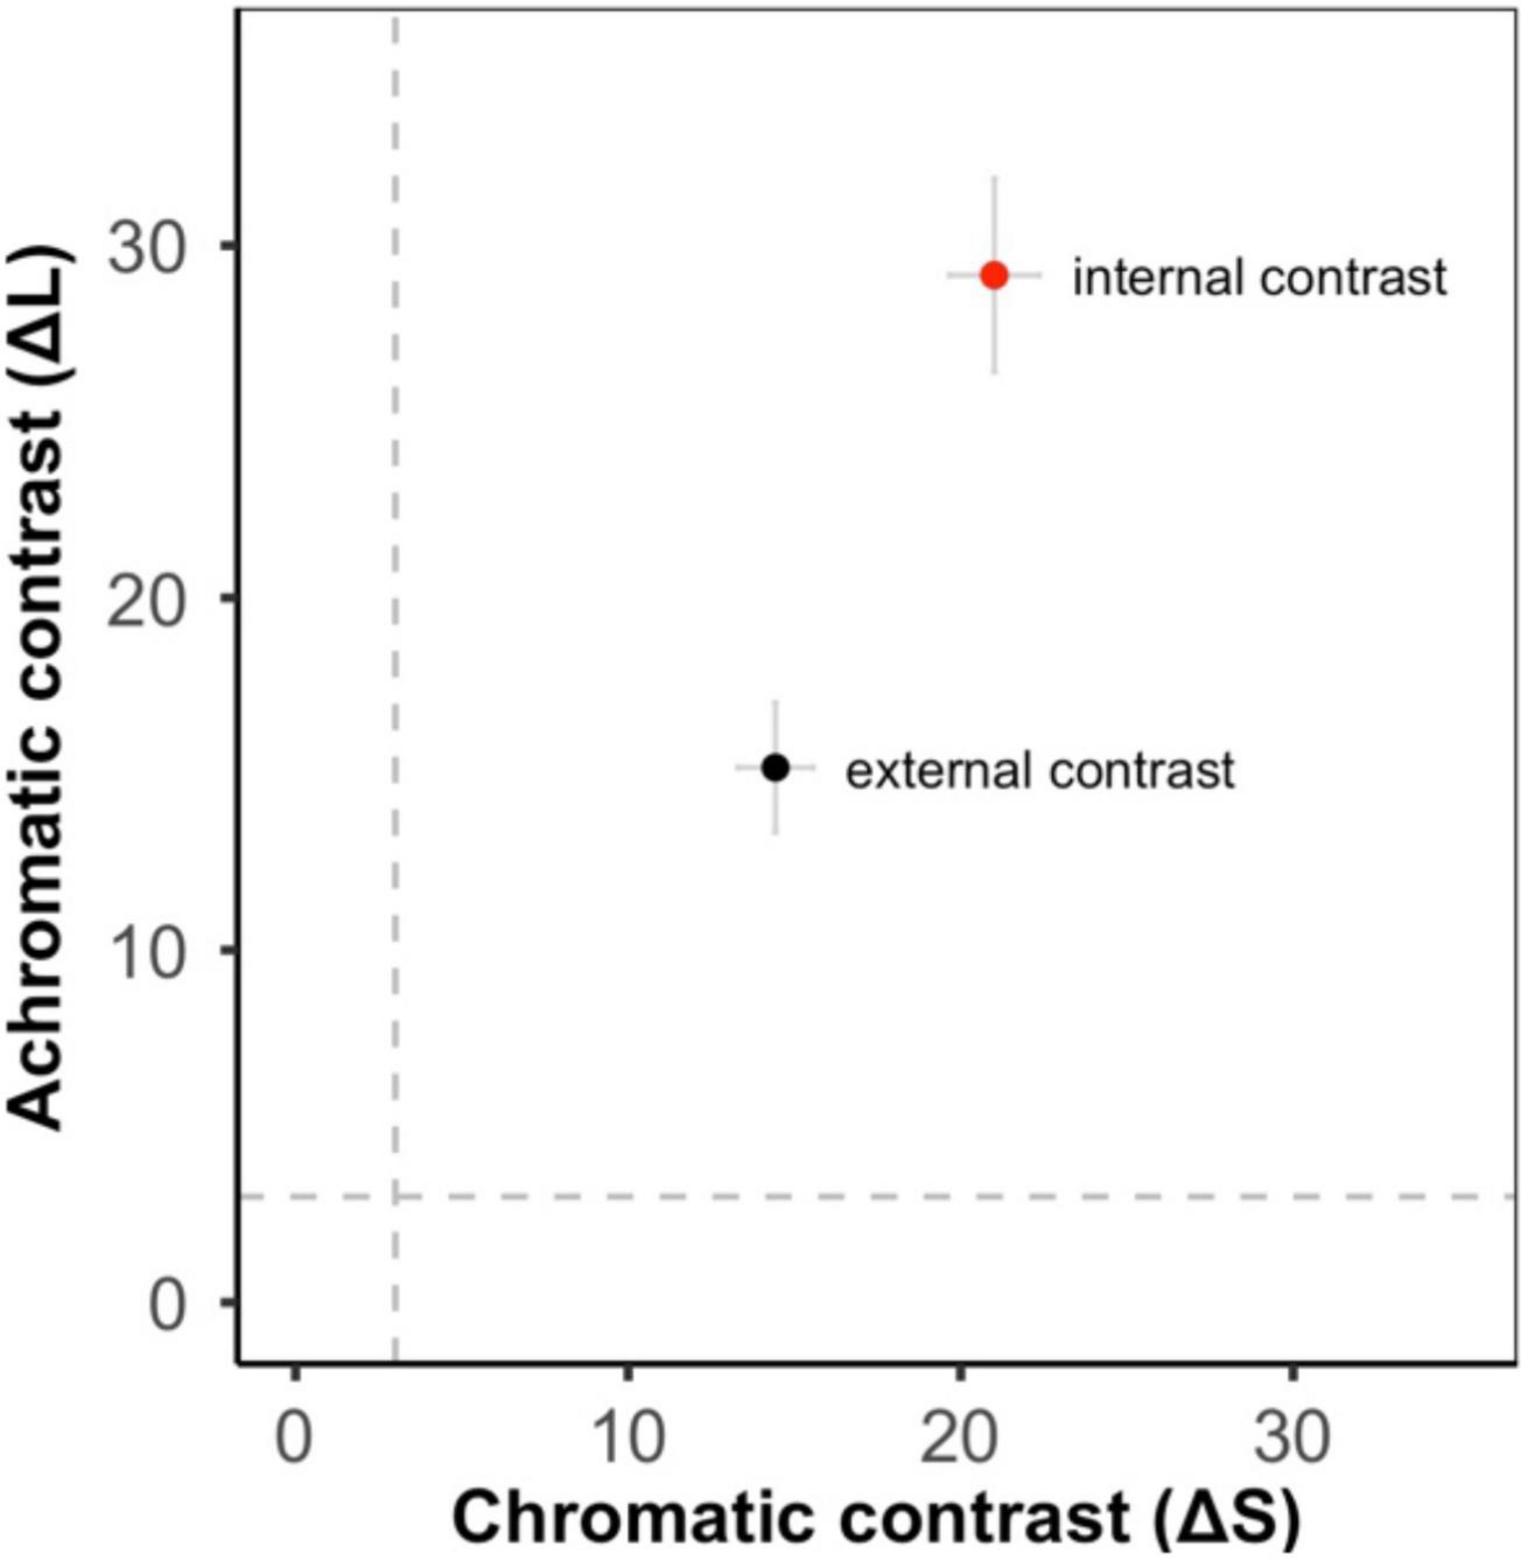
Figure 2. Color contrast from the bird visual model (means ± SE, gray dashed lines show the discrimination threshold equivalent to 3 JND). There was high achromatic and chromatic contrast both between the red and black regions of the frogs (internal contrast – red circle) and between the whole frog and its local substrate (external contrast – black circle).
Background Choice
To test whether frogs were associated with microhabitats that either minimized or maximized the contrast of their own color and pattern characteristics we compared mean achromatic, mean chromatic, and pattern contrast between each frogs’ local microhabitat and the alternate microhabitats where the other 34 individuals were observed. We calculated the median contrast of the 34 alternate backgrounds for each frog and compared local contrast to alternate contrast using a series of paired-sample Wilcoxon tests in base R v4.0.5 (R Core Team, 2021). For each visual model, we ran separate tests for achromatic, chromatic, and pattern contrast. A significant result would suggest that frogs are associated with specific microhabitats.
Results
Intra-Populational Variation
Color patterns were overall found to be highly contrasting, both in terms of within-frog contrast (e.g., red versus black patches) and between the frogs and their microhabitats (Figure 2 and Supplementary Figures 1–3). In the k-means clustering, we found that for each visual model (bird, snake, and frog) the optimal number of clusters was one, suggesting that frog variation was continuous and not divided into discrete sub-morphs (Figure 3 and Supplementary Figures 4, 5). Factor analysis revealed that for each visual model two factors were sufficient to explain >75% of frog variance (Table 1). Factor 1, which explained >55% of variance for each model, weighted heavily toward pattern across all size classes. Factor 2, which explained <32% of the variance in each model was more variable. In the bird and snake models Factor 2 (bird = 20.2% variance, snake = 31.5% variance) mostly corresponded to internal chromatic and achromatic contrast, whereas in the frog model Factor 2 (19.6% variance) predominantly corresponded to low spatial frequency patterning.
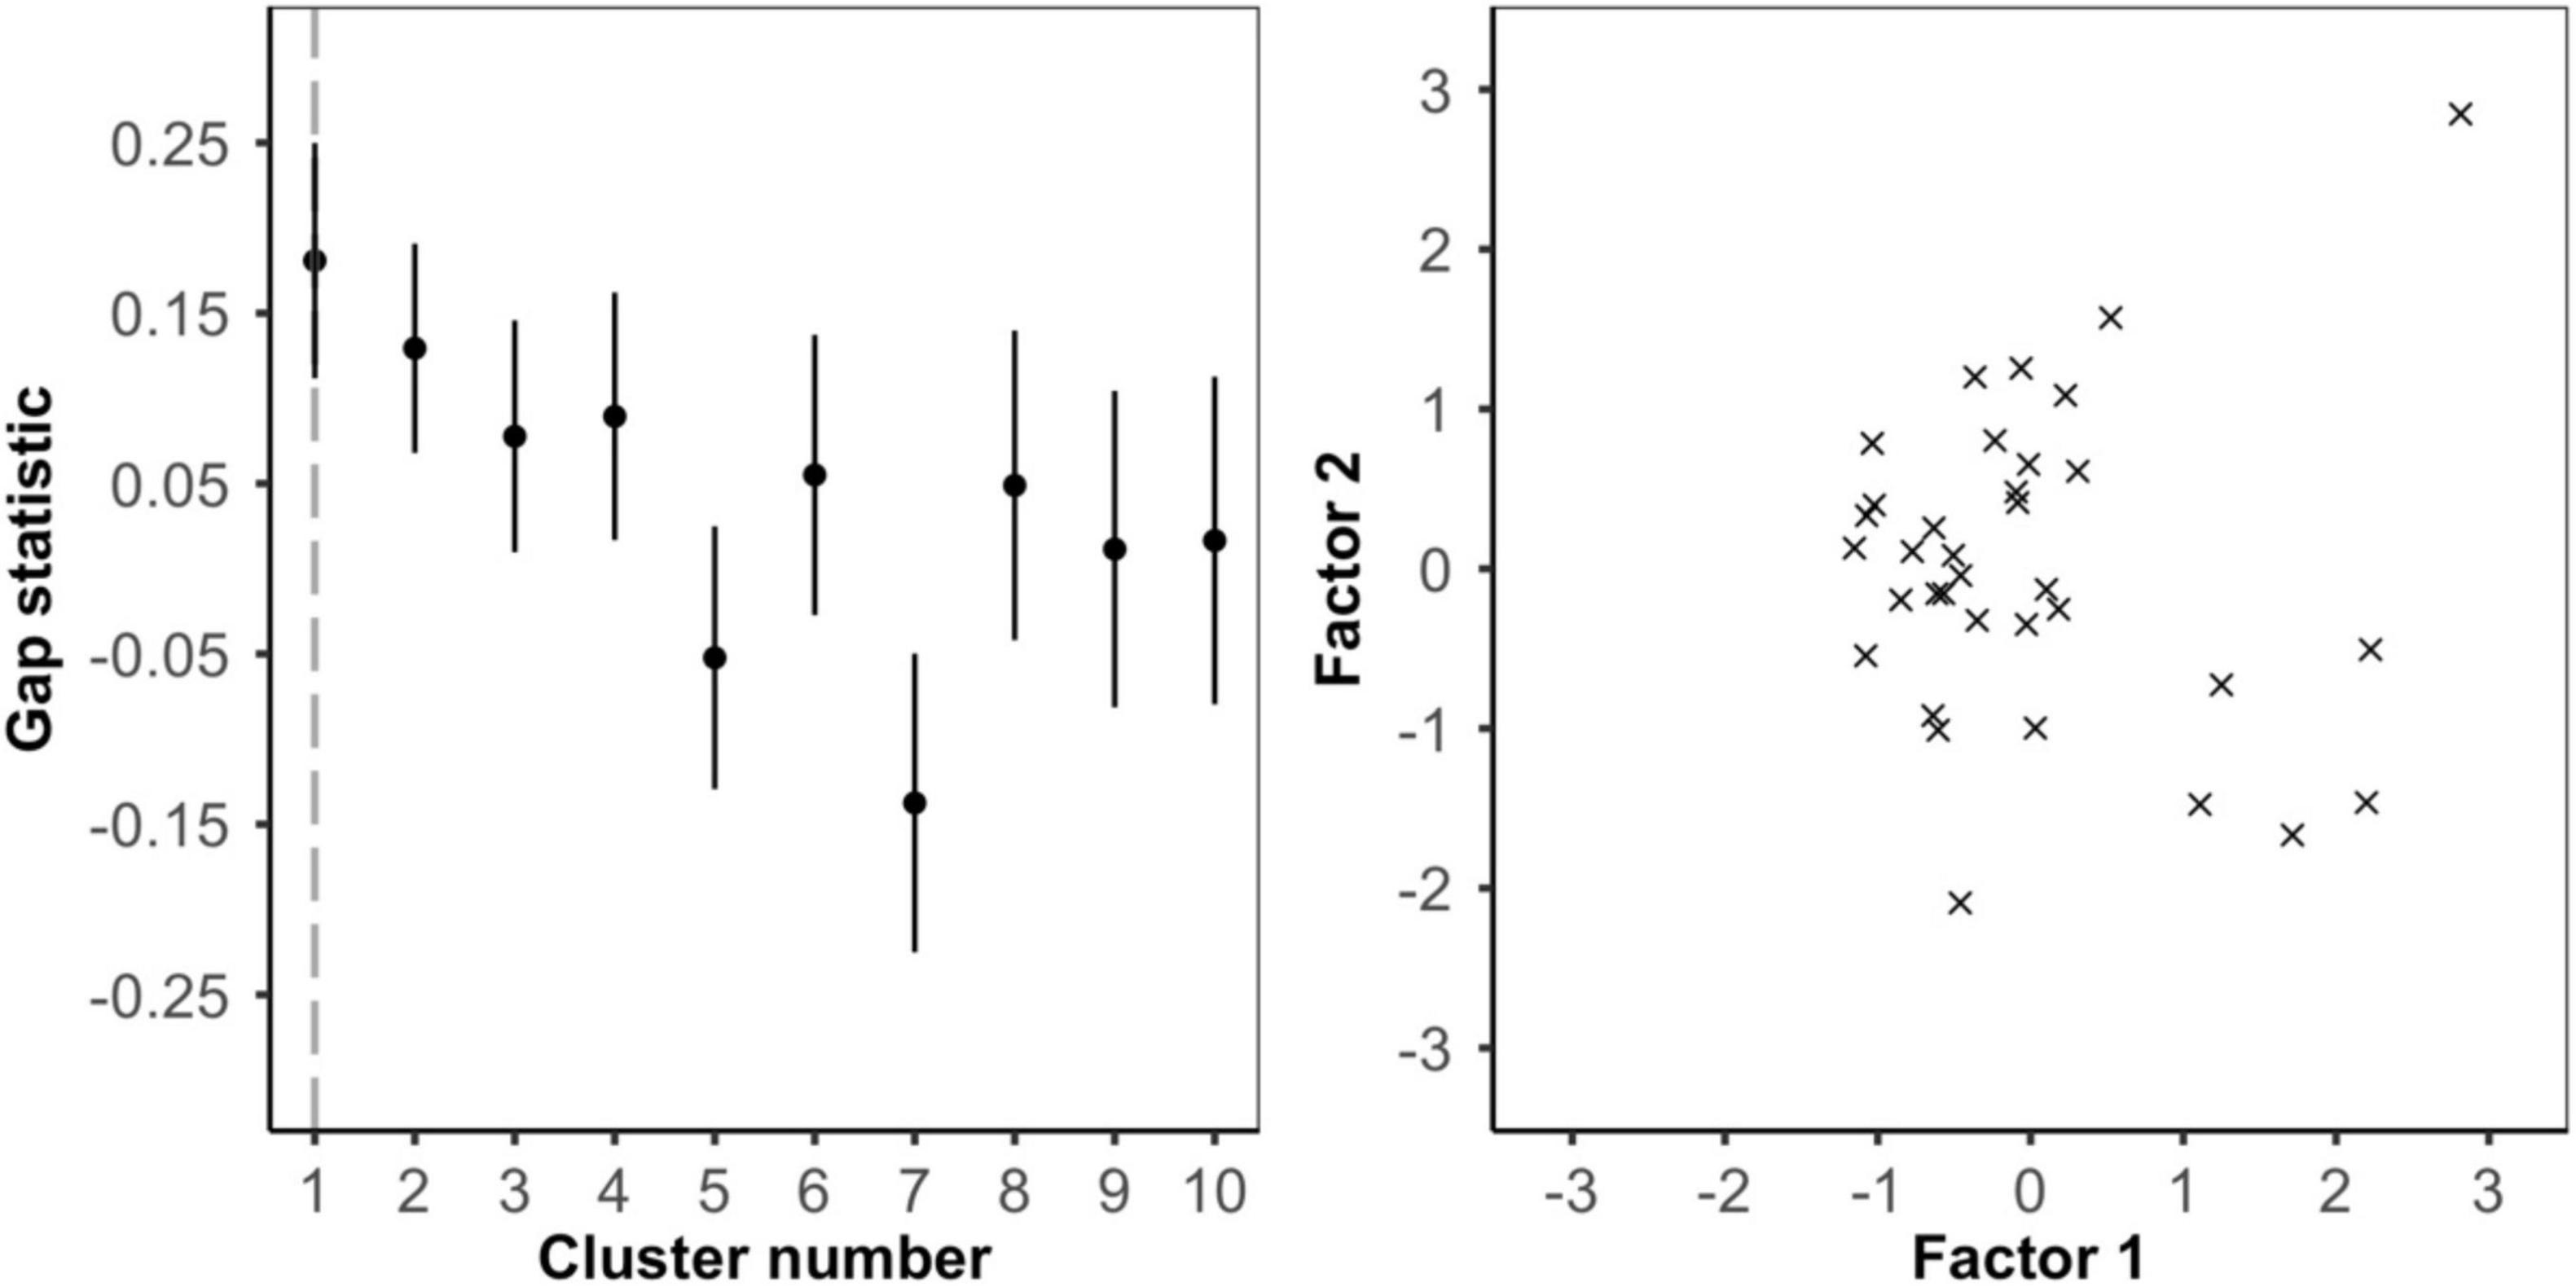
Figure 3. Analysis of intrapopulation variance using the bird visual model. (left) k-means clustering. Gap statistics for clusters 1 to 10 show that one cluster is optimal and frog color pattern variance is continuous. (right) Factor analysis. Plotting frogs along factor 1 (∼pattern) and factor 2 (∼internal color contrast) shows no clear or distinct clusters.
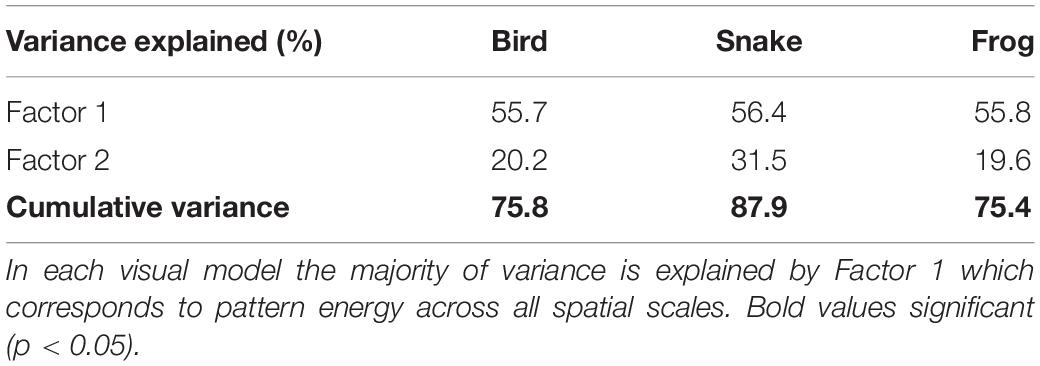
Table 1. Percent variance explained by factor analysis for each visual model.
Background Contrast
When using the bird and snake visual models, we found that there was no significant relationship between Factor 1 (∼pattern) and either external achromatic or chromatic contrast. However, there was a significant positive relationship between Factor 1 and external pattern contrast, where frogs with higher Factor 1 scores were more distinct from their local backgrounds (Figure 4; Table 2; Supplementary Figures 6, 7; Supplementary Table 1).
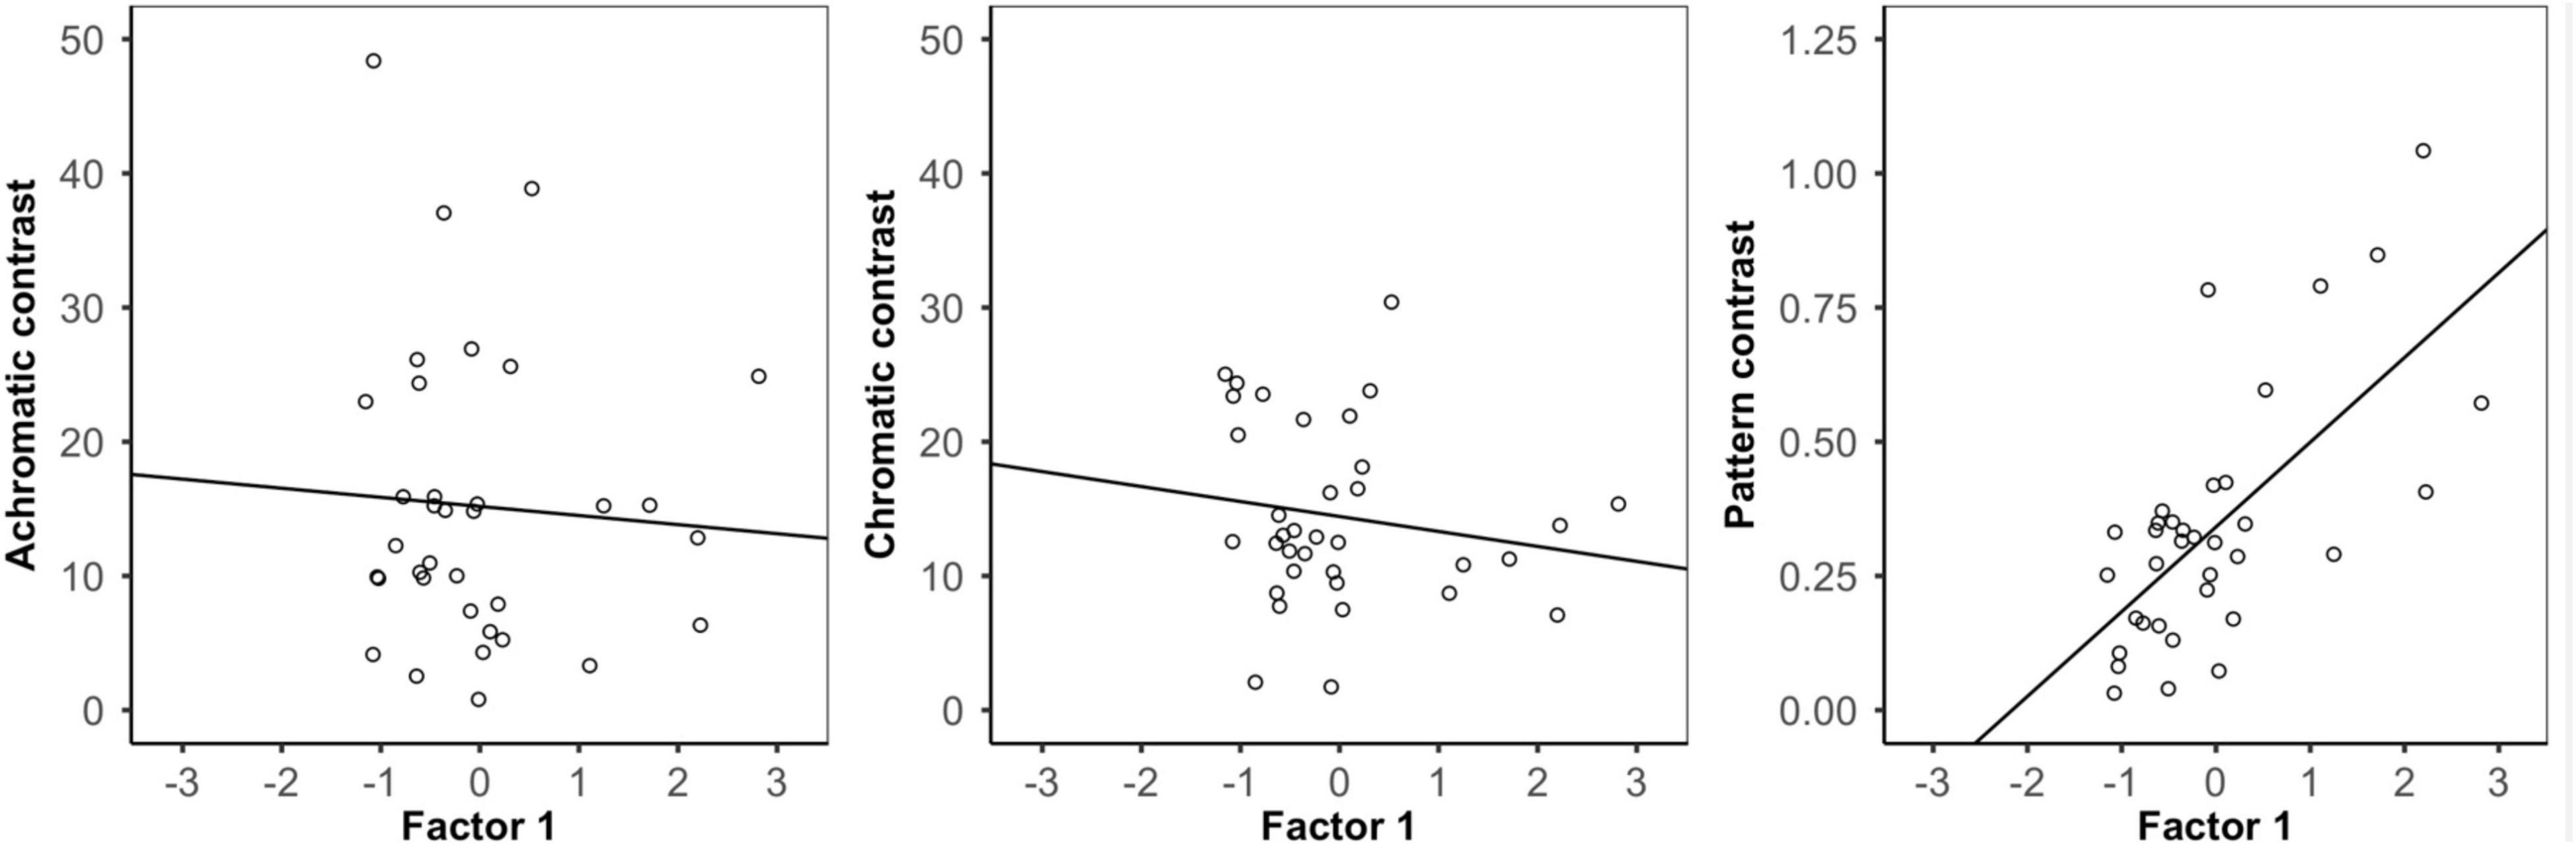
Figure 4. Analysis of background contrast from the bird visual model. Correlation between Factor 1 (∽pattern variation) score and the achromatic (left), chromatic (middle), and pattern (right) contrast of each frog and its local background. There was no relationship between frog variation and either achromatic or chromatic contrast, but there was a significant relationship between frog pattern and pattern contrast where frogs with higher Factor 1 scores had greater pattern contrast against their local backgrounds.
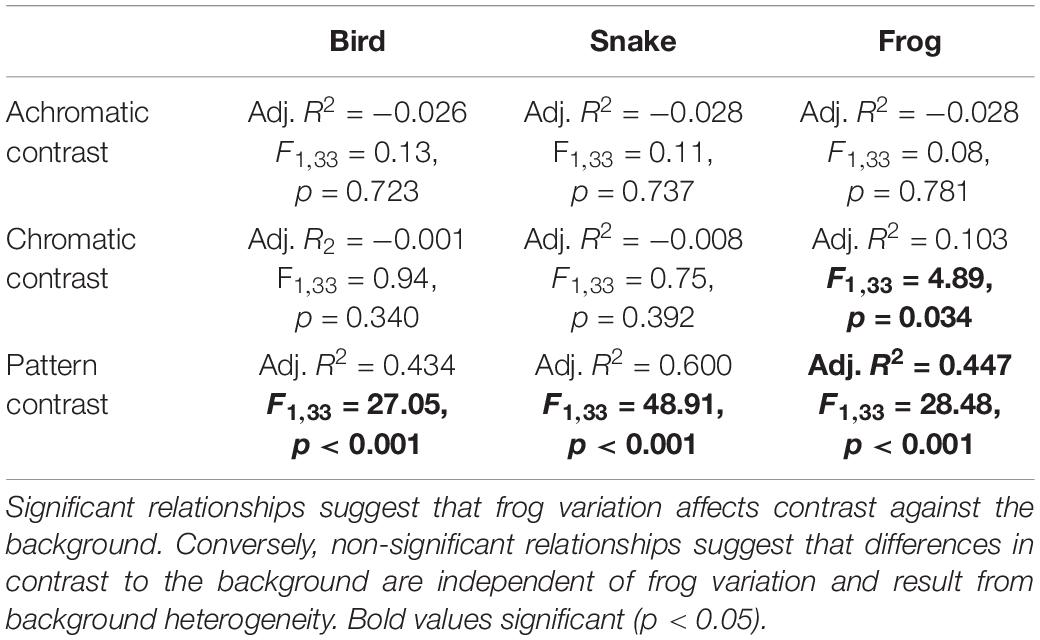
Table 2. Statistical results from the linear models comparing achromatic, chromatic, and pattern contrast against their local microhabitat substrate and Factor 1 from the factor analysis, which explained >55% of total frog variance.
In the frog visual model, we found no significant relationship between Factor 1 and achromatic contrast, but there was a significant relationship between Factor 1 and both chromatic and pattern contrast. Frogs with higher Factor 1 scores were more distinct from their local backgrounds in both chromatic contrast and patterning, although chromatic contrast remained well above the discrimination threshold in both conditions (Table 2).
Effects of Occupied Microhabitats on Frog Signals
Frogs were most commonly found in leaf litter (n = 27) or green vegetation (n = 8) substrates. We found no significant effect of background type (local vs. alternative) on frog contrast against the background in the bird and frog visual models (Table 3). Similarly, in the snake model we found no significant effect of background type on achromatic and pattern contrast, but there was a marginally significant effect for chromatic contrast (V = 170, p = 0.048; Table 3).
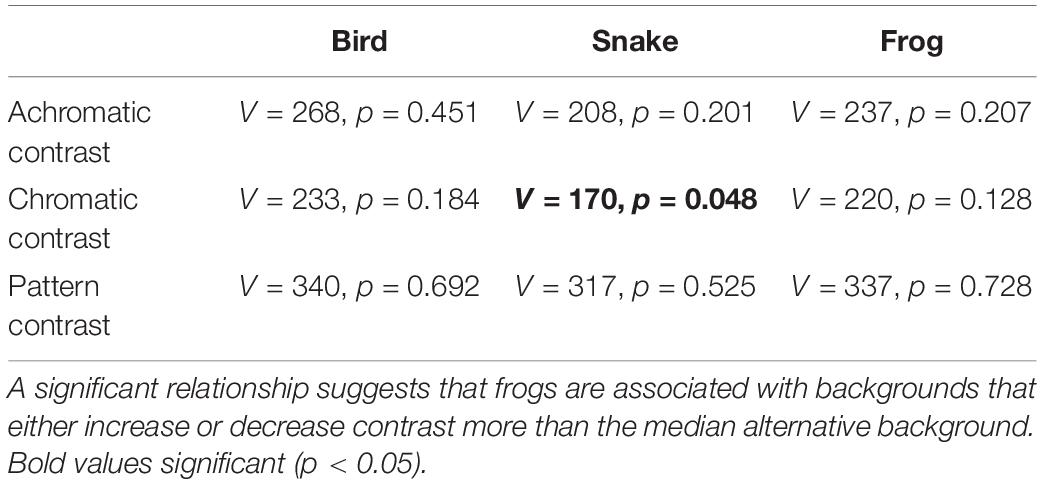
Table 3. Statistical results from the paired-sampled Wilcoxon tests comparing achromatic, chromatic, and pattern contrast between local and alternate background types.
Discussion
The evolution and maintenance of intraspecific variation in aposematic signals continues to draw considerable interest (Rojas, 2017; Briolat et al., 2019). Although in O. sylvatica the extent of color pattern variation found within populations is not as striking as that observed between populations (Roland et al., 2017), resolving basic questions related to the degree and organization of phenotypic divergence is an essential step in beginning to understand broader scales of both polymorphism and polytypism in aposematic species (Briolat et al., 2019). A central prediction of within-population polymorphism is that if variance exists, it should be correlated with differences in signal saliency to serve distinct adaptive roles, such as in separate microhabitats within heterogeneous landscapes (Gray and McKinnon, 2007), or where a single color pattern serves divergent anti-predator and social functions (Cummings and Crothers, 2013).
Using a population-wide sampling effort, we sought to understand fine-scale phenotypic variance. We found intra-population color pattern variation in the Perla population of O. sylvatica to be continuous, rather than discrete, and largely driven by pattern elements, rather than chromatic or achromatic contrast. Moreover, although individuals differed in pattern distinctness from the background, we found no strong evidence that different individuals were associated with particular microhabitats, such as if they were selecting signaling environments that would either enhance or reduce signal contrast. Taken together, our data suggest that frogs exhibit highly variable patterns which still maintain consistent chromatic and achromatic contrast. However, although seemingly highly variable, the frogs’ aposematic signals do appear constrained to a small range of colors such that any variance is likely still perceived as within the same aposematic grouping. Our data are, therefore, consistent with a single fitness peak (or perhaps a broad plateau), with variation arising as a product of weak purifying selection, honest signaling, and/or neutral drift on some elements of the color pattern.
In aposematic signals both color and pattern have been found to convey important information to potential predators (Stevens and Ruxton, 2012; Caro and Ruxton, 2019). Prey bearing patterns comprised of multiple highly contrasting elements have higher survival than prey with single colors (Preißler and Pröhl, 2017). However, in predator education, hue and brightness appear to play a more critical role than the particular arrangement of the pattern (Aronsson and Gamberale-Stille, 2008; Kazemi et al., 2014; Sherratt et al., 2015). In O. pumilio, for example, color and pattern are both involved in aversion learning and when controlling for color, larger spotted patterns have been found to be more salient and more likely to be avoided than smaller spotted or plain patterns (Hegna et al., 2011; Qvarnström et al., 2014; Preißler and Pröhl, 2017; Barnett et al., 2021b). However, under natural conditions, both color and pattern can be highly divergent without necessarily increasing predation risk (Hegna et al., 2011; Richards-Zawacki et al., 2013).
The arrangement of pattern elements can also allow seemingly conspicuous signals to incorporate aspects of camouflage, for example, dual signaling as a function of observer viewing distance or by context dependent disruptive coloring (Marshall, 2000; Tullberg et al., 2005; Barnett and Cuthill, 2014; Honma et al., 2015). Distance-dependent signaling takes advantage of limitations in observer visual perception such that when viewed from a distance a high contrast pattern blends together to match the background (Marshall, 2000; Tullberg et al., 2005; Barnett and Cuthill, 2014; Caro et al., 2016). Although the contrast between the average color of the frogs and the background (external contrast) was lower than that found within the frogs’ pattern (internal contrast), external chromatic and achromatic contrast was still high. We therefore found no strong evidence that this population of O. sylvatica are utilizing distance-dependent pattern blending. Alternatively, in disruptive camouflage, high contrast patterns can interfere with the visual assessment of shapes and edges (Stevens et al., 2006; Stevens and Merilaita, 2009). We did not explicitly test for disruptive coloring but unlike predictions for aposematism, disruptive camouflage can be more effective when sympatric individuals vary in the expression of pattern characteristics (Troscianko et al., 2021), and future studies could explore this alternative. With this in mind, it is important to note that to test for differences in microhabitat use, we only characterized the local patch of substrate immediately surrounding the frogs. However, we emphasize these were the very patches where frogs were initially detected, representing ecologically relevant contexts. Yet when the whole complexity of the visual environment is considered, these frogs may be more difficult to detect under certain conditions than currently recognized. Future experiments are needed to explicitly test the role of color pattern variation in combining aposematic signals with alternative anti-predatory strategies such as disruptive coloration.
Although we found no direct evidence for an adaptive benefit of variation, within-population pattern heterogeneity could potentially play a significant, yet indirect functional role in polymorphism and polytypism. As aposematic signals are often co-opted via sexual selection for mate choice and intra-sexual conflict, patterning may convey information important for intraspecific communication, although research into this possibility has so far predominantly focused on color rather than pattern (Crothers and Cummings, 2013, 2015). The observed variance in pattern could, for example, assist in identifying territory intruders or serve as an honest signal in mate choice or for mediating agonistic interactions (Maan and Cummings, 2008, 2009; Crothers and Cummings, 2013, 2015). In O. pumilio future preferences for color-based assortative mating are imprinted during parental care, and to date evidence is limited to coloration because the populations sampled lack pattern elements (Yang et al., 2019). However, were O. sylvatica tadpoles to imprint on elements of female phenotypes which include pattern as well as color during maternal tropic egg provisioning, the mother’s phenotype could have downstream influences in female mate choice and/or male/male aggression. Albeit indirect, intra-population variance could shape the color pattern evolution in O. sylvatica in a mechanism similar to coupled drift proposed in O. pumilio by Tazzyman and Iwasa (2010). In coupled drift models female preference (though certainly also potentially applicable to male/male aggression) is linked with color patterns, where preferences diverge according to neutral processes and then reinforce color pattern divergence (Tazzyman and Iwasa, 2010; Gehara et al., 2013). If O. sylvatica populations diverge in a method such as coupled drift, then high intra-population variance should enhance between-population divergence, especially those populations which are small or are found in fragmented forest patches.
It has long been predicted that sympatric variance in aposematic signals should be limited, and that which does occur should largely be adaptive (Mappes et al., 2005; Briolat et al., 2019). Recent research adds to a growing body of evidence that this is not universally true, and that relaxed or weak selection can produce or permit significant levels of sympatric intraspecific variation (Richards-Zawacki et al., 2013; Briolat et al., 2019; Bliard et al., 2020). We found that variation within the Perla population of O. sylvatica was not divided into visually distinct categories, and that variation was not associated with particular microhabitat characteristics. Therefore, it is unlikely that signal variance has evolved due to strong selection producing locally adapted phenotypes across a variable fitness landscape, but rather variable patterns remain as purifying selection from predators is weak. These findings highlight how seemingly salient characteristics of animal color may at first evolve through neutral processes, which could have implications for our understanding of the evolution of polymorphism, polytypism, and the evolutionary processes which can ultimately lead to speciation.
Data Availability Statement
The datasets presented in this study can be found in online repositories. The names of the repository/repositories and accession number(s) can be found below: https://doi.org/10.5061/dryad.hmgqnk9j0.
Ethics Statement
Ethical review and approval was not required for the animal study because animals were only photographed and had no other manipulations. Permits were granted by the Ministerio del Ambiente, Ecuador, for research permission (Permit Number: 014-2019-IC-FLO-DNB/MA).
Author Contributions
JY and JB conceived the manuscript, conducted the analyses, and wrote the manuscript, JY collected the data. Both authors contributed to the article and approved the submitted version.
Funding
This work was supported by the Universidad de Las Américas, Quito, Ecuador (FGE.JY.20.13).
Conflict of Interest
The authors declare that the research was conducted in the absence of any commercial or financial relationships that could be construed as a potential conflict of interest.
Publisher’s Note
All claims expressed in this article are solely those of the authors and do not necessarily represent those of their affiliated organizations, or those of the publisher, the editors and the reviewers. Any product that may be evaluated in this article, or claim that may be made by its manufacturer, is not guaranteed or endorsed by the publisher.
Acknowledgments
We thank the Ministerio del Ambiente, Ecuador, for research permission (Permit Number: 014-2019-IC-FLO-DNB/MA), J. Crespo/Bosque Protector la Perla for permission to sample frogs, and F. Angiolani, K. Erickson, P. Fowler, and especially J. Culebras for field assistance, and B. Rios for numerous fruitful discussions.
Supplementary Material
The Supplementary Material for this article can be found online at: https://www.frontiersin.org/articles/10.3389/fevo.2022.803996/full#supplementary-material
References
Aronsson, M., and Gamberale-Stille, G. (2008). Domestic chicks primarily attend to colour, not pattern, when learning an aposematic coloration. Anim. Behav. 75, 417–423. doi: 10.1016/j.anbehav.2007.05.006
Barnett, J. B., and Cuthill, I. C. (2014). Distance-dependent defensive coloration. Curr. Biol. 24, R1157–R1158. doi: 10.1016/j.cub.2014.11.015
Barnett, J. B., Michalis, C., Scott-Samuel, N. E., and Cuthill, I. C. (2018). Distance-dependent defensive coloration in the poison frog Dendrobates tinctorius, dendrobatidae. Proc. Natl. Acad. Sci. U. S. A. 115, 6416–6421. doi: 10.1073/pnas.1800826115
Barnett, J. B., Michalis, C., Scott-Samuel, N. E., and Cuthill, I. C. (2021a). Colour pattern variation forms local background matching camouflage in a leaf-mimicking toad. J. Evol. Biol. 34, 1531–1540. doi: 10.1111/jeb.13923
Barnett, J. B., Varela, B. J., Jennings, B. J., Lesbarréres, D., Pruitt, J. N., and Green, D. M. (2021b). Habitat disturbance alters color contrast and the detectability of cryptic and aposematic frogs. Behav. Ecol. 32, 814–825. doi: 10.1093/beheco/arab032
Bliard, L., Paquet, M., Robert, A., Dufour, P., Renoult, J. P., Grégoire, A., et al. (2020). Examining the link between relaxed predation and bird coloration on islands. Biol. Lett. 16:20200002. doi: 10.1098/rsbl.2020.0002
Briolat, E. S., Burdfield-Steel, E. R., Paul, S. C., Rönkä, K. H., Seymoure, B. M., Stankowich, T., et al. (2019). Diversity in warning coloration: selective paradox or the norm? Biol. Rev. 94, 388–414. doi: 10.1111/brv.12460
Caro, T., and Ruxton, G. (2019). Aposematism: unpacking the defences. Trends Ecol. Evol. 34, 595–604. doi: 10.1016/j.tree.2019.02.015
Caro, T., Sherratt, T. N., and Stevens, M. (2016). The ecology of multiple colour defences. Evol. Ecol. 30, 797–809. doi: 10.1007/s10682-016-9854-3
Chouteau, M., and Angers, B. (2011). The role of predators in maintaining the geographic organization of aposematic signals. Am. Nat. 178, 810–817. doi: 10.1086/662667
Chouteau, M., Arias, M., and Joron, M. (2016). Warning signals are under positive frequency-dependent selection in nature. Proc. Natl. Acad. Sci. U. S. A. 113, 2164–2169. doi: 10.1073/pnas.1519216113
Crothers, L. R., and Cummings, M. E. (2013). Warning signal brightness variation: sexual selection may work under the radar of natural selection in populations of a polytypic poison frog. Am. Nat. 181, E116–E124. doi: 10.1086/670010
Crothers, L. R., and Cummings, M. E. (2015). A multifunctional warning signal behaves as an agonistic status signal in a poison frog. Behav. Ecol. 26, 560–568. doi: 10.1093/beheco/aru231
Crothers, L., Gering, E., and Cummings, M. (2011). Aposematic signal variation predicts male-male interactions in a polymorphic poison frog. Evolution 65, 599–605. doi: 10.1111/j.1558-5646.2010.01154.x
Cummings, M. E., and Crothers, L. R. (2013). Interacting selection diversifies warning signals in a polytypic frog: an examination with the strawberry poison frog. Evol. Ecol. 27, 693–710. doi: 10.1007/s10682-013-9648-9
Darst, C. R., Cummings, M. E., and Cannatella, D. C. (2006). A mechanism for diversity in warning signals: conspicuousness versus toxicity in poison frogs. Proc. Natl. Acad. Sci. U. S. A. 103, 5852–5857. doi: 10.1073/pnas.0600625103
Dreher, C. E., Cummings, M. E., and Pröhl, H. (2015). An analysis of predator selection to affect aposematic coloration in a poison frog species. PLoS One 10:e0130571. doi: 10.1371/journal.pone.0130571
Dreher, C. E., Rodríguez, A., Cummings, M. E., and Pröhl, H. (2017). Mating status correlates with dorsal brightness in some but not all poison frog populations. Ecol. Evol. 7, 10503–10512. doi: 10.1002/ece3.3531
Dugas, M. B., Yeager, J., and Karkos, A. M. (2020). Preferences for and use of light microhabitats differ among and within populations of a polytypic poison frog. Biol. J. Linn. Soc. 129, 379–387. doi: 10.1093/biolinnean/blz186
Endler, J. A., and Mappes, J. (2004). Predator mixes and the conspicuousness of aposematic signals. Am. Nat. 163, 532–547. doi: 10.1086/382662
Funkhouser, J. W. (1956). New frogs from ecuador and southwestern Colombia. Zoologica (NY) 41, 73–80. doi: 10.5962/p.190356
Gehara, M., Summers, K., and Brown, J. L. (2013). Population expansion, isolation and selection: novel insights on the evolution of color diversity in the strawberry poison frog. Evol. Ecol. 27, 797–824. doi: 10.1007/s10682-013-9652-0
Gray, S. M., and McKinnon, J. S. (2007). Linking color polymorphism maintenance and speciation. Trends Ecol. Evol. 22, 71–79. doi: 10.1016/j.tree.2006.10.005
Hämäläinen, L., Valkonen, J., Mappes, J., and Rojas, B. (2015). Visual illusions in predator–prey interactions: birds find moving patterned prey harder to catch. Anim. Cogn. 18, 1059–1068. doi: 10.1007/s10071-015-0874-0
Hart, N. S. (2001). The visual ecology of avian photoreceptors. Prog. Retin. Eye Res. 20, 675–703. doi: 10.1016/S1350-9462(01)00009-X
Hart, N. S., Partridge, J. C., Cuthill, I. C., and Bennett, A. T. (2000). Visual pigments, oil droplets, ocular media and cone photoreceptor distribution in two species of passerine bird: the blue tit (Parus caeruleus L.) and the blackbird (Turdus merula L.). J. Comp. Physiol. 186, 375–387. doi: 10.1007/s003590050437
Hegna, R. H., Saporito, R. A., and Donnelly, M. A. (2013). Not all colors are equal: predation and color polytypism in the aposematic poison frog Oophaga pumilio. Evol. Ecol. 27, 831–845. doi: 10.1007/s10682-012-9605-z
Hegna, R. H., Saporito, R. A., Gerow, K. G., and Donnelly, M. A. (2011). Contrasting colors of an aposematic poison frog do not affect predation. Ann. Zool. Fenn. 48, 29–38. doi: 10.5735/086.048.0103
Honma, A., Mappes, J., and Valkonen, J. K. (2015). Warning coloration can be disruptive: aposematic marginal wing patterning in the wood tiger moth. Ecol. Evol. 5, 4863–4874. doi: 10.1002/ece3.1736
Kazemi, B., Gamberale-Stille, G., Tullberg, B. S., and Leimar, O. (2014). Stimulus salience as an explanation for imperfect mimicry. Curr. Biol. 24, 965–969. doi: 10.1016/j.cub.2014.02.061
Maan, M. E., and Cummings, M. E. (2008). Female preferences for aposematic signal components in a polymorphic poison frog. Evolution 62, 2334–2345. doi: 10.1111/j.1558-5646.2008.00454.x
Maan, M. E., and Cummings, M. E. (2009). Sexual dimorphism and directional sexual selection on aposematic signals in a poison frog. Proc. Natl. Acad. Sci. U. S. A. 106, 19072–19077. doi: 10.1073/pnas.0903327106
Maan, M. E., and Cummings, M. E. (2012). Poison frog colors are honest signals of toxicity, particularly for bird predators. Am. Nat. 179, E1–E14. doi: 10.1086/663197
Macedonia, J. M., Lappin, A. K., Loew, E. R., McGuire, J. A., Hamilton, P. S., Plasman, M., et al. (2009). Conspicuousness of dickerson’s collared lizard (Crotaphytus dickersonae) through the eyes of conspecifics and predators. Biol. J. Linn. Soc. 97, 749–765. doi: 10.1111/j.1095-8312.2009.01217.x
Maechler, M., Rousseeuw, P., Struyf, A., Hubert, M., and Hornik, K. (2021). Cluster: Cluster Analysis Basics and Extensions. R package version 2.1.2.
Mappes, J., Marples, N., and Endler, J. A. (2005). The complex business of survival by aposematism. Trends Ecol. Evol. 20, 598–603. doi: 10.1016/j.tree.2005.07.011
Marshall, N. J. (2000). Communication and camouflage with the same ‘bright’ colours in reef fishes. Philos. Trans. R. Soc. B 355, 1243–1248. doi: 10.1098/rstb.2000.0676
Preißler, K., and Pröhl, H. (2017). The effects of background coloration and dark spots on the risk of predation in poison frog models. Evol. Ecol. 31, 683–694. doi: 10.1007/s10682-017-9903-6
Pröhl, H., and Ostrowski, T. (2011). Behavioural elements reflect phenotypic colour divergence in a poison frog. Evol. Biol. 25, 993–1015. doi: 10.1007/s10682-010-9455-5
Qvarnström, A., Rudh, A., Edström, T., Ödeen, A., Løvlie, H., and Tullberg, B. S. (2014). Coarse dark patterning functionally constrains adaptive shifts from aposematism to crypsis in strawberry poison frogs. Evolution 68, 2793–2803. doi: 10.1111/evo.12487
R Core Team (2021). R: a Language and Environment for Statistical Computing. Vienna: R Foundation for Statistical Computing.
Reynolds, R. G., and Fitzpatrick, B. M. (2007). Assortative mating in poison-dart frogs based on an ecologically important trait. Evolution 61, 2253–2259. doi: 10.1111/j.1558-5646.2007.00174.x
Richards-Zawacki, C. L., and Cummings, M. E. (2011). Intraspecific reproductive character displacement in a polymorphic poison dart frog, Dendrobates pumilio. Evolution 65, 259–267. doi: 10.1111/j.1558-5646.2010.01124.x
Richards-Zawacki, C. L., Yeager, J., and Bart, H. P. S. (2013). No evidence for differential survival or predation between sympatric color morphs of an aposematic poison frog. Evol. Ecol. 27, 783–795. doi: 10.1007/s10682-013-9636-0
Rojas, B. (2017). Behavioural, ecological, and evolutionary aspects of diversity in frog colour patterns. Biol. Rev. 92, 1059–1080. doi: 10.1111/brv.12269
Rojas, B., Devillechabrolle, J., and Endler, J. A. (2014a). Paradox lost: variable colour-pattern geometry is associated with differences in movement in aposematic frogs. Biol. Lett. 10:20140193. doi: 10.1098/rsbl.2014.0193
Rojas, B., Rautiala, P., and Mappes, J. (2014b). Differential detectability of polymorphic warning signals under varying light environments. Behav. Process. 109, 164–172. doi: 10.1016/j.beproc.2014.08.014
Roland, A. B., Santos, J. C., Carriker, B. C., Caty, S. N., Tapia, E. E., Coloma, L. A., et al. (2017). Radiation of the polymorphic little devil poison frog (Oophaga sylvatica) in Ecuador. Ecol. Evol. 7, 9750–9762. doi: 10.1002/ece3.3503
Rudh, A. (2013). Loss of conspicuous coloration has co-evolved with decreased body size in populations of poison dart frogs. Evol. Ecol. 27, 755–767. doi: 10.1007/s10682-013-9649-8
Rudh, A., Breed, M. F., and Qvarnström, A. (2012). Does aggression and explorative behaviour decrease with lost warning coloration? Biol. J. Linn. Soc. 108, 116–126. doi: 10.1111/j.1095-8312.2012.02006.x
Saporito, R. A., Zuercher, R., Roberts, M., Gerow, K. G., and dDonnelly, M. A. (2007). Experimental evidence for aposematism in the dendrobatid poison frog Oophaga pumilio. Copeia 2007, 1006–1011. doi: 10.1643/0045-8511(2007)7[1006:EEFAIT]2.0.CO;2
Schneider, C. A., Rasband, W. S., and Eliceiri, K. W. (2012). Nih image to imagej: 25 years of image analysis. Nat. Methods 9, 671–675. doi: 10.1038/nmeth.2089
Sherratt, T. N., Whissell, E., Webster, R., and Kikuchi, D. (2015). Hierarchical overshadowing of stimuli and its role in mimicry evolution. Anim. Behav. 108, 73–79. doi: 10.1016/j.anbehav.2015.07.011
Siddiqi, A., Cronin, T. W., Loew, E. R., Vorobyev, M., and Summers, K. (2004). Interspecific and intraspecific views of color signals in the strawberry poison frog Dendrobates pumilio. J. Exp. Biol. 207, 2471–2485. doi: 10.1242/jeb.01047
Stevens, M. (2007). Predator perception and the interrelation between different forms of protective coloration. Proc. R. Soc. B 274, 1457–1464. doi: 10.1098/rspb.2007.0220
Stevens, M., and Merilaita, S. (2009). Defining disruptive coloration and distinguishing its functions. Philos. Trans. R. Soc. B 364, 481–488. doi: 10.1098/rstb.2008.0216
Stevens, M., and Ruxton, G. D. (2012). Linking the evolution and form of warning coloration in nature. Proc. R. Soc. B 279, 417–426. doi: 10.1098/rspb.2011.1932
Stevens, M., Cuthill, I. C., Windsor, A. M. M., and Walker, H. J. (2006). Disruptive contrast in animal camouflage. Proc. R. Soc. B 273, 2433–2438. doi: 10.1098/rspb.2006.3614
Summers, K., Cronin, T. W., and Kennedy, T. (2003). Variation in spectral reflectance among populations of Dendrobates pumilio, the strawberry poison frog, in the Bocas del Toro archipelago. Panama. J. Biogeogr. 30, 35–53. doi: 10.1046/j.1365-2699.2003.00795.x
Summers, K., Symula, R., Clough, M., and Cronin, T. (1999). Visual mate choice in poison frogs. Proc. R. Soc. B 266, 2141–2145. doi: 10.1098/rspb.1999.0900
Tazzyman, S. J., and Iwasa, Y. (2010). Sexual selection can increase the effect of random genetic drift—a quantitative genetic model of polymorphism in Oophaga pumilio, the strawberry poison-dart frog. Evolution 64, 1719–1728. doi: 10.1111/j.1558-5646.2009.00923.x
Tibshirani, R., Walther, G., and Hastie, T. (2001). Estimating the number of clusters in a data set via the gap statistic. J. R. Stat. Soc. Series B (Stat Methodol) 63, 411–423. doi: 10.1111/1467-9868.00293
Troscianko, J., and Stevens, M. (2015). Image calibration and analysis toolbox – a free software suite for objectively measuring reflectance, colour and pattern. Methods Ecol. Evol. 6, 1320–1331. doi: 10.1111/2041-210X.12439
Troscianko, J., Nokelainen, O., Skelhorn, J., and Stevens, M. (2021). Variable crab camouflage patterns defeat search image formation. Commun. Biol. 4:287. doi: 10.1038/s42003-021-01817-8
Tullberg, B. S., Merilaita, S., and Wiklund, C. (2005). Aposematism and crypsis combined as a result of distance dependence: functional versatility of the colour pattern in the swallowtail butterfly larva. Proc. R. Soc. B 272, 1315–1321. doi: 10.1098/rspb.2005.3079
Vorobyev, M., and Osorio, D. (1998). Receptor noise as a determinant of colour thresholds. Proc. R. Soc. B 265, 351–358. doi: 10.1098/rspb.1998.0302
Vorobyev, M., Osorio, D., Bennett, A. T. D., Marshall, N. J., and Cuthill, I. C. (1998). Tetrachromacy, oil droplets and bird plumage colours. J. Comp. Physiol. A 183, 621–633. doi: 10.1007/s003590050286
Wang, I. J., and Shaffer, H. B. (2008). Rapid color evolution in an aposematic species: a phylogenetic analysis of color variation in the strikingly polymorphic strawberry poison-dart frog. Evolution 62, 2742–2759. doi: 10.1111/j.1558-5646.2008.00507.x
Willink, B., Bolaños, F., and Pröhl, H. (2014). Conspicuous displays in cryptic males of a polytypic poison-dart frog. Behav. Ecol. Sociobiol. 68, 249–261. doi: 10.1007/s00265-013-1640-4
Wollenberg, K. C., Lötters, S., Mora-Ferrer, C., and Vieth, M. (2008). Disentangling composite colour patterns in a poison frog species. Biol. J. Linn. Soc. 93, 433–444. doi: 10.1111/j.1095-8312.2007.00906.x
Yang, Y., Servedio, M. R., and Richards-Zawacki, C. L. (2019). Imprinting sets the stage for speciation. Nature 574, 99–102. doi: 10.1038/s41586-019-1599-z
Yeager, J., and Barnett, J. B. (2020). Ultraviolet components offer minimal contrast enhancement to an aposematic signal. Ecol. Evol. 10, 13576–13582.
Keywords: aposematism, crypsis, poison frog, Oophaga sylvatica, visual modeling
Citation: Yeager J and Barnett JB (2022) Continuous Variation in an Aposematic Pattern Affects Background Contrast, but Is Not Associated With Differences in Microhabitat Use. Front. Ecol. Evol. 10:803996. doi: 10.3389/fevo.2022.803996
Received: 28 October 2021; Accepted: 07 February 2022;
Published: 08 March 2022.
Edited by:
Felipe M. Gawryszewski, University of Brasília, BrazilCopyright © 2022 Yeager and Barnett. This is an open-access article distributed under the terms of the Creative Commons Attribution License (CC BY). The use, distribution or reproduction in other forums is permitted, provided the original author(s) and the copyright owner(s) are credited and that the original publication in this journal is cited, in accordance with accepted academic practice. No use, distribution or reproduction is permitted which does not comply with these terms.
*Correspondence: Justin Yeager, yeagerjd@gmail.com
†ORCID: Justin Yeager, orcid.org/0000-0001-8692-6311; James B. Barnett, orcid.org/0000-0001-9789-4132