Phylogeography of a Typical Forest Heliothermic Lizard Reveals the Combined Influence of Rivers and Climate Dynamics on Diversification in Eastern Amazonia
 Áurea A. Cronemberger
 Fernanda P. Werneck
 Teresa C. S. Ávila-Pires
- 1Programa de Pós-Graduação em Zoologia, Museu Paraense Emílio Goeldi, Universidade Federal do Pará, Belém, Brazil
- 2Coordenação de Biodiversidade, Programa de Coleções Científicas Biológicas, Instituto Nacional de Pesquisas da Amazônia, Manaus, Brazil
- 3Coordenação de Zoologia, Museu Paraense Emílio Goeldi, Belém, Brazil
The formation of the Amazon drainage basin has been considered an important driver of speciation of several taxa, promoting vicariant events or reinforcement of barriers that restrict gene flow between opposite river margins. Several recent studies reported a set of miscellaneous events involving climatic fluctuations, geomorphological changes, and dispersal mechanisms as propellers of diversification of Amazonian rainforest taxa. Here, we show the results of dated phylogenetic, biogeographic, and populational analyses to investigate which events could better explain the current distribution of a heliothermic, active foraging lizard in the central and eastern portions of the Amazonian rainforest (besides a disjunct distribution in part of the Atlantic Forest). We sampled Kentropyx calcarata from most of its area of occurrence in Amazonia and used mitochondrial and nuclear markers to evaluate if the genetic structure agrees with evolutionary scenarios previously proposed for Amazonia. We performed phylogenetic and populational analyses to better understand the dynamics of this species in the Amazonia rainforest over time. Phylogenetic inference recovered ten K. calcarata structured lineages in eastern Amazonia, some of them limited by the Amazon River and its southern tributaries (Tapajós, Xingu, and Tocantins), although we detected occasional haplotype sharing across some of the river banks. According to molecular dating, K. calcarata diversified since Miocene–Pliocene, and some of the lineages presented signs of demographic expansion during the Pleistocene, supposedly triggered by climatic dynamics. The putative ancestral lineage of K. calcarata was distributed on the Guiana Shield, later spreading south and southeastward by dispersion. Our results indicate that Amazonian rivers acted as barriers to the dispersal of Kentropyx calcarata, but they were not the sole drivers of diversification.
Introduction
Several phylogeographic studies tried to understand how organisms evolved in Amazonia, testing possible evolutionary scenarios (Moritz et al., 2000; Werneck et al., 2009; Hoorn et al., 2010; Avila-Pires et al., 2012; Leite and Rogers, 2013; Prates et al., 2016a; Ribas and Aleixo, 2019; Silva et al., 2019). The general consensus is that the evolution of the present-day Amazonian landscape was structured by geomorphological and climatic events during the Tertiary and Quaternary, which in turn affected biotic diversification. One of the most important geomorphological events is the Andes uplift, which affected landscape evolution and the river system dynamics. Sea-level fluctuations and other tectonic activities also played a key role in the evolution of Amazonian biodiversity (de Rossetti et al., 2005; Rossetti and De Toledo, 2007; Hoorn et al., 2010).
Climate fluctuations also caused changes in vegetation, although their degree, extension, and impacts on biodiversity are still uncertain (Haffer and Prance, 2001; Bush, 2017). Proposed evolutionary scenarios support that higher levels of precipitation and climatic stability reigned in western Amazonia leading to huge biodiversity in this region, while climatic instability of eastern Amazonia could have made vegetation more susceptible to fragmentation, leading to the possible loss of biodiversity (Cheng et al., 2013). More recently, a synergetic role between climate fluctuations and dynamic drainages through a variation in sedimentary discharge has been proposed (Pupim et al., 2019), which would have also triggered the genetic diversification of species in eastern Amazonia (Silva et al., 2019).
Several biogeographic hypotheses have been proposed based on climatic and geomorphological events, making predictions that are amenable to be tested using molecular data (Moritz et al., 2000; Antonelli et al., 2010; Leite and Rogers, 2013). The riverine hypothesis proposes that the establishment of the Amazon River and its major tributaries fragmented the distribution of species, isolating populations on opposite banks, causing lineage differentiation, and ultimately speciation (Wallace, 1852). Predictions of this hypothesis include the formation of reciprocally monophyletic groups (i.e., sister-taxa or sister lineages) and a strong genetic population structure with little to no migration between opposite banks. On the other hand, this structure may be weaker toward the river headwaters, where it becomes easier to cross (Gascon et al., 2000; Leite and Rogers, 2013). It is also assumed that the populations separated by the rivers remained mostly stable, with no evidence of population expansion related to the differentiation process. Moreover, the diversification times of the sister lineages should be in agreement with the time the respective enclosing river was established (Moritz et al., 2000; Leite and Rogers, 2013).
Studies with amphibians and reptiles in eastern Amazonia have found that some large rivers (Avila-Pires et al., 2012; Dias-Terceiro et al., 2015; Godinho and da Silva, 2018; Moraes et al., 2020) and also smaller rivers (Souza et al., 2013; Fouquet et al., 2015) can act as biogeographic barriers. In general, these and other studies also emphasize the importance of considering the biological specificities of taxa as strong determinants of their distributions (Werneck et al., 2009; Cheng et al., 2013; Prates et al., 2016a,b). Meanwhile, in other studies, rivers are detected not as vicariant (primary) barriers, but as limits of lineages previously differentiated as a result of other factors (e.g., ecological speciation, environmental adaptation, sexual selection, etc.) that eventually became separated by a river (Smith et al., 2014; Naka and Brumfield, 2018; Pirani et al., 2020). Thus, even though the river was not the primary cause of diversification, it could still act to restrict current gene flow (Naka and Brumfield, 2018; Pirani et al., 2020).
In this study, we assessed the relative influence of rivers as barriers and the climatic fluctuation as drivers of genetic diversification using a heliothermic lizard, a forest inhabitant that searches for sunny spots within the forest and tolerates more open types of forest (Vitt, 1991; Ávila-Pires, 1995) as the model system. The teiid lizard Kentropyx calcarata Spix, 1825 is widespread in forested areas in Amazonia east of the Negro and Madeira rivers, besides its disjunct occurrence in the Atlantic Forest (Ávila-Pires, 1995; Ribeiro-Júnior and Amaral, 2016). A phylogeographic study focusing on the eastern part of its distribution in Amazonia detected geographically cohesive clades partially separated by some of the Amazon tributaries and the Tocantins River (Avila-Pires et al., 2012). Moreover, Werneck et al. (2009), on the basis of two mitochondrial genes, dated the separation of K. calcarata and its sister species, recovered as Kentropyx pelviceps Cope, 1868, to the Middle Miocene, while two samples of K. calcarata, one from Guyana and the other from Mato Grosso, Brazil, were separated since the Pliocene. A more recent study, involving most Kentropyx species and both mitochondrial and nuclear genes, recovered Kentropyx altamazonica Cope, 1876 as the sister species of K. calcarata, also dating their divergence to the Middle Miocene (Sheu et al., 2020). This study included K. calcarata samples from both Amazonia and Atlantic Forest, which formed two lineages that split from each other since the late Miocene/Pliocene. It indicated moreover that ecological niche divergence was an important driver of diversification in the genus. However, in spite of such studies, a better picture of how K. calcarata responded to the geomorphological and climatic events that occurred in Amazonia, and which events were the most important for the species diversification, is still lacking. A better knowledge of how widely distributed forest species evolved could help in the prediction of future demographic dynamics and provide a basis for conservation policies.
Here, we investigate how K. calcarata diversified in Amazonia through an ancestral area reconstruction and a molecular clock based on a multi-locus dataset. Distribution patterns and historical demographic dynamics of the lineages recovered were also examined. The recognition and arrangement of clades and their diversification times will give us clues about the processes involved in the species’ phylogeographic history. Reciprocally, monophyletic sister populations distributed on opposite river banks, with coincident times between clade splits and the arising of rivers, would be an indication that these rivers acted as drivers of populational diversification in K. calcarata. On the other hand, splits that occurred during the Pleistocene could be more correlated with forest fragmentation. In addition, the dated demographic analyses may provide clues of bottleneck or population expansion, in agreement with the hypothesis of forest fragmentation by climatic events, if occurred since the end of the Quaternary.
Materials and Methods
Sampling and Molecular Data
We used tissue samples (tail, muscle, or liver) from 286 Kentropyx calcarata specimens [63 sequences of the mitochondrial genes were obtained from GenBank, from Avila-Pires et al. (2012)], and a total of 12 samples of Kentropyx striata (Daudin, 1802), K. pelviceps, and K. altamazonica were used as outgroups. Samples were obtained through fieldwork and tissue loans from scientific collections, covering most of the wide distribution of the species in Amazonia (Supplementary Table 1).
To extract genomic DNA, we used the phenol–chloroform method, following the protocol suggested by Sambrook and Russell (2001), and to maximize the extraction of genomic DNA from small tissue samples, we used the DNeasy Blood and Tissue kit (QIAGEN). Four genes, two being mitochondrial (mtDNA), namely cytochrome b (CYTB) and 16S (Palumbi et al., 1991; Corl et al., 2010), and two nuclear (nuDNA), namely dynein, justaxonemal, heavy chain 3 (DNAH3) and synuclein, alpha interacting protein (SINCAIP; Townsend et al., 2008), were amplified by polymerase chain reaction (PCR), purified with PEG 8000, and sequenced using Big Dye Terminator kit (Perkin-Elmer Corp., Norwalk, CT, United States). Primers and polymerase chain reaction are detailed in Supplementary Table 2.
Sequences were edited in BioEdit v.7 (Hall, 1999) and aligned using the Multiple Alignment algorithm in Fast Fourier Transform (MAFFT; Katoh and Standley, 2013). We identified the gametic allele’s phase of the heterozygous individuals using a Bayesian approach as implemented in PHASE with a threshold of 90% of posterior probability (Stephens et al., 2001; Stephens and Donnelly, 2003).
Gene Tree Estimates
Sequences were concatenated in the Sequence Matrix software (Vaidya et al., 2011), and samples that failed to amplify for some genes were filled as missing data. We inferred phylogenetic relationships with Bayesian Inference using four independent runs of Markovian chains with 10 million generations and sampling trees every 1,000 generations in MrBayes v.3.1 (Ronquist and Huelsenbeck, 2003). To explain variation in gene sequences, we searched the best-fit partitioning scheme for the data set and the best-fit model of molecular evolution for each subset through Partition Finder (Lanfear et al., 2012). We used Tracer v.1.5 (Rambaut et al., 2018) to evaluate the convergence of sampling parameters and to discard trees sampled before the stability of the log-likelihood values in the Markov chain (first 25% of the trees obtained), as recommended by Huelsenbeck and Hall (2001). Samples remaining after burn-in were used to estimate the values of posterior probability (pp), the length of branches, and tree topology. Relations with posterior probabilities ≥90% were considered well supported.
We also performed a maximum likelihood analysis with RAxML-HPC2 program on XSEDE (Miller et al., 2010). The best ML tree was obtained from a heuristic search among 100 trees and branch support with 1,000 bootstrap replicates. Branches with bootstrap (bs) values ≥70% were considered well supported, following Hillis and Bull (1993).
Population Structure, Networks, Genetic Polymorphism, and Distances
We investigated the level of populational genetic structure based on a Bayesian clustering analysis inferred with BAPS v.6.0 (Corander et al., 2008). This analysis was performed from a matrix of combined sequences of two mitochondrial markers (16S and CYTB), with a total of 271 samples chosen to encompass those preferentially amplified for both mitochondrial genes and including all the groups recovered in the Bayesian tree. In some samples (HT78_F, HT80_F, HT114_F, HT706_F BPN1887_A, BPN2885_A, BPN2946_A, BPN3796_J, and AMS355_B) data on CYTB were missing. We used a linkage map to indicate the limits of base pairs of each marker. A genetic mixture analysis was performed with 10 runs for each K (number of discrete genetic clusters) that ranged from 1 to 11 (a number slightly above the number of major clades recovered by phylogenetic analyses). After finding the optimal K value, an admixture analysis was performed with 100 interactions and a minimum of 5 individuals per population (according to the mixture results). The reference number for each population and the interactions of reference individuals used were, respectively, 200 and 10, following the default values of the software.
We used Haploviewer v.4.1 to determine the number of unique haplotypes and to obtain haplotype networks and the distribution of shared haplotypes based on the maximum likelihood tree (Barrett et al., 2005). We calculated mean pairwise p-distances (Nei, 1987) within and between the recovered populations using mtDNA, concatenated mtDNA, and nuDNA datasets in MEGA 6.0 (Tamura et al., 2013).
We calculated DNA polymorphism metrics (i.e., the number of polymorphic sites, number of haplotypes, nucleotide, and haplotype diversity) for the concatenated mtDNA and separately for each nuclear marker dataset with DnaSP v.5 (Librado and Rozas, 2009). Metrics were calculated only for population clusters with a minimum of six samples. Using Arlequin v.3.1 (Excoffier et al., 2005) and the concatenated mtDNA dataset, we calculated fixation indexes (Fst), the Tajima’s D (Tajima, 1996), and Fu’s Fs (Fu, 1996) values for each group with 1,000 permutations. A three-level hierarchical analysis of molecular variance (AMOVA) was performed using Arlequin v.3.1 to assess genetic diversity among and within the inferred populations, grouped according to the gene tree (Figure 1). We also performed this analysis using mtDNA and partitioning groups by the major rivers aiming to test the riverine hypothesis. The populations were grouped according to seven interfluve regions, four of them located south of the Amazon River, following the Rondônia, Tapajós, Xingu, and Belém Areas of Endemism; and the remaining three groups are located north of the Amazon River, with samples from west of Essequibo and Trombetas Rivers, Trombetas-Jari interfluve (including samples from Suriname), and east of Jari River (including samples from French Guiana; see map in Figure 1).
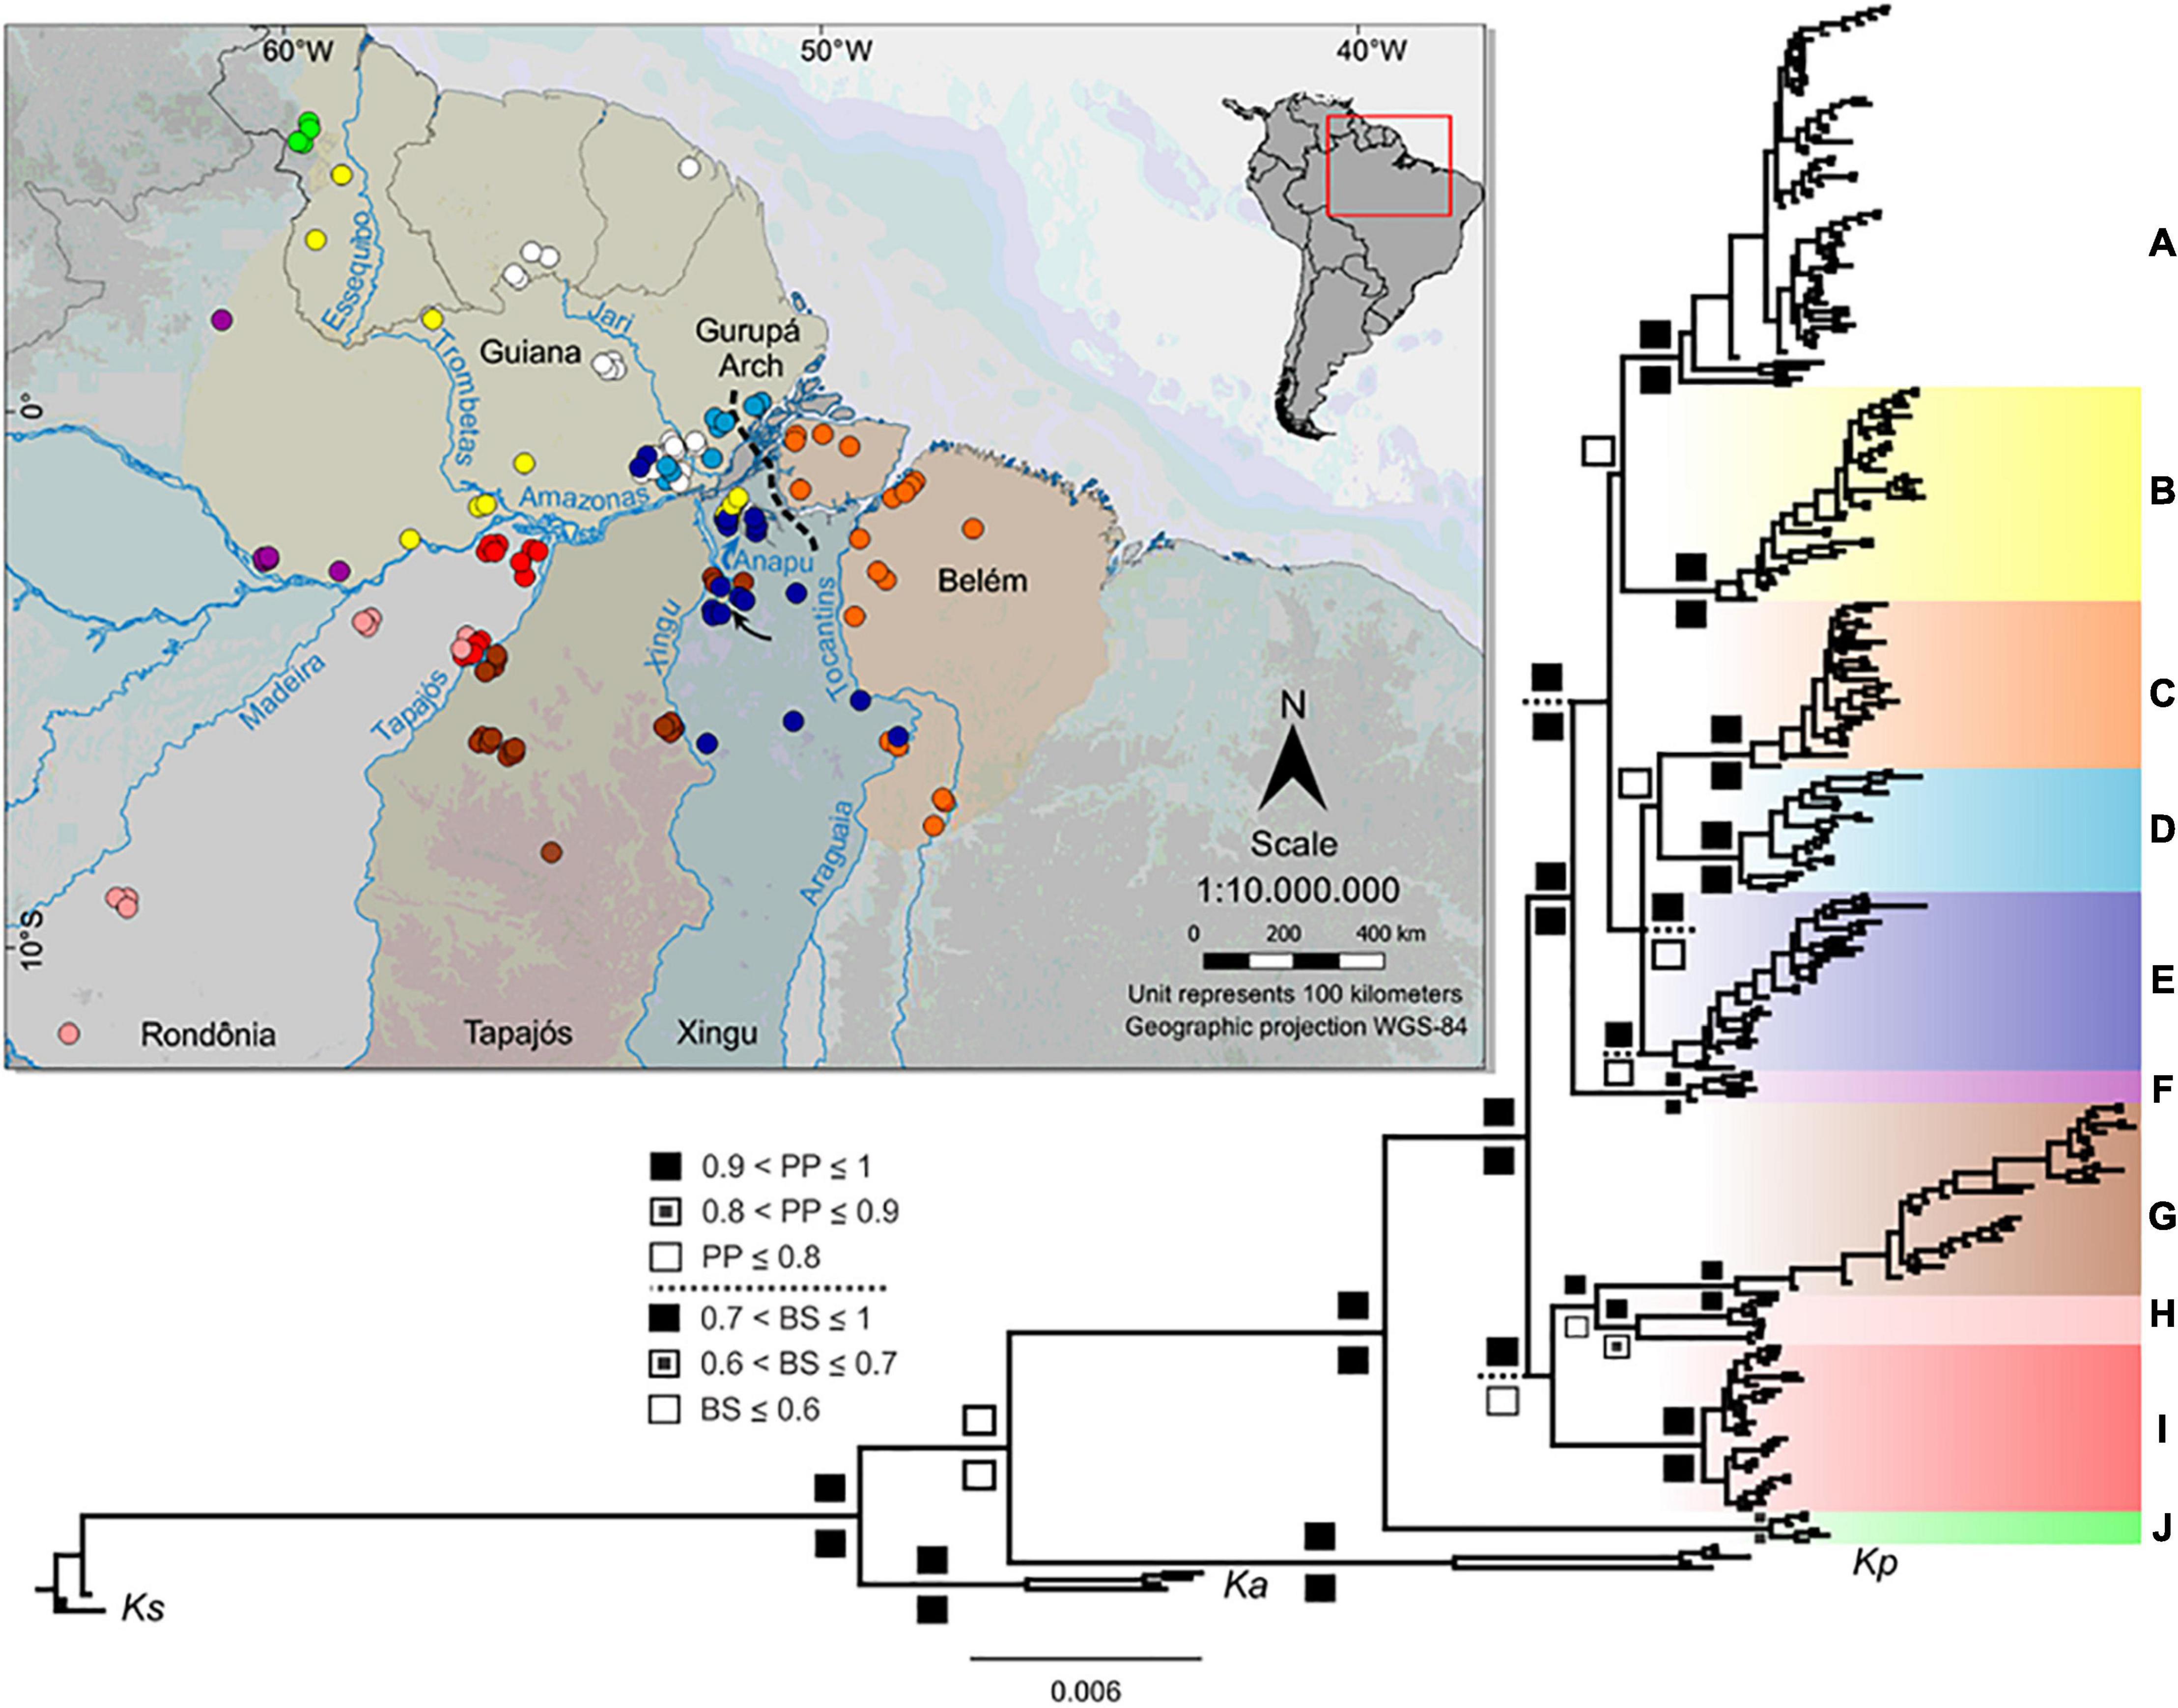
Figure 1. Geographic distribution of Kentropyx calcarata sampled locations used in this study and the concatenated phylogenetic tree (Bayesian inference). Inset with South America map indicates the area shown in the larger map. The dashed line indicates the approximate location of the Gurupá Arch. The black arrow shows the Xingu Great Bend region. Each area of endemism (AoE) is defined by highlighted areas on the map (Guiana AoE is only partially delimited, taking into account the western distribution limit of K. calcarata samples). Circle colors correspond to the clade colors assigned in the phylogenetic tree. Posterior probability-pp (up) and bootstrap-bs (down) values are represented according to the legend in the figure. Bootstrap supports within the main clades were not represented, since the topology of the likelihood tree in these branches differed from the Bayesian tree. External groups correspond to Kentropyx striata (Ks), K. altamazonica (Ka), and K. pelviceps (Kp).
Species Tree, Divergence Times, and Biogeographic Reconstruction
To estimate divergence times between the main K. calcarata lineages and relate them to the events proposed by the hypotheses of diversification, we estimated a species tree with *BEAST v.1.8.0 (Drummond et al., 2007). For this analysis, we treated each lineage recovered with high support in Bayesian inference (concatenated gene tree, see above) like a distinct species’ lineage. We used 277 samples, after having excluded those with missing data for the CYTB gene, and we did not include the SINCAIP gene, in which samples from the J group were not recovered. To calibrate the divergence time estimates, we used the calibration rate of 0.65% change per lineage per million years for mitochondrial markers estimated by Macey et al. (1998) and widely used in squamate reptiles (Glor et al., 2001; Weisrock et al., 2001; Strasburg et al., 2007; Oliver et al., 2009; Torres-Carvajal and de Queiroz, 2009; Gvoždík et al., 2010; Avila-Pires et al., 2012; Pouyani et al., 2012). The rate of the nuclear gene was estimated by the BEAST software relative to the mtDNA rate. We used a coalescent constant size prior and an uncorrelated lognormal relaxed molecular clock, which accommodates the possibility of independent rates of molecular evolution in different branches (Drummond et al., 2007). Analyses were performed with two independent runs for 100 million generations each by sampling trees every 10,000 generations. We checked the ESS values and the convergence of independent runs in Tracer v.1.5 (Rambaut et al., 2018). The mean ages of the nodes were calculated using a burn-in of 2,500. Trees were summarized in a maximum credibility clade (MCC) tree after a burn-in of 10% using the program Tree Annotator and visualized with FigTree 1.4.0 (Drummond and Rambaut, 2007).
We used a probabilistic historical biogeography approach to model ancestral areas in BioGeoBEARS (Matzke, 2013a,b) based on the species tree estimated. We considered five areas recognized as Amazonian areas of endemism–AoEs (Silva et al., 2002), and covering the distribution of Kentropyx calcarata lineages we sampled: Guiana (GU), Belém (BE), Xingu (XI), Tapajós (TA), and Rondônia (RO; Figures 1, 4). We considered all points east of the Tocantins–Araguaia rivers system and Marajó Island as part of the Belém AoE. We did not take into account the presence of single individuals marginally present in an area contiguous to the main area of occurrence of a lineage, e.g., the occurrence of one individual from G and C populations (see section “Results”) in the Xingu AoE, one individual from E populations in the Tapajós, and two in the Guiana AoE. However, we considered the presence of individuals from B group at the Guiana and Xingu AoEs because of its dense occurrence in both areas. We assumed five as the maximum number of ancestral areas and compared, based on likelihoods, the six biogeographic models allowed in BioGeoBEARS: DEC (Dispersal-Extinction Cladogenesis Model), DIVA (Dispersal-Vicariance Analysis), BAYAREA (Bayesian inference of historical biogeography for discrete areas), plus the same models with the “J” (jump dispersal) parameter that comprises jump dispersals: DEC + J, DIVA + J, and BAYAREA + J (Ree et al., 2005; Ree and Smith, 2008; Matzke, 2013a,2014). However, given that the population distribution ranges are non-insular-like and to avoid bias in the analysis [as reported in Ree and Sanmartín (2018)], we considered the best fit model without the “J” parameter.
Historical Demography
The demographic history of each population cluster inferred was investigated using the coalescent multi-locus method in Extended Bayesian Skyline Plots (EBSP), which incorporates stochastic differences in the genealogy of genes, estimating changes in population size over time (Drummond, 2005; Heled and Drummond, 2008). We considered separate substitution models for each partition. The number of generations required for the convergence of sampling parameters was 100 million, sampling trees every 10,000 generations. We followed the same calibration scheme as in the species tree analysis.
Results
Phylogenetic and Population Analyses
The resulting dataset included 2,547 base pairs (bp) (16S = 526 bp, 281 samples; CYTB = 782 bp, 284 samples; DNAH3 = 734 bp, 246 samples; SINCAIP = 505 bp, 197 samples). As expected, the two nuclear markers are less variable than the two mitochondrial markers, and CYTB is the most variable marker (highest number of polymorphic sites – K) (Supplementary Table 3). The best-fit partitioning scheme was obtained by codon to CYTB and by gene to the other markers. The best-fit evolutionary models were GTR + I + G to 16S and CYTB codon 1; K80 + I + G for DNAH3; HKY + I + G to CYTB codon 2 and SINCAIP; and TrN + G to CYTB codon 3.
Phylogenetic trees resulting from Bayesian and maximum likelihood inferences recovered the same lineages (Figure 1 and Supplementary Figure 1) with high posterior probability and bootstrap supports (except in E and H lineages). Both analyses divided K. calcarata into three main clades: J, A–F, and G–I, with clade J, from the northwestern boundary of the Guiana AoE, as sister to the other two (with good support by both methods). The A–F clade, also well supported, grouped all individuals north of the Amazon, and those south of the Amazon and east of the Xingu River. Within this clade, F was recovered with high support as sister to all other lineages (clades A–E), while the relationships between C, D, and E were poorly supported (Figure 1 and Supplementary Figure 1). Clades G–I, which grouped samples from Rondônia and Tapajós AoEs, were well supported only by the Bayesian analysis. The population structure analysis estimated nine population clusters within K. calcarata (Figure 2). Genetic population results agree with the recovered lineages on the phylogenetic tree (Figure 1), except for “F,” not recovered as an independent population, because of the high level of admixture in the samples.
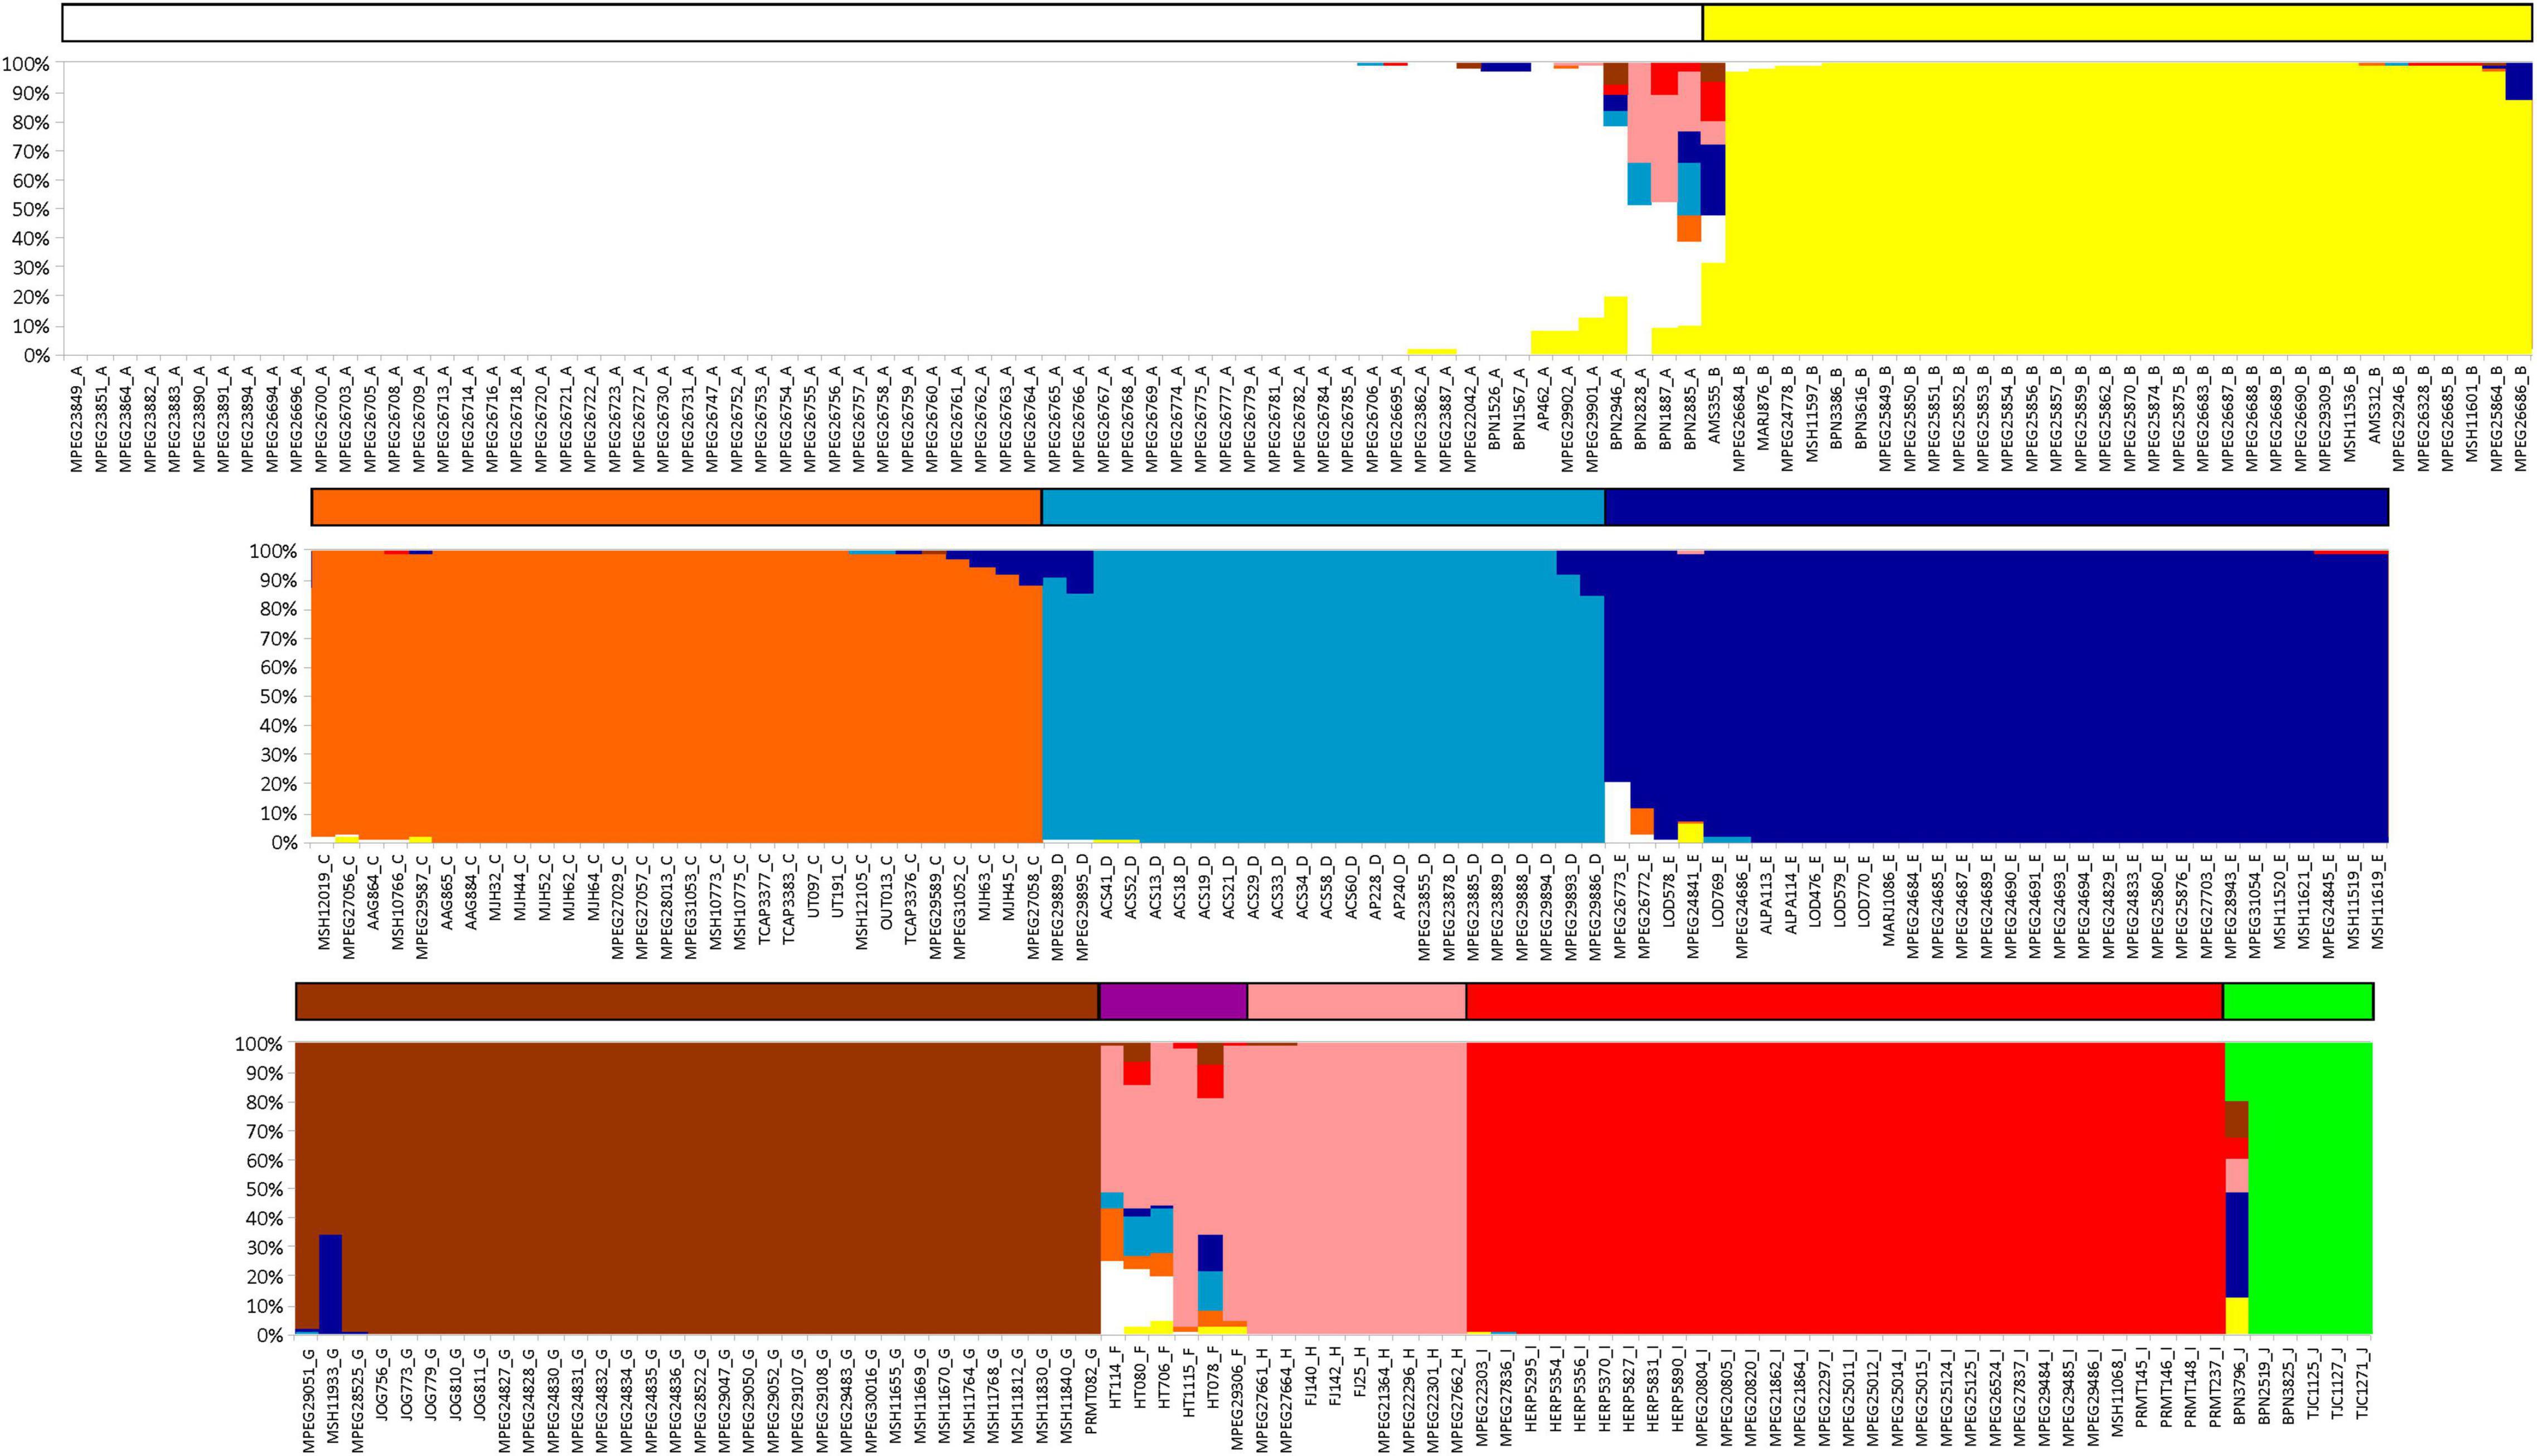
Figure 2. Barplots resulting from populational structure analysis performed on BAPS, based on concatenated mtDNA. Bar colors correspond to the color groups recovered in Figure 1 (upper = clade AB; middle = clade CDE; lower = J + clade GHI + F).
The Amazon River and its tributaries Tapajós, Xingu, and Tocantins largely limit some of these populations, but we detected few shared haplotypes on both margins of the Araguaia–Tocantins (C), Xingu (E, G), and Amazon (B, E) (Figure 1). In addition, we also found distinct and well-supported lineages without any apparent barrier separating them, for example, within the Guiana and Rondônia AoEs (Figure 1).
Mitochondrial haplotype networks show correspondence with the phylogenetic inference (Figure 3). CYTB haplotypes (Figure 3B) are separated by more mutational steps than 16S (Figure 3A) and nuDNA (Figures 3C,D), and they form the only network with no shared haplotypes between groups. Both in CYTB and 16S networks, most haplogroups present a radial pattern. In the case of the two nuDNA, most haplotypes are shared between groups, with hardly any geographic structure observed (Figures 3C,D). A high number of mutational steps in one sample of the H lineage in the CYTB haplotype network were caused by missing data (Figure 3B).
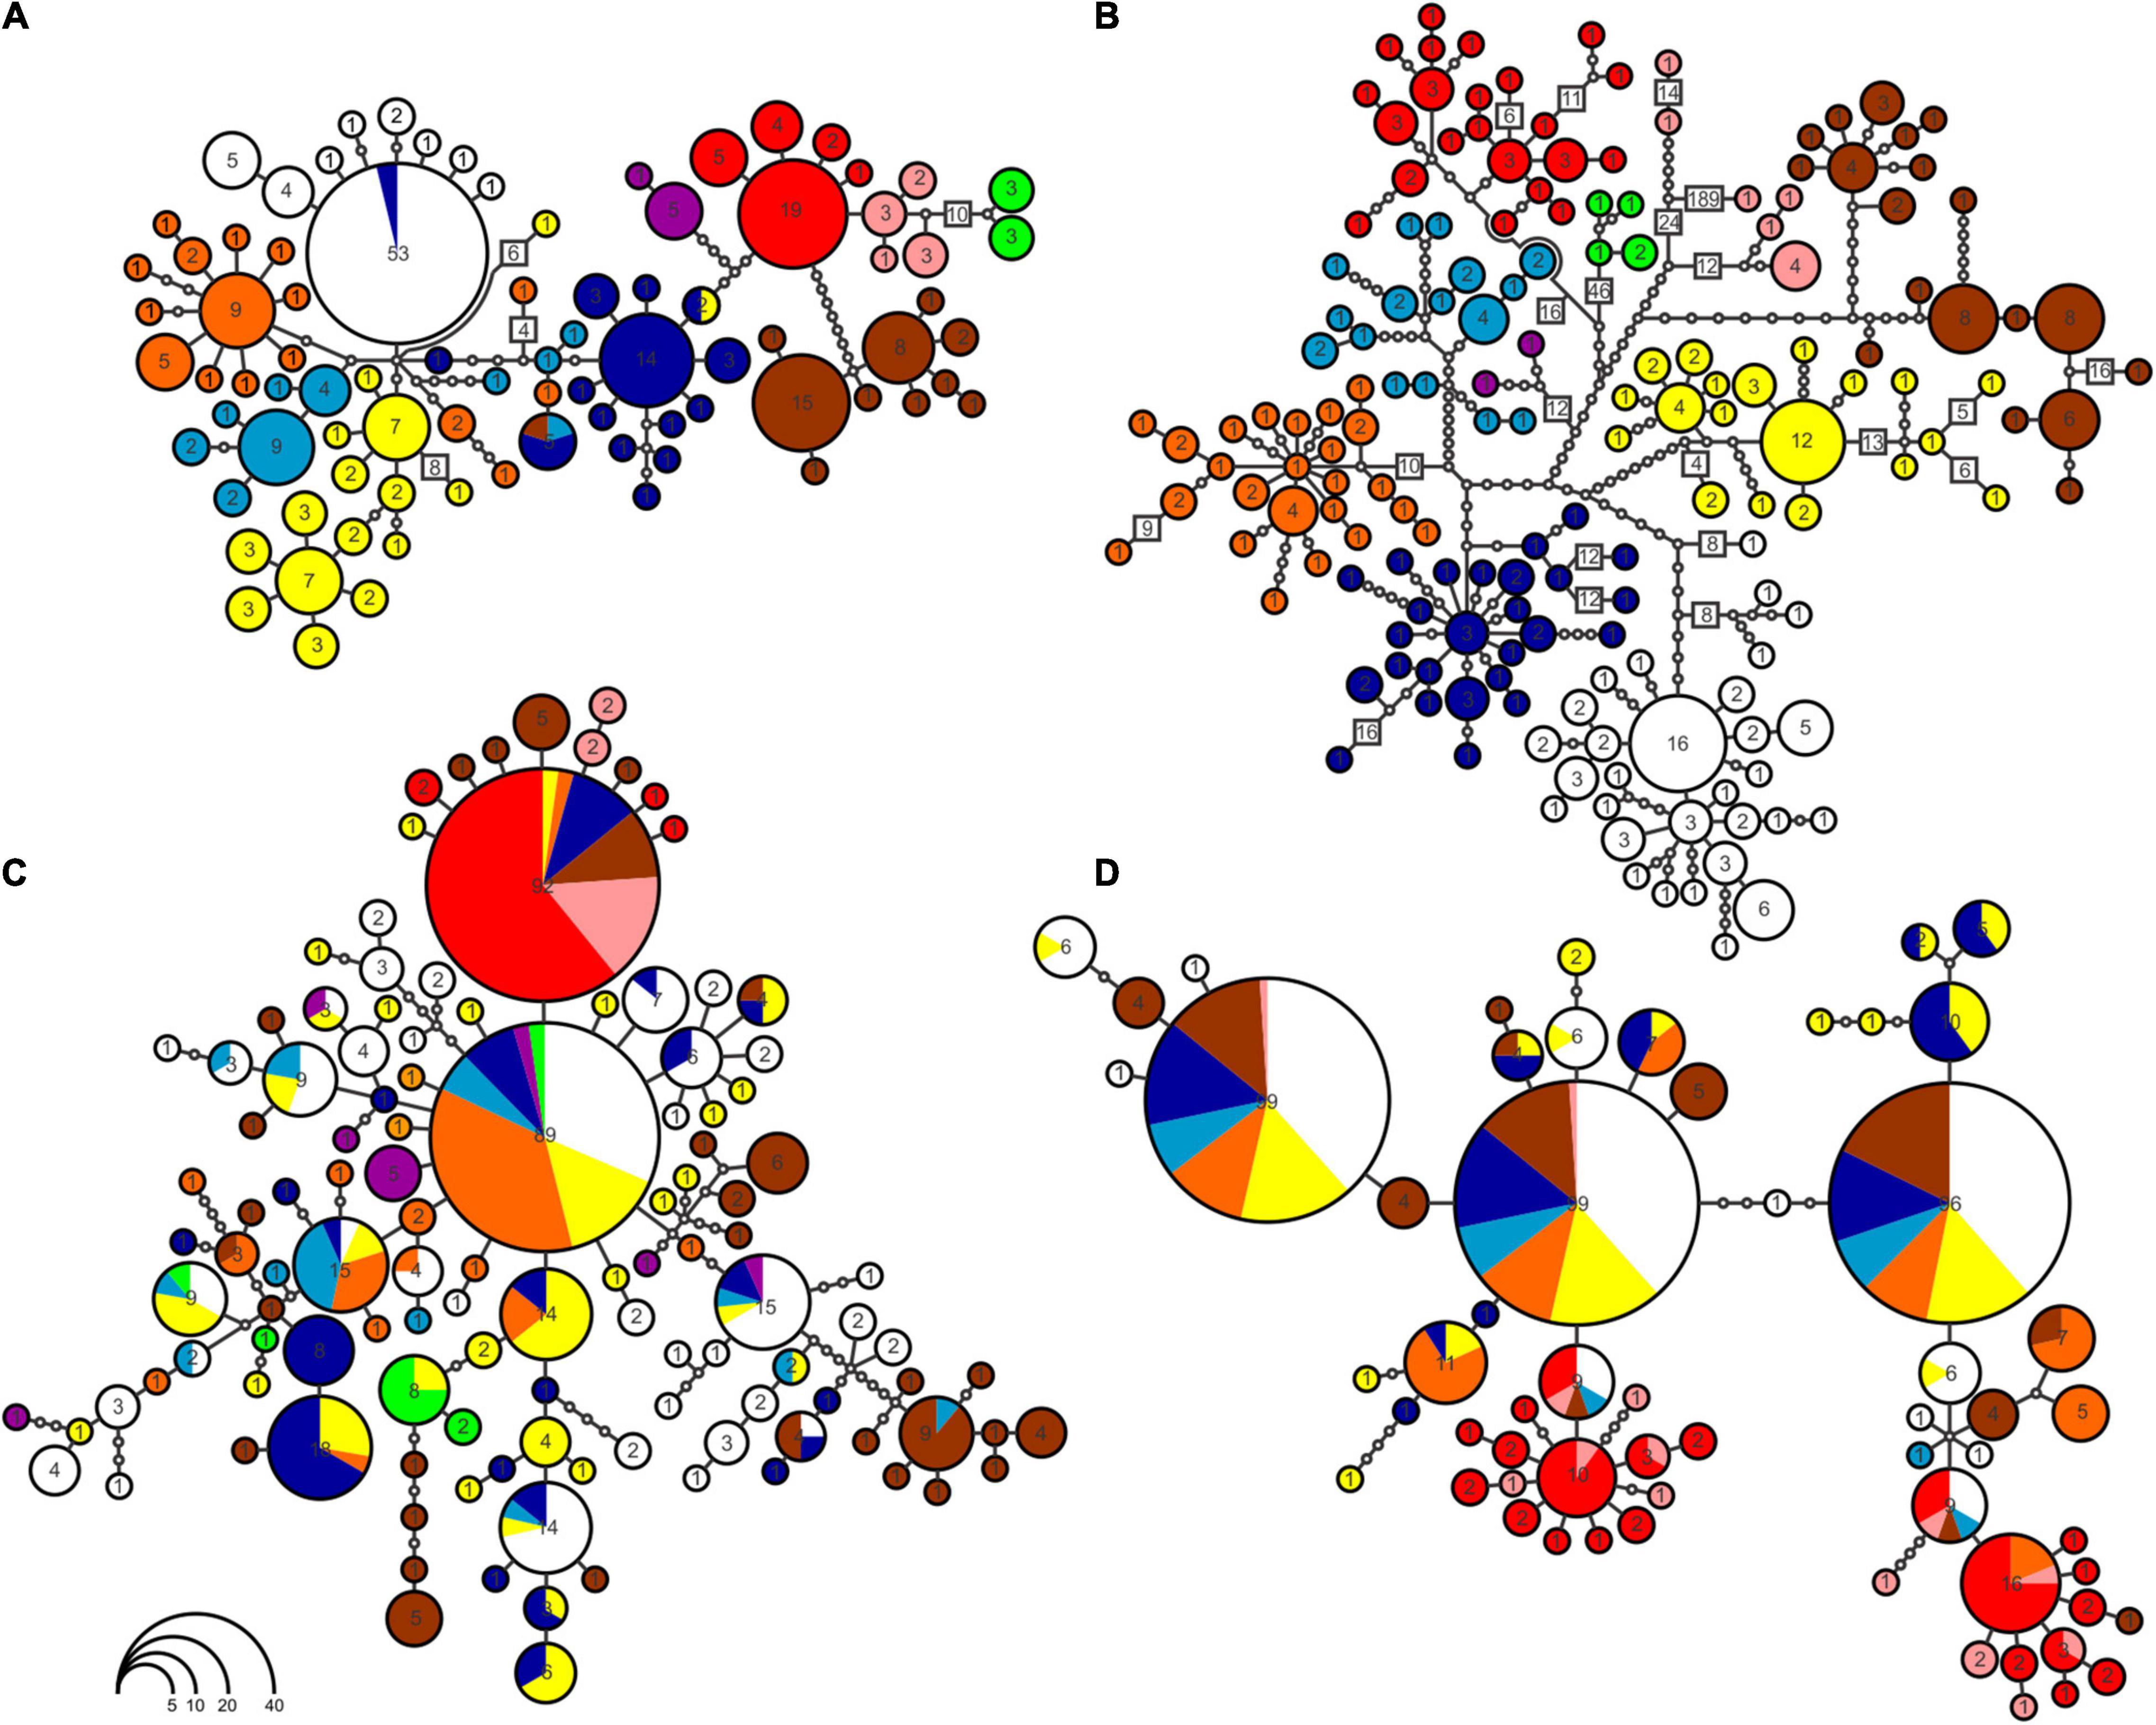
Figure 3. Haplotype networks built for the four markers used in the study: (A) 16S; (B) CYTB; (C) DNAH3; (D) SINCAIP. Not all groups were completely sampled in haplotype networks, due to PCR failure. Colors correspond to same scheme of Figures 1, 2. Circle sizes are proportional to the number of individuals of each haplotype. Intermediate points (smallest circles) refer to the number of mutational steps between populations. To facilitate visualization the total number of mutations was indicated in some segments.
Our results showed, in average, low values (0.001–0.006) of genetic distances within lineages (Supplementary Table 4). The largest genetic distances were within D, G, and H lineages, the lowest within the F lineage. In relation to the distances among groups, we recovered high values between lineages from opposite margins of the Amazon River, ranging from 0.022 (comparing F and H) to 0.058 (J and G). However, lineage J (the most divergent lineage in relation to all others), from the north of Amazon River, showed the largest genetic distances in relation to others from the same margin, such as B (the geographically closest lineage, 0.060) and D (eastern Guiana, 0.059). The smallest genetic distances were recovered within clades A–F from Guiana, Xingu, and Belém AoEs (Supplementary Table 4).
Similarly, AMOVA revealed a larger molecular variance between populations than within them for mtDNA and DNAH3 markers. SINCAIP, in contrast, showed more variation within groups than between groups (Table 1). The total fixation index (Fst) was the highest for the concatenated mitochondrial genes (Fst = 0.83787) (Supplementary Table 5). The AMOVA was performed to evaluate the riverine hypothesis, and it showed higher mtDNA variation levels among populations from different interfluves (Rondônia, Tapajós, Xingu, Belém, west of Essequibo and Trombetas Rivers, Trombetas-Jari interfluve, and east of Jari River) than from within interfluves (Table 1).
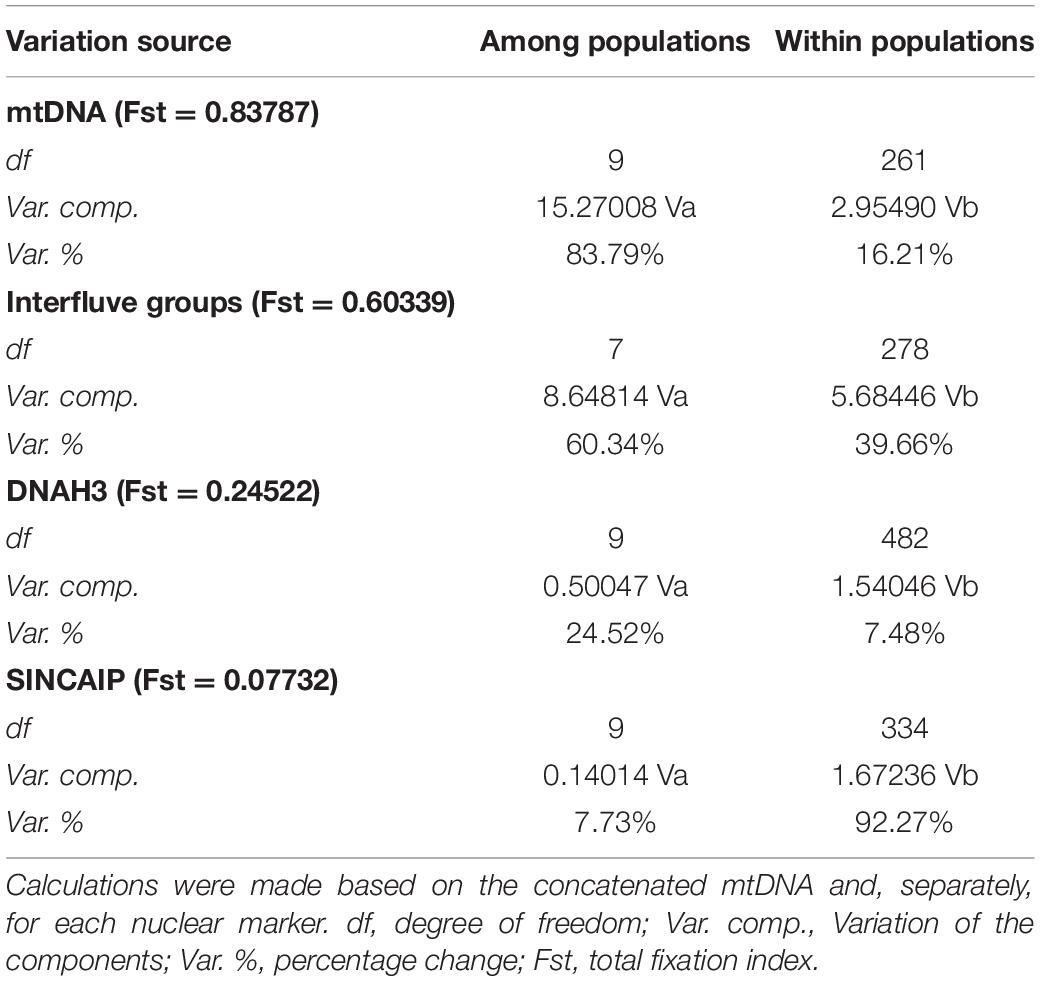
Table 1. Summary statistics of molecular variance (AMOVA) comparing variation among and within phylogenetic clades/populations and comparing variation among and within different interfluve populations.
Population E (restricted to Xingu AoE) showed the highest haplotype diversity for mtDNA and population H (restricted to Rondônia AoE) the highest nucleotide diversity (Table 2). Fst indexes were significant (p ≤ 0.05) for all populations. The strongest genetic structure was detected when comparing population J from northwest of the Guiana AoE with other groups (Supplementary Table 5).
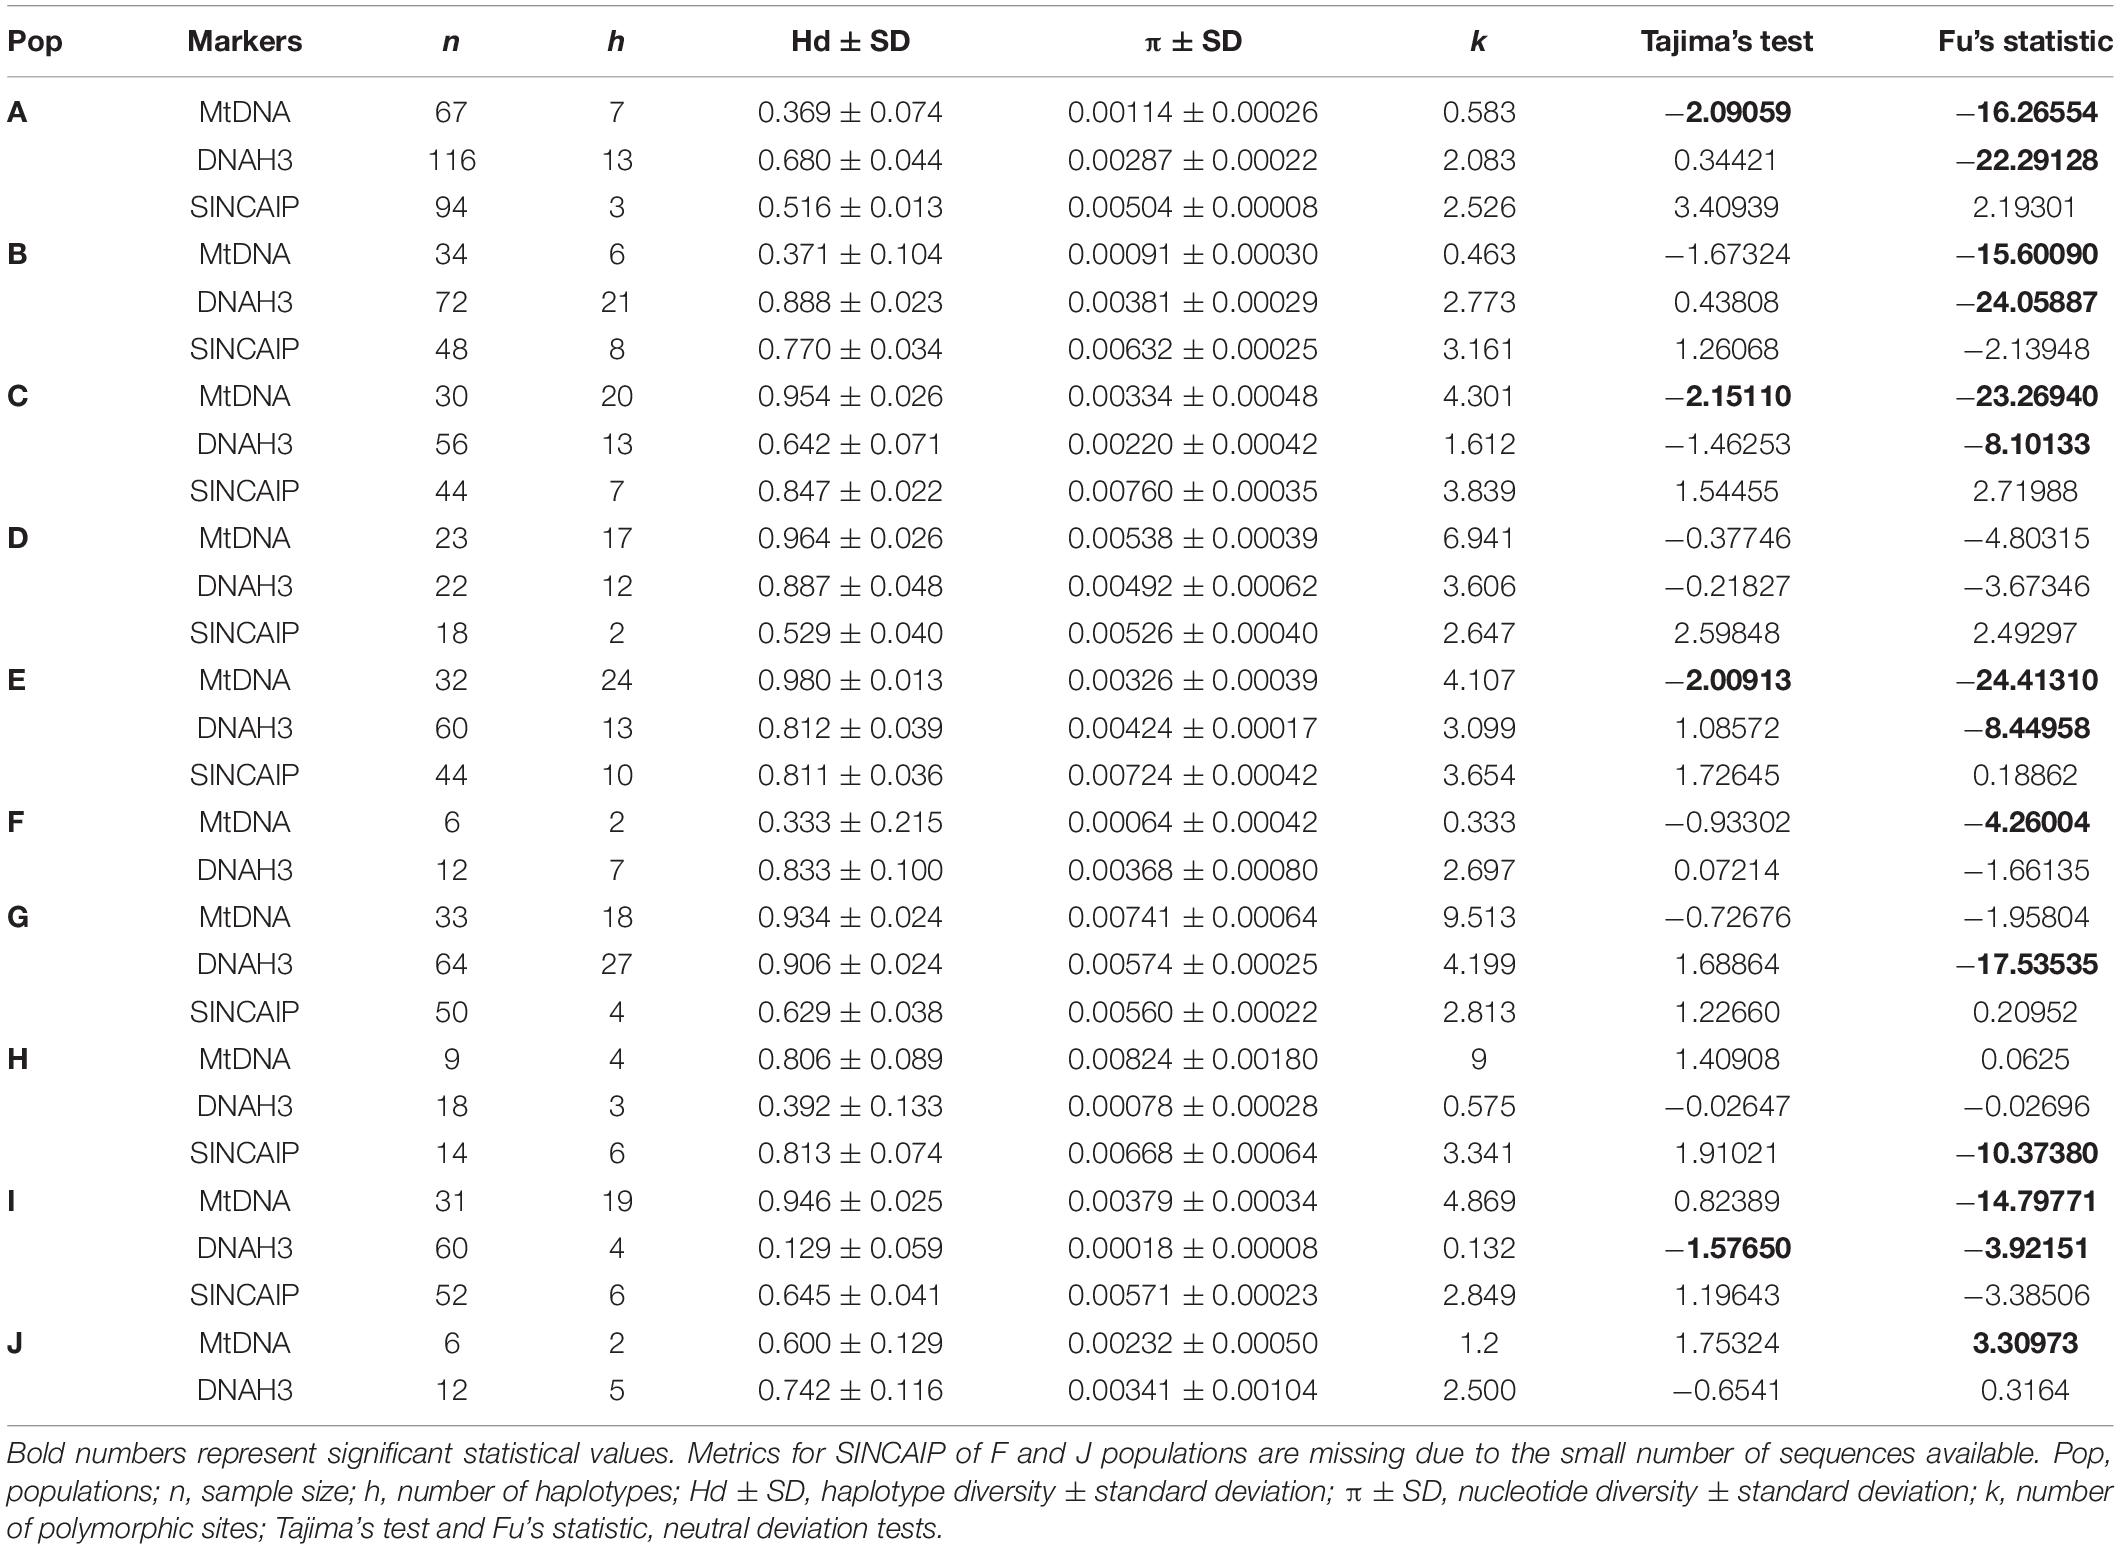
Table 2. Genetic parameters calculated for K. calcarata populations.
Species Tree, Divergence Times, and Biogeographic Reconstruction
According to the inferred species tree (Figure 4), K. calcarata divergence started during Early–Middle Miocene (or even in Late Oligocene) with the initial separation of lineage J from NW Guiana, which is sister to all others. The remaining clades diverged into clades (A–F) and (G–I) in Middle–Late Miocene. Splitting within (G–I) and between F and the remaining lineages in this clade occurred during Pliocene, while these latter lineages diverged more recently, in the Plio-Pleistocene (see confidence intervals in Supplementary Table 6).
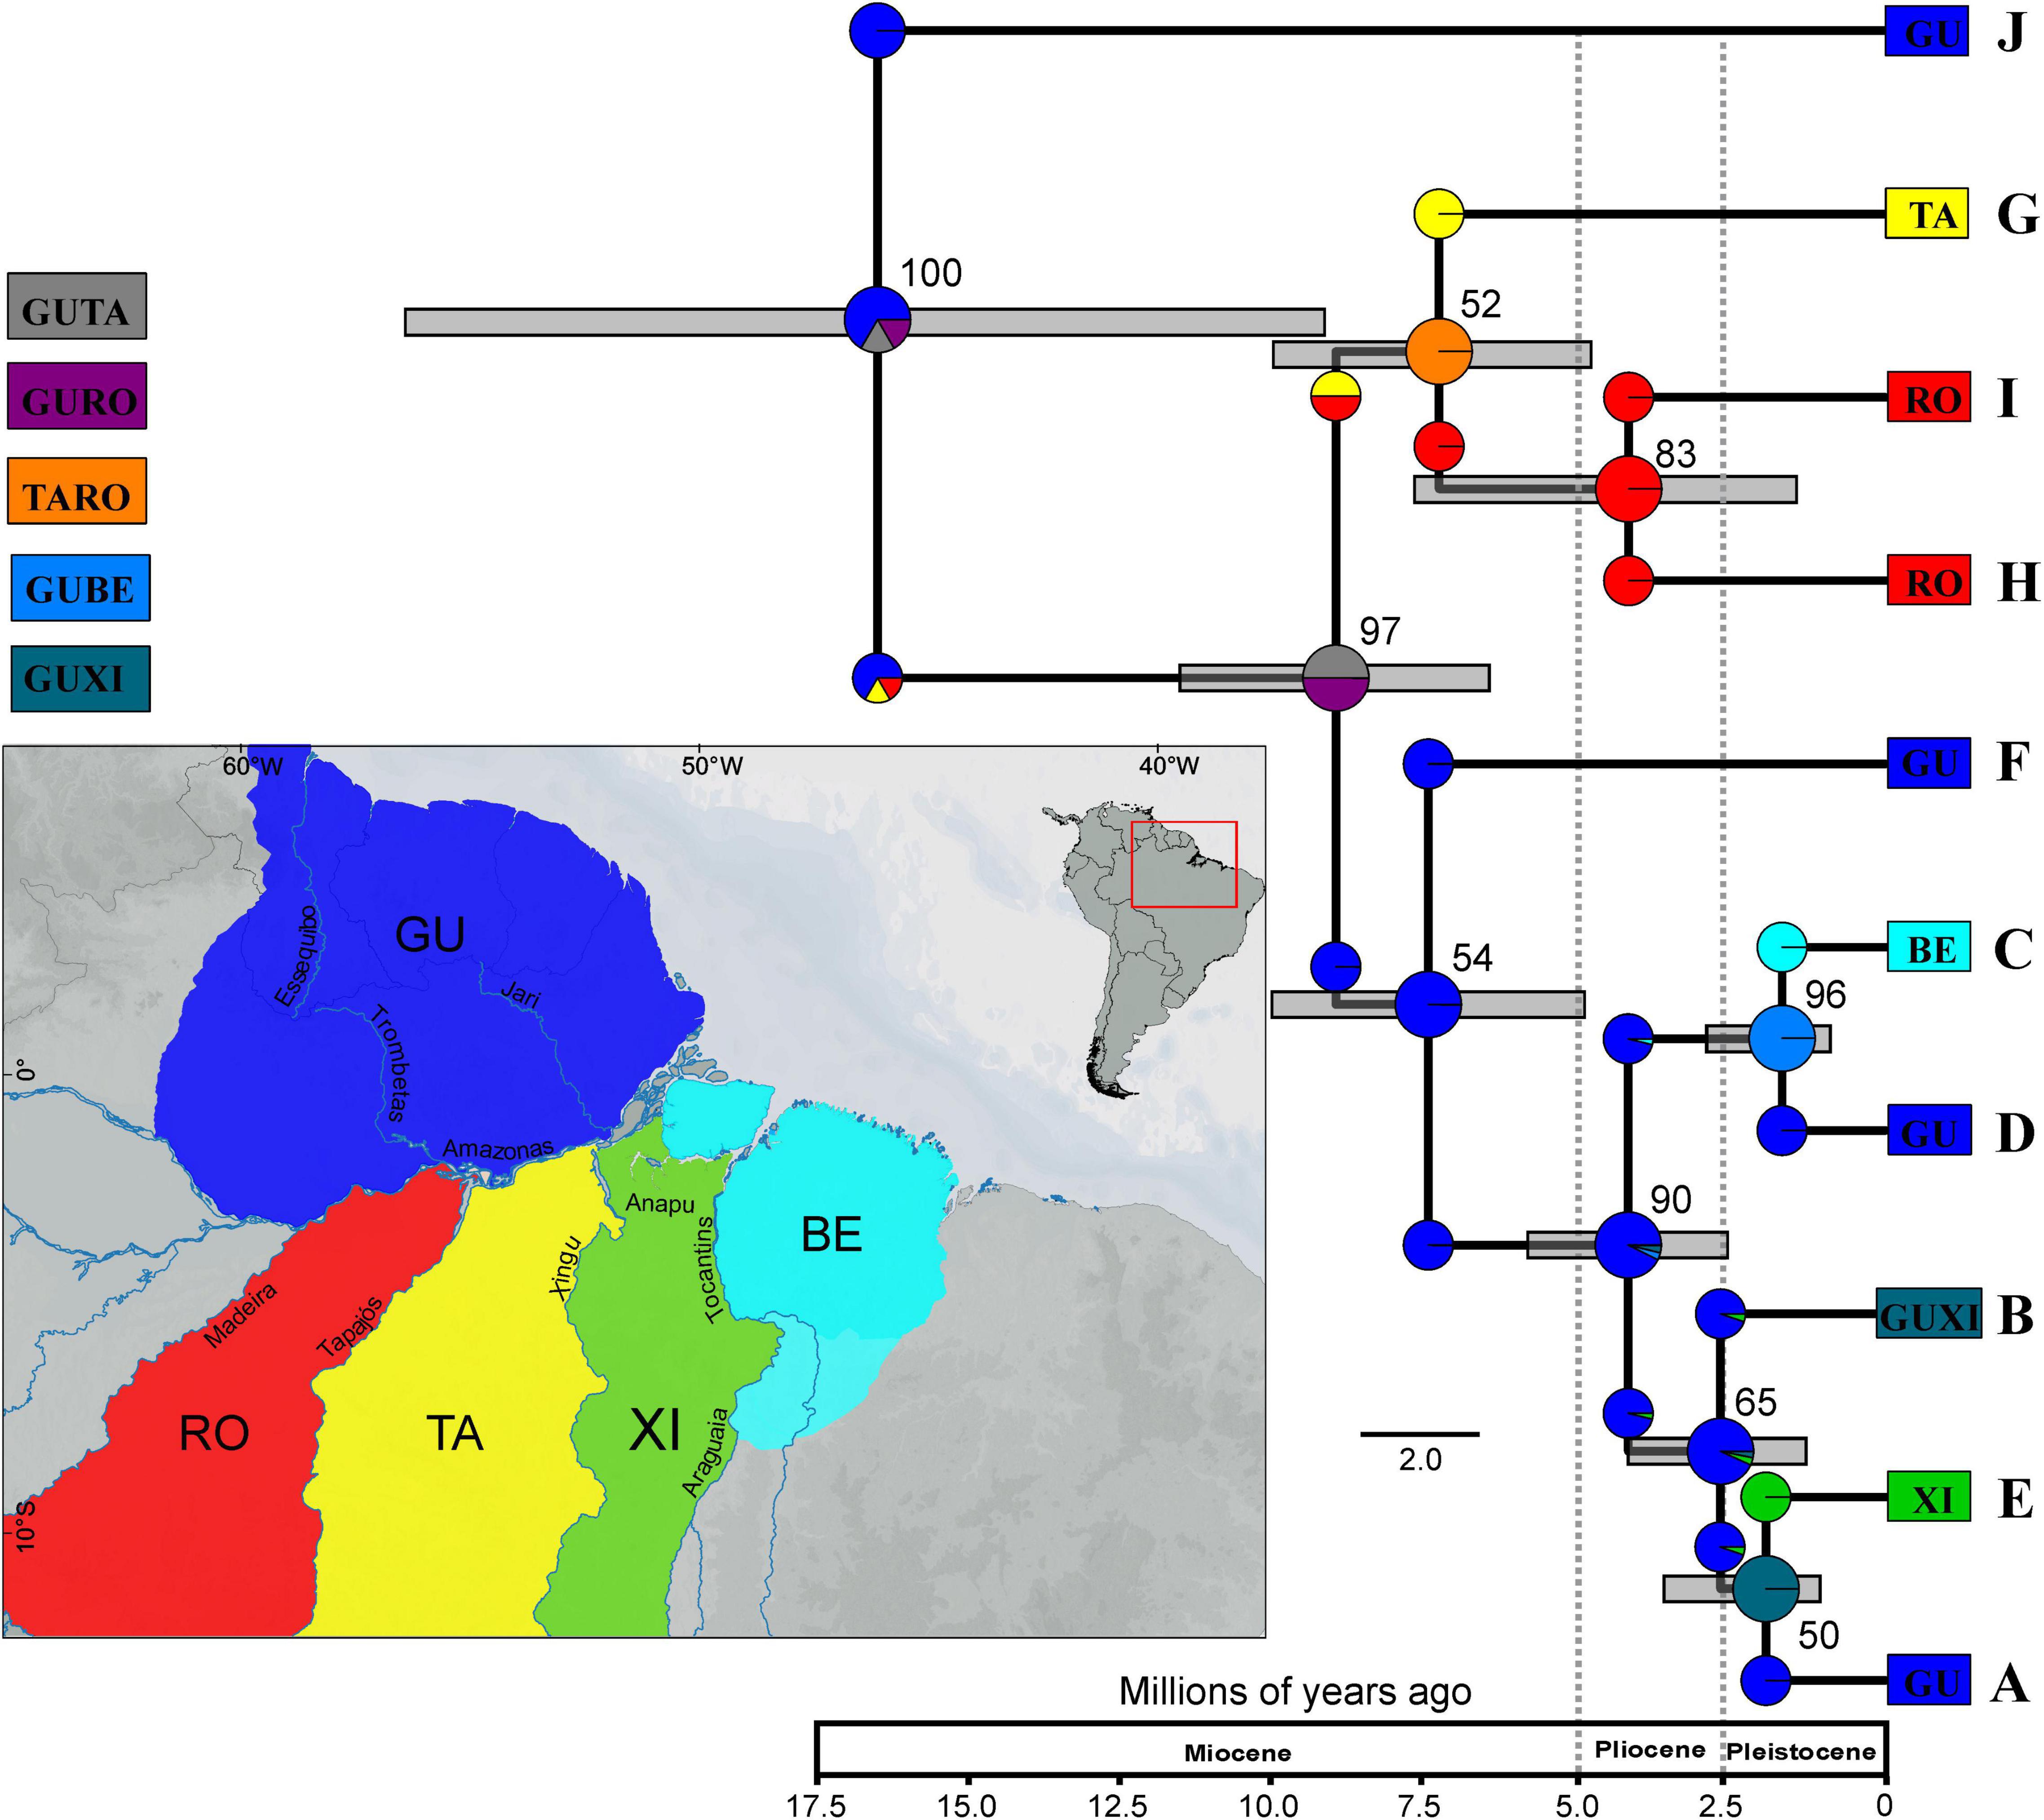
Figure 4. Species tree based on markers CYTB, 16S, and SINCAIP using *BEAST and biogeographic reconstruction inferred using BioGeoBEARS for Kentropyx calcarata. We consider five areas: GU–Guiana (dark blue), BE–Belém (light blue), XI–Xingu (green), TA–Tapajós (yellow), and RO–Rondônia (red). The resulting best-fit model for our phylogeny was DIVALIKE (lnL = –22.06, AIC = 48.13). Clades correspond to populations/lineages defined by phylogeographic analysis. The numbers in the nodes correspond to the values of posterior probability (pp). Color of each group correspond to those of Figures 1, 2. Time scale represents millions of years.
The best model recovered by BioGeoBEARS was DIVALIKE (lnL = −22.06, AIC 48.13) (Table 3). The reconstruction based on the best-fit model is represented in Figure 4. According to the ancestral reconstruction obtained by this model, the Guiana AoE was considered the most probable ancestral range for K. calcarata, with the populations south of the Amazon River in Rondônia + Tapajós, Xingu, and Belém AoEs all originating subsequently by dispersion events from Guiana.
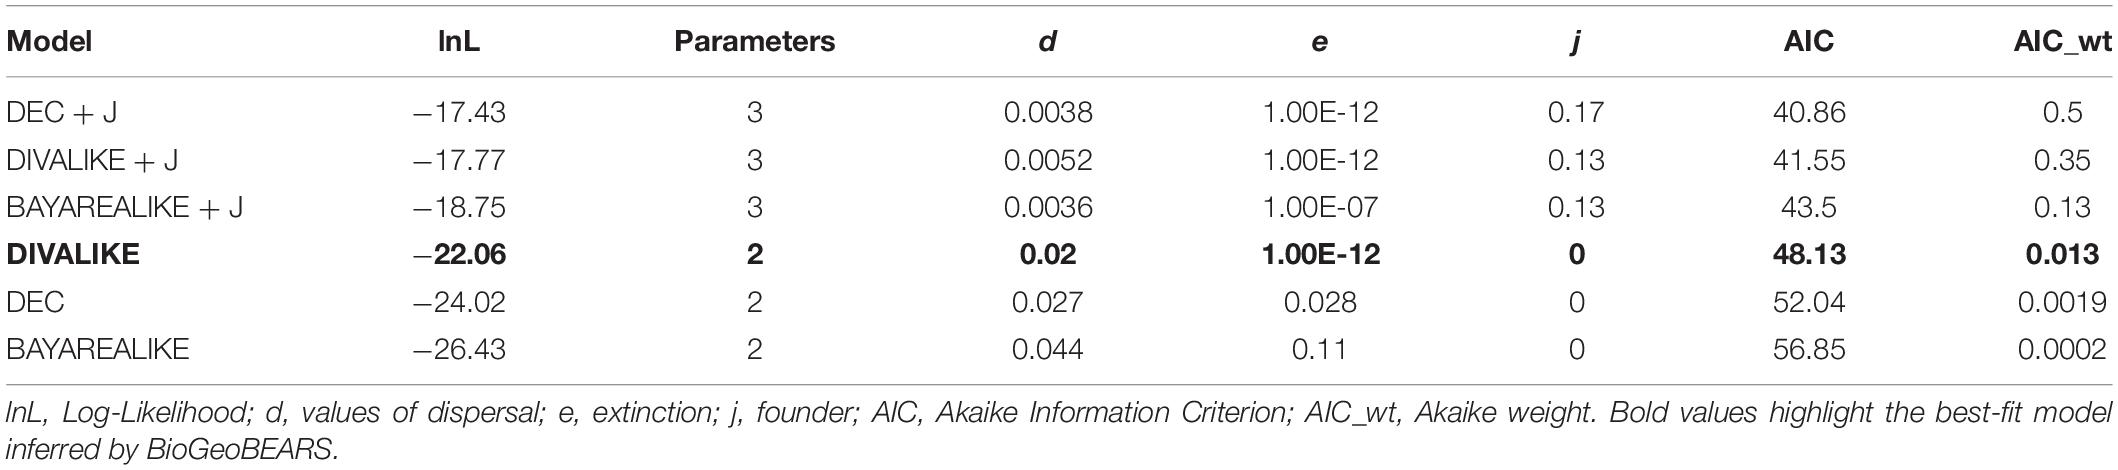
Table 3. Results of BioGeoBEARS analysis for each model.
We detected signs of population expansion for populations/lineages distributed in eastern Amazonia—A, C, E (mtDNA), and I (DNAH3) by Tajima’s test and for all populations, except D and J by Fu’s statistic (mostly mtDNA and/or DNAH3, but only SINCAIP in H; Table 2). The EBSP analyses are partly in agreement with those of neutrality deviations. The C (Belém AoE) and E (Xingu AoE) groups showed signals of a rapid and recent expansion between 0 and 1 Ma (Figure 5). According to this analysis, the other populations did not show significant changes in demography over time, taking into account the wide ranges of confidence in the graphs (Figure 5).
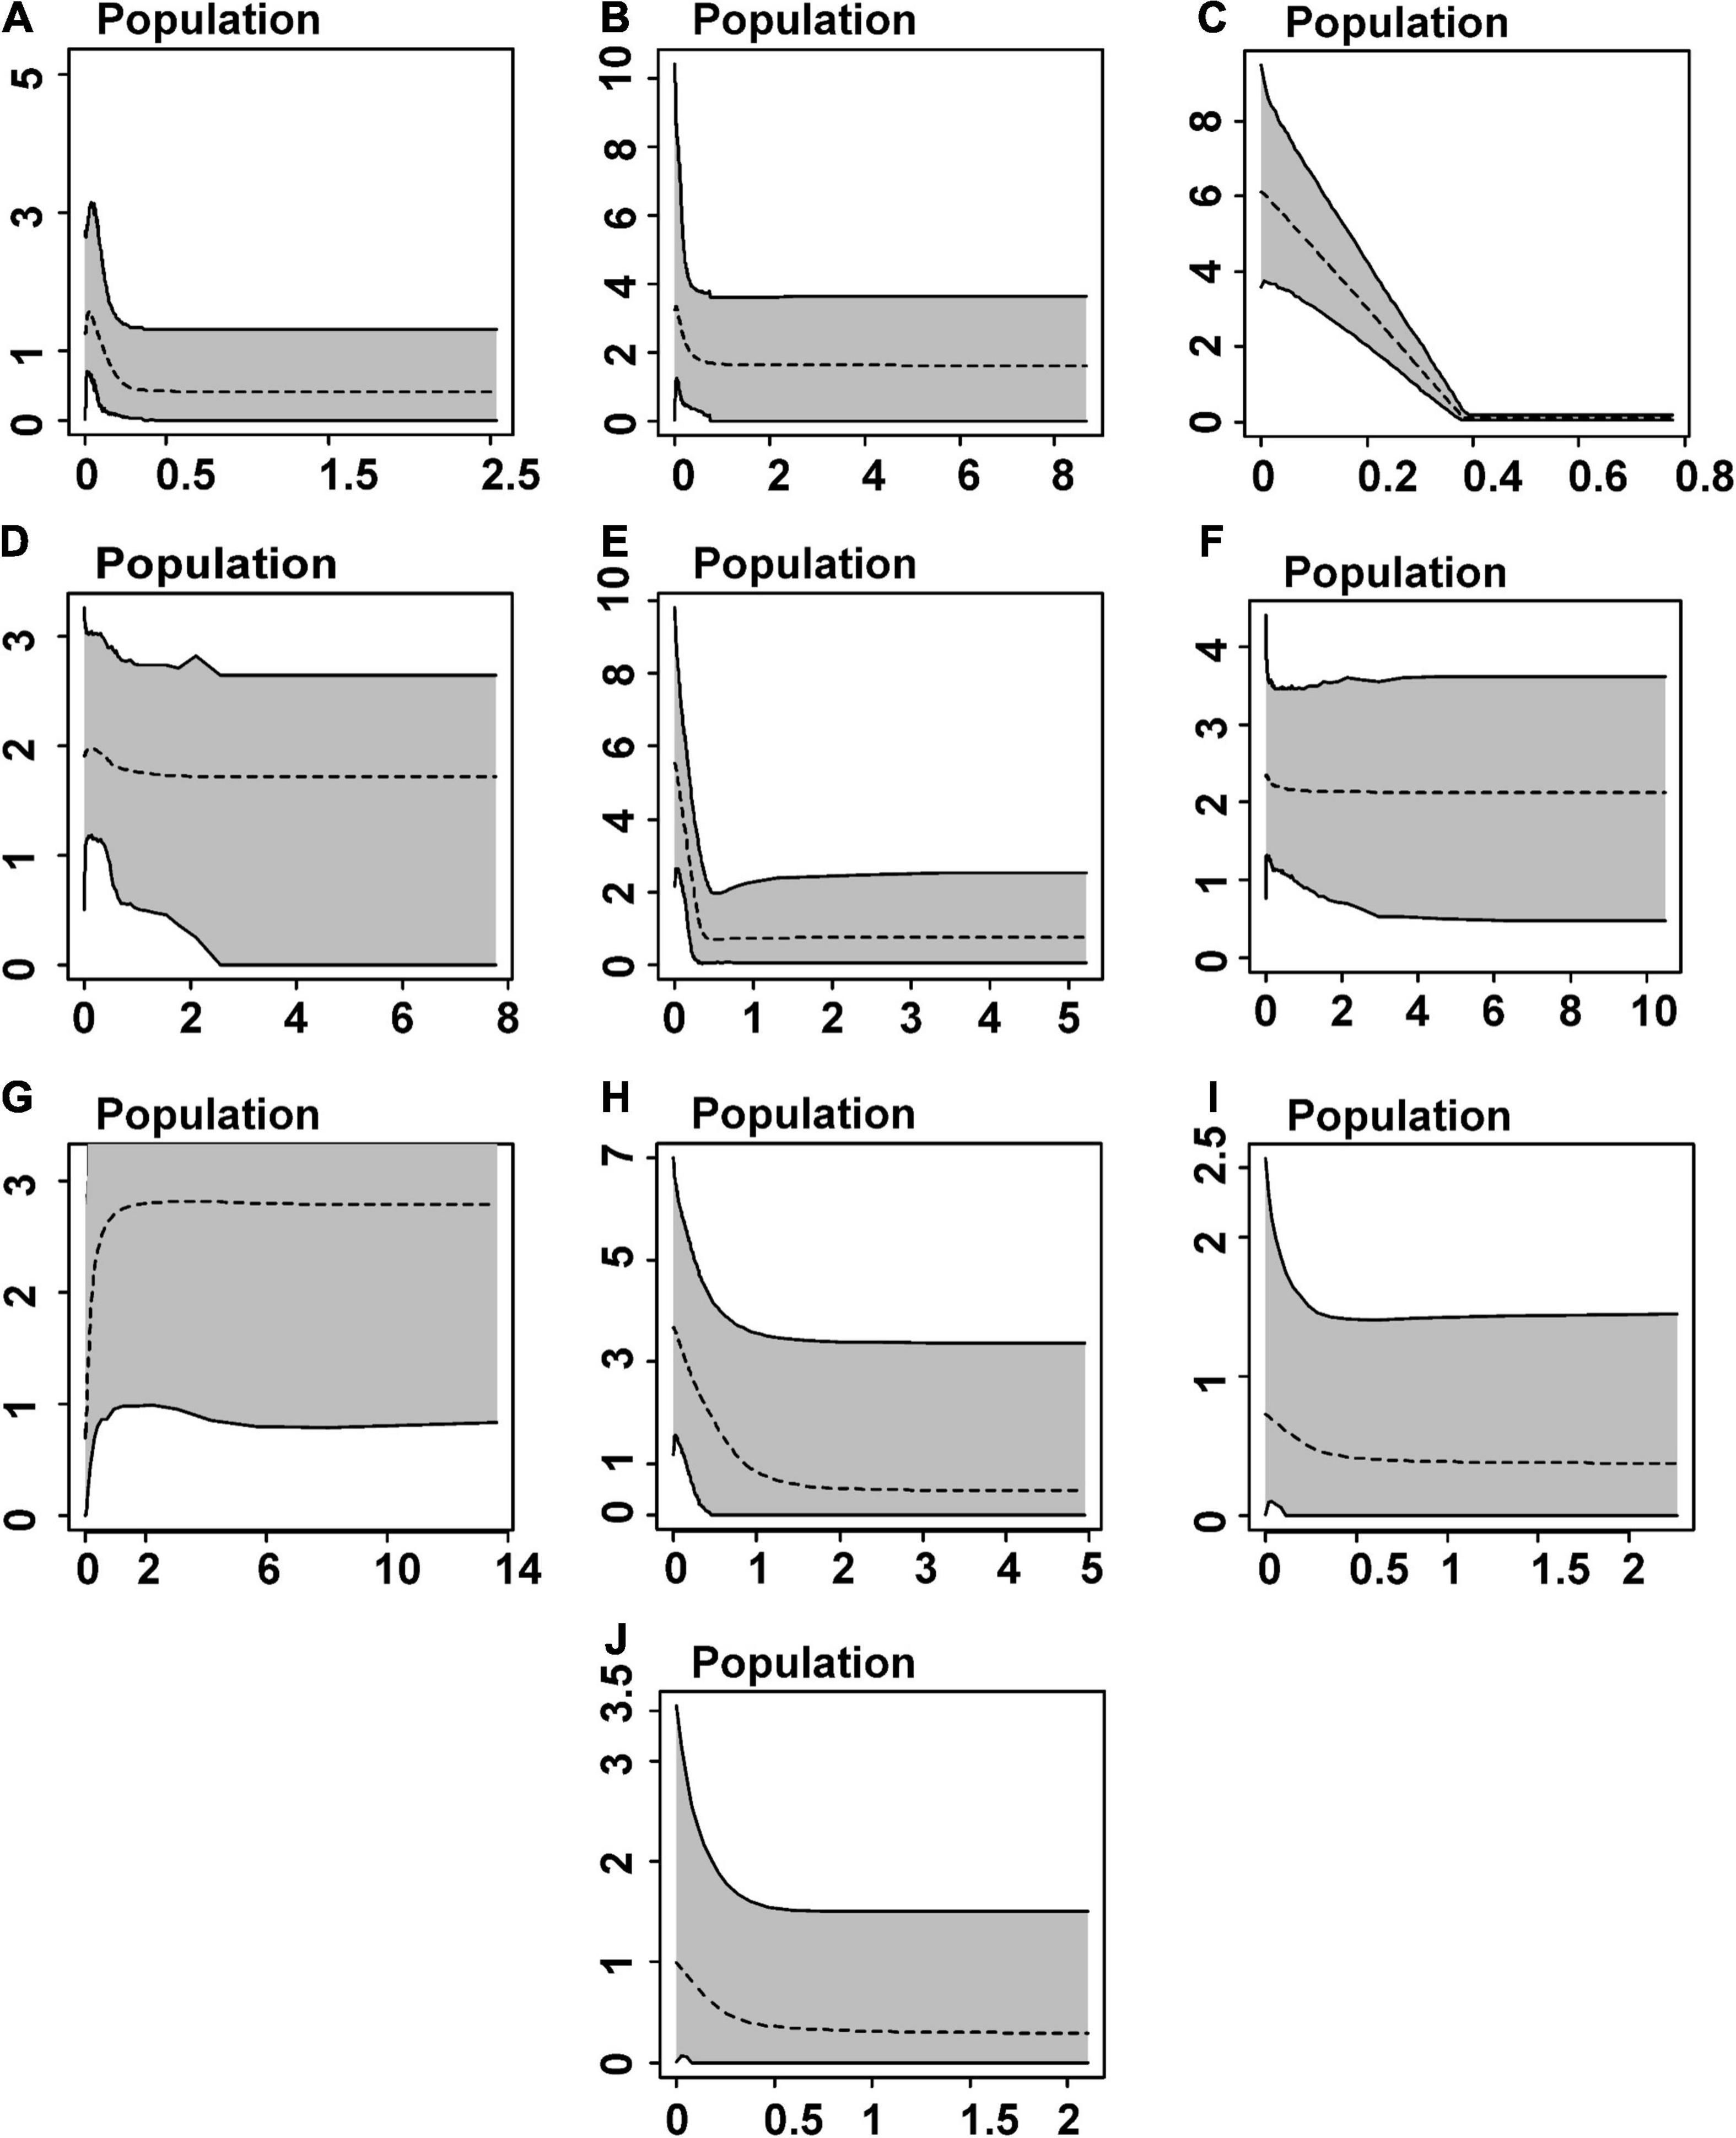
Figure 5. Demographic history estimated by Extended Bayesian Skyline Plots based on mtDNA (CYTB and 16S), and nuDNA (DNAH3 and SINCAIP) for inferred Amazonian populations/lineages of Kentropyx calcarata. Dashed lines represent median values. The gray area corresponds to 95% confidence intervals. X-axis corresponds to time in millions of years before the present, and Y axis represents effective population size scales.
Discussion
Our findings indicate that some of the main Amazonian rivers likely act as diversification barriers among K. calcarata populations. The intraspecific structure showed at least nine K. calcarata lineages in Amazonia, and the phylogenetic analyses recovered ten lineages, which are supported by high Fst indexes and genetic distances (Supplementary Tables 4, 5). Four populations (A, D, F, J) are restricted to the north and other four (C, G, H, I) to the south of the Amazon River (Figure 1). The Tapajós River separates populations G (east margin) from H and I (west margin), the Xingu River separates almost completely populations E and G, and the Tocantins–Araguaia populations C and E (Figure 1). These rivers reduce gene flow and prevent homogenization, although occasionally this barrier effect is incomplete. For example, we observed putative occasional dispersions in some groups (B, C, E, and G) across the Amazon (B and E), Tocantins–Araguaia (C), and Xingu (G and E) rivers (Figures 1, 4). Considering sister groups, the Tapajós River separates G (east margin) and H (Figure 1 and Supplementary Figure 1) or H + I (west margin) (Figure 4), and the Amazon River separates, completely or partially, some larger sister clades. These are the cases where the river itself may have acted (depending also on the time scale, discussed below) as a primary barrier, leading to the observed population divergence. On the other hand, strong genetic differences detected in some parapatric K. calcarata populations within Guiana and Rondônia AoEs (Supplementary Tables 4, 5 and Figure 1) indicate that the riverine barriers cannot exclusively account for the diversification pattern in these interfluvial areas.
Diversification of K. calcarata and Implications for Eastern Amazonian Evolution
Overall, our results support older divergence times (Supplementary Table 6) than previously found in genus-level phylogenetic studies including K. calcarata sampling (Werneck et al., 2009; Sheu et al., 2020). Differences in sampling density and markers used possibly contributed to these time dissonances. The average splitting time in Sheu et al. (2020) between K. calcarata, K. pelviceps, and K. altamazonica occurred more recently (late Miocene) than our findings for the most ancient Amazonian K. calcarata population (J) in the early Miocene (Figure 4). However, the wide confidence intervals in the species tree (Figure 4) could be hiding a more recent average splitting time for J population. Alternatively, the recent average time of splits among the species of the calcarata group could be overestimated by the confidence intervals of the species tree in Sheu et al. (2020), and, in this way, the splitting time between K. calcarata and their sisters actually would be more ancient. This hypothesis supports the Guiana group J origin during the middle Miocene and the splits in A–F and G–I clades during the late Miocene. In addition, the large divergence in J lineage (Supplementary Tables 4, 5) encourages further investigations, using integrative data of morphology and analyses of species delimitation, to access the possibility of this Guianan population being under a speciation process.
According to our results and previous studies, an ancestral origin of K. calcarata in the Guiana AoE by Early–Middle Miocene is estimated, with the first intraspecific divergence (between the population from northwestern Guiana AoE, here represented by the green group–J, and all others) occurring by Middle Miocene (Figure 4). During the Miocene, recurrent tectonic activities caused marine incursions, trigged Andes uplift phases, caused the formation and subsidence of geological arches and formation of lacustrine and swampy environments (Hoorn et al., 1995, 2010; Caputo and Soares, 2016). An episode of tepuis uplifting, whose eastern border is close to the current area of occurrence of the J lineage, is also believed to have occurred during the Late Tertiary (see Kok, 2013). However, there is no sufficiently detailed information on the geomorphological history of this area to develop further the possibility that this historical event was casual for the divergence of lineage J. Further studies addressing species limits under integrative approaches are advised to address the possibility of this lineage being under an incipient speciation process.
The second division within K. calcarata separated the A–F and G–I clades during the Late Miocene (Figure 4 and Supplementary Table 6). The topology, timing, and geographic distribution of these lineages is in agreement with the possibility that it was induced by geomorphological events related to the reversal and establishment of the Amazon River’s present course (Figueiredo et al., 2009; Hoorn et al., 2010; Caputo and Soares, 2016; Bicudo et al., 2019, Bicudo et al., 2020). Considering the biogeographic scenario reconstructed, probably at that time K. calcarata had a range limited to the western part of its present Guiana distribution. It might have happened as well that its southern limit was such that part of it became “trapped” south of the new course of the Amazon, in the area now recognized as the Rondônia AoE. In this scenario, the Amazon River would have acted as a primary barrier between former continuous populations in the western part of the current distribution of this species in Amazonia.
South of the Amazon River, the species would have spread south and east across the Tapajós River, leading to the formation of lineages (G–I) still during the Late Miocene (Figure 4 and Supplementary Table 6). It is possible therefore that the Tapajós River has acted as an effective barrier between one or both populations to the west (H, I) and the east (G). The Tapajós River limits the distribution of several species of squamates and amphibians (Moraes et al., 2016, 2020). On the other hand, the mouth of the Tapajós River is comprised of a set of geological faults dating to the Pleistocene-Holocene, that form multiple channels incorporated in the present river configuration, at its lower course (Costa et al., 2001). This could have facilitated occasional gene flow between populations from opposite margins, what would explain the uncertain phylogenetic arrangements among lineages from Rondônia and Tapajós AoEs in the gene and species trees (GH-I and G-HI, in respectively, Figures 2, 4).
West of the Tapajós River, two partially overlapping K. calcarata lineages are present within the Rondônia AoE (H and I) in the absence of apparent geographic barriers (Figure 1). Our dataset is insufficient to suggest monophyly between the two populations of this region or to suggest any hypothesis about the cause of this split. However, signs of population expansion were detected at the Rondônia AoE in lineage H by the nuclear gene SINCAIP (not included in the species tree), the less variable marker, and in the lineage I by the other nuclear gene, DNAH3, which could be linked to the process that led to their divergence and possible secondary contact within Rondônia AoE. This pattern reinforces the complexity of this region, which is considered heterogeneous according to the distribution of other organisms (Geurgas and Rodrigues, 2010; Wilkinson et al., 2010; Fernandes et al., 2013; Souza et al., 2013; Thom and Aleixo, 2015). Local factors acting within interfluves and AoEs, such as local adaptation to ecological selective forces, could also help explain the occurrence of distinct lineages at Rondônia AoE in the absence of apparent geographic barriers (Ortiz et al., 2018). Additional sampling and studies about ecological adaptation and secondary contact are needed to further access this possibility.
The A–F clades occupied originally only the Guiana AoE, where the initial splits within K. calcarata occurred (Figures 1, 4 and Supplementary Figure 1). The westernmost lineage (F) from north of the Amazon River diversified from the other Guianan populations by the Late Miocene (Figure 4 and Supplementary Table 6), possibly due to landscape adjustments following the onset of the transcontinental Amazon River. Later, during the Plio-Pleistocene, other Guianan K. calcarata populations (A, B, D) were established. Costa et al. (2001) analyzed the geological faults present along the Amazon River in different periods, including the Late Tertiary and Quaternary, and their influence on the landscape. They recognized both the existence of different domains along the Amazon Basin, as well as temporal variation. Together with surface topographic rearrangements, mantle dynamics were also the key for the formation of the present Amazon River drainage system (Bicudo et al., 2019, Bicudo et al., 2020). These landscape dynamics could have led to the splitting of some populations north of Amazon River, promoting vicariant events and eventually allowing eastward dispersal that could have been congruent with the inferred eastward expansion of terra firme forests and várzeas (Bicudo et al., 2019). On the other hand, these populations are currently distributed without evident or strong physical barriers separating them, and they might as well have been influenced by changes due to climatic fluctuations (glacial and interglacial periods) during the Plio-Pleistocene, e.g., in the vegetation and river characteristics, in a way that they would act as temporary barriers.
Two populations (B and C) reach the southern margin of the Amazon River in the Xingu and Belém AoE, respectively (Figure 1). According to our biogeographic reconstruction, these lineages would have crossed the Amazon River probably by dispersal (Figure 4) during Plio-Pleistocene. Even though the Amazon River seems to be a difficult barrier to overcome, other lizard species apparently crossed the river close to its mouth (e.g., Arthrosaura kockii and Tretioscincus agilis; Ávila-Pires, 1995), the same as with other organisms. For example, Ayres and Clutton-Brock (1992) showed that in primates, the similarity of species composition between margins increases toward the mouth of the Amazon. This is an area dense with islands that was certainly affected by sea-level changes during the Pleistocene (Miller et al., 2011), which may have facilitated biotic dispersal during times of low sea level. Moreover, Marajó Island, at the mouth of the Amazon, is a result of tectonic movements that occurred during the Pleistocene/Holocene (Rossetti and Valeriano, 2007), showing that this area was still geologically active in recent times. These movements may have separated previously continuous populations or even facilitated passive dispersal, as for example, in E population. Finally, in lineages B and E there are signs of recent (approximately 0.4 Mya) population expansion, which could have been related to the ecotonal character of the region and the expansion of the forest toward the Caatinga and Cerrado during interglacial periods (Batalha-Filho et al., 2013).
Occasional haplotype sharing across the Xingu River was also detected near the area of the Xingu Great Bend (black arrow in Figure 1). This is a segment where the river makes a sharp U-bend to the east, suggesting that in some time of its history it ran straight northward, later being displaced (Sawakuchi et al., 2015). If this is true, it may have allowed the passive migration from the right (east) margin to the left (west) margin (but not in the opposite direction). Moreover, this is a rocky area, and some rocks become apparent during drier periods of the year. In extremely dry years, it may have allowed an occasional crossing of animals through temporary land bridges.
In our reconstruction, we considered the time of the establishment of the Amazon River system proposed by Hoorn et al. (1995, 2010), Figueiredo et al. (2009), Caputo and Soares (2016), and Albert et al. (2018). Other authors (e.g., Latrubesse et al., 2010; Rossetti et al., 2015) postulate that the Amazon River reversal occurred more recently. If this is correct, our scenarios would have to be reconsidered. In general, we consider that our data, especially those of the initial splitting of the species, seem to be more congruent with the older dates for the formation of the present Amazon River system.
The ten lineages of K. calcarata recovered in this study were mainly restricted to the major interfluves in eastern Amazonia. Despite the rivers acting as maintainers (and some of them as sources) of population diversity, we also reinforce the effects of climate change during the Quaternary as an actual driver of K. calcarata diversification. During this period, when more humid forests probably alternated with a mosaic of humid and dry forests, respectively, in interglacial and glacial periods, we detected expansions, mainly in easternmost populations (from Xingu and Belém AoEs) (Figure 5). Climatic fluctuations would have propelled populational expansions and the rivers of the Brazilian Shield then sealed the diversification processes by forming strong secondary barriers in the most downstream regions.
This study represents a substantial effort to evaluate the phylogeography of K. calcarata, encompassing a broader geographical sampling in a number of individuals and of markers than any study previously performed with this species. We hope that it also helps to define protection measures for the species, considering that some of its populations were recently detected to be vulnerable to the effects of the ongoing global warming, particularly in eastern Amazonia (Pontes-da-Silva et al., 2018). As the next steps, we suggest testing more deeply (using genomic markers, for example) the different geographic scenarios in eastern Amazonia to better understand the gene flow and the magnitude of climatic and geological events in the diversification of Amazonian lineages of K. calcarata; and to incorporate samples from the Atlantic Forest to understand the evolutionary history of this species as a whole.
Data Availability Statement
The data presented in the study are deposited in the GenBank Nucleotide Database, under accession numbers ON160096 – ON160830 and ON025286 – ON025538 can be found in the Supplementary Material.
Ethics Statement
Ethical review and approval was not required for this study in accordance with the local legislation and institutional requirements.
Author Contributions
ÁAC, TCÁ-P, and FPW conducted study design and sampling. ÁAC made all laboratory procedures and figures and maps, and performed the analyses. All authors contributed to writing and reviewing.
Funding
This manuscript was generously funded by Conselho Nacional de Desenvolvimento Científico e Tecnológico–Brazil (CNPq) (project 475559/2013-4 and 563355/2010-7); Fundação de Amparo à Pesquisa do Estado do Amazonas-FAPEAM (062.00665/2015 and 062.01110/2017); Fundação Amazônia Paraense de Amparo à Pesquisa–FAPESPA (ICAAF 01112012) through Sisbiota Herpeto-Helmintos project. ÁAC was supported by (CNPQ) master’s scholarship (n° 132164/2013-2). FPW was supported by a CNPq research fellowship (PQ 311504/2020-5); Partnerships for Enhanced Engagement in Research from the United States National Academy of Sciences and United States Agency for International Development (PEERNAS/USAID AIDOAA-A-11-00012); Serrapilheira Institute (grant number Serra-1811-25857); L’Oréal-UNESCO-ABC Para Mulheres na Ciência–Brazil (2016), and L’Oréal-UNESCO For Women in Science awards (IRT 2017). TCÁ-P was supported by a CNPq research fellowship (PQ 312674/2013-9).
Conflict of Interest
The authors declare that the research was conducted in the absence of any commercial or financial relationships that could be construed as a potential conflict of interest.
Publisher’s Note
All claims expressed in this article are solely those of the authors and do not necessarily represent those of their affiliated organizations, or those of the publisher, the editors and the reviewers. Any product that may be evaluated in this article, or claim that may be made by its manufacturer, is not guaranteed or endorsed by the publisher.
Acknowledgments
We thank the Museu Paraense Emílio Goeldi (MPEG) for logistics of the Laboratório Multidisciplinar de Biologia Molecular to develop this work. We gratefully acknowledge Geraldo Rodrigues de Lima Filho for DNA sequencing and help to perform some analyses, and Tânia Fontes Quaresma for assistance and discussion about populational structure analyses with BAPS. We also thank the following institutions for providing tissue samples: Coleção de Herpetologia Osvaldo Rodrigues da Cunha (MPEG) and Coleção de Anfíbios e Répteis (INPA-H) e de Recursos Genéticos (INPA-HT) do Instituto Nacional de Pesquisas da Amazônia (INPA).
Supplementary Material
The Supplementary Material for this article can be found online at: https://www.frontiersin.org/articles/10.3389/fevo.2022.777172/full#supplementary-material
Supplementary Figure 1 | Maximum likelihood concatenated (mtDNA and nuDNA) gene tree. The numbers represent the bootstraps nodal supports. Phylogroups letter annotations correspond to the same of obtained by Bayesian Inference (Figure 1).
References
Albert, J. S., Val, P., and Hoorn, C. (2018). The changing course of the Amazon River in the Neogen: center stage for Neotropical diversification. Neotrop. Ichthyol. 16, 1–23. doi: 10.1590/1982-0224-20180033
Antonelli, A., Quijada-Mascareñas, A., Crawford, A. J., John, M., Velazco, P. M., and Wüster, W. (2010). “Molecular studies and phylogeography of Amazonian tetrapods and their relation to geological and climatic models,” in Amazonia Landscape and Species Evolution: A Look into the Past, eds C. Hoorn, F. Wesselingh, and H. Vonhoff (Oxford: Blackwell Publishing), 386–404.
Ávila-Pires, T. C. S. (1995). Lizards of Brazilian Amazonia (Reptilia: Squamata). Leiden: Zool. Verhandelingen Press 299, 1–706.
Avila-Pires, T. C. S., Mulcahy, D. G., Werneck, F. P., Sites, J. W., and Jack, W. (2012). Phylogeography of the teiid lizard Kentropyx calcarata and the sphaerodactylid Gonatodes humeralis (Reptilia: Squamata): testing a geological scenario for the lower Amazon-Tocantins basins, Amazonia, Brazil. Herpetologica 68, 272–287.
Ayres, J. M., and Clutton-Brock, T. H. (1992). River boundaries and species range size in amazonian primates.pdf. Am. Nat. 140, 531–537. doi: 10.1086/285427
Barrett, J. C., Fry, B., Maller, J., and Daly, M. J. (2005). Haploview: analysis and visualization of LD and haplotype maps. Bioinformatics 21, 263–265. doi: 10.1093/bioinformatics/bth457
Batalha-Filho, H., Fjeldså, J., Fabre, P. H., and Miyaki, C. Y. (2013). Connections between the Atlantic and the Amazonian Forest avifaunas represent distinct historical events. J. Ornithol. 154, 41–50. doi: 10.1007/s10336-012-0866-867
Bicudo, T. C., Sacek, V., and De Almeida. (2020). Reappraisal of the relative importance of dynamic topography and Andean orogeny on Amazon landscape evolution. Earth Plan. Sci. Lett. 546:116423.
Bicudo, T. C., Sacek, V., De Almeida, Bates, J. M., and Ribas, C. C. (2019). Andean tectonics and mantle dynamics as a pervasive influence on Amazonian ecosystem. Sci. Rep. 9:16879. doi: 10.1038/s41598-019-53465-y
Bush, M. B. (2017). Climate science: the resilience of Amazonian forests. Nature 541, 167–168. doi: 10.1038/541167a
Caputo, M. V., and Soares, E. A. A. (2016). Eustatic and tectonic change effects in the reversion of the transcontinental Amazon River drainage system. Brazilian J. Geol. 46, 301–328. doi: 10.1590/2317-4889201620160066
Cheng, H., Sinha, A., Cruz, F. W., Wang, X., Edwards, R. L., D’Horta, F. M., et al. (2013). Climate change patterns in Amazonia and biodiversity. Nat. Commun. 4:1411. doi: 10.1038/ncomms2415
Corander, J., Marttinen, P., Sirén, J., and Tang, J. (2008). Enhanced Bayesian modelling in BAPS software for learning genetic structures of populations. BMC Bioinform. 9:539. doi: 10.1186/1471-2105-9-539
Corl, A., Davis, A. B., Kuchta, S. R., Comendant, T., and Sinervo, B. (2010). Alternative mating strategies and the evolution of sexual size dimorphism in the side-blotched lizard, Uta stansburiana: a popularion-level comparative analysis. Evolution 64, 79–96. doi: 10.1111/j.1558-5646.2009.00791.x
Costa, J. B. S., Bemerguy, R. L., Hasui, Y., Borges, M., and da, S. (2001). Tectonics and paleogeograph along the Amazon river. J. South Am. Earth Sci. 14, 335–347.
de Rossetti, D. F., Mann, de Toledo, P., and Góes, A. M. (2005). New geological framework for Western Amazonia (Brazil) and implications for biogeography and evolution. Quat. Res. 63, 78–89. doi: 10.1016/j.yqres.2004.10.001
Dias-Terceiro, R. G., Kaefer, I. L., de Fraga, R., de Araújo, M. C., Simões, P. I., and Lima, A. P. (2015). A matter of scale: historical and environmental factors structure anuran assemblages from the Upper Madeira River. Amazonia. Biotropica 47, 259–266. doi: 10.1111/btp.12197
Drummond, A. J. (2005). Bayesian coalescent inference of past population dynamics from molecular sequences. Mol. Biol. Evol. 22, 1185–1192. doi: 10.1093/molbev/msi103
Drummond, A. J., and Rambaut, A. (2007). BEAST: bayesian evolutionary analysis by sampling trees. BMC Evol. Biol. 7:214. doi: 10.1186/1471-2148-7-214
Drummond, A. J., Ho, S. Y. W., Rawlence, N., and Rambaut, A. (2007). A Rough Guide to BEAST 1.4. Auckland: University of Auckland, 1–41.
Excoffier, L., Laval, G., and Schneider, S. (2005). Arlequin (version 3.0): an integrated software package for population genetics data analysis. Evol. Bioinforma 1, 47–50. doi: 10.1177/117693430500100003
Fernandes, A. M., Gonzalez, J., Wink, M., and Aleixo, A. (2013). Multi-locus phylogeography of the Wedge-billed Woodcreeper Glyphorynchus spirurus (Aves, Furnariidae) in lowland Amazonia: widespread cryptic diversity and paraphyly reveal a complex diversification pattern. Mol. Phylogenet. Evol. 66, 270–282. doi: 10.1016/j.ympev.2012.09.033
Figueiredo, J., Hoorn, C., van der Ven, P., and Soares, E. (2009). Late Miocene onset of the Amazon River and the Amazon deep-sea fan: evidence from the Foz do Amazonas Basin. Geology 37, 619–622. doi: 10.1130/G25567A.1
Fouquet, A., Courtois, E. A., Baudain, D., Lima, J. D., Souza, S. M., Noonan, B. P., et al. (2015). The trans-riverine genetic structure of 28 Amazonian frog species is dependent on life history. J. Trop. Ecol. 31, 361–373. doi: 10.1017/S0266467415000206
Fu, Y. X. (1996). New statistical tests of neutrality for DNA samples from a population. Genetics 143, 557–570. doi: 10.1093/genetics/143.1.557
Gascon, C., Malcolm, J. R., Patton, J. L., Da Silva, M. N. F., Bogart, J. P., Lougheed, S. C., et al. (2000). Riverine barriers and the geographic distribution of Amazonian species. Proc. Natl. Acad. Sci. U S A. 97, 13672–13677. doi: 10.1073/pnas.230136397
Geurgas, S. R., and Rodrigues, M. T. (2010). The hidden diversity of Coleodactylus amazonicus (Sphaerodactylinae, Gekkota) revealed by molecular data. Mol. Phylogenet. Evol. 54, 583–593. doi: 10.1016/j.ympev.2009.10.004
Glor, R. E., Vitt, L. J., and Larson, A. (2001). A molecular phylogenetic analysis of diversification in Amazonian Anolis lizards. Mol. Ecol. 10, 2661–2668. doi: 10.1046/j.0962-1083.2001.01393.x
Godinho, M. B. D. C., and da Silva, F. R. (2018). The influence of riverine barriers, climate, and topography on the biogeographic regionalization of Amazonian anurans. Sci. Rep. 8:3427. doi: 10.1038/s41598-018-21879-9
Gvoždík, V., Jandzik, D., Lymberakis, P., Jablonski, D., and Moravec, J. (2010). Slow worm, Anguis fragilis (Reptilia: Anguidae) as a species complex: genetic structure reveals deep divergences. Mol. Phylogenet. Evol. 55, 460–472. doi: 10.1016/j.ympev.2010.01.007
Haffer, J., and Prance, G. T. (2001). Climatic forcing of evolution in Amazonia during the Cenozoic: on the refuge theory of biotic differentiation. Amazoniana 16, 579–607.
Hall, T. A. (1999). BioEdit: user-friendly biological sequence alignment editor and analysis program for windows 95/98/NT. Nucleic Acids Symp. Ser. 41, 95–96.
Heled, J., and Drummond, A. J. (2008). Bayesian inference of population size history from multiple loci. BMC Evol. Biol. 8:289. doi: 10.1186/1471-2148-8-289
Hillis, D. M., and Bull, J. J. (1993). An empirical test of bootstrapping as a method for assessing confidence in phylogenetic analysis. Syst. Biol. 42, 182–192. doi: 10.1093/sysbio/42.2.182
Hoorn, C., Guerrero, J., Sarmiento, G., and Lorente, M. (1995). Andean tectonics as a cause forchanging drainage patterns in Miocene northern South America. Geology 23, 237–240.
Hoorn, C., Wesselingh, F. P., Steeg, H. T., Bermudez, M. A., Mora, A., Sevink, J., et al. (2010). A. amazonia through time: andean uplift, climate change, landscape evolution, and biodiversity. Science 330, 927–931. doi: 10.1126/science.1194585
Huelsenbeck, J. P., and Hall, B. (2001). MrBayes: A Program for the Bayesian Inference of Phylogeny. Durban: Caprisa.
Katoh, K., and Standley, D. M. (2013). MAFFT multiple sequence alignment software version 7: improvements in performance and usability. Mol. Biol. Evol. 30, 772–780. doi: 10.1093/molbev/mst010
Kok, P. J. R. (2013). Islands in the Sky: Species Diversity, Evolutionary History, and Patterns of Endemism of the Pantepui Herpetofauna. PhD thesis, Leiden: Leiden University.
Lanfear, R., Calcott, B., Ho, S. Y. W., and Guindon, S. (2012). PartitionFinder: combined selection of partitioning schemes and substitution models for phylogenetic analyses. Mol. Biol. Evol. 29, 1695–1701. doi: 10.1093/molbev/mss020
Latrubesse, E. M., Cozzuol, M., da Silva-Caminha, S. A. F., Rigsby, C. A., Absy, M. L., and Jaramillo, C. (2010). The late miocene paleogeography of the amazon basin and the evolution of the Amazon River system. Earth-Science Rev. 99, 99–124. doi: 10.1016/j.earscirev.2010.02.005
Leite, R. N., and Rogers, D. S. (2013). Revisiting Amazonian phylogeography: insights into diversification hypotheses and novel perspectives. Org. Divers. Evol. 13, 639–664. doi: 10.1007/s13127-013-0140-8
Librado, P., and Rozas, R. (2009). DnaSP v5: a software for comprehensive analysis of DNA polymorphism data. Bioinformatics 25, 1451–1452. doi: 10.1093/bioinformatics/btp187
Macey, J. R., Schulte, J. A., Ananjeva, N. B., Larson, A., Rastegar-Pouyani, N., Shammakov, S. M., et al. (1998). Phylogenetic relationships among agamid lizards of the laudakia caucasia species group: testing hypotheses of biogeographic fragmentation and an area cladogram for the iranian plateau. Mol. Phylogenet. Evol. 10, 118–131. doi: 10.1006/mpev.1997.0478
Matzke, N. J. (2013a). Probabilistic historical biogeography: new models for founder-event speciation, imperfect detection, and fossils allow improved accuracy and model-testing. Front. Biogeogr. 5:242–248. doi: 10.21425/f5fbg19694
Matzke, N. J. (2013b). BioGeoBEARS: Biogeography with Bayesian (and likelihood) Evolutionary Analysis in R Scripts, R package, version 0.2.1. Berkeley, StateCA.
Matzke, N. J. (2014). Model selection in historical biogeography reveals that founder-event speciation is a crucial process in Island clades. Syst. Biol. 63, 951–970. doi: 10.1093/sysbio/syu056
Miller, K. G., Mountain, G. S., Wright, J. D., and Browning, J. V. (2011). Sea level and ice volume variations from continental margin and deep-sea isotopic records. Oceanography 24, 40–53.
Miller, M. A., Pfeiffer, W., and Schwartz, T. (2010). “Creating the CIPRES science gateway for inference of large phylogenetic trees,” in Proceedings of the 2010 Gateway Computing Environments Workshop (GCE) (IEEE), (Piscataway, StateNJ: IEEE).
Moraes, L. J. C. L., Pavan, D., Barros, M. C., and Ribas, C. C. (2016). The combined influence of riverine barriers and flooding gradients on biogeographical patterns for amphibians and squamates in south-eastern Amazonia. J. Biogeogr. 43, 2113–2124. doi: 10.1111/jbi.12756
Moraes, L. J. C. L., Ribas, C. C., Pavan, D., and Werneck, F. P. (2020). “Biotic and landscape evolution in an amazonian contact zone: insights from the herpetofauna of the Tapajós River Basin, Brazil,” in Neotropical Diversif cation: Patterns and Processes, (Berlin: Springer), 683–712. doi: 10.1007/978-3-030-31167-4_25
Moritz, C., Patton, J. L., Schneider, C. J., and Smith, T. B. (2000). Diversification of rainforest faunas: an integrated molecular approach. Annu. Rev. Ecol. Syst. 31, 533–563.
Naka, L. N., and Brumfield, R. T. (2018). The dual role of Amazonian rivers in the generation and maintenance of avian diversity. Sci. Adv. 4:eaar8575. doi: 10.1126/sciadv.aar8575
Oliver, P. M., Adams, M., Lee, M. S. Y., Hutchinson, M. N., and Doughty, P. (2009). Cryptic diversity in vertebrates: molecular data double estimates of species diversity in a radiation of Australian lizards (Diplodactylus. Gekkota). Proc. R. Soc. B Biol. Sci. 276, 2001–2007. doi: 10.1098/rspb.2008.1881
Ortiz, D. A., Lima, A. P., and Werneck, F. P. (2018). Environmental transition zone and rivers shape intraspecific population structure and genetic diversity of an Amazonian rain forest tree frog. Evol. Ecol. 32, 359–378. doi: 10.1007/s10682-018-9939-2
Palumbi, S., Martin, A., Romano, S., McMillian, W. O., Stice, L., and Grabowski, G. (1991). The Simple Fool’s Guide to PCR. Honolulu: University of Hawaii.
Pirani, R. M., Peloso, P. L. V., Prado, J. R., Polo, ÉM., Knowles, L. L., Ron, S. R., et al. (2020). Diversification history of clown tree frogs in neotropical rainforests (Anura, Hylidae, Dendropsophus leucophyllatus group). Mol. Phylogenet. Evol. 150:106877. doi: 10.1016/j.ympev.2020.106877
Pontes-da-Silva, E., Magnusson, W. E., Sinervo, B., Caetano, G. H., Miles, D. B., Colli, G. R., et al. (2018). Extinction risks forced by climatic change and intraspecific variation in the thermal physiology of a tropical lizard. J. Therm. Biol. 73, 50–60. doi: 10.1016/j.jtherbio.2018.01.013
Pouyani, E. R., Noureini, S. K., Pouyani, N. R., Joger, U., and Wink, M. (2012). Molecular phylogeny and intraspecific differentiation of the Eremias velox complex of the Iranian Plateau and Central Asia (Sauria, Lacertidae). J. Zool. Syst. Evol. Res. 50, 220–229. doi: 10.1111/j.1439-0469.2012.00662.x
Prates, I., Rivera, D., Rodrigues, M. T., and Carnaval, A. C. (2016a). A mid-Pleistocene rainforest corridor enabled synchronous invasions of the Atlantic Forest by Amazonian anole lizards. Mol. Ecol. 25, 5174–5186. doi: 10.1111/mec.13821
Prates, I., Xue, A. T., Brown, J. L., Alvarado-Serrano, D. F., Rodrigues, M. T., Hickerson, M. J., et al. (2016b). Inferring responses to climate dynamics from historical demography in neotropical forest lizards. Proc. Natl. Acad. Sci. U S A. 113, 7978–7985. doi: 10.1073/pnas.1601063113
Pupim, F. N., Sawakuchi, A. O., Almeida, R. P., Ribas, C. C., Kern, A. K., Hartmann, G. A., et al. (2019). Chronology of terra firme formation in amazonian lowlands reveals a dynamic quaternary landscape. Quat. Sci. Rev. 210, 154–163. doi: 10.1016/j.quascirev.2019.03.008
Rambaut, A., Drummond, A. J., Xie, D., Baele, G., and Suchard, M. A. (2018). Posterior summarization in bayesian phylogenetics using tracer 1.7. Syst. Biol. 67, 901–904. doi: 10.1093/sysbio/syy032
Ree, R. H., and Smith, S. A. (2008). Maximum likelihood inference of geographic range evolution by dispersal, local extinction, and cladogenesis. Syst. Biol. 57, 4–14. doi: 10.1080/10635150701883881
Ree, R. H.Sanmartín, I. (2018). Conceptual and statistical problems with the DEC+J model of founder-event speciation and its comparison with DEC via model selection. J. Biogeogr. 45, 741–749. doi: 10.1111/jbi.13173
Ree, R. H., Moore, B. R., Webb, C. O., and Donoghue, M. J. (2005). A Likelihood framework for inferring the evolution of geographic range on phylogenetic trees. Evolution (N. Y) 59, 2299–2311. doi: 10.1111/j.0014-3820.2005.tb00940.x
Ribas, C. C., and Aleixo, A. (2019). Diversity and evolution of Amazonian birds: implications for conservation and biogeography. An. Acad. Bras. Cienc. 91, 1–9. doi: 10.1590/0001-3765201920190218.1
Ribeiro-Júnior, M. A., and Amaral, S. (2016). Catalogue of distribution of lizards (Reptilia: Squamata) from the Brazilian Amazonia. III. Anguidae, Scincidae, Teiidae. Zootaxa 4205, 401–430. doi: 10.11646/zootaxa.4205.5.1
Ronquist, F., and Huelsenbeck, J. P. (2003). MrBayes 3: Bayesian phylogenetic inference under mixed models. Bioinformatics 19, 1572–1574. doi: 10.1093/bioinformatics/btg180
Rossetti, D. D. F., and De Toledo, P. M. (2007). Environmental changes in Amazonia as evidenced by geological and paleontological data. Rev. Bras. Ornitol. 15, 175–188.
Rossetti, D. F., and Valeriano, M. M. (2007). Evolution of the lowest amazon basin modeled from the integration of geological and SRTM topographic data. Catena 70, 253–265. doi: 10.1016/j.catena.2006.08.009
Rossetti, D. F., Cohen, M. C. L., Tatumi, S. H., Sawakuchi, A. O., Cremon, ÉH., Mittani, J. C. R., et al. (2015). Mid-Late pleistocene OSL chronology in western Amazonia and implications for the transcontinental Amazon pathway. Sediment. Geol. 330, 1–15. doi: 10.1016/j.sedgeo.2015.10.001
Sambrook, J., and Russell, D. M. (2001). Molecular Cloning: a Laboratory Manual. New York, StateNY: Cold Spring Harbor Laboratory Press.
Sawakuchi, A. O., Hartmann, G. A., Sawakuchi, H. O., Pupim, F. N., Bertassoli, D. J., Parra, M., et al. (2015). The Volta Grande do Xingu: reconstruction of past environments and forecasting of future scenarios of a unique Amazonian fluvial landscape. Sci. Dril. 20, 21–32. doi: 10.5194/sd-20-21-2015
Sheu, Y., Zurano, J. P., Ribeiro-Junior, M. A., Ávila-Pires, T. C., Rodrigues, M. T., Colli, G. R., et al. (2020). The combined role of dispersal and niche evolution in the diversification of Neotropical lizards. Ecol. Evol. 10, 2608–2625. doi: 10.1002/ece3.6091
Silva, J., Novaes, F., and Oren, D. (2002). Differentiation of Xiphocolaptes (Dendrocolaptidae) across the river Xingu, Brazilian Amazonia: recognition of a new phylogenetic species and biogeographic implications. Bull. Br. Ornithol. Club. 122, 185–194.
Silva, S. M., Peterson, A. T., Carneiro, L., Burlamaqui, T. C. T., Ribas, C. C., Sousa-Neves, T., et al. (2019). A dynamic continental moisture gradient drove Amazonian bird diversification. Sci. Adv. 5:eaat5752. doi: 10.1126/sciadv.aat5752
Smith, B. T., McCormack, J. E., Cuervo, A. M., Hickerson, M. J., Aleixo, A., Cadena, C. D., et al. (2014). The drivers of tropical speciation. Nature 515, 406–409. doi: 10.1038/nature13687
Souza, S. M., Rodrigues, M. T., and Cohn-Haft, M. (2013). Are amazonia rivers biogeographic barriers for lizards? a study on the geographic variation of the spectacled lizard leposoma osvaldoi avila-pires (Squamata, Gymnophthalmidae). J. Herpetol. 47, 511–519. doi: 10.1670/12-124
Stephens, M., and Donnelly, P. (2003). A comparison of bayesian methods for haplotype reconstruction from population genotype data. Am. J. Hum. Genet. 73, 1162–1169. doi: 10.1086/379378
Stephens, M., Smith, N. J., and Donnelly, P. (2001). A new statistical method for haplotype reconstruction from population data. Am. J. Hum. Genet. 68, 978–989. doi: 10.1086/319501
Strasburg, J. L., Kearney, M., Moritz, C., and Templeton, A. R. (2007). Combining phylogeography with distribution modeling: multiple Pleistocene range expansions in a parthenogenetic gecko from the Australian arid zone. PLoS One 2:e760. doi: 10.1371/journal.pone.0000760
Tajima, F. (1996). The amount of DNA polymorphism maintained in a finite population when the neutral mutation rate varies among sites. Genetics 143, 1457–1465. doi: 10.1093/genetics/143.3.1457
Tamura, K., Stecher, G., Peterson, D., Filipski, A., and Kumar, S. (2013). MEGA6: molecular evolutionary genetics analysis Version 6.0. Mol. Biol. Evol. 30, 2725–2729. doi: 10.1093/molbev/mst197
Thom, G., and Aleixo, A. (2015). Cryptic speciation in the white-shouldered antshrike (Thamnophilus aethiops, Aves - Thamnophilidae): the tale of a transcontinental radiation across rivers in lowland Amazonia and the northeastern Atlantic Forest. Mol. Phylogenet. Evol. 82, 95–110. doi: 10.1016/j.ympev.2014.09.023
Torres-Carvajal, O., and de Queiroz, K. (2009). Phylogeny of hoplocercine lizards (Squamata: Iguania) with estimates of relative divergence times. Mol. Phylogenet. Evol. 50, 31–43. doi: 10.1016/j.ympev.2008.10.002
Townsend, T. M., Alegre, R. E., Kelley, S. T., Wiens, J. J., and Reeder, T. W. (2008). Rapid development of multiple nuclear loci for phylogenetic analysis using genomic resources: an example from squamate reptiles. Mol. Phylogenet. Evol 47, 129–142. doi: 10.1016/j.ympev.2008.01.008
Vaidya, G., Lohman, D. J., and Meier, R. (2011). SequenceMatrix: concatenation software for the fast assembly of multi-gene datasets with character set and codon information. Cladistics 27, 171–180. doi: 10.1111/j.1096-0031.2010.00329.x
Vitt, L. J. (1991). Ecology and life-history of the widely foraging lizard Kentropyx calcarata (Teiidae) in Amazonian Brazil. Can. J. Zool. 69, 2791–2799. doi: 10.1139/z91-393
Wallace, A. R. (1852). “On the monkeys of the amazon,” in Proceedings of the Zoological Society, (London).
Weisrock, D. W., Macey, J. R., Ugurtas, I. H., Larson, A., and Papenfuss, T. J. (2001). Molecular phylogenetics and historical biogeography among salamandrids of the “true” salamander clade: rapid branching of numerous highly divergent lineages in Mertensiella luschani associated with the rise of Anatolia. Mol. Phylogenet. Evol. 18, 434–448. doi: 10.1006/mpev.2000.0905
Werneck, F. P., Giugliano, L. G., Collevatti, R. G., and Colli, G. R. (2009). Phylogeny, biogeography and evolution of clutch size in South American lizards of the genus Kentropyx (Squamata: Teiidae). Mol. Ecol. 18, 262–278. doi: 10.1111/j.1365-294X.2008.03999.x
Wilkinson, M. J., Marshall, L. G., Lundberg, J. G., and Kreslavsky, M. H. (2010). “Megafan environments in northern south america and their impact on amazon neogene aquatic ecosystems,” in Amazonia: Landscape and Species Evolution, (Oxford: Wiley-Blackwell Publishing Ltd), 162–184. doi: 10.1002/9781444306408.ch10
Keywords: Amazon basin, biogeography, drainage evolution, Kentropyx calcarata, landscape changes, lizard, phylogenetic, population structure
Citation: Cronemberger ÁA, Werneck FP and Ávila-Pires TCS (2022) Phylogeography of a Typical Forest Heliothermic Lizard Reveals the Combined Influence of Rivers and Climate Dynamics on Diversification in Eastern Amazonia. Front. Ecol. Evol. 10:777172. doi: 10.3389/fevo.2022.777172
Received: 15 September 2021; Accepted: 04 May 2022;
Published: 15 June 2022.
Edited by:
Oana Moldovan, Emil Racovita Institute of Speleology, RomaniaReviewed by:
Henrique Batalha-Filho, Federal University of Bahia, BrazilAdriaan Engelbrecht, University of the Western Cape, South Africa
Copyright © 2022 Cronemberger, Werneck and Ávila-Pires. This is an open-access article distributed under the terms of the Creative Commons Attribution License (CC BY). The use, distribution or reproduction in other forums is permitted, provided the original author(s) and the copyright owner(s) are credited and that the original publication in this journal is cited, in accordance with accepted academic practice. No use, distribution or reproduction is permitted which does not comply with these terms.
*Correspondence: Áurea A. Cronemberger, aureacronemberger@gmail.com