Intraspecific Competition, Habitat Quality, Niche Partitioning, and Causes of Intrasexual Territoriality for a Reintroduced Carnivoran
 Aaron N. Facka
 Roger A. Powell
- Department of Applied Ecology, North Carolina State University, Raleigh, NC, United States
Animals exploring a new environment develop cognitive maps using diverse sensory input and, thereby, gain information needed to establish home ranges. Experiencing, and learning information about, resources should be advantageous to the resident of a home range while lack of such information should put invaders into the home range at a disadvantage. Conspecifics, especially, should avoid the home ranges of one another to ensure that they do not experience reduced resource availability caused by resource depression or depletion. Yet, encountering conspecific competitors of different sexes may elicit responses that can lead to spacing on a landscape that has different costs and benefits on males and females. We tested the hypothesis that female fishers (Pekania pennanti) avoid competition from both males and female conspecifics whereas male fishers avoid competition only from other males. We reintroduced fishers onto our study site in the presence or absence of competitors’ home ranges during late 2009 through 2011. Using satellite transmitters (Argos) and land-based (VHF) telemetry, we monitored fishers and estimated their locations, movements and use of the surrounding landscape during their first 500 days after release. All fishers settled in relatively high-quality habitat but females that encountered the home ranges of conspecifics moved farther, explored larger areas, and settled farther from their release locations than did females that did not encounter a conspecific’s home range. Male fishers exhibited diverse responses upon encountering the home ranges of conspecifics. Thus, female fishers avoid conspecific competition from all fishers, but males tolerate, or impose, competition with females, apparently to increase mating opportunities. These observations are consistent with the movements and strategies of other solitary carnivores.
Introduction
When an animal moves through a new environment, it perceives the characteristics of that environment through its diverse senses and begins to develop a cognitive map of the new area (Heft, 2013; Eichenbaum, 2017). As the animal establishes a home range, its cognitive map becomes more complex. The cognitive map is a multi-dimensional concept of not just the locations of resources but also of the conditions of those resources, their juxtaposition and interspersion, the importance of the resources given the animal’s nutritional state and other conditions, the details of travel routes between resources such as ground conditions, exposure to predators, effects of weather patterns, short cuts to other resources, and much more. The cognitive map is not a Euclidean map as seen from above but a concept of an animal’s surroundings as seen from the animal’s present, or another target location (Heft, 2013). The map includes everything that the animal knows about other animals in the environment, including competitors. Consequently, understanding the development of the cognitive maps is critical for understanding home ranges and how animals learn about their environments (Powell, 2012; Powell and Mitchell, 2012).
Intraspecific competition affects, directly or indirectly, how animals use their environments and how they space themselves. Individuals remove, or deplete, resources, thereby decreasing habitat quality for both conspecifics and competitors of other species (Nunes et al., 1997; Goubault et al., 2005). Individuals may also depress food availability and foraging opportunities by changing prey behavior (Charnov et al., 1976; Jetz et al., 2004; Mitchell and Powell, 2004, 2007; Spencer, 2012). Resource depletion and depression cause individuals to move farther than they would without competition to find patches with abundant resources or to find patches where their ability to acquire those resources has fewer costs (Spencer, 2012).
Resource depletion and depression form a continuum of resource renewal. Depressed resource availabilities, caused by changes in prey behavior, renew over time scales of hours (Jȩdrzejewski et al., 1993) to a day or more (Ylönen, 1989; Jȩdrzejewski and Jȩdrzejewska, 1990). At the extreme, field voles (Microtus agrestis) delay reproduction when exposed to odors of weasels (Mustela nivalis) and American minks (Neogale vison), extending resource depression to a week as an extreme (Koskela and Ylönen, 1995). Depleted resource abundances caused by competitors renew slowly, if at all (Charnov et al., 1976). Although berries eaten by a competitor can renew within days, populations of small mammal prey require weeks to renew, large ungulate prey renew only after the next reproductive cycle followed by another year or more of growth, and minerals removed from a mineral lick may never renew. The consequence is that competitors decrease other animals’ abilities to track and to predict resource renewal and, thereby, to forage optimally. Hence, learning the locations, physical attributes, or the time since a competitor last visited an area is crucial to an animal’s decisions and, ultimately, to its fitness (Mitchell and Powell, 2007; Spencer, 2012).
Although both intra- and interspecific competitors deplete and depress resources, intraspecific competitors do so most effectively because conspecifics share resources requirements and foraging behaviors (Macdonald, 1983). Thus, sharing a landscape with a conspecific should have a larger effect on an individual’s assessment of habitat quality than does sharing the landscape with individuals of other species (Mitchell and Powell, 2004, 2007). If sharing its home range with conspecifics causes a resource for an animal to become limiting, the animal should maintain a territory (a non-overlapping home range; Brown, 1969; Brown and Orians, 1970; Carpenter and MacMillen, 1976). Spatial and temporal patchiness of the limiting resource can change the threshold for maintaining a territory (Powell et al., 1997; Sells and Mitchell, 2020) and for maintaining a shared territory with a mate (Smith, 1968; Powell, 1989, 1994). When conspecifics make resource renewal unpredictable, individuals may avoid areas used habitually by conspecifics, facilitating territoriality without defense (Spencer, 2012). For some species, habitat varies sufficiently across the species’ range that members of some populations maintain territories while members of other populations tolerate home range overlap (e.g., black bears, Ursus americanus, Powell et al., 1997). Even species for which all populations are generally thought always to maintain territories (e.g., pack territories of wolves, Canis lupus), habitat patchiness on landscapes over time can lead to home range overlap (Mech and Boitani, 2003).
Members of many species with large sexual dimorphism in body size maintain intrasexual territories (Powell, 1979b, 1994; Rogers, 1987; Powell et al., 1997; Johnson et al., 2000; Persson et al., 2010; Elbroch et al., 2016). Yurgenson (1947) and then Brown and Lasiewski (1972) suggested that size dimorphism allows resource partitioning by prey size, reducing competition between males and females of the same species. Such reduced competition could, theoretically, allow intrasexual territoriality. This intuitively satisfying niche-partitioning hypothesis has, however, experienced mixed success when tested (Selander, 1966; Schoener, 1967; Husar, 1976; Snyder and Wiley, 1976; Powell, 1981, 1993; Dayan and Simberloff, 1994, 1996, 1998; Holmes and Powell, 1994; King and Powell, 2007; Law and Mehta, 2018; Law, 2019). Resource partitioning by size can only occur when the smaller sex has access to resources not available to the larger (Wilson, 1975; Powell and Zielinski, 1983), a diet requirement that is seldom quantified (for example, Simms, 1979). Sexual size dimorphism does correlate strongly with a carnivorous diet (Powell, 1979b; Law and Mehta, 2018; Law, 2019). Yet, for those mustelids with large sexual size dimorphism, teeth, jaws and other skull structures related to capturing and killing prey are less dimorphic than are the rest of their bodies, indicating similar use of resources between sexes rather than niche partitioning (Holmes and Powell, 1994). Finally, sexual size dimorphism can vary tremendously among successive cohorts in the same place, because males born into food abundance grow to be significantly larger than those born into food scarcity (Holmes and Powell, 1994; Powell and King, 1997: King and Powell, 2007). Thus, even though sexual size dimorphism varies, and the potential for niche partitioning, intrasexual territoriality appears not to vary.
At specific combinations of limiting resource productivity, resource depression, and daily travel distances, dominant and subordinate individuals can maintain overlapping territories (Powell, 1994). Powell (1991, 1994) calculated that dominant individuals that benefit from such an overlap force the subordinate individuals to tolerate the overlap even if the subordinates gain no benefit, a calculation that applies to large males with large territories, each overlapping the smaller territories of several females. Large male black bears with large home ranges monitor the females with small, overlapped home ranges (Seaman, 1992; Powell et al., 1997; Kovach, 1998; Kovach and Powell, 2003) and many mustelids maintain intrasexual territories for years, making such monitoring by males possible (Erlinge and Sandell, 1986; Sandell, 1989; Powell, 1994; Lofroth et al., 2010; Rennie, 2015; Smith et al., 2020; but see Yamaguchi and Macdonald, 2003). Ultimately, even though intrasexual territoriality is well documented, the hypothesis that territoriality is imposed on females by males has never been tested.
Reintroductions of animals provide opportunities to test hypotheses related to what and how animals learn about new environments as they develop new cognitive maps and create home ranges. Biologists can infer how animals perceive and learn through their movements and spacing of new home ranges as more and more animals are released (Linklater et al., 2006; Berger-Tal and Saltz, 2014; Betts et al., 2015; Facka et al., 2016; Facka, 2017; Smith et al., 2020). Thus, reintroductions allow comparisons of the behaviors of individuals released into competition-free zones vs behaviors of those released into occupied zones. If habitat varies across a reintroduction site, the first individuals released should establish home ranges in the first areas of acceptable quality that they encounter. Developing a good cognitive map must be important (Heft, 2013; Eichenbaum, 2017; Lewis et al., 2021). Learning to know where food is located on a new, local landscape and learning how to hunt in those food sites should provide better food security than continuing to explore new sites that may not be better and might have less food. Likewise, individuals released later in a reintroduction benefit from avoiding occupied areas. Colonizers entering an area where conspecifics have established territories should avoid entering or minimize time in those territories (Sjöåsen, 1997). For sexually dimorphic species, females should avoid territories of all conspecifics if intrasexual territoriality is imposed on females by large males but should not avoid territories of large males if niche partitioning exists. Males who find an area without a resident, adult male should establish territories even if (niche partitioning), or because (imposition), the territories overlap the territories of females.
A reintroduction of fishers (Pekania pennanti) in northern California (Facka et al., 2016; Facka, 2017) allowed us to test hypotheses about conspecific competition, movements, habitat, and home range establishment. Fishers (Figure 1) are medium sized (adult females 2–2½ kg, adult males 3½-6 kg) predatory mammals in the family Mustelidae living only in northern North America. They thrive in large stands of late successional northern forests (Allen, 1983; Powell, 1993; Matthews et al., 2011; Raley et al., 2012; Powell et al., 2017). Through the 19th and early 20th centuries, fishers decreased in abundance throughout their range and subsequent efforts to restore their populations have resulted in numerous reintroductions and augmentations (Powell, 1993; Krohn, 2012; Lewis et al., 2012; Powell et al., 2012).
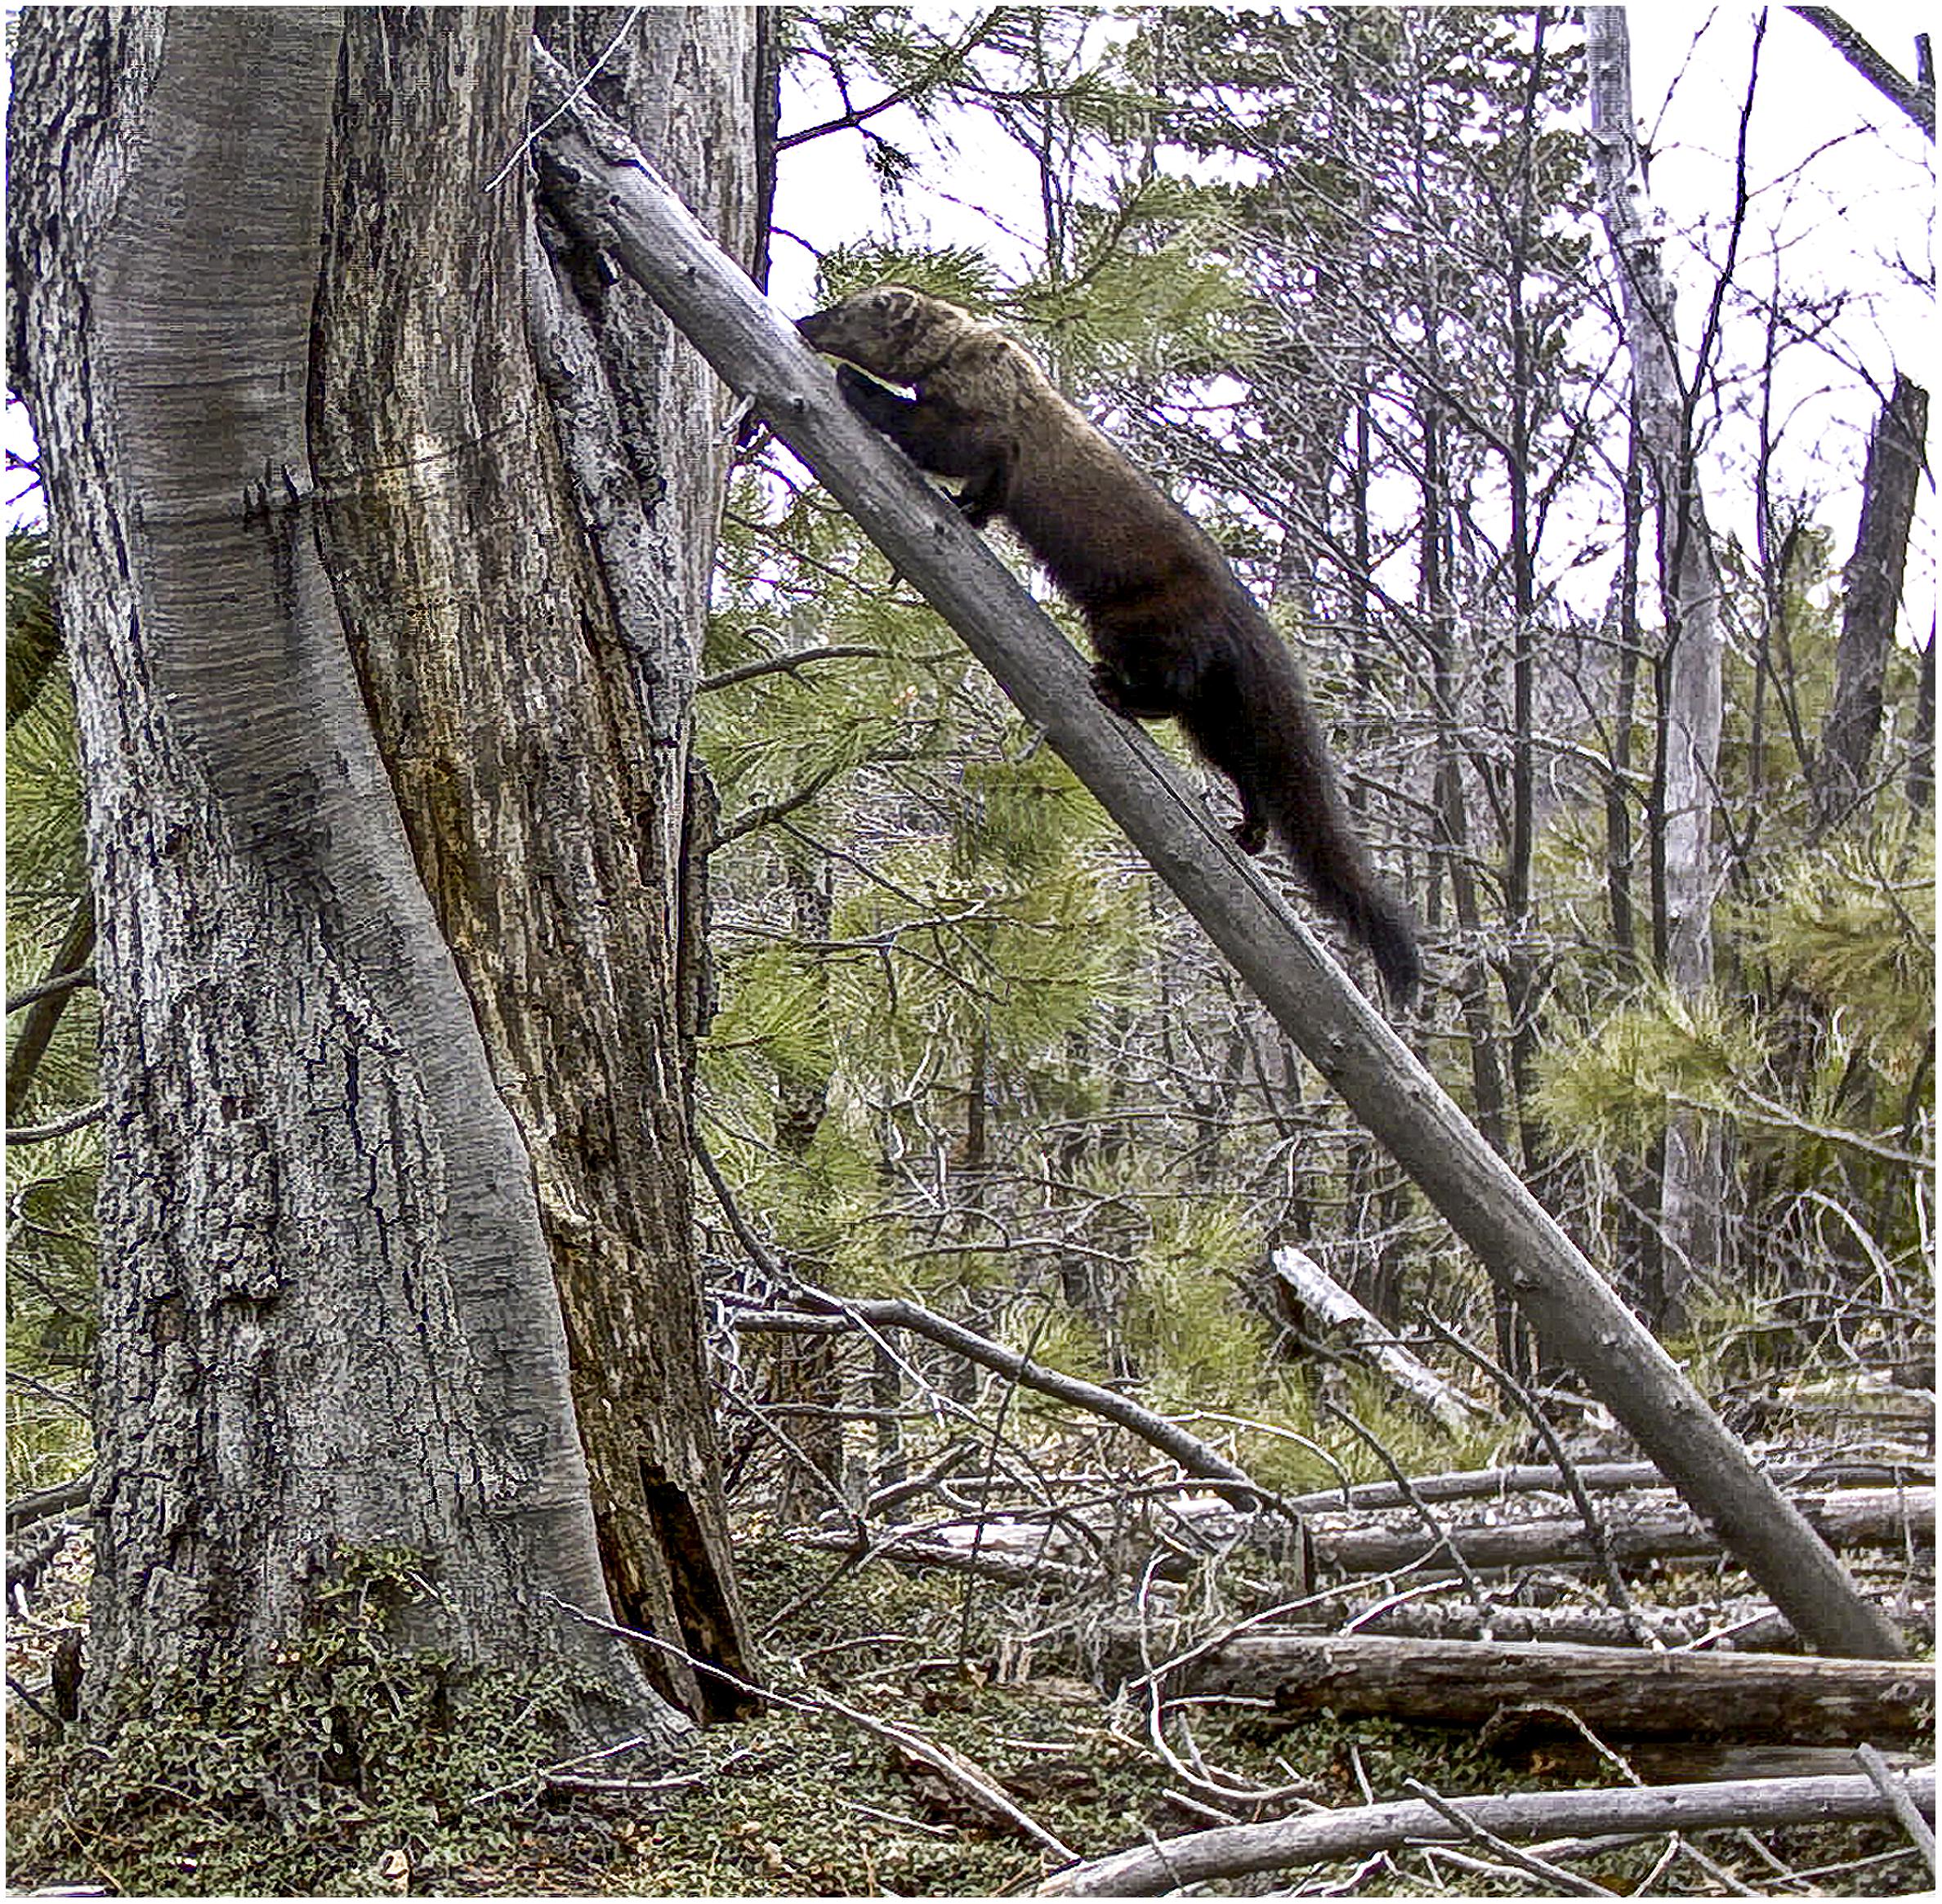
Figure 1. A female fisher (Pekania pennanti) wearing a transmitter collar and climbing a log to her den tree, where she has a litter of kits in a cavity. This fisher is a member of a reintroduced population established to investigate the use by fishers of industrial timberlands in northern California (Photo Credit: Fisher Reintroduction in Northern Sierras Project).
Across their range, fishers maintain territories with little intrasexual overlap but the territories of males overlap those of several females (Powell, 1979b; Weir, 1995; Badry et al., 1997; Rennie, 2015). Fishers have large territories to fuel their high metabolic rates and they travel long distances in search of prey (McNab, 1963; Powell, 1978, 1979a; Harestad and Bunnel, 1979). Males’ territories average over twice as large as those of females (Powell, 1994; Proulx et al., 1994; Badry et al., 1997) and males and females with overlapping territories avoid using the same locations simultaneously (Rennie, 2015). Fishers have diverse scent glands, including anal glands and plantar glands on their hind feet (Powell, 1993) and, presumably, communicate with other fishers via scent marking. Fishers apply anal gland secretions directly to objects, when fishers defecate, their anal glands leave scent and when they travel, their plantar glands leave scent. Fishers often walk along the tops of logs and jump onto stumps and big rocks, where their plantar glands leave scent that is elevated and able to disperse better (Powell, 1993).
Fishers are good subjects for testing hypotheses related to intraspecific competition, spacing patterns and movements because fisher life history and use of environments closely resemble those of most solitary carnivores (Powell et al., 2017). In addition to its goal of re-establishing a fisher population, the reintroduction in northern California was designed to test a series of hypotheses, including that fishers can maintain a viable population on a landscape managed intensively for lumber production (Callas and Figura, 2008; Facka, 2017). We hypothesized that conspecific competition affects fisher movements and establishment of territories after release for reintroduction. Specifically, we hypothesized (1) that adult female and male fishers move farther and faster when released into an existing territory compared to release into an area not occupied by another fisher. We hypothesized (2a) that newly released female fishers avoid established territories of both males and females but (2b) that male fishers are indifferent or attracted to female fishers’ territories while (2c) avoiding those of established adult male fishers. We hypothesized (3) that established territories (2 months or older) from previously released fishers affect newly released fishers’ movements and use of the landscape more strongly than do incipient territories, presumably because sufficient scent or visual or other cues had accumulated within established territories to indicate to new fishers that they should avoid those established territories (Gosling, 1982; Lewis and Murray, 1993; Field et al., 2005; Zhang et al., 2005; Kent and Tang-Martínez, 2014). The net result is that we tested whether fishers maintain intrasexual territories because of niche partitioning or because large males impose the territorial system onto females.
Materials and Methods
Study Site
Fishers were reintroduced as part of cooperative effort of Sierra Pacific Industries (a forest products company), the United States Fish and Wildlife Service, the California Department of Fish and Game (now Fish and Wildlife), and researchers at North Carolina State University (Callas and Figura, 2008, United States Department of the Interior et al., 2009). Collectively, our group reintroduced fishers to the Stirling Management Area (hereafter Stirling) owned and managed by Sierra Pacific Industries in portions of Plumas, Butte and Tehama counties in northern California, United States (Stirling; Lat 39.9° Lon −121.5°; Figure 2) where the southern Cascade Mountains meet the northern Sierra Nevada. Stirling was 648 km2 at elevations ranging from 425 to 2,080 m. The climate on Stirling was temperate with most (>85%) precipitation falling in late autumn and winter as snow and rain (Pandey et al., 1999). Vegetation on Stirling was typical of Sierra Nevada mixed conifer forest with ponderosa pine (Pinus ponderosa), sugar pine (Pinus lambertinia), incense cedar (Calocedrus decurrens), white fir (Abies concolor), douglas fir (Pseudotsuga menziesii), and California black oak (Quercus kellogii) as dominant tree species. In some locations, tanoak (Notholithocarpus densiflorus) and canyon live oak (Quercus chrysolepis) formed dense stands (Griffin and Critchfield, 1972; Beesley, 2007). We describe habitat assessment and quality on the study site later in our analysis.
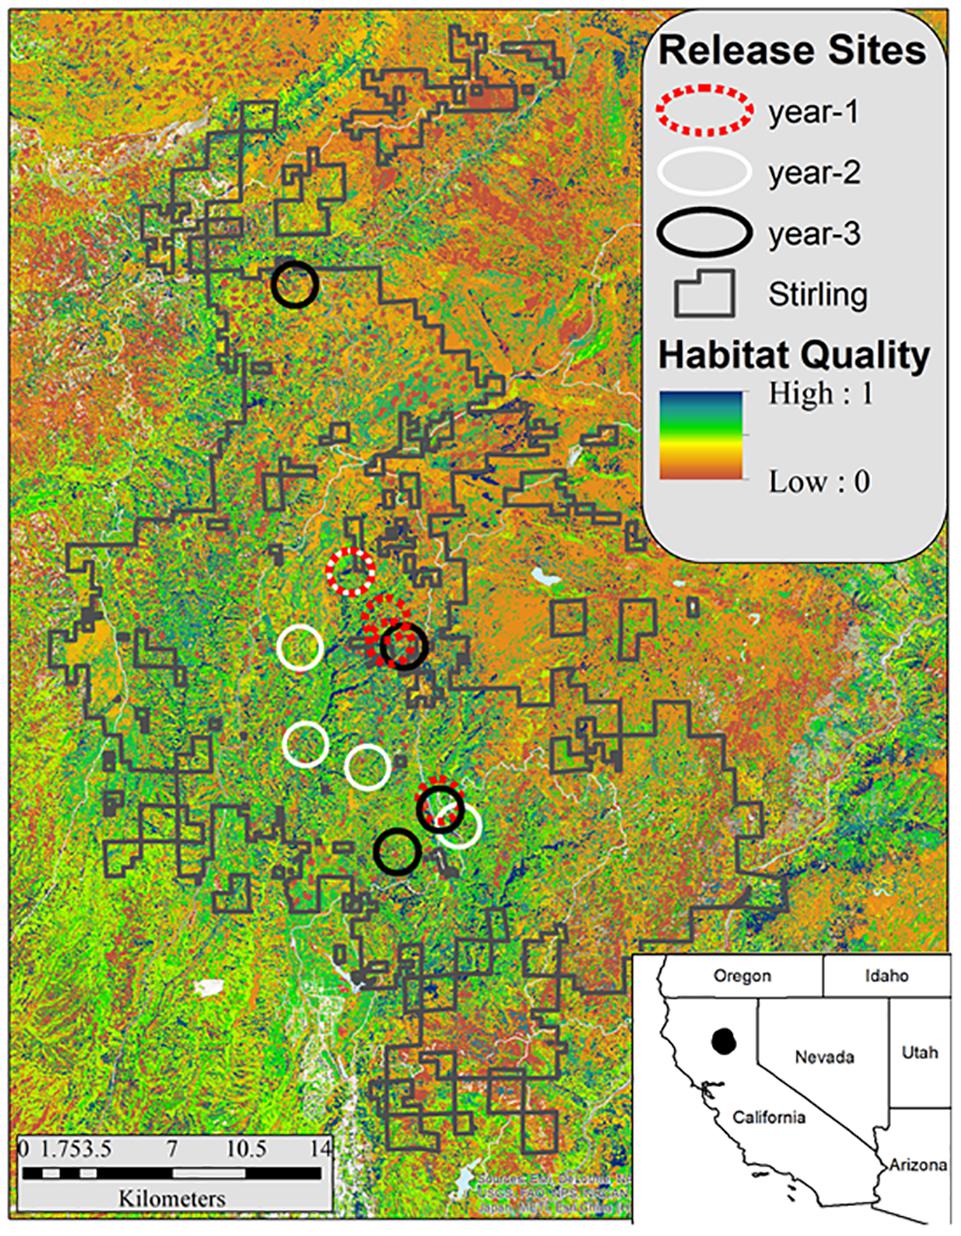
Figure 2. Stirling Management Area in northern California (shown by the irregular blocks of land outlined by gray lines) and the fisher release areas by year (black circles = December 2009–February 2010, white circles = November 2010–January 2011, and red circles = October–December2011). The background shows habitat quality (blue is highest) estimated using the model of Thomasma et al. (1994).
Prey for fishers on Stirling included western gray squirrels (Sciurus griseus) and diverse small mammals (Facka, 2017; Townsend, 2019). Snowshoe hares (Lepus americanus) and porcupines (Erethizon dorsatum), major prey for fishers across most their range, were rare. Gray squirrels constituted almost 40% of prey items identified in fisher scats and constituted a larger percent of the fishers’ diets because, except for deer carrion, all other prey identified were small mammal or of small-mammal size (Facka, 2017).
Stirling had a history of diverse management regimes that include both even-aged and uneven-aged management. Roughly 25% of Stirling was in even-aged (clearcut) stands that were less than 30 years old during this study, whereas roughly 35% was in stands that were periodically harvested with single-tree selection approaches (Facka, 2017). Estimates of habitat quality using up-to-date data predicted that some areas on and directly adjacent to Stirling had habitat of decent quality (Figure 2; Facka, 2017).
Reintroduction
In late 2009, our group began moving 40 fishers (24 F; 16 M) from across the fisher range in northwestern California to Stirling (Callas and Figura, 2008). We moved fishers in three different years (Table 1), capturing fishers from diverse locations to minimize the impact to any one area and to infuse genetic diversity into the founding population (Callas and Figura, 2008; Facka, 2017). We transported all captured fishers to a central processing area and evaluated them for potential release onto Stirling. For females, we sought individuals that were approaching their 2nd or 3rd birthdays and would, therefore, be producing kits for the 1st or 2nd times in their lives. For males, we sought individuals that we estimated to be ≥ 3-years old and ≥ 4 kg, because we surmised that big male fishers, like other carnivorans, would be the best breeders (Table 1; Kovach and Powell, 2003; Powell and Zielinski, 2005; Lewis et al., 2012). Actual ages were unknown at the time we selected and moved fishers but, for future analysis, we removed a 1st upper pre-molar (a tiny tooth) from each fisher to estimate age by counting cementum annuli (Arthur et al., 1992; Poole et al., 1994). At least 1 field biologist and 1 wildlife veterinarian evaluated each fisher we considered for reintroduction. We immobilized fishers chemically with Tiletamine HCL and Zolazepam HCL (Telazol, Fort Dodge Animal Health, Fort Dodge, Iowa, United States; 7 mg/kg) to document sex, reproductive status, general condition, disease exposure, weight, and to fit transmitters. At initial capture, we collected a blood sample for genetic identification and to evaluate disease exposure, and gave each fisher a Passive Integrated Transponder (subcutaneous between the scapulae) for future identification.
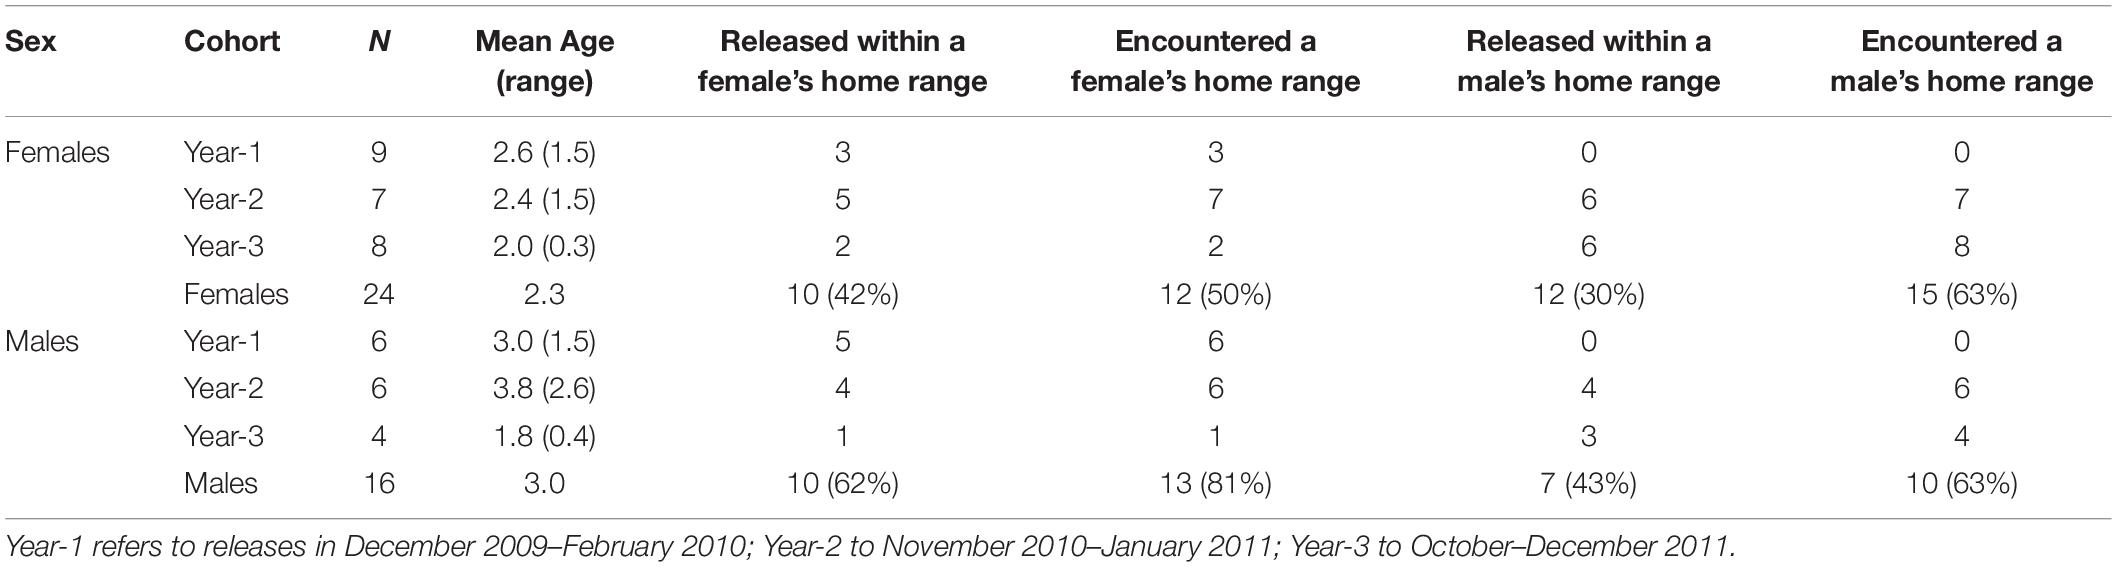
Table 1. The total number of female and male fishers released by cohort, their average ages (range in parentheses), whether fishers were released within the home ranges of a female or male fisher released at least 2 months earlier, and whether released fishers encountered the established home ranges of other fishers while seeking places to establish their own home ranges.
No fishers had lived on the Stirling site for approximately 100 years prior to our reintroduction. Stirling was separated from the closest fisher population to the north and west by over 100 km and from the closest population to the south by over 400 km (Callas and Figura, 2008). During late autumns and early winters of 2009–2010 (year–1), 2010–2011 (year–2), and 2011–2012 (year–3), we released fishers in groups of 1–5 mostly across central Stirling (Figure 2 and Table 1). After releases in year-1, we released some fishers within the established home ranges of previously released fishers and some into areas where we had not documented fishers in the year we tracked them after release (Table 1), alternating groups between in or out of known home ranges. We used hard releases (without site acclimation) because acclimation appears not to affect population establishment or movement patterns and is expensive (Lewis et al., 2012; Powell et al., 2012). To estimate fisher movements and survival post-release, we outfitted female fishers with either Telonics (IMP-325 or MOD-125; Mesa, Arizona) or Holohil (MI-2i, Carp, Ontario) Very High Frequency (VHF) transmitters. We fitted adult male fishers with Platform Terminal Transmitter (PTT; Argos) collars (Kiwisat 202 or 303, Sirtrack, Havelock North, New Zealand).
In autumn of 2011, we first captured fishers that had not been released and, therefore, had been born on Stirling. We followed the same capturing and handling protocols and used the same types of transmitters for Stirling-born fishers as for reintroduced fishers. We used Stirling born fishers to document how native, non-reintroduced fishers dispersed and moved within established home ranges at our study site.
Field Methods at Release Sites
We attempted to locate all fishers carrying transmitters on Stirling (reintroduced and those born on site) once per day using either VHF or PTT telemetry. We estimated fishers’ locations with VHF data using three methods based on conditions, activity and the relative distances that we estimated individual fishers were from a field researcher. Most commonly, we collected azimuths in the field to triangulate fisher locations, using program Location of a Signal (LOAS, Ecological Software Solutions LLC). We collected locations of individuals throughout a 24-h diel cycle throughout the calendar year but 80% of all locations occurred during daylight hours compared to 20% at night. Less often, we located fishers from small planes or helicopter. Finally, we sometimes homed on the signal of a fisher until we saw the fisher or could identify the tree or other structure where it hid. Location estimates from PTT data were processed through the Argos system with Kalman estimation and filtering (Collecte Localisation Satellites; Ramonville-Saint-Agne, France) and delivered via email daily through the satellite tracking and analysis tool from the seaturtle.org web service (Coyne and Godley, 2005). Ideally, the PTT transmitters provided a minimum of one location estimate per day. Different PTT collars were active during different time blocks to allow inference to male fishers’ movements throughout a 24-h cycle. We estimated VHF and PTT error by comparing locations estimated for collars and fishers to known locations. For VHF telemetry error, 25% of triangulated locations were within 50 m, 50% were within 112 m, 75% where within 300 m, and 95% were within 1,200 m of the true locations (n = 234). Triangulated locations were generally within the error radius produced by the LOAS software. The Argos system classified locations into distinct classes based on predicted error rates (Sauder et al., 2012). The expected precision of estimates descends from those designated class-3 (≤250 m), class-2 (≤500 m), class-1 (≤1,500 m) and class-0 (>1,500 m). Our estimates of error for Argos locations did not depart from these categories and were similar to results from other studies on fishers carrying Argos collars (Sauder et al., 2012). We used only Argos locations with estimated errors ≤ 1,500 m. Both VHF and PTT transmitters were equipped with mortality sensors to document fisher deaths, which was a key objective for the reintroduction effort (Callas and Figura, 2008; Facka, 2017).
Analyses of Field Data
Habitat
We estimated habitat quality on Stirling using Thomasma’s version (Thomasma et al., 1994) of Allen’s (1983) fisher habitat suitability index, which was built to index habitat for prey and habitat required for reproduction. The Thomasma model has been tested independently at our and at other study sites with diverse vegetation communities and found to predict use of habitat by fishers (Thomasma et al., 1991; Powell, 2004; Facka, 2017). This model quantifies fisher habitat quality based on four vegetative metrics: (1) percent tree canopy closure, (2) mean diameter at breast height (DBH) of overstory trees, (3) tree canopy diversity (i.e., number of canopy layers, including a ground layer if it exists), and (4) percent of overstory trees that are angiosperms (hereafter hardwoods; Figure 3). Proximity among habitat patches and spatial configuration (e.g., fragmentation and interspersion) do not contribute to habitat quality in Thomasma’s model. We used the gradient nearest neighbor (GNN) dataset downloaded from http://lemma.forestry.oregonstate.edu/data (Ohmann et al., 2011) to create indices for each of the four vegetative metrics and then combined these into the final habitat suitability index (HSI) as:
where all variables range from 0 to 1 (Figure 3; Allen, 1983; Thomasma et al., 1994).
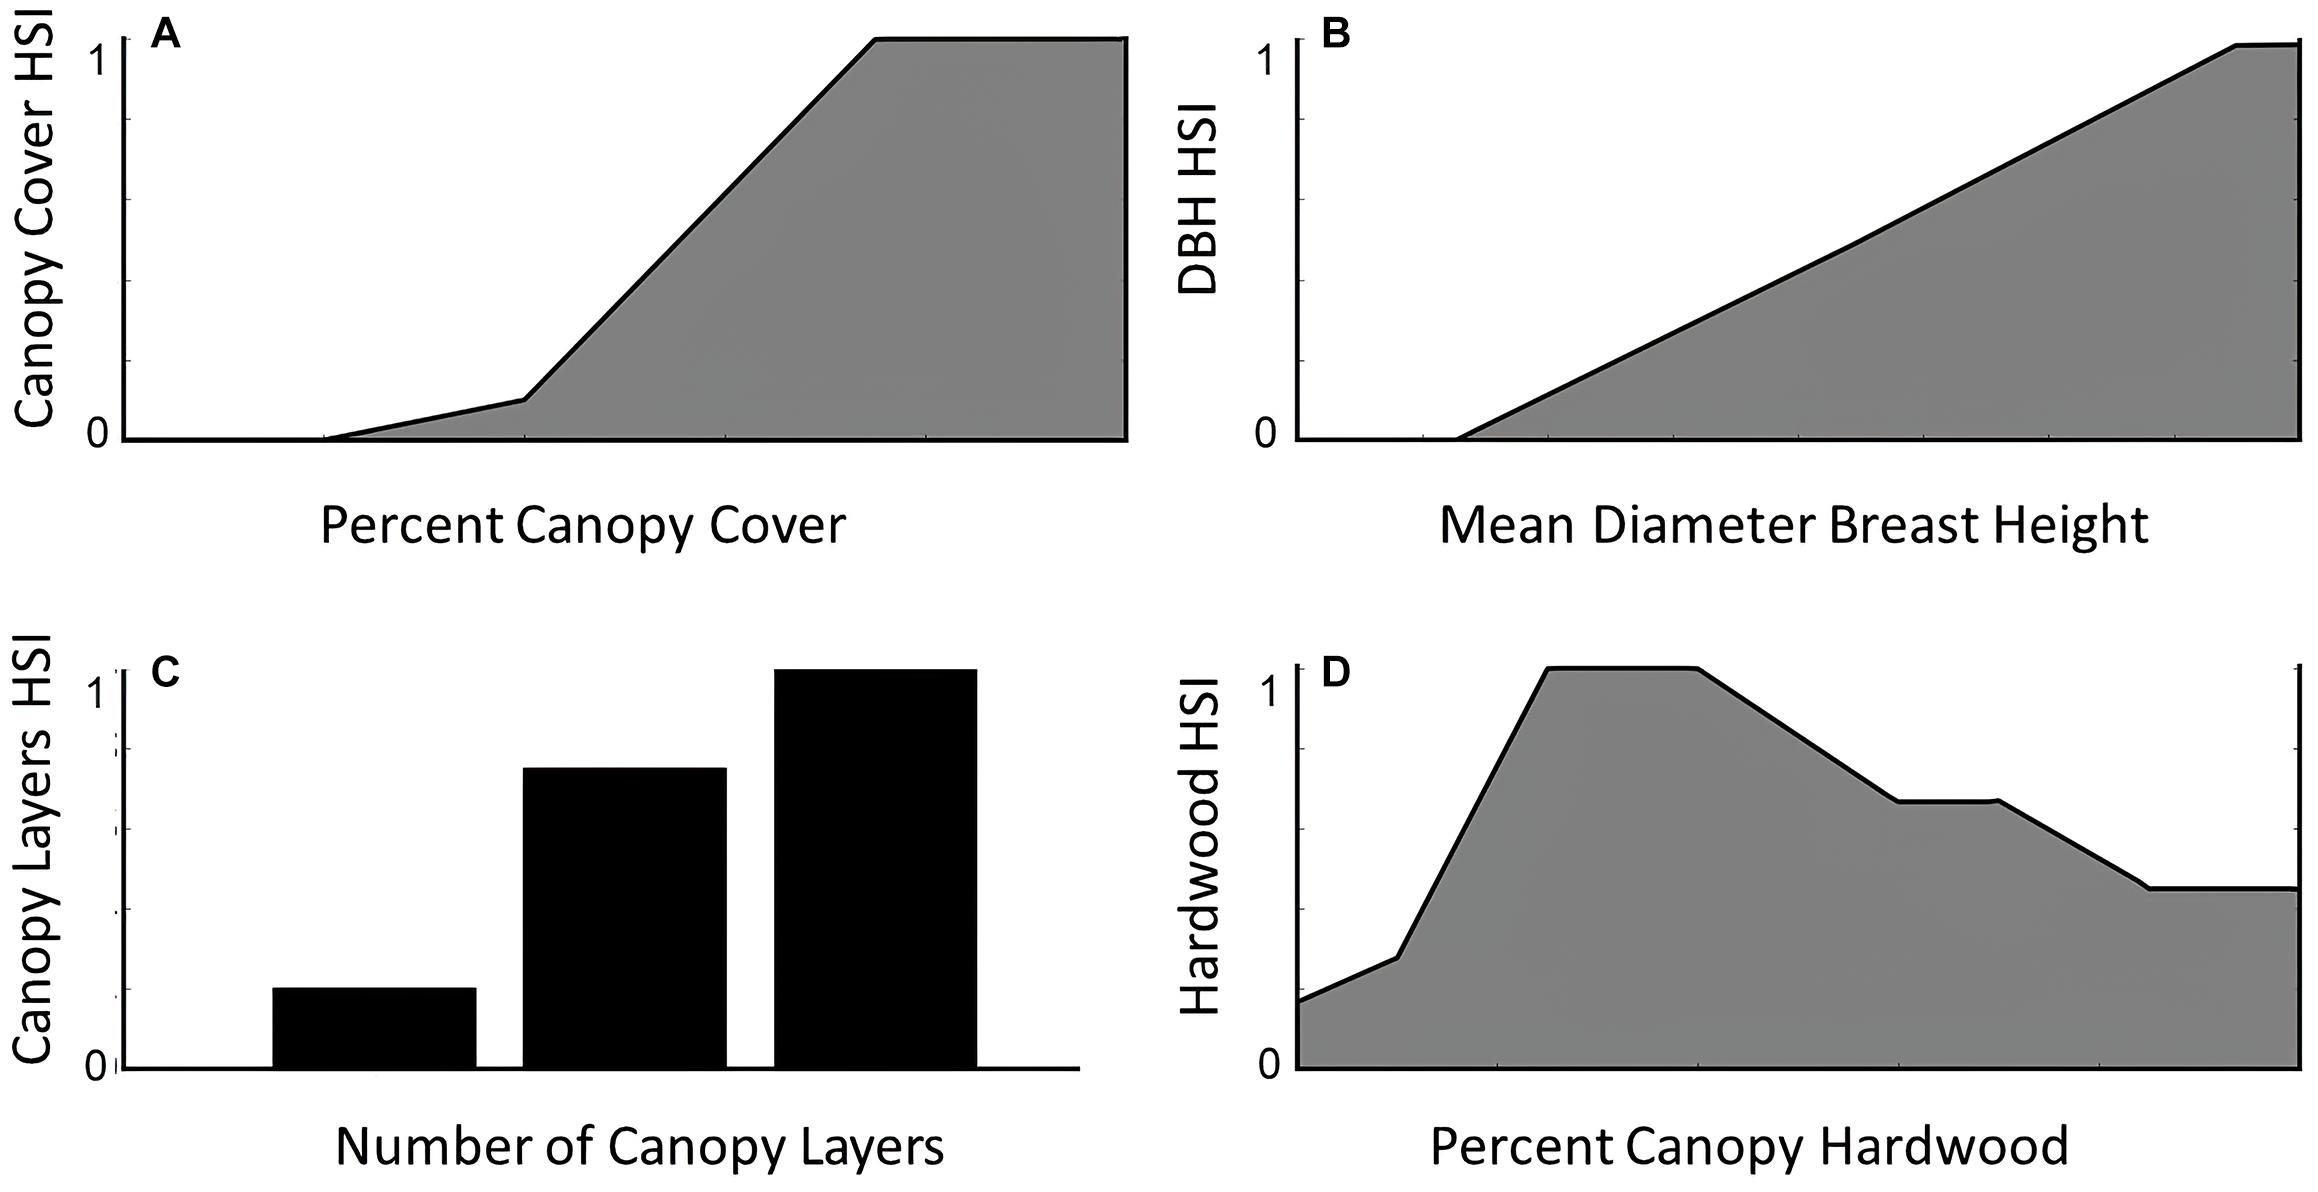
Figure 3. The relationships between habitat suitability for fishers as derived from expert-opinion models and empirical assessment (model by Thomasma et al., 1994) and (A) percent canopy closure, (B) mean diameter at breast height (DBH) of overstory trees, (C) tree canopy diversity, and (D) percent of hardwoods.
We calculated the mean habitat value within a 1 km radius circle (3.14 km2) around release points for all reintroduced fishers (Figure 3). This area was similar to the smallest reported utilization distributions for fishers (Matthews et al., 2011). To evaluate the habitat quality of home ranges of reintroduced fishers, we used all their locations (if ≥ 20) during a calendar year (1 January to 31 December) to estimate annual utilization distributions with a fixed kernel density estimator using Silverman’s (1986) k2 for the kernel and smoothing parameter h set to 500 m (Seaman and Powell, 1996). For each utilization distribution, we calculated the mean habitat quality within the 0.50 isopleth (representing an area where we could find a fisher on 50% of occasions). Because all fishers did establish home ranges, the 50% isopleths calculated using all locations emphasized the areas where the fishers settled.
To estimate the distribution of habitat quality available on and near Stirling, we generated 80 random points and then created a 1 km radius buffer around each point. We then assigned 40 polygons randomly to serve as release sites and 40 as home range cores and estimated the mean habitat quality for those areas. One release polygon and one home range core polygon were then paired to simulate randomly released fishers that settled on the landscape randomly.
We considered that a released fisher encountered the home range of a conspecific if we released that fisher within the 95% isopleth of the utilization distribution of a known fisher or if the released fisher encountered the 95% isopleth of a known fisher within 2 weeks of being released. We noted the sex of the resident of any home range a reintroduced fisher encountered.
Fisher Movements and Analyses
We analyzed fisher movements to 500 days after release, until a fisher died or until its transmitter failed. If a fisher lost a transmitter, we gave it a new one when we next recaptured it and again tracked its movements and use of its environment. For these analyses, all locations were used excluding any that seemed erroneous. For each fisher, we calculated three metrics of movement after release: (1) the mean distance from its release location to each successive location (Distance), (2) the area of the minimum convex polygon that bounded its last 50 locations (Polygon Area) and (3) the distance between release site and the centroid of the minimum convex polygon (Centroid Distance). We used minimum convex polygons to index environmental-use through time because it is a conservative measure of the maximum area an animal used for a given period. We chose to use 50 locations for polygon estimation because that represented a trade-off between exploratory, or aberrant, movements that some fishers made and the area that fishers were using seasonally or as they settled. When we had fewer than 50 locations for a fisher, we used all available locations to create convex polygons.
For comparison to reintroduced fishers, we evaluated movements and use of the environment by fishers born on our study site. We released all captured fishers born on Stirling at their capture sites and treated those locations the same as release locations for reintroduced fishers. We calculated the same metrics of movements as we did for reintroduced fishers. We removed Stirling-born fishers with fewer than 10 locations from analyses.
Testing Hypotheses
To analyze our three metrics of movements, we used generalized linear mixed models using PROC GLIMMIX in SAS. For each metric, we tested for an appropriate distribution and found that a gamma distribution fit our data best; hence, we also used a log link function. We modeled individual fishers and time as G-side random effects with a simple diagonal covariance structure. We estimated parameters using maximum likelihood and the Laplace method. Because we had relatively few individuals, we kept the structure of our statistical models simple (Fieberg and Johnson, 2015).
Before reintroductions started, we knew that male and female fishers move and behave differently (Powell, 1979b, 1994). Furthermore, because animals’ movements and use of their environments generally change through time, we included both Sex and Time as effects in all statistical modeling (our null model). For all fishers, we measure Time as the days since initial release (for reintroduced fishers) and days after capture for Stirling-born fishers. We predicted that if competition (a released fisher encountering another fisher’s home range) were important to fishers of one or both sexes, then models incorporating competition should describe the data better than our null model. We predicted that a fisher of either sex could respond similarly and strongly when encountering the home ranges of only females or only males. Thus, we tested a model in which fishers of both sexes encountered males (EncMale) and another model where they encountered females (EncFem) without interactions between those groups (also including Sex and Time). Because we hypothesized that male and female fishers responded differently to competition, we tested two additional models with interactions between the Sex term and encountering male fishers (Sex × EncMale) or female fishers (Sex × EncFem). Finally, to test whether poor habitat quality at the release sites or better habitat quality elsewhere described fishers’ movements and settlement locations better than competition, we included a model with the change in habitat quality between a fisher’s release area and the 50% isopleth where it settled (HabSettle).
We first calculated values for our three movement metrics using data from Stirling-born fishers to evaluate metric patterns over time and for subsequent comparison to data from reintroduced fishers. From preliminary plotting of the data, we recognized that a linear relationship between fisher movements and time may be insufficient. Thus, using our data for both reintroduced fishers and Stirling-born fishers, we tested three models where the effects of time on movement were linear, 3rd or 4th order polynomials. Generally, linear models performed similarly or superior to polynomial models of time. In the instances where a polynomial did fit the data better, the patterns of change through time and the y-intercepts were within the 95% confidence intervals for linear models. Consequently, in subsequent modeling we used only linear models to describe the behavior of our three metrics across time. The biological interpretations of these statistical parameters are that the y-intercepts describe fishers’ movements or environmental-use 1 day after release (short initial movements yielded small intercepts while large initial movements yielded large intercepts) and the slopes describe overall trends in subsequent behavior (large movements away from release sites yielded positive slopes whereas short subsequent movements yielded negative or flat slopes).
For all models and metrics, we ranked competing hypotheses using Akaike’s Information Criteria corrected for small sample size (AICc; Burnham and Anderson, 2002). Because we did not model Time as interactive to Sex or to different types of competition, we re-estimated the parameters for each group (e.g., males without competition) through time based on our top model’s structure using the GLIMMIX procedure. We report and make inference based on these final estimates. In instances where we needed to make multiple comparisons or determine differences among groups, we used the Nelson-Hsu adjustment.
Results
Stirling-Born Fishers
We calculated our movement metrics for the 17 male and 40 female fishers born on Stirling that we captured their first times in 2011 through 2016. (Fishers captured in 2017 did not receive collars because we removed collars that year in anticipation of research termination.) Females and males averaged 215 (95% CI = 141–289) and 271 (95% CI = 120–423) locations per individual for our analysis. Individual males and females exhibited highly varied movements and varied use of the landscape following release (Figure 4). On average, Stirling-born female fishers moved 1.6 ± 1.1 km and males 2.4 ± 1.3 km from their capture locations on the first day after release (F1,7053 = 0.25, P = 0.68, Table 2). For all fishers, Distance (mean daily distance from release site) increased through time but males moved much farther than did females (F1,7053 = 10.00, P = 0.0016, Figure 4). On average, Centroid Distance (distance from release sites to centroid of final polygon) was greater for Stirling born males than for females (F1,7053 = 6.01, P = 0.014, Table 2). Polygon Area and Centroid Distances increased (low but positive slopes) over time for both female and male fishers (Table 2).
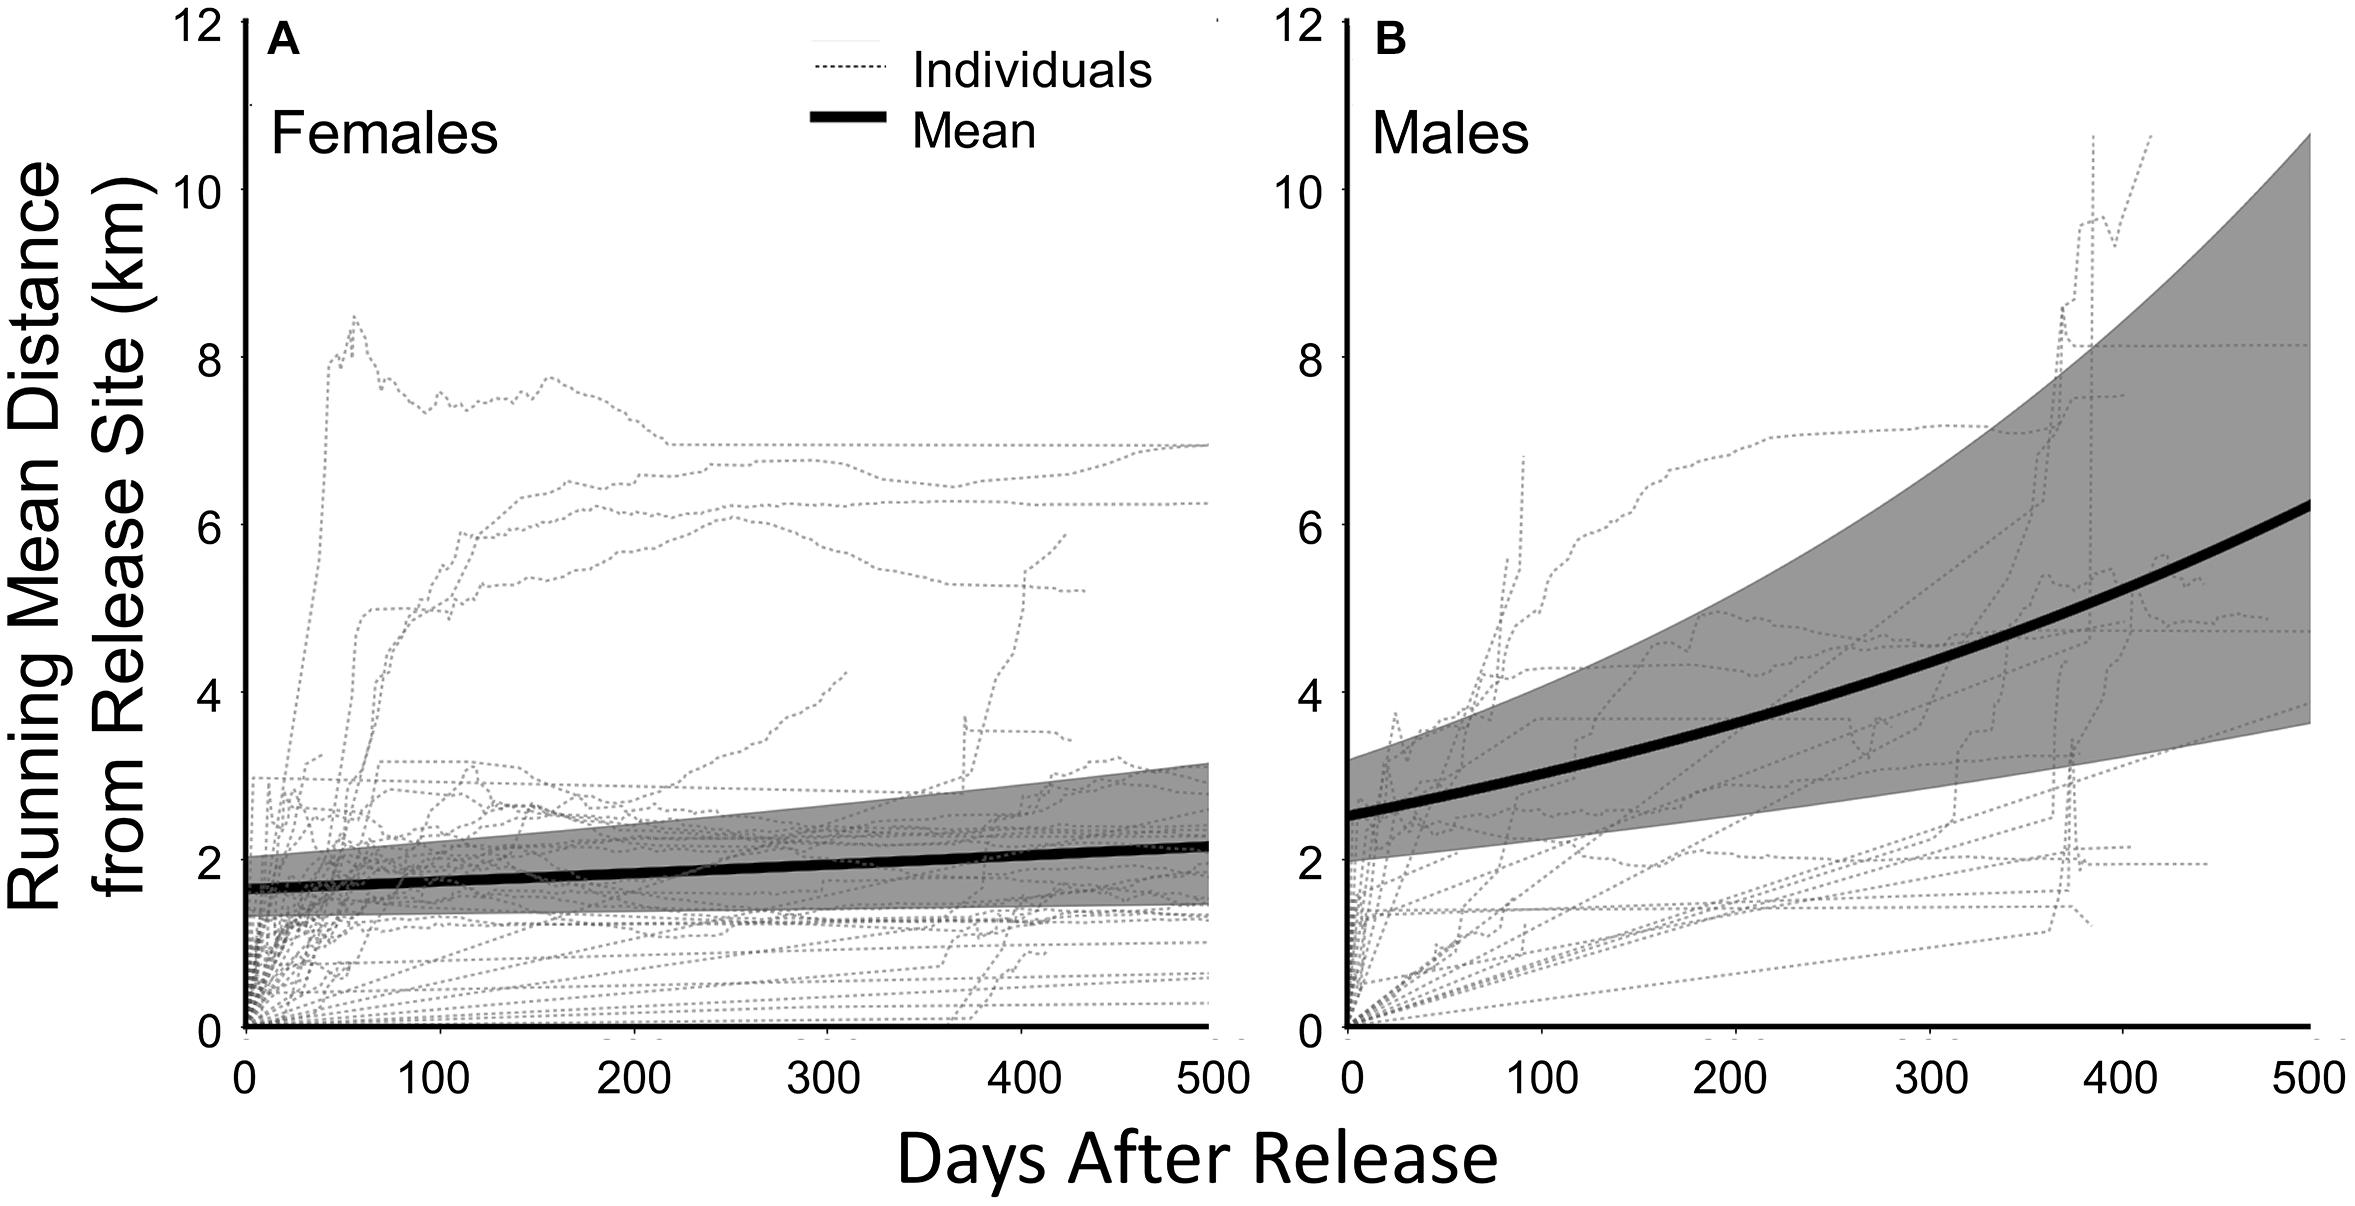
Figure 4. Running mean distances from the sites of trapping and release for (A) female fishers and (B) male fishers born on the study site in northern California from 2011 through 2017 and the fitted mean curves for female and male fishers through time (solid black line; shaded areas are 95% Confidence Limits). Fitted mean line from parameter estimates from a generalized linear mixed model estimating change in distance after release.
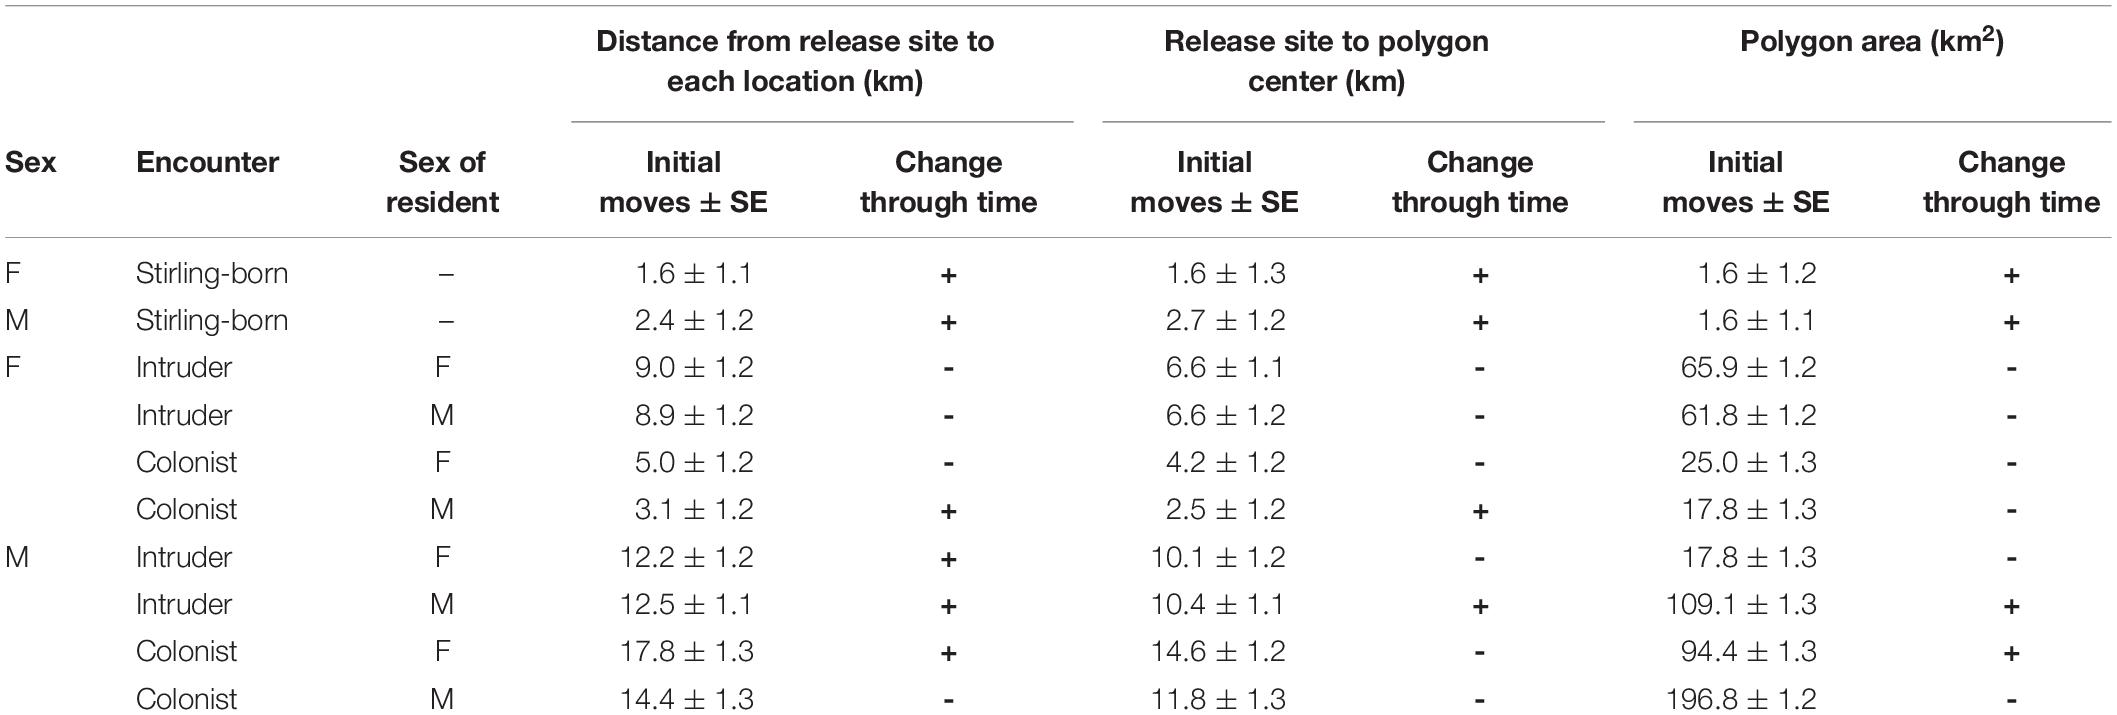
Table 2. Estimates for the first move and slope parameters from generalized linear mixed models for three dependent metrics for female (F) and male (M) fishers that were born on the study site (Stirling-born) and translocated fishers that were released onto the established home ranges of other fishers (Yes) and where no home ranges existed (No). Estimates were made from 57 fishers born on the study site and 40 translocated fishers from 2009 to 2016 in northern California.
Reintroduced Fishers
Across all years, we estimated an average of 55 locations for female fishers and 97 locations for male fishers within the first 12 months after release. We followed 8 of 9 females released in year-1 (2009-2010) through June 2010. From June to August, three females died, and we lost contact with two others from apparent transmitter failure. We monitored five (of 6) males through the summer of 2010. We monitored all but 1 year-2 female for their entire first year (one female died in August). One male from the year-2 cohort died within 2 months of release. We had fewer estimated locations for the year-3 cohort because one female died 2 days after release and another died within 2 months. Predation was the most common source of mortality documented [7, bobcats (Lynx rufus), raptors], followed by accidents (5, roadkill, drowning) and disease (1); a large number of fishers who died for unknown reasons (18) carried residues of anticoagulant rodenticides.
Values for Distance (F1,107 = 66.7, P < 0.001), Polygon Area (F1,107 = 14.99, P < 0.001) and Centroid Distance (F1,107 = 62.5, P < 0.001) were all greater for reintroduced than for Stirling-born fishers (Table 2 and Figure 5). Notably, female fishers reintroduced without competition had patterns of movement and space-use most similar to Stirling-born female fishers. Reintroduced males moved larger Distances than did females (F1,36 = 17.97, P < 0.001), had larger Polygon Areas (F1,36 = 49.81, P < 0.001), and had larger Centroid Distances (F1,36 = 20.48, P < 0.001) (Table 2). Both females and males developed home ranges relatively quickly. Distance reached asymptotes for most reintroduced fishers by day 100 (Figure 5). Similarly, Polygon Area and the Centroid Distance also plateaued or increased only slowly after 100 days. Data patterns for male fishers, however, were far more variable generally than were those for female fishers (Figure 5).
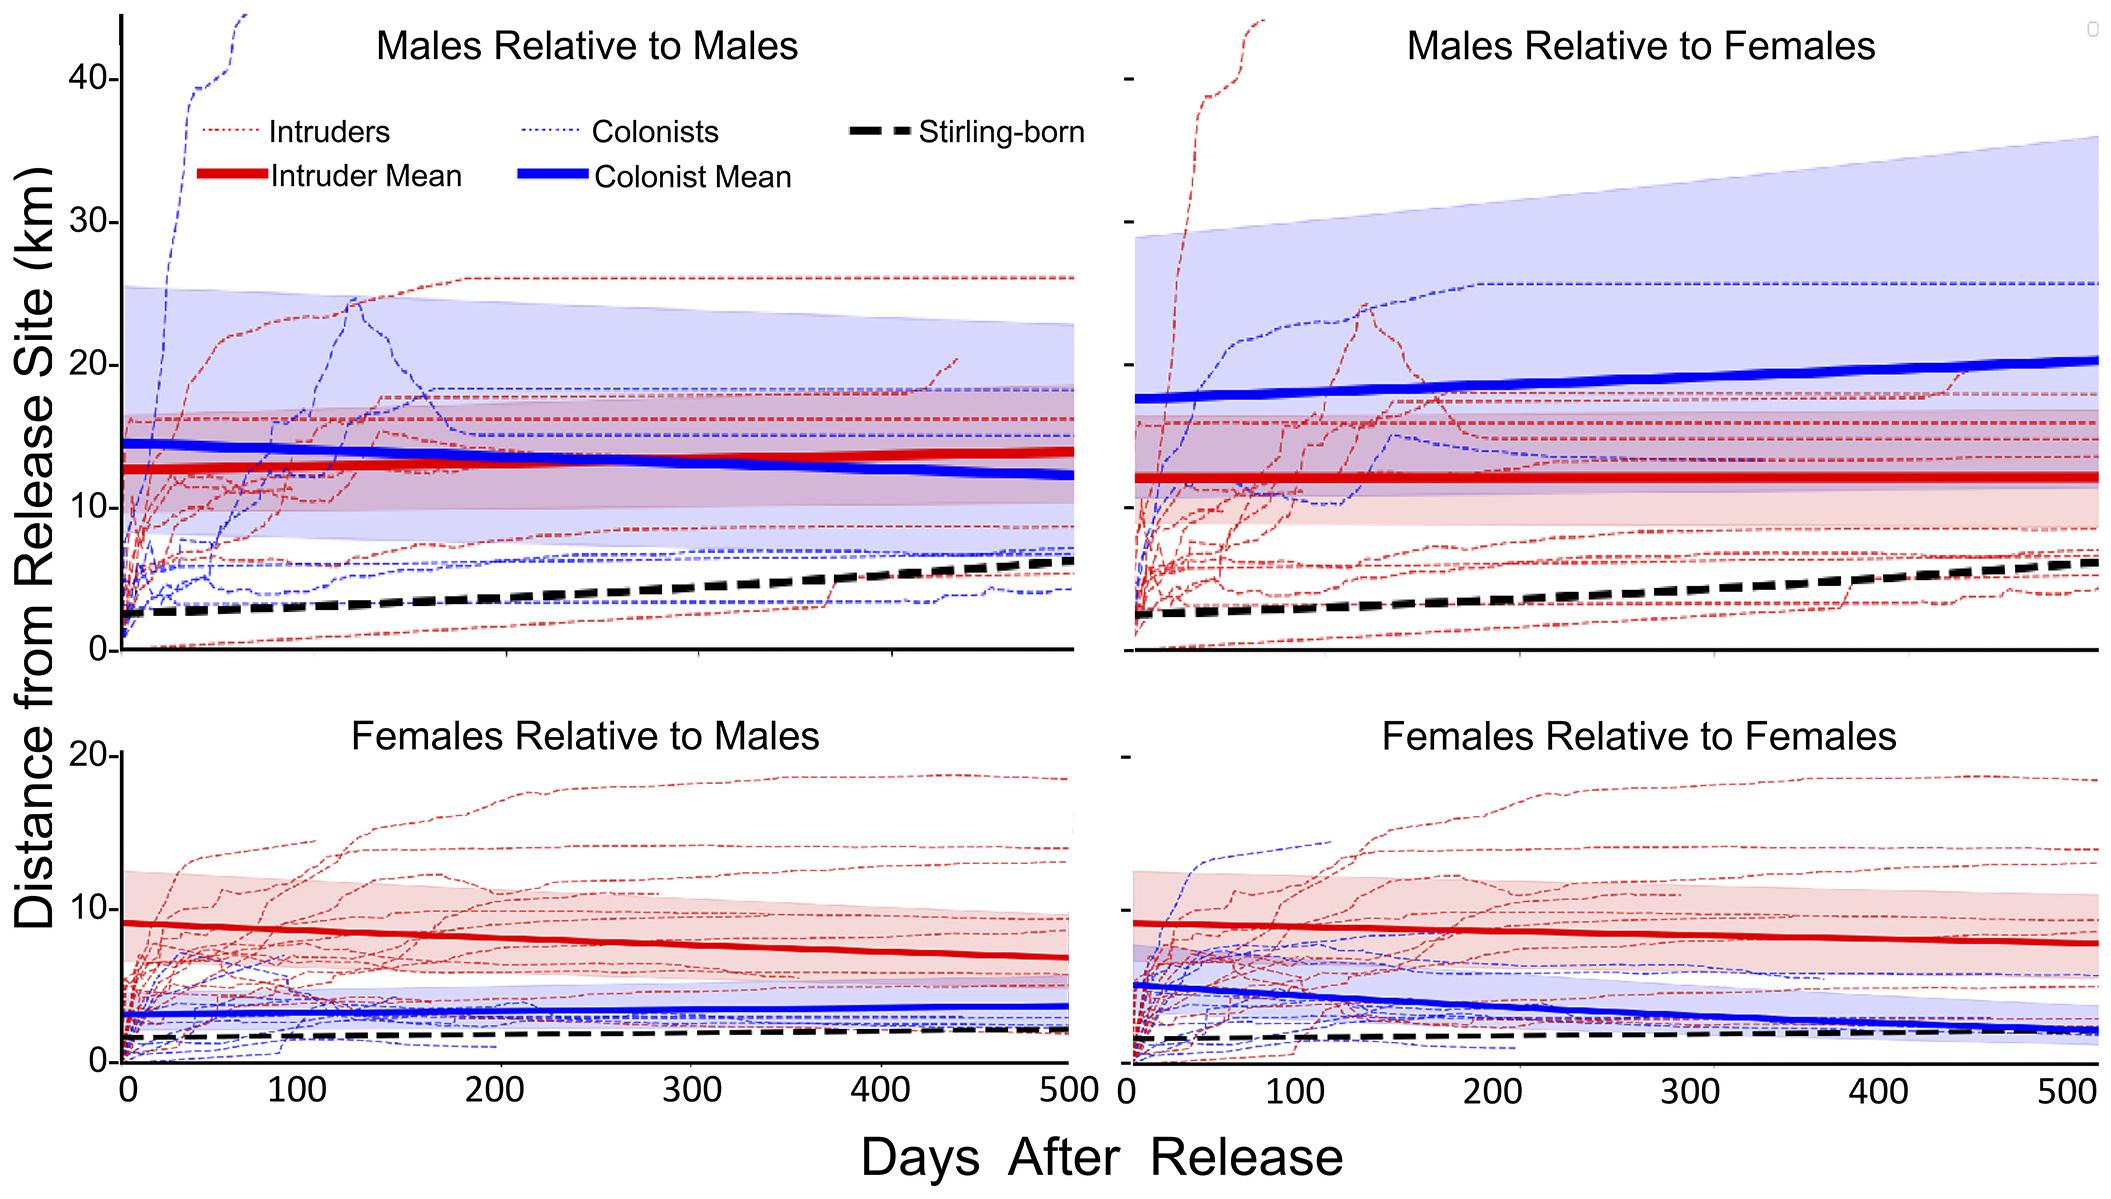
Figure 5. Running mean distances (light red and blue dashed lines) from the sites of initial release following translocation for individual male (upper panels) and female (lower panels) fishers and the fitted mean distances for fishers released onto the established home ranges of previously released fishers (Intruders, red solid lines) and sites unoccupied by fishers (Colonists, blue lines) compared to fishers that were born on the study site (solid black lines). The y-intercepts represent initial movements from release sites.
The estimated habitat quality at the release areas (circle with 1 km radius) was 0.50 ± 0.05 (on a scale of 0-1, n = 12; Figures 2, 6). Most fishers were released into habitat that was of higher quality that would have been found at random (Figure 6A). Females and males settled into areas of similar habitat quality (female 0.49 ± 0.09; male 0.46 ± 0.08; F1,36, P = 0.52) and, generally, fishers established home ranges in areas of similar quality habitat (mean = 0.48 ± 0.09; Figure 6B) as their release sites. Circles distributed randomly onto the landscape had a mean habitat quality of 0.38 ± 0.08, which does not differ from the means for where males or females settled (t = 0.22, df = 1, P > 0.05). Had we released fishers at random locations and had they established home ranges at some new random location, the average change in habitat quality would have been −0.05 ± 0.11 (Figure 6). Over all fishers, difference for release vs settlement habitat quality averaged −0.03 ± 0.08 (Figure 6).
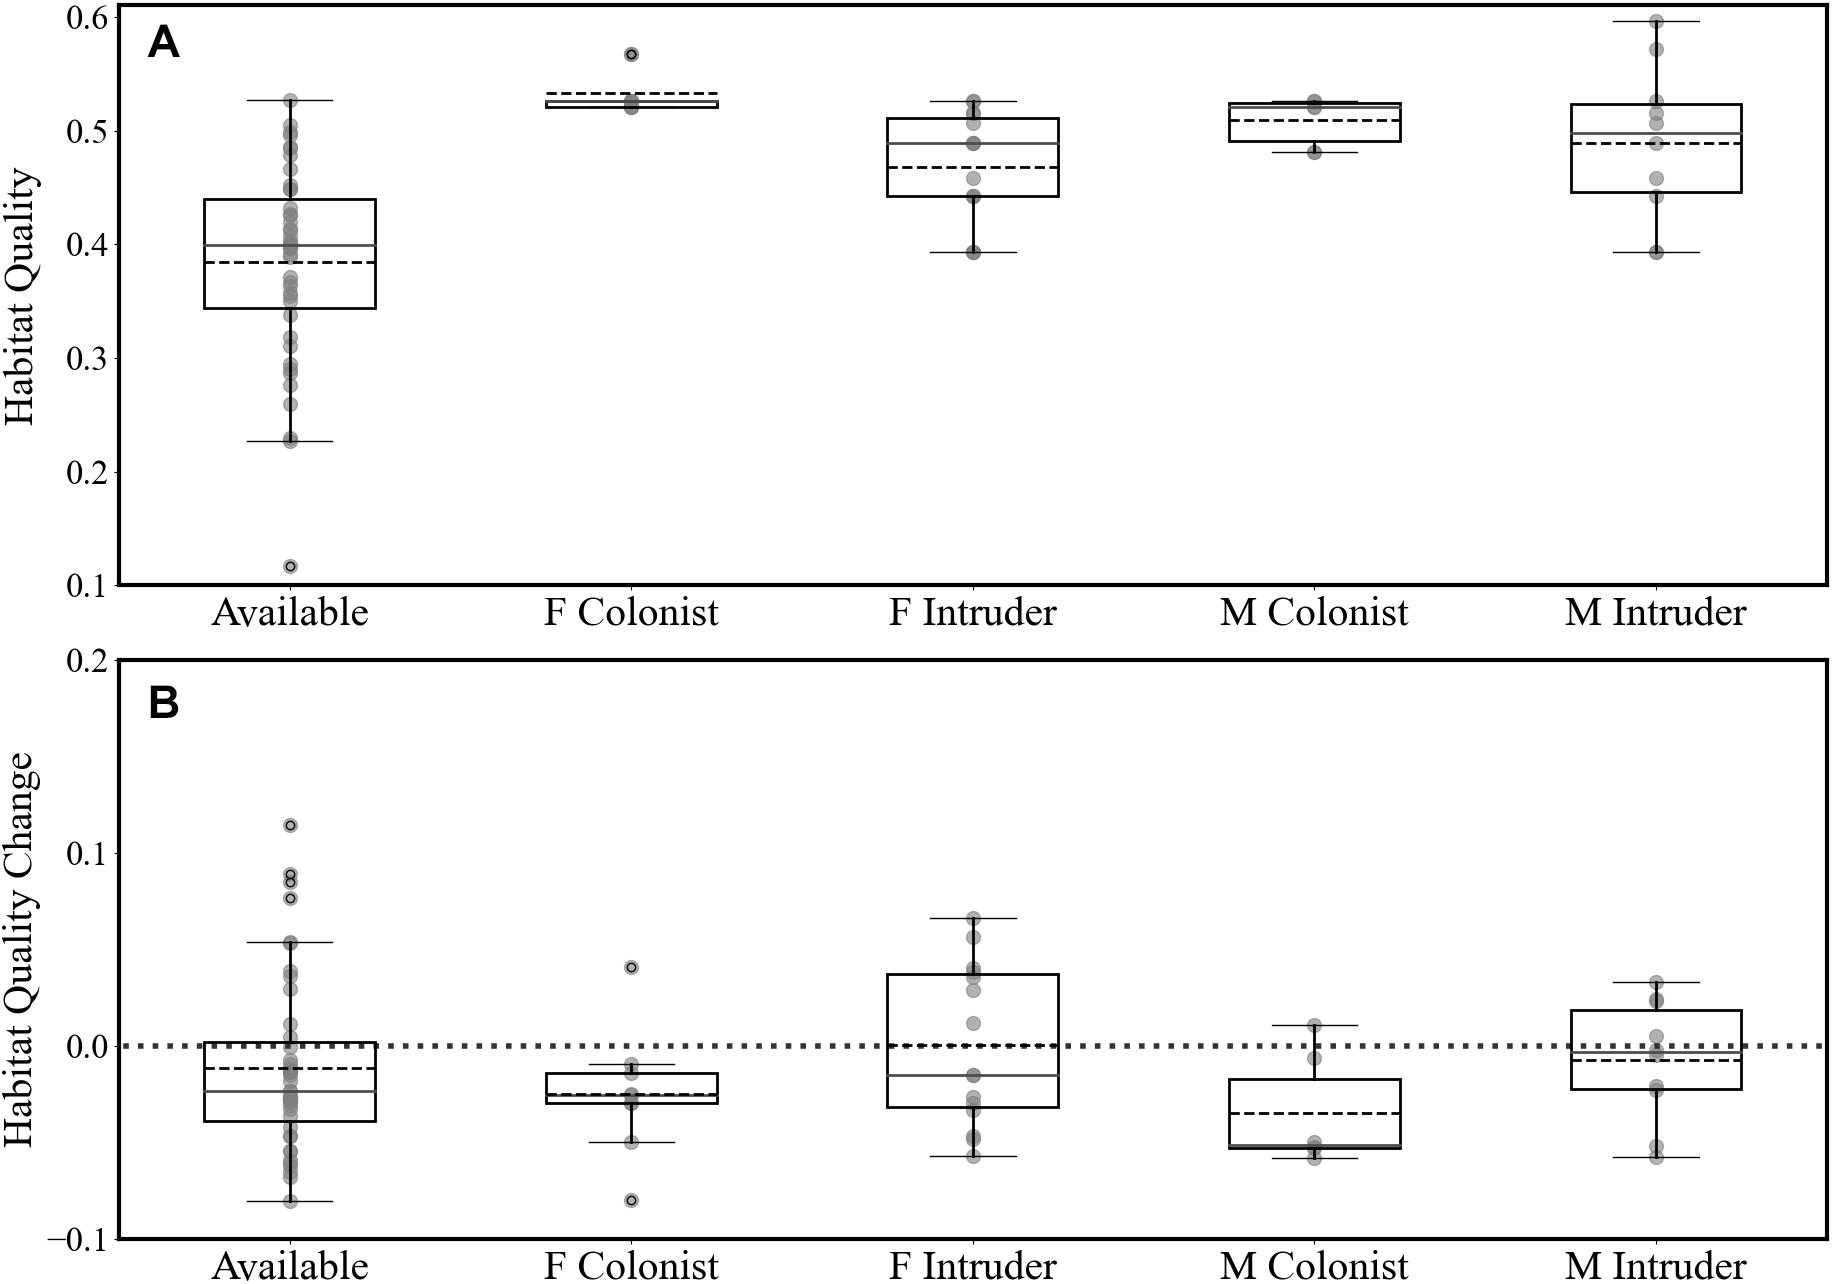
Figure 6. (A) Distribution of the estimated mean habitat quality for release areas (circles with 1-km radius around release sites) and (B) the distribution of the difference in mean habitat quality between release sites and final home ranges of released fishers (positive values indicate that habitat quality in home ranges is higher than at release sites). We calculated habitat quality for fishers’ home ranges for the area within the 50% isopleths and for available habitat.at randomly distributed circles with 1-km radius, Fishers released where no conspecifics hade established home ranges (F Colonist), Fishers released within the established home ranges of other fishers we call Intruders. Fishers released where no other fishers had established home ranges we called Colonists. Dashed black center lines are mean values and solid gray lines are medians.
The movements of reintroduced fishers were best described by models incorporating the presence of previously released fishers, differences (i.e., interactions between) for how males and females responded to encountering conspecifics, and included settlement habitat (Table 3). The highest ranked model for each of our three movement metrics had high support (Akaike’s weight range 0.56–0.78) AICc for the next ranked model > 6.6 for all; Table 3). Models that included effects only from sex and time or changes in habitat quality from the release to settled areas of fishers had little support (weight range = 0.1–0.3). For all three metrics, model estimates indicated a negative relationship relative to settlement habitat (Distance: β = −3.54 ± 1.02, P < 0.005; Polygon Area: β = −4.21 ± 0.99, P < 0.001; Centroid Distance: β = −3.10 ± 0.75, P < 0.005). Distance and Centroid Distance were best described by whether a fisher encountered a female fisher’s home range, whereas Polygon Area was best described by encountering a female fisher’s home range (Table 3). Female fishers that encountered the home ranges of conspecifics of either sex immediately after release moved farther and explored larger areas than did female fishers not encountering conspecifics (Figure 5). The effect on a female fisher of encountering another fisher’s home range was apparent on all three metrics of movement (Figure 5 and Table 3). Females moved similar distances if they encountered only females’ or only males’ home ranges (Table 4). Female fishers that encountered both females’ and males’ home ranges moved farthest. Conversely, male fishers exhibited a contrasting pattern. All male fishers encountered the home range of at least one male or female but males that failed to encounter a female fisher’s home range moved farther than those that encountered only a male’s home range or that encountered both (Table 4).
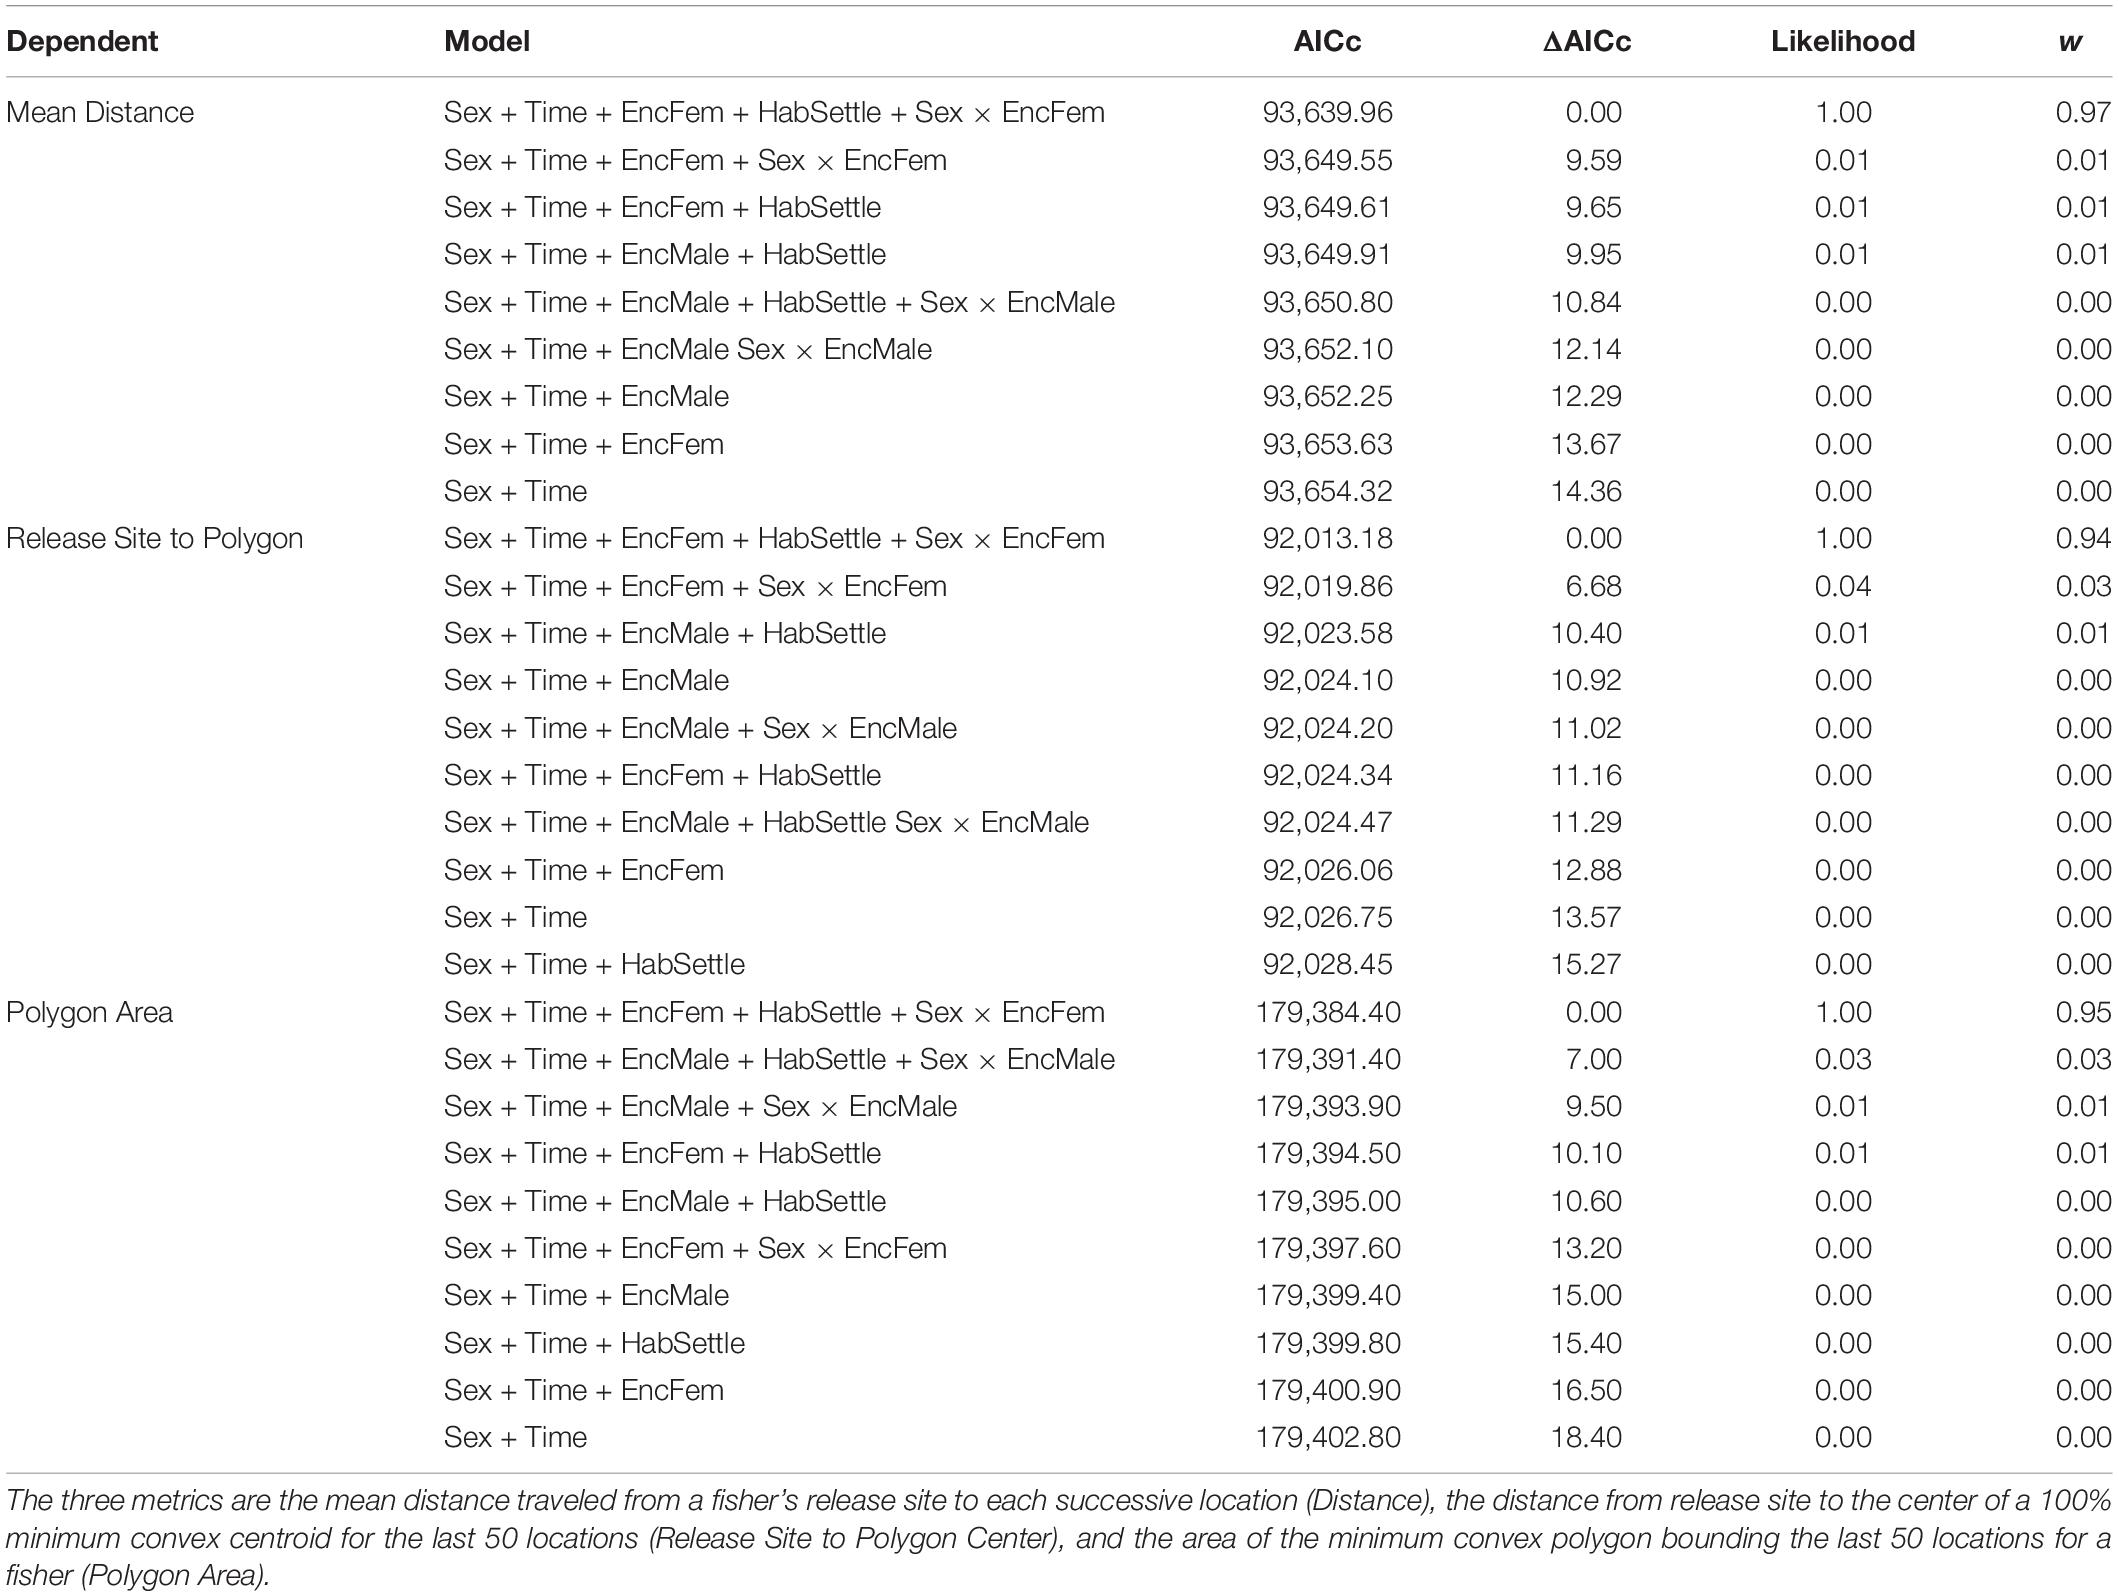
Table 3. Model selection criteria including the AICc scores, ΔAICc comparing top model to other competing models, the likelihood of each model, and the model weight (w) for each of six competing model from analyses of three dependent metrics of fisher movements after reintroduction.
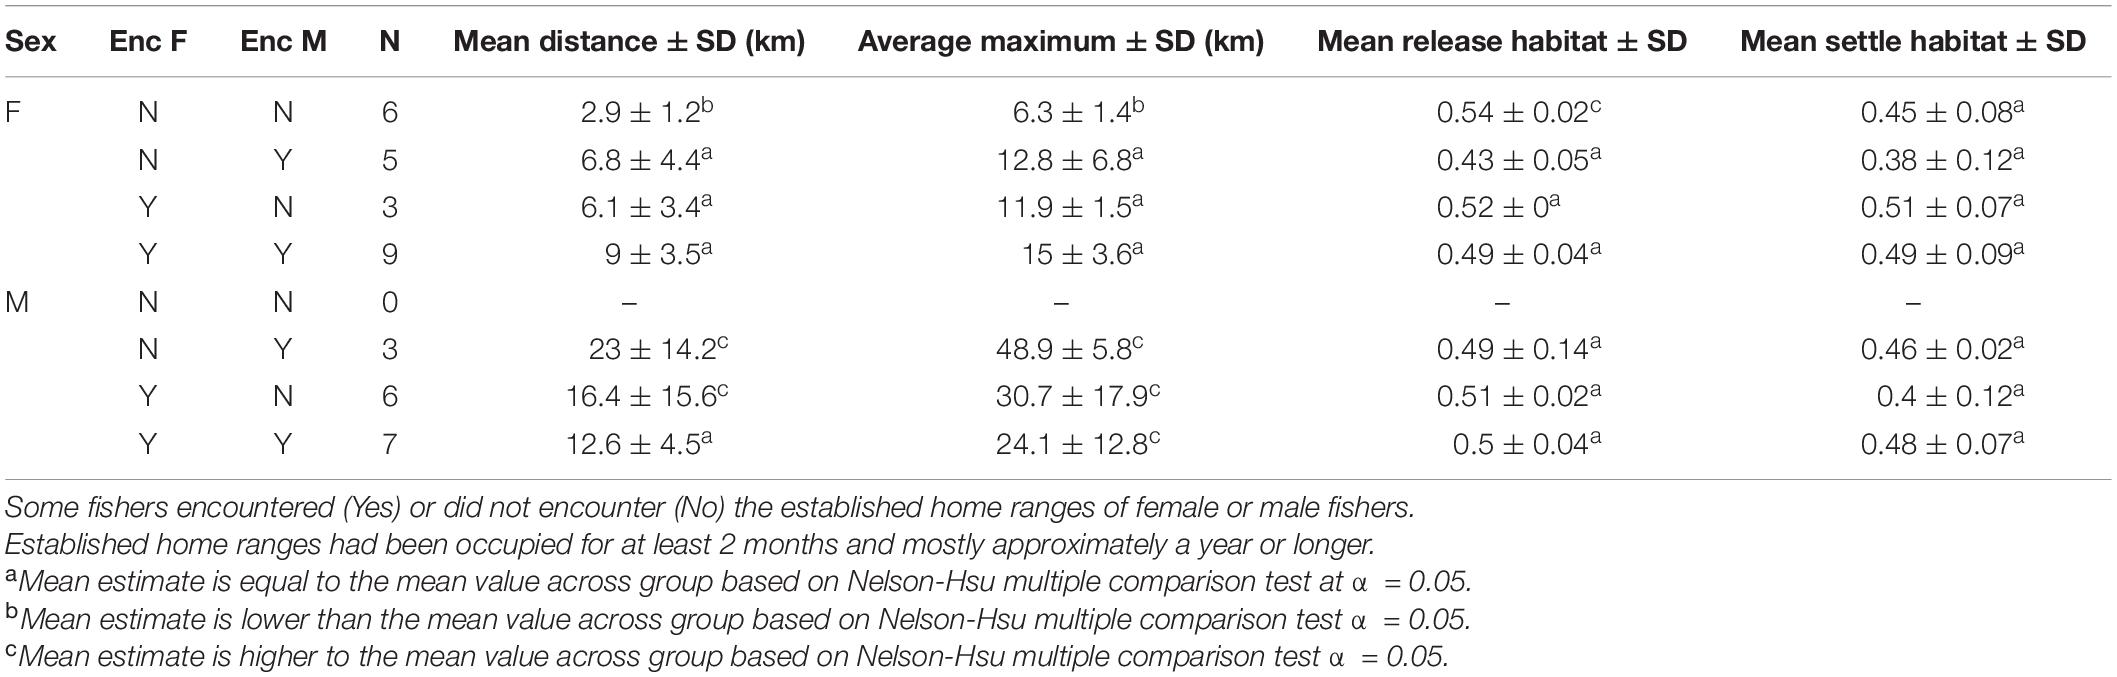
Table 4. The mean of the mean and maximum distances that reintroduced fishers traveled from their release sites through the first 500 days of observation.
The pattern of female fishers moving farther in apparent response to conspecifics was consistent throughout the period of analysis. The patterns for all three metrics of movement for females that did not encounter another fisher’s home range were more similar to the patterns for Stirling-born fishers than to the patterns for females that encountered home ranges of males or females (Table 2). The distances that female fishers moved (Distance) and the area used on the landscape (Polygon Area) decreased across time (Table 2). This pattern occurred because all females exhibited relatively high movement rates immediately after reintroduction, in contrast to non-reintroduced female fishers. The patterns for males that encountered or did not encounter home ranges of other fishers were less distinct than were those of females (Figure 5). All three movement metrics for reintroduced males, regardless of whether they encountered the home range of another fisher or not, increased or stabilized as time passed (Table 2), consistent with the patterns for Stirling-born males. For all three metrics generally, the mean values for males encountering or not encountering other fishers’ home ranges overlapped and had high variances. Several males traveled long distances (up to > 20 km) from their release sites within the first 200 days after release, regardless of whether they encountered conspecifics, some of whom returned to the study site later (Figure 5).
Discussion
Clearly, the movements of fishers indicate they perceive, internalize, and respond to the presence of other fishers on a landscape. Such observations are consistent with learned behaviors that modify future decisions and, potentially, fitness (Heft, 2013; Eichenbaum, 2017; Lewis et al., 2021). Consequently, the spacing of other fishers on the landscape and their potentials to affect resources are incorporated into each fisher’s cognitive map and affects how each individual fisher uses that landscape. Fishers placed in, or that encountered, the existing home ranges of conspecifics did not stay long within these areas, demonstrating that they quickly learned of and responded to the presence of conspecifics. Female fishers released without competition were nearly identical in their average pattern of movement to Stirling-born fishers born on the study site. Stirling-born fishers were found in a variety of habitat qualities and, ostensibly, had created home ranges or areas that minimized competition.
The movements of female fishers are best explained best by accounting for the presence or absence of other fishers’ home ranges and not exclusively by searching, and finding, areas of high habitat quality compared to where they were released. Females that did not encounter competition stayed close to their release sites and, at times, settled into marginally poorer (though still high) habitat (Figure 6). Were habitat their main priority these females could have moved to settle in overall higher quality habitat. In contrast, encountering the home ranges of other fishers, either male or female, caused female fishers to move farther and to explore more of the landscape before establishing their own home ranges. Female fishers discounted high quality habitat in the presence of competition and often moved to similar or worse habitat to where they were released. Our results indicate that female fishers preferred to avoid competition rather than attempt to remain in areas with already high habitat quality. Females who did not encounter other fishers’ home ranges close to their release sites had movement patterns nearly identical to those of Stirling-born, non-reintroduced, fishers (Figure 5). Females moved less in the absence of competition regardless of habitat quality. The movements of male fishers were more varied but consistently different from females’ movements. Males who encountered the home ranges of one or more females moved shorter distances both daily and until they established home ranges than did males who did not. The habitat quality where fishers established home ranges did not differ from that at the fishers’ release sites nor from the habitat quality available on the landscape of our study site. Females and males established home ranges in areas with similar habitat quality (Figure 6).
Habitat quality was found in our top models but appeared, at least partially, as a consequence of fishers moving in response to conspecifics. Fishers that moved the furthest settled in the worst habitat relative to other fishers. Some male colonists and intruders each made long movements and settled long distances but also ended up in poorer quality habitat. Yet some males from each category moved less and settled in better habitat. Effectively, the mechanisms that seemed to cause fishers to move were their encounters with conspecifics, but the outcome was that animals that moved the most often settled into worst habitat. For males, long movements may come from both failing to find females initially or conflict with larger males. Had we more fishers to observe, we may have been better able to evaluate interactions between individual fishers and habitat choices. We do not claim that habitat is unimportant only that is appeared secondary to conspecifics interactions.
Conceivably, habitat quality could have been more influential in our study had we not chosen a-priori to release fishers only into areas with above average habitat quality for our study area, to maximize chances of population growth and establishment (Callas and Figura, 2008; Facka, 2017). A 4 × 4 study design with fishers released with and without competition in high- and low-quality habitat would have tested the effects of habitat better. Yet, this too may have been insufficient because fishers, like most carnivorans, can move widely and encounter other individuals incidentally—despite attempted study designs. Generally, we expect that both habitat quality and conspecifics influence movements and spacing patterns. Under other circumstances, habitat may be more important to fishers, or other animal’s, movements (McNicol et al., 2020). We can state only that competition with conspecifics strongly affected the post-release movements of released fishers during this reintroduction in keeping with our initial hypotheses.
We conclude that intrasexual territoriality is a social system imposed on female fishers by males and that niche partitioning is not involved, consistent with Powell’s (1994) hypothesis. Large movements by male fishers in the absence of encountering female fishers indicate that maintaining information on mating opportunities even outside of the breeding season is important to male fishers (Sandell, 1986; Holmes and Powell, 1994). The large sizes of adult male fishers prevent females from excluding males from their home ranges. Yet males and females make similar habitat choices and have similar diets (Powell, 1993; Holmes and Powell, 1994). We have established male imposition should be considered and further tested with data from other mammal populations that maintain intrasexual territories.
As with all conservation-based projects, the reintroduction forced us to make many trade-offs. We relied on Argos telemetry collars for males because of their long movements we may not have tracked with conventional VHF telemetry. Indeed, without the Argos collars, we would have missed many long-distance movements, often into unexpected areas and habitats. In the first year, telemetry collars for males did not arrive until 2 months after the first females had been released, leading males to encountered females shortly after release. In 2010, we experimented with newly produced GPS collars but found them unreliable and hence, unable to document mortality reliably (Facka, 2017). Despite these limitations, our study demonstrates how research and hypothesis testing can be designed into reintroductions.
Some male fishers that did not encounter female fishers moved long distances within the first weeks after release. Yet, some male fishers that did encounter female fishers also moved great distances. We hypothesize that such inconsistent movements depend on attributes of the male fishers that are resident or intruding. On two occasions, we released a young, relatively small male fisher whose movements became localized shortly after release. Subsequently, we introduced a large, adult male onto the small male’s incipient territory and the small male moved to a new, incipient territory after wandering a long distance; the adult male settled in the small male’s original incipient territory. When small male fishers are in the absence of female fishers or in the presence of large, dominant male fishers, their travel (dispersal) distances are like those observed for male fishers elsewhere (Proulx et al., 1994; Lewis et al., 2010). Unfortunately, we had insufficient data to tease apart these types of interactions. Interactions between old, experienced male fishers and young male fishers may occur relatively infrequently but probably influence structure and placement of territories on landscapes. Though males appear to have adopted a different strategy, they appeared to have learned the distributions and attributes of conspecifics quickly which were revealed in their movements.
For species with the potential for large sexual size dimorphism, the dimorphism exhibited by any cohort appears to depend on the abundance of prey during the year or years of growth for males of that cohort (Holmes, 1987; Powell and King, 1997). Thus, the extent of dimorphism is not a species trait, just the existence of the dimorphism is. Male stoats (Mustela erminea) growing during years of food shortage do not grow as large as those born into abundance but the small male stoats live longer, giving them more years of reproduction (Powell and King, 1997). Small males are, nonetheless, larger than females and able to impose intrasexual territoriality.
The effect of conspecific competition on use of a landscape is a critical component of assessing habitat quality for animals. Because habitat quality affects the fitness of individuals, the presence of competitors should have consequences for the fitness of the resident of a home range (Mitchell and Powell, 2003, 2004, 2007; Mosser et al., 2009). The risk of resource depression or depletion where residents had already become established caused newly released fishers to travel through and beyond areas of high habitat quality to establish home ranges elsewhere. Such complex interactions are important for understanding animals in native settings as well as for understanding how, when and where to release specific types of individuals during reintroductions.
We assessed the cost of resource depression by comparing the quality of home range-sized areas that were rejected by released fishers, the quality of areas incorporated by residents into their home ranges, and the quality of areas where newly released animal settled. For research that identifies individual animals within an established population, we propose that apparently unused areas of good habitat are actually the home ranges of animals that have not been documented. We refer to such areas with undetected residents as “ghost home ranges.”
Our results provide further nuance to the consistent observation that male and female mammals use environments differently. Particularly for solitary, terrestrial carnivorans, males have larger home ranges, make longer movements, and often have home ranges that overlap with females (Powell, 1979a, 1993; Powell et al., 1997; Kovach, 1998; Stirling, 1988; Johnson et al., 2000; King and Powell, 2007; Persson et al., 2010; Sweitzer et al., 2015; Elbroch, 2017). We conclude that males effectively impose competition on females—ostensibly to monitor females for mating opportunities (Powell, 1994). Such motivations and spatial relationships are likely to be similar for many other mammals with large sexual size dimorphism, at least most solitary, terrestrial carnivorans.
Data Availability Statement
The original contributions presented in the study are included in the article/supplementary material, further inquiries can be directed to the corresponding author/s.
Ethics Statement
The animal study was reviewed and approved by Institutional Care and Use Committee of North Carolina State University.
Author Contributions
Both authors contributed significantly to research design, data collection, data analyses, and writing.
Funding
This work was supported by Section 6 grants from the California department of Fish and Wildlife (grant numbers F12AP00317 and F16AP00040), United States Fish and Wildlife Service Fish and Wildlife Management Assistance grants (numbers F11AP00371, F13AC00136, and F15AC00857), an United States Fish and Wildlife Service Interagency Agreement with the USDA Rocky Mountain Research Station (agreement number 14-IA-11221635-18), and from funds and in-kind support from Sierra Pacific Industries (no grant number).
Conflict of Interest
The authors declare that the research was conducted in the absence of any commercial or financial relationships that could be construed as a potential conflict of interest.
Publisher’s Note
All claims expressed in this article are solely those of the authors and do not necessarily represent those of their affiliated organizations, or those of the publisher, the editors and the reviewers. Any product that may be evaluated in this article, or claim that may be made by its manufacturer, is not guaranteed or endorsed by the publisher.
Acknowledgments
This research was the result of collaboration between many groups that designed and executed different facets of the project. The California Department of Fish and Wildlife, United States Fish and Wildlife Service, Sierra Pacific Industries, and North Carolina State University are the four key cooperators and are responsible for the reintroduction and the research in California. We would like to thank Laura Finley, J. Scott Yaeger, Ed Murphy, Tom Engstrom, Richard Callas, and Peter Figura for their contributions to developing and executing the reintroduction. We would also like to thank Deana Clifford for her guidance on health and disease monitoring. Kevin Smith and Colin Beach were invaluable technicians that tracked animals daily through adverse conditions. We have received, logistical support, trapping support, and access to land from the United States Forest Service, Timber Products, Fruit Growers Inc., Green Diamond Resource Company, Collins Pine Ltd., the Bureau of Land Management, and Integral Ecology Research Center. We would also like to thank Sean Matthews, Tom Engstrom, Richard Callas, Roland Kays, Nick Haddad, Chris DePerno, and Rob Dunn whose comments improved an earlier version of this manuscript. The Institutional Animal Care and Use Committee of North Carolina State University (09-007-O and subsequent) approved handling procedures. We followed guidelines for handling of fishers that were consistent with those of the American Society of Mammalogists for the use of wild mammals for research (Sikes and Gannon, 2011) and the guidelines of Powell and Proulx (2003).
References
Allen, A. W. (1983). Habitat Suitability Index Models: Fisher. Western Energy and Land Use Team, Division of Biological Services, Research and Development, Fish and Wildlife Service, US Dept. of the Interior. Washington, DC: Fish and Wildlife Service.
Arthur, S. M., Cross, R. A., Paragi, T. F., and Krohn, W. B. (1992). Precision and utility of cementum annuli for estimating ages of fishers. Wildlife Soc. Bull. 20, 402–405.
Badry, M. J., Proulx, G., and Woodard, P. M. (1997). “Home-range and habitat use by fishers translocated to the aspen parkland of Alberta,” in Manes: Taxonomy, Ecology, Techniques, and Management, eds G. Proulx, H. N. Bryant, and P. M. Woodard (Edmonton, AB: The Provincial Museum of Alberta), 233–251.
Beesley, D. (2007). Crow’s Range: An Environmental History of the Sierra Nevada. Reno, NV: University of Nevada Press.
Berger-Tal, O., and Saltz, D. (2014). Using the movement patterns of reintroduced animals to improve reintroduction success. Curr. Zool. 60, 515–526. doi: 10.1093/czoolo/60.4.515
Betts, M. G., Gutzwiller, K. J., Smith, M. J., Robinson, W. D., and Hadley, A. S. (2015). Improving inferences about functional connectivity from animal translocation experiments. Landsc. Ecol. 30, 585–593. doi: 10.1007/s10980-015-0156-x
Brown, J. H., and Lasiewski, R. C. (1972). Metabolism of weasels: the cost of being long and thin. Ecology 53, 939–943. doi: 10.2307/1934312
Brown, J. L. (1969). Territorial behavior and population regulation in birds: a review and re-evaluation. Wilson Bull. 81, 293–329.
Brown, J. L., and Orians, G. H. (1970). Spacing patterns in mobile animals. Annu. Rev. Ecol. System. 1, 239–262. doi: 10.1146/annurev.es.01.110170.001323
Burnham, K. P., and Anderson, D. R. (2002). Model Selection and Multimodel Inference: A Practical Information-Theoretic Approach. New York, NY: Springer Verlag.
Callas, R. L., and Figura, P. (2008). Translocation Plan for the Reintroduction of Fishers (Martes pennanti) to Lands Owned by Sierra Pacific Industries in northern Sierra Nevada of California. Sacremento, CA: Department of Fish and Game, 80.
Carpenter, F. L., and MacMillen, R. E. (1976). Threshold model of feeding territoriality and test with a Hawaiian honeycreeper. Science 194, 634–642. doi: 10.1126/science.194.4265.639
Charnov, E. L., Orians, G. H., and Hyatt, K. (1976). Ecological implications of resource depression. Am. Natur. 110, 247–259. doi: 10.1086/283062
Coyne, M., and Godley, B. (2005). Satellite tracking and analysis tool (STAT): an integrated system for archiving, analyzing and mapping animal tracking data. Mar. Ecol. Prog. Ser. 301, 1–7. doi: 10.3354/meps301001
Dayan, T., and Simberloff, D. (1994). Character displacement, sexual dimorphism, and morphological variation among British and Irish mustelids. Ecology 75, 1063–1071. doi: 10.2307/1939430
Dayan, T., and Simberloff, D. (1996). “Patterns of size separation in carnivore communities,” in Carnivore Behavior, Ecology and Evolution, Vol. 2, ed. J. L. Gittleman (Ithaca, NY: Cornell University Press), 243266.
Dayan, T., and Simberloff, D. (1998). Size patterns among competitors: ecological character displacement and character release in mammals, with special reference to island populations. Mammal Rev. 28, 99–124. doi: 10.1046/j.1365-2907.1998.00029.x
Eichenbaum, H. (2017). Where are you Going? The neurobiology of navigation: the role of the hippocampus in navigation is memory. J. Neurophysiol. 117, 1785–1796. doi: 10.1152/jn.00005.2017
Elbroch, M. (2017). Pumas: solitary but social? Front. Ecol. Environ. 15:168–169. doi: 10.1002/fee.1479
Elbroch, L. M., Lendrum, P. E., Quigley, H., and Caragiulo, A. (2016). Spatial overlap in a solitary carnivore: support for the land tenure, kinship or resource dispersion hypotheses? J. Anim. Ecol. 85, 487–496. doi: 10.1111/1365-2656.12447
Erlinge, S., and Sandell, M. (1986). Seasonal changes in the social organization of male stoats, Mustela erminea: an effect of shifts between two decisive resources. Oikos 47, 57–62. doi: 10.2307/3565919
Facka, A. N. (2017). Conservation Translocations as Opportunities for Scientific Advancement: A Case Study with Fishers (Pekania pennanti) [Doctoral]. Raleigh, NC: North Carolina State University, 299.
Facka, A. N., Lewis, J. C., Happe, P., Jenkins, K., Callas, R., and Powell, R. A. (2016). Timing of translocation influences birth rate and population dynamics in a forest carnivore. Ecosphere 7:e01223. doi: 10.1002/ecs2.1223
Fieberg, J., and Johnson, D. H. (2015). MMI: Multimodel inference or models with management implications? J. Wildlife Manag. 79, 708–718. doi: 10.1002/jwmg.894
Field, I. C., Bradshaw, C. J., Burton, H. R., Sumner, M. D., and Hindell, M. A. (2005). Resource partitioning through oceanic segregation of foraging juvenile southern elephant seals (Mirounga leonina). Oecologia 142, 127–135. doi: 10.1007/s00442-004-1704-2
Gosling, L. (1982). A reassessment of the function of scent marking in territories. Z. Tierpsychol. 60, 89–118. doi: 10.1111/j.1439-0310.1982.tb00492.x
Goubault, M., Outreman, Y., Poinsot, D., and Cortesero, A. M. (2005). Patch exploitation strategies of parasitic wasps under intraspecific competition. Behav. Ecol. 16, 693–701. doi: 10.1093/beheco/ari043
Griffin, J. R., and Critchfield, W. B. (1972). The Distribution of Forest Trees in California: Pacific Southwest Forest and Range Experiment Station. Albany, CA: Pacific Southwest Forest and Range Experiment Station.
Harestad, A. S., and Bunnel, F. L. (1979). Home range and body weight–a reevaluation. Ecology 60, 389–402. doi: 10.2307/1937667
Heft, H. (2013). “Wayfinding, navigation, and environmental cognition from a naturalist’s stance,” in Handbook of Spatial Cognition, eds D. Waller and L. Nadel (Washington, DC: American Psychological Association), 265–294. doi: 10.1037/13936-015
Holmes, T. Jr. (1987). Sexua Dimorphism in North American Weasels with a Phylogeny of the Mustelidae. Ph.D. dissertation. Lawrence, KS: University of Kanses, 323.
Holmes, T., and Powell, R. A. (1994). “Morphology, ecology, and the evolution of sexual dimorphism in North American Martes,” in Martens, Sables, and Fishers. Biology and Conservation, eds S. W. Buskirk, A. S. Harestad, M. G. Raphael, and R. A. Powell (Ithaca, NY: Cornell University Press), 72–84.
Husar, S. L. (1976). Behavioral character displacement: evidence of food partitioning in insectivorous bats. J. Mammal. 57, 331–338. doi: 10.2307/1379692
Jȩdrzejewski, W., and Jȩdrzejewska, B. (1990). Effect of a predator’s visit on the spatial distribution of bank voles: experiments with weasels. Can. J. Zool. 68, 660–666. doi: 10.1139/z90-096
Jȩdrzejewski, W. L., Rychlik, L., and Jȩdrzejewska, B. (1993). Responses of bank voles to odours of seven species of predators: experimental data and their relevance to natural predator-vole relationships. Oikos 68, 251–257. doi: 10.2307/3544837
Jetz, W., Carbone, C., Fulford, J., and Brown, J. H. (2004). The scaling of animal space use. Science 306:266. doi: 10.1126/science.1102138
Johnson, D. D. P., Macdonald, D. W., and Dickman, A. J. (2000). Analysis and review of models of the sociobiology of the Mustelidae. Mammal Rev. 30, 171–196. doi: 10.1046/j.1365-2907.2000.00066.x
Kent, L., and Tang-Martínez, Z. (2014). Evidence of individual odors and individual discrimination in the raccoon, Procyon lotor. J. Mammal. 95, 1254–1262. doi: 10.1644/14-MAMM-A-009
King, C. M., and Powell, R. A. (2007). The Natural History of Weasels and Stoats: Ecology, Behavior, and Management. Oxford: Oxford University Press. doi: 10.1093/acprof:oso/9780195322712.001.0001
Koskela, E., and Ylönen, H. (1995). Suppressed breeding in the field vole (Microtus agrestis): an adaptation to cyclically fluctuating predation risk. Behav. Ecol. 3, 311–315. doi: 10.1093/beheco/6.3.311
Kovach, A. I. (1998). Dominance and Reproduction in Male Black Bears. Ph.D. dissertation. Raleigh, NC: North Carolina State University, 168.
Kovach, A. I., and Powell, R. A. (2003). Effects of body size on male mating tactics and paternity in black bears, Ursus americanus. Can. J. Zool. 81, 1257–1268. doi: 10.1139/z03-111
Krohn, W. (2012). “Distribution changes of American martens and fishers in eastern North America, 1699–2001,” in Biology and Conservation of Martens, Sables, and Fishers: a New Synthesis, eds K. B. Aubry, W. Zielinski, M. G. Raphael, G. Proulx, and S. W. Buskirk (Ithaca, NY: Cornell University Press), 58–77.
Law, C. (2019). Solitary meat-eaters: solitary, carnivorous carnivorans exhibit the highest degree of sexual size dimorphism. Sci. Rep. 9:15344. doi: 10.1038/s41598-019-51943-x
Law, C. J., and Mehta, R. S. (2018). Carnivory maintains cranial dimorphism between males and females: evidence for niche divergence in extant Musteloidea. Evolution 72, 1950–1961. doi: 10.1111/evo.13514
Lewis, J. C., Happe, P. J., Jenkins, K. J., and Manson, D. J. (2010). Olympic Fisher Reintroduction Project: 2010 Progress Report. Olympia, WA: Washington Department of Fish and Wildlife.
Lewis, J. C., Powell, R. A., and Zielinski, W. J. (2012). Carnivore translocations and conservation: insights from population models and field data for fishers (Martes pennanti). PLoS One 7:e32726. doi: 10.1371/journal.pone.0032726
Lewis, M., and Murray, J. (1993). Modelling territoriality and wolf-deer interactions. Nature 366, 738–740. doi: 10.1038/366738a0
Lewis, M. A., Fagan, W. F., Auger-Méthé, M., Frair, J., Fryxell, J. M., Gros, C., et al. (2021). Learning and animal movement. Front. Ecol. Evol. 9:681704. doi: 10.3389/fevo.2021.681704
Linklater, W., Flamand, J., Rochat, Q., Zekela, N., MacDonald, E., Swaisgood, R., et al. (2006). Preliminary analyses of the free-release and scent-broadcasting strategies for black rhinoceros reintroduction. Ecol. J. 7, 26–34.
Lofroth, E. C., Raley, C. M., Higley, J. M., Truex, R. L., Yaeger, J. S., Lewis, J. C., et al. (2010). Conservation of Fishers (Martes pennanti) in South-Central British Columbia, western Washington, western Oregon, and California – Volume I: Conservation Assessment. Denver, CO: USDI Bureau of Land Management.
Macdonald, D. W. (1983). The ecology of carnivore social behavior. Nature 301, 379–384. doi: 10.1038/301379a0
Matthews, S. M., Higley, J. M., Yaeger, J. S., and Fuller, T. D. (2011). Density of fishers and the efficacy of relative abundance indices and small-scale occupancy estimation to detect a population decline on the Hoopa Valley Indian Reservation. Calif. Wildlife Soc. Bull. 35, 69–75. doi: 10.1002/wsb.19
McNab, B. K. (1963). Bioenergetics and the determination of home range size. Am. Natur. 97, 133–140. doi: 10.1086/282264
McNicol, C. M., Bavin, D., Bearhop, S., Bridges, J., Croose, E., Gill, R., et al. (2020). Postrelease movement and habitat selection of translocated pine martens Martes martes. Ecol. Evol. 10, 5106–5118. doi: 10.1002/ece3.6265
Mech, L. D., and Boitani, L. (2003). “Introduction,” in Wolves: Behavior, Ecology and Conservation, eds L. D. Mech and L. Boitani (Chicago, IL: University of Chicago Press), xv–xvii. doi: 10.7208/chicago/9780226516981.001.0001
Mitchell, M. S., and Powell, R. A. (2003). Linking fitness landscapes with the behavior and distribution of animals. Landscape Ecology and Resource Management: Linking Theory with Practice. Washington, DC: Island Press, 93–124.
Mitchell, M. S., and Powell, R. A. (2004). A mechanistic home range model for optimal use of spatially distributed resources. Ecol. Modell. 177, 209–232. doi: 10.1016/j.ecolmodel.2004.01.015
Mitchell, M. S., and Powell, R. A. (2007). Optimal use of resources structures home ranges and spatial distribution of black bears. Anim. Behav. 74, 219–230. doi: 10.1016/j.anbehav.2006.11.017
Mosser, A., Fryxell, J. M., Eberly, L., and Packer, C. (2009). Serengeti real estate: density vs. fitness−based indicators of lion habitat quality. Ecol. Lett. 12, 1050–1060. doi: 10.1111/j.1461-0248.2009.01359.x
Nunes, S., Zugger, P. A., Engh, A. L., Reinhart, K. O., and Holekamp, K. E. (1997). Why do female Belding’s ground squirrels disperse away from food resources? Behav. Ecol. Sociobiol. 40, 199–207. doi: 10.1007/s002650050333
Ohmann, J. L., Gregory, M. J., Henderson, E. B., and Roberts, H. M. (2011). Mapping gradients of community composition with nearest−neighbour imputation: extending plot data for landscape analysis. J. Vegetation Sci. 22, 660–676. doi: 10.1111/j.1654-1103.2010.01244.x
Pandey, G., Cayan, D., and Georgakakos, K. (1999). Precipitation structure in the Sierra Nevada of California. J. Geophys. Res. 104, 12019–12030. doi: 10.1029/1999JD900103
Persson, J., Wedholm, P., and Segerström, P. (2010). Space use and territoriality of wolverines (Gulo gulo) in northern Scandinavia. Eur. J. Wildlife Res. 56, 49–57. doi: 10.1007/s10344-009-0290-3
Poole, K. G., Matson, G., Strickland, M. A., Magoun, A. J., Graf, R. P., and Dix, L. M. (1994). “Age and sex determination for American Martens and Fishers,” in Martens, Sables, and Fishers: Biology and Conservation, eds S. W. Buskirk, A. S. Harestad, M. G. Raphael, and R. A. Powell (Ithaca, NY: Cornell University Press), 204–223.
Powell, R. A. (1979b). Mustelid spacing patterns: variations on a theme by Mustela. Z. Tierpsychol. 50, 153–165.
Powell, R. A. (1979a). Ecological energetics and foraging strategies of the fisher (Martes pennanti). J. Anim. Ecol. 48, 195–212. doi: 10.2307/4109
Powell, R. A. (1989). “Effects of resource productivity, patchiness and predictability on mating and dispersal strategies,” in Comparative Socioecology of Mammals and Humans. British Ecological Society Symposium, eds V. Standen and R. A. Foley (Oxford: Blackwell Scientific), 101–123.
Powell, R. A. (1991). “Structure and spacing of Martes populations,” in Abstracts of Presentations: Symposium on the Biology and Management of Martens and Fishers, eds R. A. Powell, S. Buskirk, and J. Jones (Laramie, WY: University of Wyoming), 64.
Powell, R. A. (1993). The Fisher: Life History, Ecology, and Behavior, 2nd Edn. Minneapolis, MN: University of Minnesota Press.
Powell, R. A. (1994). “Structure and spacing of Martes populations,” in Martens, Sables, and Fishers: Biology and Conservation, eds S. W. Buskirk, A. S. Harestad, M. G. Raphael, and R. A. Powell (Ithaca, NY: Cornell University Press), 101–121.
Powell, R. A. (2004). “Home ranges, cognitive maps, habitat models and fitness landscapes for Martes,” in Martens and Fishers (Martes) in Human-altered Environments: an International Perspective, eds D. J. Harrison, A. K. Fuller, and G. Proulx (Boston, MA: Springer), 135–146. doi: 10.1007/0-387-22691-5_6
Powell, R. A. (2012). Diverse perspectives on mammal home ranges or A home range is more than location densities. J. Mammal. 93, 887–889. doi: 10.1644/12-MAMM-5-060.1
Powell, R. A., Facka, A. N., Gabriel, M., Gilbert, J. H., Higley, J. M., Lapoint, S. D., et al. (2017). “The fisher as a model organism,” in Biology and Conservation of Wild Musteloids, eds D. McDonald, L. A. Harrington, and C. Newman (Oxford: Oxford Press). doi: 10.1093/oso/9780198759805.003.0011
Powell, R. A., and King, C. M. (1997). Do body size, sexual dimorphism and age-specific survival in Mustela erminea vary with fluctuating food supplies? Biol. J. Linean Soc. 62, 165–194. doi: 10.1111/j.1095-8312.1997.tb01621.x
Powell, R. A., Lewis, J. C., Slough, B. G., Brainerd, S. M., Jordan, N. R., Abramov, A. V., et al. (2012). Evaluating Translocations of Martens, Sables, and Fishers: Testing Model Predictions With Field Data. Biology and Conservation of Martens, Sables, and Fishers: a New Synthesis. Ithaca, NY: Cornell University Press.
Powell, R. A., and Mitchell, M. S. (2012). What is a home range? J. Mammal. 93, 948–958. doi: 10.1644/11-MAMM-S-177.1
Powell, R. A., and Proulx, G. (2003). Trapping and marking terrestrial mammals for research: Integrating ethics, performance criteria, techniques, and common sense. Inst. Lab. Anim. Res. J. 44, 259–276. doi: 10.1093/ilar.44.4.259
Powell, R. A., and Zielinski, W. J. (1983). Competition and coexistence in mustelid communities. Acta Zool. Fennica 174, 223–227.
Powell, R. A., and Zielinski, W. J. (2005). Evaluating the Demographic Factors that Affect the Success of reintroducing Fishers (Martes pennanti), and the Effect of Removals on a Source Population. Report. Yreka, CA: US Fish and Wildlife Service.
Powell, R. A., Zimmerman, J. W., and Seaman, D. E. (1997). Ecology and Behaviour of North American Black Bears: Home Ranges, Habitat and Social Organization. London: Chapman & Hall.
Proulx, G., Kolenosky, A. J., Badry, M. J., Drescher, R. K., Seidel, K., and Cole, P. J. (1994). “Post-release movements of translocated fishers,” in Martens, Sables, and Fishers: Biology and Conservation, eds S. W. Buskirk, A. S. Harestad, M. G. Raphael, and R. A. Powell (Ithaca, NY: Cornell University Press), 197–203.
Raley, C. M., Lofroth, E. C., Truex, R. L., Yaeger, J. S., and Higley, J. M. (2012). “Habitat ecology of fishers in western North America,” in Biology and Conservation of Martens, Sables, and Fishers: A New Synthesis, eds K. B. Aubry, W. J. Zielinski, M. G. Raphael, G. Proulx, and S. W. Buskirk (Ithaca, NY: Cornell University Press), 231–254.
Rennie, K. M. (2015). Home Range Overlap and Spatial-Temporal Interactions in Female Fishers on the Hoopa Indian Reservation in California. Arcata, CA: Humboldt State University.
Rogers, L. L. (1987). Effects of food supply and kinship on social behavior, movements, and population growth of black bears in northeastern Minnesota. Wildlife Monogr. 97, 1–72.
Sandell, M. (1986). Movement patterns of male stoats Mustela erminea during the mating season: differences in relation to social status. Oikos 47, 63–70. doi: 10.2307/3565920
Sandell, M. (1989). “The mating tactics and spacing patterns of solitary carnivores,” in Carnivore Behaviour, Ecology and Evolution, ed. J. L. Gittleman (Ithaca, NY: Cornell University Press), 164–182. doi: 10.1007/978-1-4757-4716-4_7
Sauder, J. D., Rachlow, J. L., and Wiest, M. M. (2012). Influence of topography and canopy cover on Argos satellite telemetry performance. Wildlife Soc. Bull. 36, 813–819. doi: 10.1002/wsb.157
Schoener, T. W. (1967). The ecological saignificance of sexual dimorphism in size in the lizard Anolis conspersus. Science 155, 477. doi: 10.1126/science.155.3761.474
Seaman, D. E. (1992). Home range and male reproductive optimization in black bears. PhD thesis. Raleigh, NC: North Carolina State University, 101.
Seaman, D. E., and Powell, R. A. (1996). An evaluation of the accuracy of kernel density estimators for home range analysis. Ecology 77, 2075–2085. doi: 10.2307/2265701
Selander, R. K. (1966). Sexual dimorphism and differential niche utilization in birds. Condor 68:151. doi: 10.2307/1365712
Sells, S. N., and Mitchell, M. S. (2020). The economics of territory Selection. Ecol. Modell. 438:109329. doi: 10.1016/j.ecolmodel.2020.109329
Silverman, B. W. (1986). Density Estimations for Statistics and Data Analysis. London: Chapman and Hall.
Sikes, R. S., and Gannon, W. L. (2011). Guidelines of the American Society of Mammalogists for the use of wild mammals in research. J. Mammal. 92, 235–253. doi: 10.1644/10-MAMM-F-355.1
Simms, D. A. (1979). North American weasels: resource utilization and distribution. Can. J. Zool. 57, 504–520. doi: 10.1139/z79-061
Sjöåsen, T. (1997). Movements and establishment of reintroduced European otters Lutra lutra. J. Appl. Ecol. 34, 1070–1080. doi: 10.2307/2405295
Smith, C. C. (1968). The adaptive nature of social organization in the genus of tree squirrel Tamiasciurus. Ecol. Monogr. 38, 31–63. doi: 10.2307/1948536
Smith, K. P., Facka, A. N., and Powell, R. A. (2020). Using reintroduction to elucidate breeding system, breeding phenology, and infanticide for a solitary carnivore (fisher, Pekania pennanti). Can. J. Zool. 98, 433–447. doi: 10.1139/cjz-2019-0234
Snyder, F. R., and Wiley, J. W. (1976). Sexual size dimorphism in hawks and owls of North America. Ornithol. Monogr. 20:96. doi: 10.2307/40166710
Spencer, W. D. (2012). Home ranges and the value of spatial information. J. Mammal. 93, 929–947. doi: 10.1644/12-MAMM-S-061.1
Sweitzer, R., Thompson, C., Purcell, K., and Barrett, R. (2015). Sierra Nevada Adaptive Management Plan (SNAMP), Appendix D: Fisher Team Final Report. Sierra Nevada Adaptive Management Project. Available online at: snamp.cnr.berkeley.edu. (accessed October 12, 2021).
Thomasma, L. E., Drummer, T. D., and Peterson, R. O. (1991). Testing the habitat suitability index model for the Fisher. Wildlife Soc. Bull. 19, 291–297.
Thomasma, L. E., Drummer, T. D., and Peterson, R. O. (1994). “Modeling habitat selection by Fishers,” in Martens, Sables, and Fishers: Biology and Conservation, eds S. W. Buskirk, A. S. Harestad, M. G. Raphael, and R. A. Powell (Ithaca, NY: Cornell University Press), 316325.
Townsend, A. (2019). Tree Squirrels and Fishers in Northern California: The Effects of Masting Hardwoods on Stand Use. MS thesis. Arcata, CA: Humboldt State University, 114.
United States Department of the Interior, Fish and Wildlife Service, California Department of Fish and Game, and Sierra Pacific Industries and North Carolina State University (2009). Memorandum of Understanding for the California Fisher Translocation Monitoring Program. Yreka, CA: U.S. Fish and Wildlife Service.
Weir, R. D. (1995). Diet, Spatial Organization, and Habitat Relationships of Fishers in South-Central British Columbia [Thesis]. Burnaby, BC: Simon Fraser University, 139.
Wilson, D. S. (1975). The adequacy of size as a niche difference. Am. Natur. 109, 769–784. doi: 10.1086/283042
Yamaguchi, N., and Macdonald, D. W. (2003). The burden of co-occupancy: intraspecific resource competition and spacing patterns in American mink, Mustela vison. J. Mammal. 84, 1341–1355. doi: 10.1644/1545-1542(2003)084<1341:TBOCIR>2.0.CO;2
Ylönen, H. (1989). Weasels Mustela nivalis suppress reproduction in cyclic bank voles Clethrionomys glareolus. Oikos 55, 138–140. doi: 10.2307/3565886
Yurgenson, P. B. (1947). Sexual dimorphism in feeding as an ecological adaptation of a species. Byull. Mosk. Obsh. Isp. Prirody 52, 33–35.
Keywords: carnivore, competition, habitat, home range, intrasexual territory, movements, niche partitioning, territory
Citation: Facka AN and Powell RA (2021) Intraspecific Competition, Habitat Quality, Niche Partitioning, and Causes of Intrasexual Territoriality for a Reintroduced Carnivoran. Front. Ecol. Evol. 9:734155. doi: 10.3389/fevo.2021.734155
Received: 30 June 2021; Accepted: 05 October 2021;
Published: 01 November 2021.
Edited by:
Eliezer Gurarie, University of Maryland, College Park, United StatesReviewed by:
Scott LaPoint, Black Rock Forest Consortium, United StatesJacqueline Frair, SUNY College of Environmental Science and Forestry, United States
Copyright © 2021 Facka and Powell. This is an open-access article distributed under the terms of the Creative Commons Attribution License (CC BY). The use, distribution or reproduction in other forums is permitted, provided the original author(s) and the copyright owner(s) are credited and that the original publication in this journal is cited, in accordance with accepted academic practice. No use, distribution or reproduction is permitted which does not comply with these terms.
*Correspondence: Aaron N. Facka, anfacka@gmail.com