Assessing DNA Sequence Alignment Methods for Characterizing Ancient Genomes and Methylomes
 Marine Poullet
 Ludovic Orlando
- 1Laboratoire d’Anthropobiologie et d’Imagerie de Synthèse, CNRS UMR 5288, Faculté de Médecine de Purpan, Toulouse, France
- 2GLOBE Institute, University of Copenhagen, Copenhagen, Denmark
Applying high-throughput DNA sequencing technologies to the ancient DNA molecules preserved in subfossil material can provide genetic information from past individuals, populations, and communities at the genomic scale. The combination of dedicated statistical techniques and specific molecular tools aimed at reducing the impact of post-mortem DNA damage can also help recover epigenetic data from ancient individuals. However, the capacity of different sequence aligners to identify ultrashort and deaminated ancient DNA templates and their impact on the characterization of ancient methylomes remain overlooked. In this study, we use both simulated and real ancient DNA sequence data to benchmark the performance of the read alignment tools most commonly used in ancient DNA research. We identify a read alignment strategy making use of the Bowtie2 aligner that substantially reduce computational times but shows increased sensitivity relative to previous recommendations based on the BWA aligner. This strategy significantly improves the genome coverage especially when DNA templates are shorter than 90 bp, as is typically the case for ancient DNA. It also impacts on ancient DNA methylation estimates as it maximizes coverage improvement within CpG dinucleotide contexts, which hold the vast majority of DNA methylation marks in mammals. Our work contributes to improve the accuracy of DNA methylation maps and to maximize the amount of recoverable genetic information from archeological and subfossil material. As the molecular complexity of ancient DNA libraries is generally limited, the mapping strategy recommended here is essential to limit both sequencing costs and sample destruction.
Introduction
The first genome from an ancient human individual was sequenced in 2010 (Rasmussen et al., 2010) and was immediately followed by the genome sequencing of a Neanderthal (Green et al., 2010) and Denisovan (Reich et al., 2010) individual, two extinct archaic hominins. Since then, hundreds of ancient genomes have been characterized across many branches of the tree of life, including humans, horses, dogs, pigs, cattle, goats, wooly mammoths, but also many human pathogens and crops such as maize, sorghum, and barley (see Marciniak and Perry, 2017 and Brunson and Reich, 2019 for reviews). Ancient genome time series have made it possible to chart migration, admixture, and selection through space and time at unprecedented resolution. They have provided many opportunities to revisit evolutionary scenarios developed from patterns of cultural variation among archeological sites (e.g., the spread of steppe-related ancestry during the Eneolithic and early Bronze Age, see Allentoft et al., 2015; Haak et al., 2015; Damgaard et al., 2018a; Narasimhan et al., 2019; Wang et al., 2019) and from patterns of genetic variation in present-day populations (e.g., the temporal and geographic rise of lactose tolerance in western Eurasia, Mathieson et al., 2015; Ségurel and Bon, 2017).
The variation present in ancient DNA sequences does not only inform us about the genetic affinities of past individuals, populations, and species. It can also provide insights into ancient epigenetic landscapes, which play a crucial role in the regulation of gene expression (Lea et al., 2018) in response to infection (Smith et al., 2014; Pacis et al., 2015) as well as social (Laubach et al., 2019; Santos et al., 2019; Sanz et al., 2019; Snyder-Mackler et al., 2019) and environmental (Fagny et al., 2015) cues. It can, thus, help predict individual phenotypes in the past (see Pedersen et al., 2014 and Hanghøj et al., 2016 for age predictions on ancient individuals, or Gokhman et al., 2019 for morphological predictions).
Although methods have been developed to infer nucleosome maps in ancient tissues (Pedersen et al., 2014; Hanghøj et al., 2016), most of ancient epigenetic work thus far has focused on detecting DNA methylation within CpG dinucleotide (CpG) contexts. While molecular tools such as bisulfite sequencing (Llamas et al., 2012; Smith et al., 2015) or immunoprecipitation (Seguin-Orlando et al., 2015) have been used, genome-wide DNA methylation maps have been mostly produced through statistical inference leveraging the differential sequence footprint of post-mortem DNA damage at methylated and unmethylated sites, in particular at CpGs (see Hanghøj and Orlando, 2018 for a review). When molecular tools are used to prevent the sequencing of those unmethylated CpGs that have been degraded into UpGs, ancient methylated CpGs can indeed be revealed through CpG→TpG mis-incorporations in the sequence data (see “Materials and Methods”). Most recent methodologies have been proposed to mitigate the impact of evolutionary divergence and/or sequence variation at CpG sites on the calculation of DNA methylation scores (Hanghøj et al., 2019).
High-quality DNA sequence alignments against a reference genome are essential to make accurate predictions of past genetic and epigenetic variation. Yet, the vast majority of ancient DNA studies make use of read aligner software that were developed for mapping short read sequences produced from rather long DNA molecules extracted from fresh tissues. They are, thus, not optimized for the ultra-short and degraded nature of ancient DNA templates (Dabney et al., 2013). Several studies have contrasted a range of mapping conditions to identify those most specific and most sensitive (e.g., Schubert et al., 2012; Cahill et al., 2018) or to mitigate the extent of reference bias (Günther and Nettelblad, 2019; Martiniano et al., 2019). Yet, the sensitivity and specificity of other read aligners for ancient DNA data, such as Bowtie2 (Langmead and Salzberg, 2012), as well as the impact of different read alignment strategies on ancient methylation inference, remain untested. However, since the latter relies on patterns of CpG→TpG mis-incorporations introduced in the genome sequence data by post-mortem DNA damage, the read-to-reference edit distance is expected to be increased at methylated sites. This may affect the alignment sensitivity at such sites and, in turn, impact the accuracy of DNA methylation inference for ancient individuals. It is, thus, essential to investigate the possible sensitivity of read alignment methods at CpG dinucleotides so as to not underestimate DNA methylation levels along the genome and to accurately identify differentially methylated regions between individuals showing different levels of post-mortem DNA damage.
In this study, we assess the performance of 11 read alignment strategies for mapping ancient DNA sequence data against reference genomes and their impact on the inference of ancient DNA methylation. Our main purpose is not to carry out an exhaustive investigation about the impact of mapping parameters on an entire array of sequence data reflecting various post-mortem DNA decay conditions (for such studies, please refer to, e.g., Schubert et al., 2012; Cahill et al., 2018; Renaud et al., 2018). We instead focus on identifying those parameters and factors with potential impact on DNA methylation, using publicly available sequence data carefully selected from the literature to have been generated both in the absence and presence of USER treatment of the same ancient DNA extracts. The latter currently provide the best source of information to estimate CpG methylation level from patterns of CpG→TpG mis-incorporations (see Hanghøj and Orlando, 2018 for a review). Overall, we uncover that the end-to-end alignment mode of Bowtie2 shows better performance than all other commonly used alternatives. Simulated and real ancient human DNA sequence data reveal that the coverage can be increased by up to 2.1–9.4% for a given sequencing effort. The gain in recovered read alignments is particularly important within CpGs and significantly impacts the inference of regional DNA methylation levels. Applying such alignment procedures thus, improves both the quality of the genome and epigenetic data produced from ancient individuals and extinct species.
Materials and Methods
Ancient DNA Sequence Datasets
Previously published raw sequence data from four ancient human individuals were downloaded from the European Nucleotide Archive (Table 1). For three of the four ancient humans (SI, SIII, and SIV, Sikora et al., 2017), Illumina DNA sequences were generated for libraries prepared with and without treatment with the USER enzymatic mix (Rohland et al., 2015). The USER treatment makes use of a first enzymatic activity, the uracil DNA glycosylase, to eliminate uracil residues (U) accumulated in ancient DNA templates due to post-mortem deamination of cytosine residues (C). This leaves abasic sites as targets for a second enzymatic reaction in which the Endonuclease VIII cleaves the DNA backbone 3′ of the abasic site. As a result, the fraction of DNA library templates containing U residues is reduced, which limits the number of C→T nucleotide mis-incorporations introduced during sequencing (Briggs et al., 2010). USER treatment is, however, inefficient for those C residues that were methylated but deaminated post-mortem, as the uracil DNA glycosylase shows no activity on the resulting thymine (T) residues. Therefore, C→T nucleotide mis-incorporations are mostly restricted to methylated loci in the presence of USER treatment (Pedersen et al., 2014). In these conditions, the read-to-genome edit distance can be expected to be inflated at such sites, which may affect the performance of read alignment software. In the absence of USER treatment, this effect is, however, expected to impact all C residues that were deaminated post-mortem, be methylated or not. Contrasting sequence data generated from raw or USER-treated ancient DNA extracts provided, thus, an opportunity to assess the performance of read alignment software at methylated loci. The sequence data underlying the ancient genomes of Sunghir Upper Paleolithic individuals originate from similar preservation conditions and were generated both in the presence and in the absence of USER treatment. These data thus provided us with an opportunity to assess whether mapping conditions could affect regional methylation prediction.
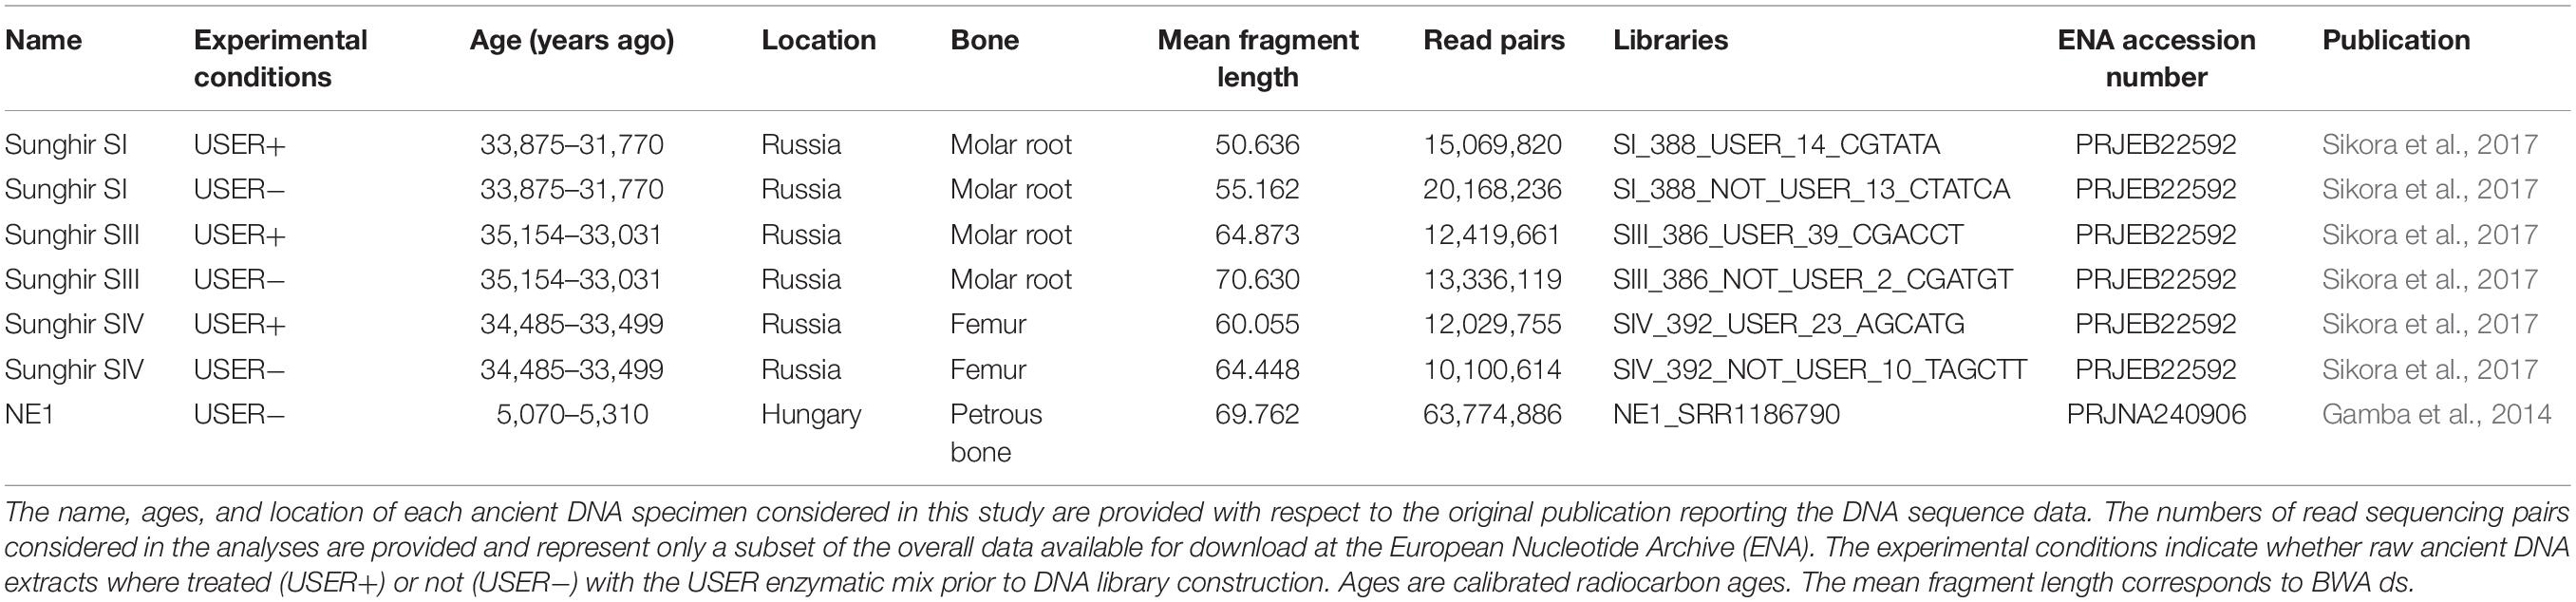
Table 1. Sample and sequence information.
Data Simulation
Quantifying the sensitivity and predicted positive value of DNA alignment software requires the identification of the fraction of reads correctly mapped (true positives), those not correctly mapped (false positives), and those not mapped at all (false negatives). In order to assess those performance statistics, we simulated DNA sequence data using the human (hg19, The Genome Sequencing Consortium, 2001) reference genome and Gargammel (Renaud et al., 2017). This software returns DNA sequences of a selected size and can include sequencing errors typical of Illumina DNA sequencing instruments and, optionally, DNA mis-incorporations reflecting post-mortem DNA damage. A total of 3.3 million read pairs were simulated both in the presence and in the absence of ancient DNA damage for an entire size range of DNA templates overlapping typical ancient DNA size distributions. This included 100,000 read pairs for each size increment of one nucleotide within the 25–45 bp range, as well as 100,000 read pairs for each size increment of five nucleotides within the 45–90 bp range, and finally 100,000 read pairs for each size increment of 10 nucleotides within the 90–120 bp range. DNA damage was simulated using the DNA mis-incorporation of sample SIII produced by mapDamage2 (Jónsson et al., 2013). The alignment file that was used as input for mapDamage2 was generated by Paleomix (version 1.2.13.2, Schubert et al., 2014) using the same human reference genome as above and the default end-to-end alignment mode of Bowtie2, sensitive.
Read Processing and Alignment
Both simulated and real ancient DNA sequence data were processed using Paleomix. This automated computational pipeline carries out a number of read processing steps, including adapter trimming, pair collapsing, mapping, quality/size filtering, duplicate removal, and local realignment. Mapping was performed using both BWA (Li and Durbin, 2009) and Bowtie2 (Langmead and Salzberg, 2012), which represent the two most commonly used read alignment software in ancient DNA research. BWA version 0.7.17 was used in this study, together with two main alignment modes (backtrack and mem). The backtrack algorithm was applied both using seed or disabling seeding with default parameters (-n 0.04), as recommended by Schubert et al. (2012) for ancient DNA data. Version 2.3.5.1 of the Bowtie2 read mapper was used, applying both the local and end-to-end alignment modes and the four sensitivity options provided (very fast, fast, sensitive, and very sensitive). Combined, this represented a total of 11 read alignment conditions. Read pairs were automatically collapsed as single reads when showing sufficient sequence overlap and the base quality was recalculated according to sequence match at those overlapping positions, following the default procedure implemented in the AdapterRemoval2 software (Schubert et al., 2016). Reads shorter than 25 bp post-trimming and/or collapsing were disregarded except for BWA mem where reads shorter than 30 bp were disregarded. Computational running times were recorded using the time bash command.
Coverage and DNA Methylation Calculations
Binary Alignment Map (BAM) read alignment files and summary files obtained from Paleomix were processed for a number of analyses. First, average depth-of-coverage was calculated disregarding alignments showing quality scores strictly lower than 30. This corresponded to the estimated endogenous coverage provided in the Paleomix summary file. Second, average depth-of-coverage estimates were calculated at CpG, CpA, CpC, and CpT dinucleotides using the coverage option of Bedtools (Quinlan and Hall, 2010), conditioning on the bed coordinates of each dinucleotide type present in the human reference genome (-d option). The coordinates were obtained using Seqkit Version 0.3.1.1 (Shen et al., 2016). Third, we repeated the previous calculations after soft-clipped bases present in the read alignments were masked using the Jvarkit Biostar84452 tool (Lindenbaum, 2015). All previous analyses were carried out on both the read and simulated DNA sequence data. For simulated data, we also estimated the sensitivity and positive predicted value of each alignment condition. The alignment sensitivity was measured by dividing the number of true-positive alignments by their sum with the number of false-negative alignments [i.e., true positives/(true positives + false negatives] (Schubert et al., 2016). The alignment positive predictive value was estimated as the fraction of all simulated reads that were correctly mapped [i.e., true positives/(true positives + false positives)] (Schubert et al., 2016). Reads were considered as true positives if they showed a minimum of 80% of their length overlapping the known genomic coordinates used for simulation. Reads were considered as false negative when not mapping and false positives otherwise. These three categories were identified using python version 2.7.5 and the pysam library (Li et al., 2009). Additionally, DNA methylation analyses were carried out using the recently developed DamMet package (version 1.0.1, Hanghøj et al., 2019), in which the fraction of DNA methylation, f, can be estimated for a given genomic region including a pre-selected number of CpG dinucleotides. In this study, we selected 22,845 regions showing a total of 100 CpG dinucleotides in the human reference genome as the amount of sequence data considered was not sufficient to retrieve genuine estimates in regions of smaller sizes (data not shown). The corresponding genomic coordinates were provided to DamMet in the form of a BED coordinate file using the -B option. The f DNA methylation values were directly retrieved for each genomic window from the DamMet output. For consistency, coverage estimates within each window were calculated using the approach described above. All plots were generated using RStudio Version 1.1.463 (RStudio Team, 2016) and the ggplot2 library (Wickham, 2016).
Results
Overall Alignment Performance
BWA (Li and Durbin, 2009) represents the most common software for aligning ancient DNA data against a reference genome. Previous work has established that disabling seeding in BWA increased mapping sensitivity for ancient DNA data, owing to the presence of inflated mis-incorporation rates at read ends (Schubert et al., 2012). Additional work investigated the specificity and sensitivity of Bowtie2 for ancient DNA data (Cahill et al., 2018). The performance of both aligners has, however, not been benchmarked on ancient DNA data with the specific aim to assess their possible impact on the inference of ancient DNA methylation. We, thus, compared their overall alignment performance on previously published ancient DNA data from four ancient humans, consisting of three Upper Paleolithic individuals excavated at Sunghir (SI, SIII, and SIV) and one Neolithic individual from Hungary (NE1) (Table 1). This represented a total of 11 mapping conditions, including 3 for BWA (with/out seeding, and mem) and 8 for Bowtie2 (very fast, fast, sensitive, and very sensitive options for both the local and end-to-end alignment modes). Alignment performance was calculated by normalizing the genome coverage obtained in one mapping condition relative to that obtained when disabling seeding in BWA, after quality filtering and duplicate removal (Figure 1).
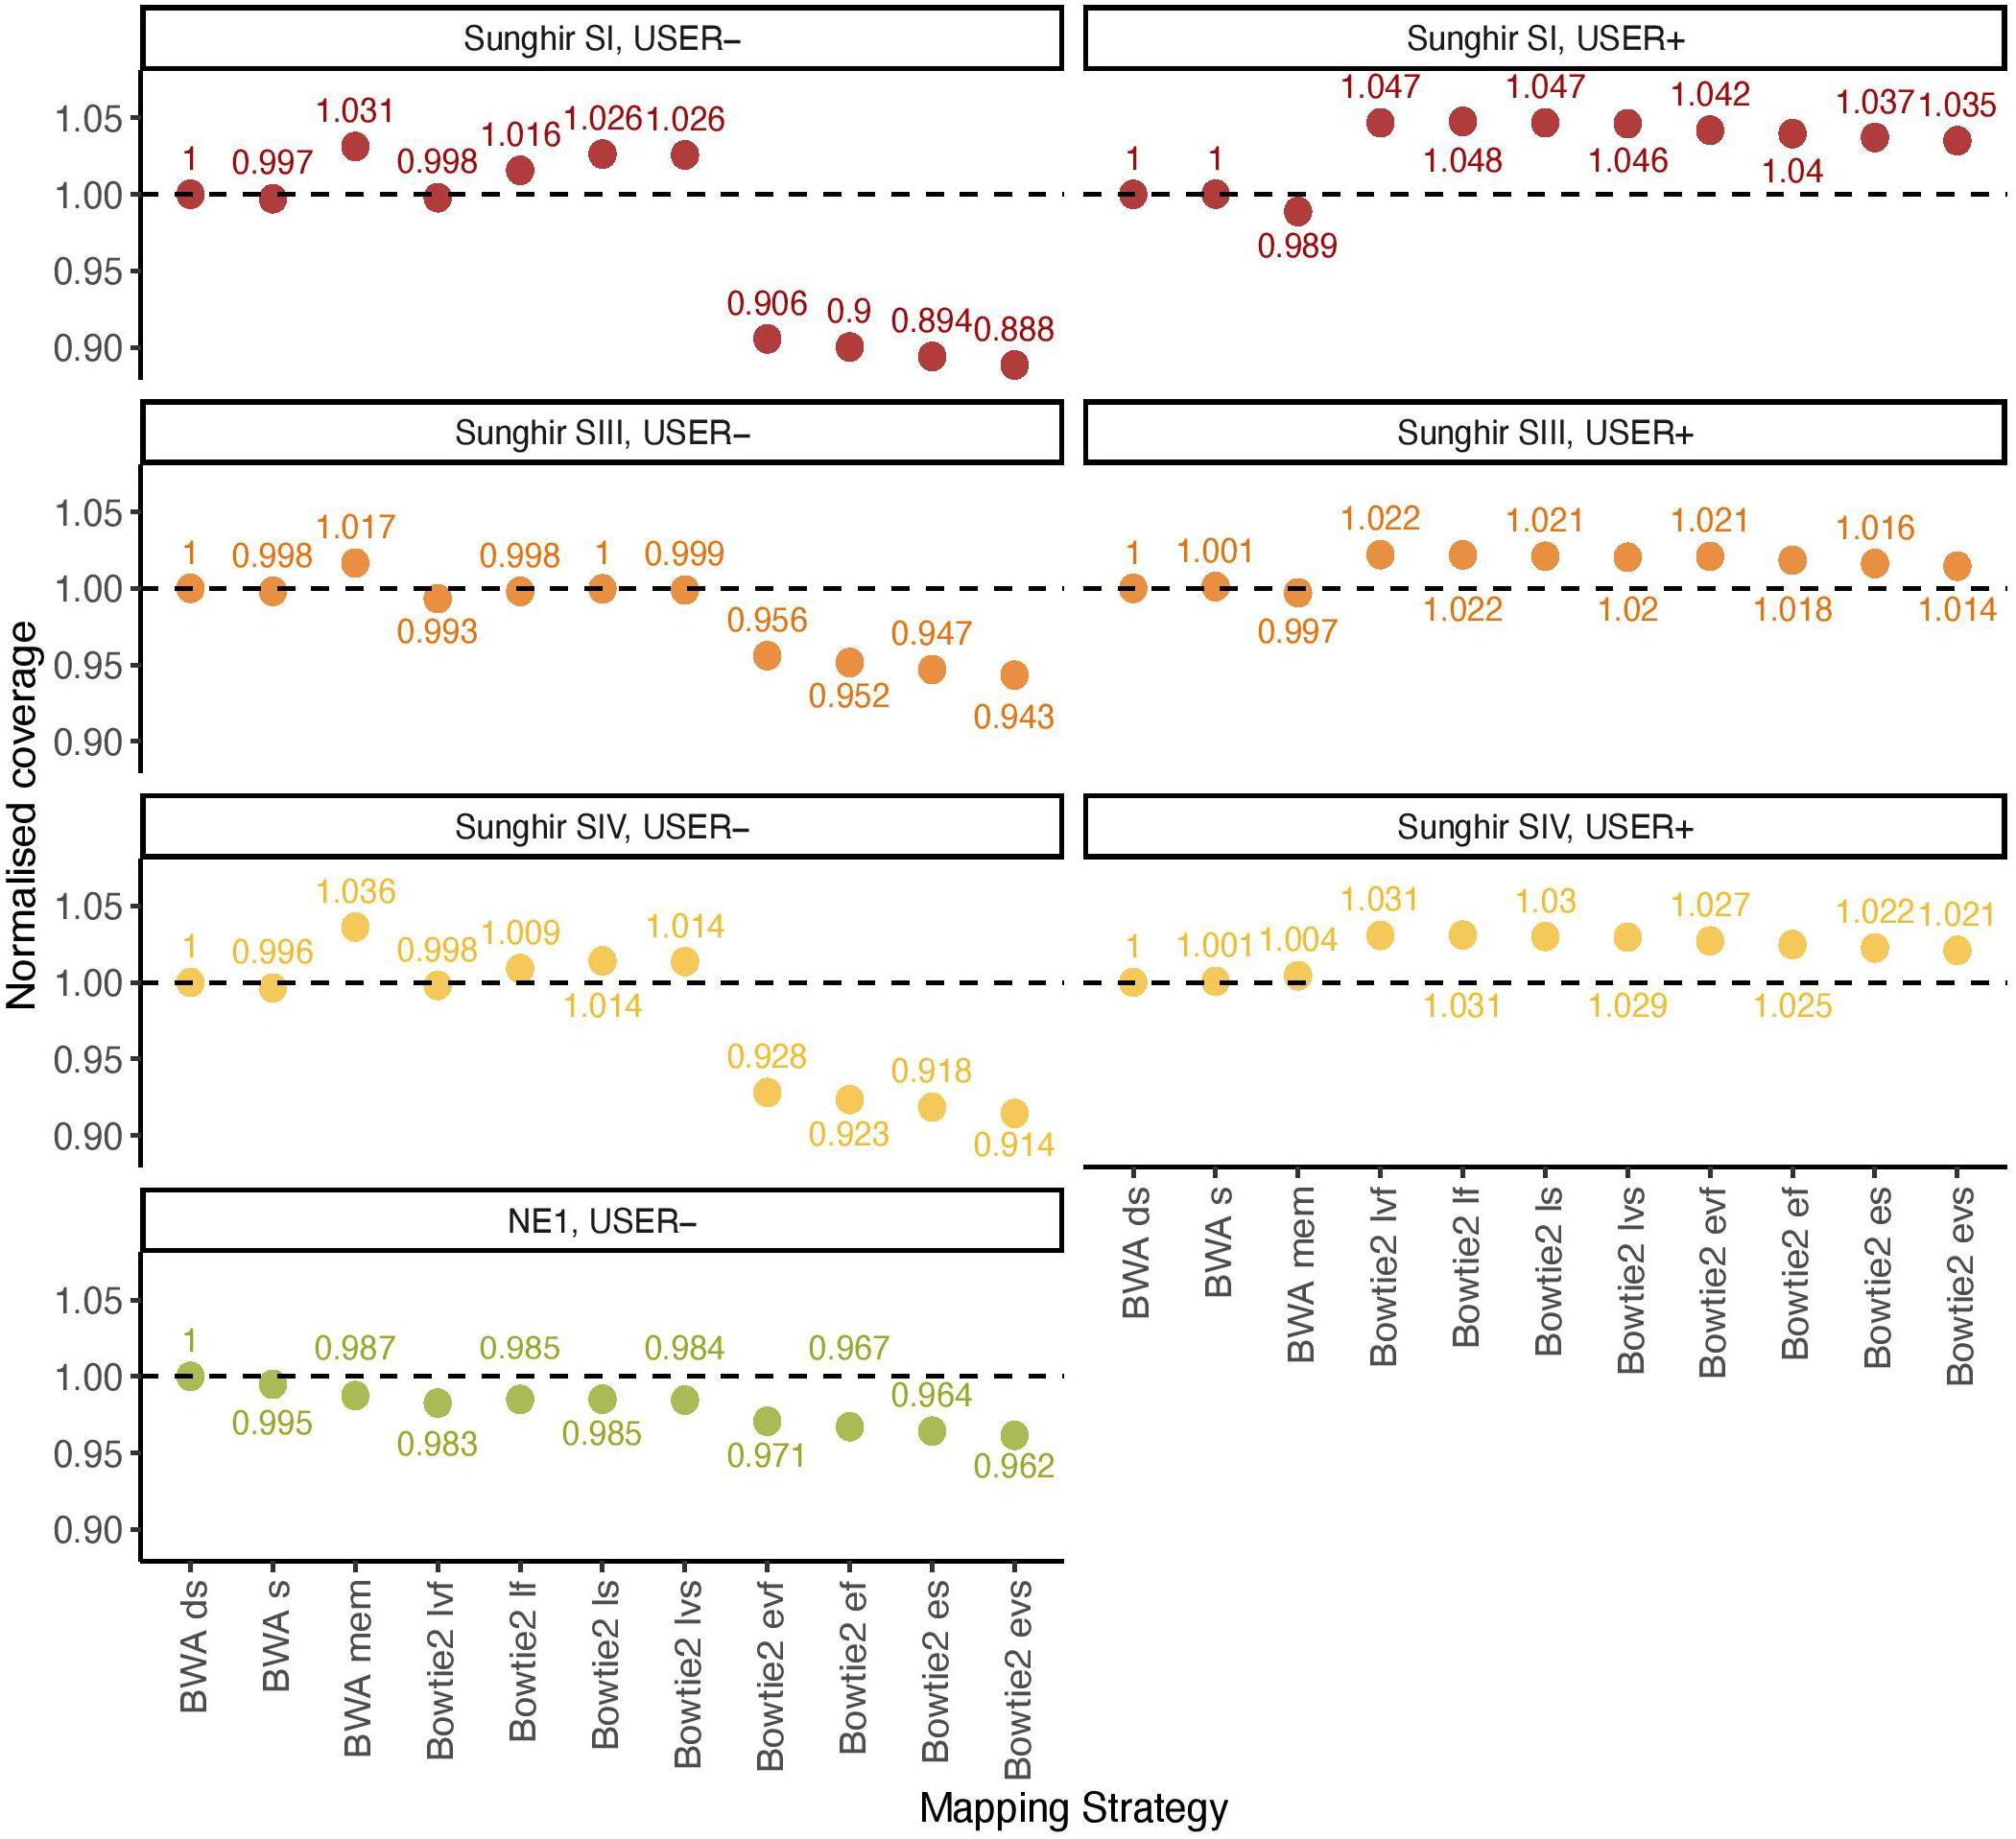
Figure 1. Normalized coverage across all 11 mapping conditions investigated (real data). The average depth of coverage was estimated by filtering alignments for minimal mapping quality scores of 30 (MQ ≥ 30) and removing PCR duplicates. All coverage estimates are reported relative to those obtained with the BWA read aligner when disabling seeding (BWA ds). The other mapping conditions investigated in BWA correspond to seeding (BWA s) and mem (BWA mem). Two alignment modes (local, l; and end-to-end, e) were tested in Bowtie2, together with four options (fast, f; very fast, vf; sensitive, s; and, very sensitive, vs). The mean fragment length corresponding to BWA ds is indicated in Table 1.
We first confirmed previous work reporting reduced BWA performance when seeding, corresponding to a loss of 0.19–0.51% coverage across all four ancient DNA sequence datasets investigated in the absence of USER treatment (Figure 1, USER−). BWA mem was found to show increased performance in all three Sunghir individuals, in which a gain of 1.66–3.63% coverage was obtained. However, the performance was reduced (1.25%) for the NE1 individual. This indicates that the individual features of ancient DNA datasets, which reflect different post-mortem DNA preservation conditions, can have both a positive and a negative impact on the performance of the mem alignment procedure. The same was found for the four sensitivity options (very fast, fast, sensitive, and very sensitive) of the Bowtie2 local alignment mode, in which up to 2.63% coverage could be gained and up to 1.75% could be lost depending on the procedure considered. In these conditions, the very fast sensitivity option was the only one associated with a performance drop in all four samples tested (0.20–1.75%). In contrast to what was observed for the local alignment mode, the end-to-end mode in Bowtie2 was consistently found to show reduced performance, representing a loss of 2.93%–11.15% coverage.
We next assessed the mapping performance of ancient DNA data generated following USER treatment of raw DNA extracts (USER+). This treatment was developed to reduce the amount of DNA mis-incorporations resulting from post-mortem Cytosine deamination, which represents the most common DNA degradation reaction taking place after death (Briggs et al., 2010; Dabney et al., 2013). USER-treated ancient DNA data were available for the three Sunghir individuals but not for the NE1 individual. We found marginal coverage gain (0.01–0.11%) when disabling seeding in BWA, and different performance for the mem alignment procedure, in which a fraction of coverage could be gained (0.43%) or lost (1.12%) (Figure 1, USER+). Interestingly, all eight alignment modes tested for Bowtie2 were associated with increased performance, corresponding to a gain of 1.45–4.76% coverage relative to what was obtained when disabling seeding in BWA. This is in striking contrast with the reduced performance observed for the end-to-end alignment mode in the absence of USER treatment and indicates that the USER treatment modified the properties of ancient DNA data sufficiently enough to positively impact on the alignment performance.
To further gain insights into the alignment consequences of USER treatment, we simulated ancient DNA sequence data of increasing size (25–120 bp) and assessed the fraction of true positives, false positives, and false negatives obtained for each of the 11 alignment procedures tested (Figure 2 and Supplementary Figures S1, S2). We found that the fraction of false-negative alignments was minimal when using the BWA aligner, except for the mem alignment mode and DNA templates of sizes inferior to 35 bp. The end-to-end alignment mode in Bowtie2 also led to virtually no false-negative alignments across all size categories investigated, including for DNA templates of 25–26 bp in which a detectable proportion of false-negative alignments was obtained when using the local alignment mode (albeit more limited than that observed in BWA mem for larger sizes, Figure 2A). Applying strict mapping quality thresholds of 30 was found appropriate for eliminating all false-positive alignments obtained in all mapping conditions investigated (Figure 2B). Interestingly, the fraction of true-positive alignments showing mapping quality scores strictly inferior to 30 increased in BWA rather than in Bowtie2 for DNA templates of limited sizes (25–70 bp) (Figure 2C). This fraction increased for larger sizes when using the Bowtie2 local alignment mode (70 bp) or the Bowtie2 end-to-end alignment mode (90 bp). This indicates that the mapping quality scores returned by BWA for short size categories such as those generally observed with ancient DNA data are more conservative than those returned by Bowtie2. Moreover, when applying a strict mapping quality threshold of 30 (as commonly practiced, e.g., Sikora et al., 2017), the sensitivity (i.e., the fraction of true positives relative to both true positives and false negatives) of BWA was more limited in the mem alignment mode than when seeding or disabling seeding for short DNA templates. It, however, returned to ∼100% for size categories superior or equal to 40 bp (Supplementary Figure S3). Maximal sensitivity was observed in Bowtie2 using the end-to-end alignment mode (Damgaard et al., 2018b), resulting in a significant loss of true-positive alignments in BWA compared to Bowtie2 (Supplementary Figure S3). This effect is reversed for size categories larger than 70 bp (local mode) or 90 bp (end-to-end mode), but this is expected to minimally impact ancient DNA datasets due to the generally extensive DNA fragmentation that takes place post-mortem (Figure 2C).
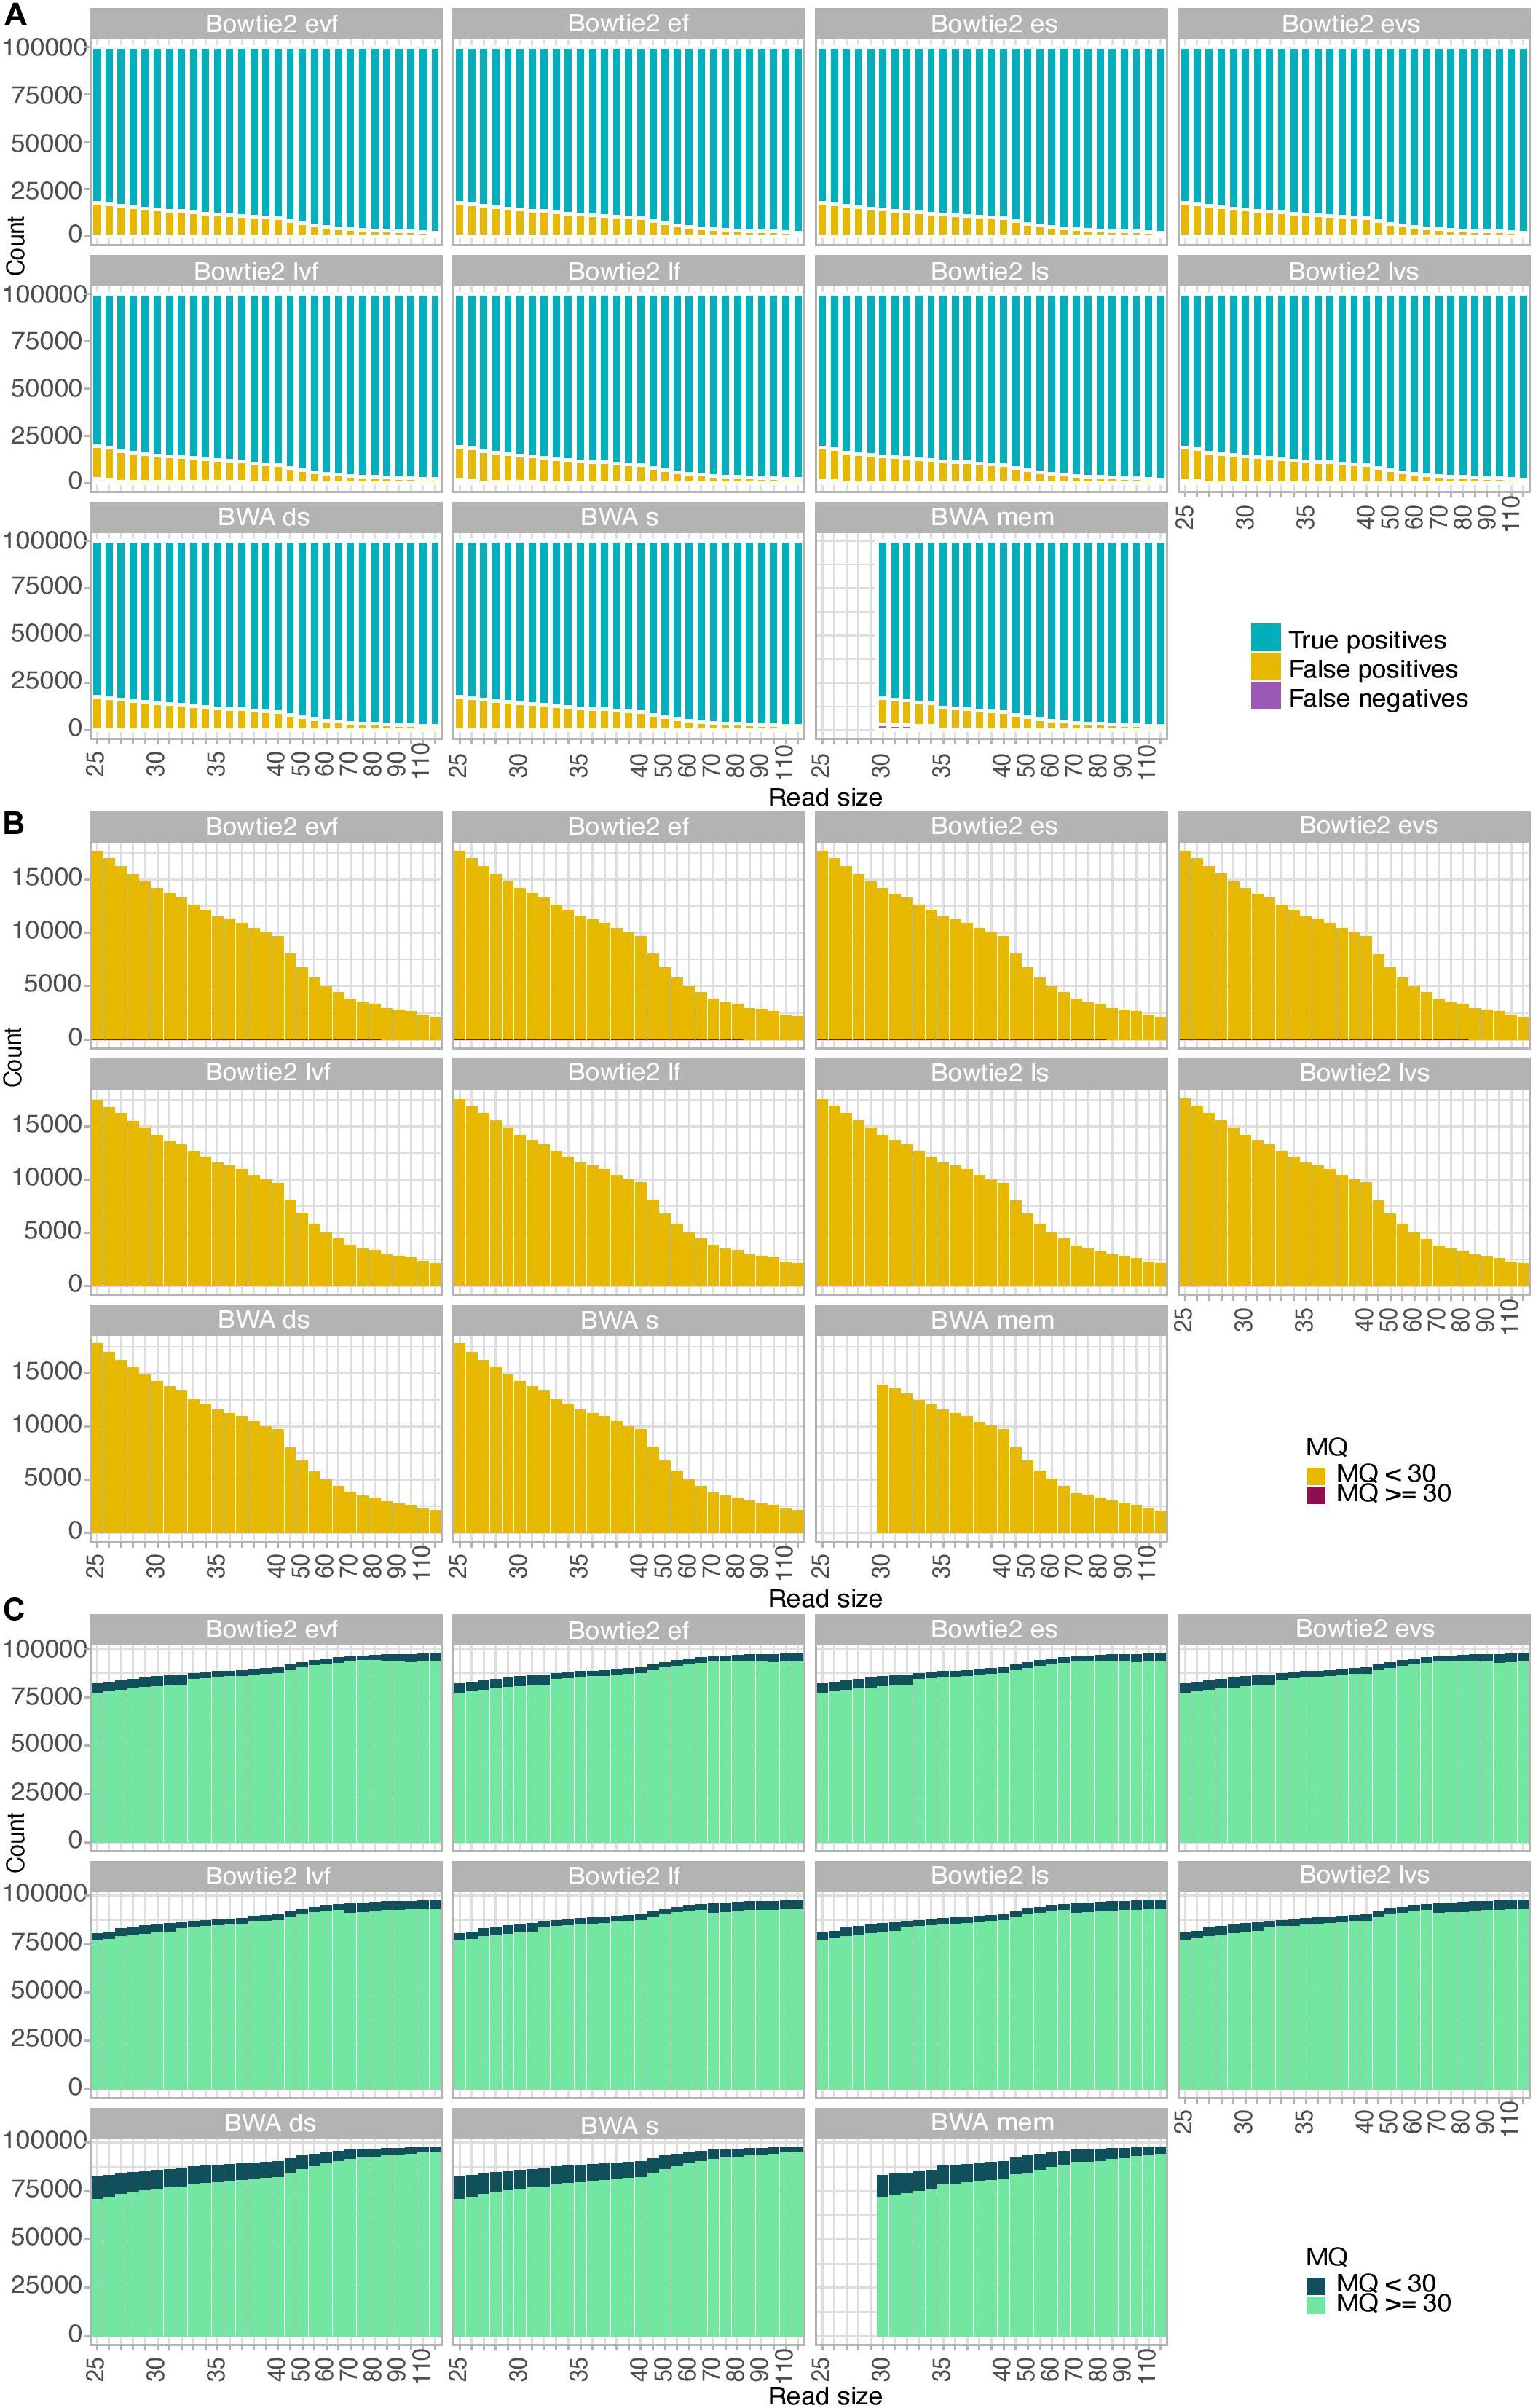
Figure 2. Alignment performance of simulated data. A total of 100,000 reads were simulated for each size category considered in the presence of typical Illumina sequencing errors as well as nucleotide mis-incorporations remaining following USER treatment. MQ refers to the mapping quality scores of the read alignments. (A) Fractions of true-positive, false-positive, and false-negative alignments. (B) Mapping quality scores of false-positive alignments. (C) Mapping quality scores of true-positive alignments.
We next tested this prediction by measuring the overall alignment performance of the 11 procedures investigated by calculating the total coverage achieved after applying a strict mapping quality threshold of 30 and removing PCR duplicates (Figure 3). We confirmed that Bowtie2 showed an increased performance relative to BWA for DNA templates of size inferior to 70 bp when running with the local mode and for templates of size inferior to 90 when running the end-to-end mode.
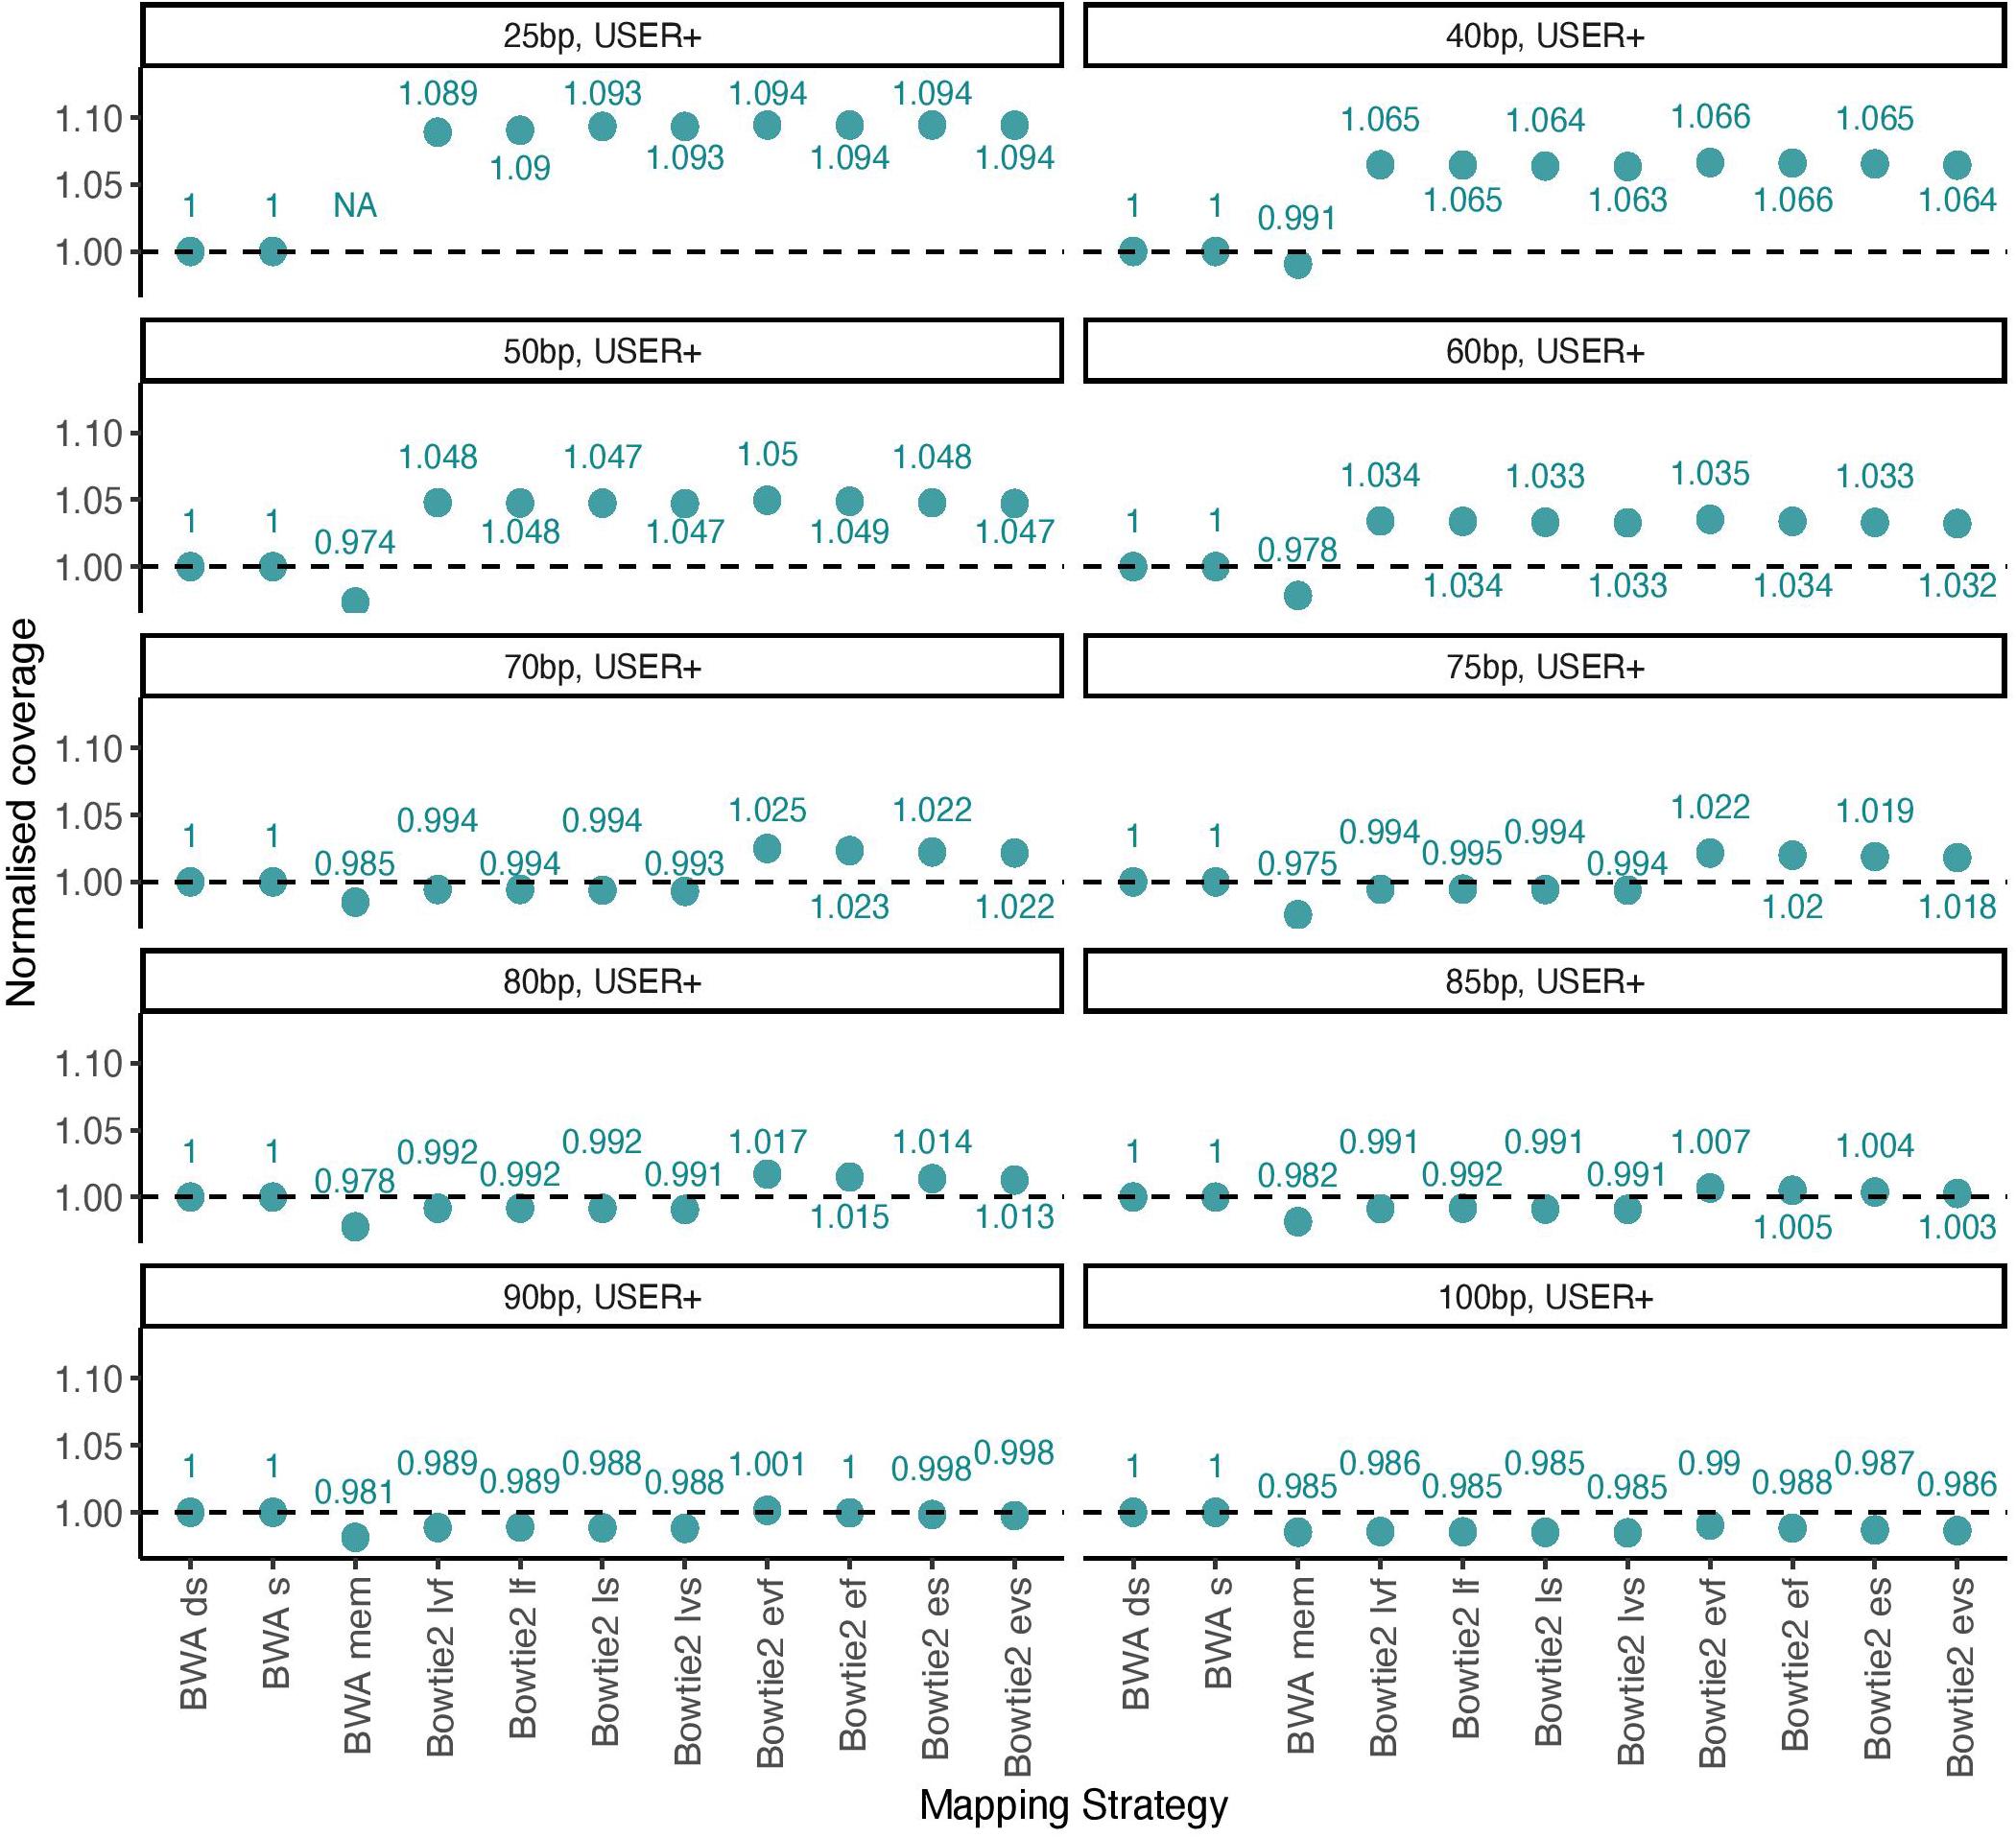
Figure 3. Normalized coverage across all 11 mapping conditions investigated (simulated data). The average depth of coverage was estimated by filtering alignments for minimal mapping quality scores of 30 (MQ ≥ 30) and removing PCR duplicates. All coverage estimates are reported relative to those obtained with the BWA read aligner when disabling seeding (BWA ds). The other mapping conditions investigated in BWA correspond to seeding (BWA s) and mem (BWA mem). Two alignment modes (local, l and end-to-end, e) were tested in Bowtie2, together with four options (fast, f; very fast, vf; sensitive, s, and; very sensitive, vs). A total of 100,000 reads were simulated for each size category considered in the presence of typical Illumina sequencing errors as well as nucleotide mis-incorporations remaining following USER treatment. Each panel provides the coverage for each size category (25, 40, 50, 60, 70, 75, 80, 85, 90, and 100 bp).
Altogether, our USER-treated read simulations revealed that across all size categories. The sensitivity of the local alignment mode was reduced for DNA templates of size strictly inferior to 38 bp, but was generally larger than that observed with BWA mem. The quality scores returned by BWA in the short size range were found to be conservative, leading to the loss of a significant fraction of true positives (9.4–10.0%) when applying strict quality thresholds (Figure 2C).
Alignment Performance at CpG Sites and DNA Methylation Inference
The most commonly used strategy available for estimating ancient methylation maps leverages patterns of C→T mis-incorporations at CpG dinucleotide sites as identified from BAM alignment files providing ancient DNA sequence alignment against a reference genome. We next investigated if the different mapping conditions investigated above showed different performance at CpG dinucleotide sites and could lead to different estimates of ancient DNA methylation levels. We first calculated the coverage achieved at each CpN dinucleotide context (i.e., CpA, CpC, CpG, and CpT) when applying the 11 mapping conditions to the sequencing data available for the three Sunghir individuals (Figure 4 and Supplementary Figure S4). This revealed results largely consistent with those obtained when measuring coverage genome-wide, in which the Bowtie2 end-to-end mode showed the poorest performance when considering data generated in the absence of USER treatment (Figure 4, USER−). The performance drop was more pronounced at CpG dinucleotides. This is most likely due to the faster cytosine deamination rates reported at such sites when methylated (Seguin-Orlando et al., 2015; Smith et al., 2015), which increases the read-to-reference edit distance and, thus, limits the alignment sensitivity.
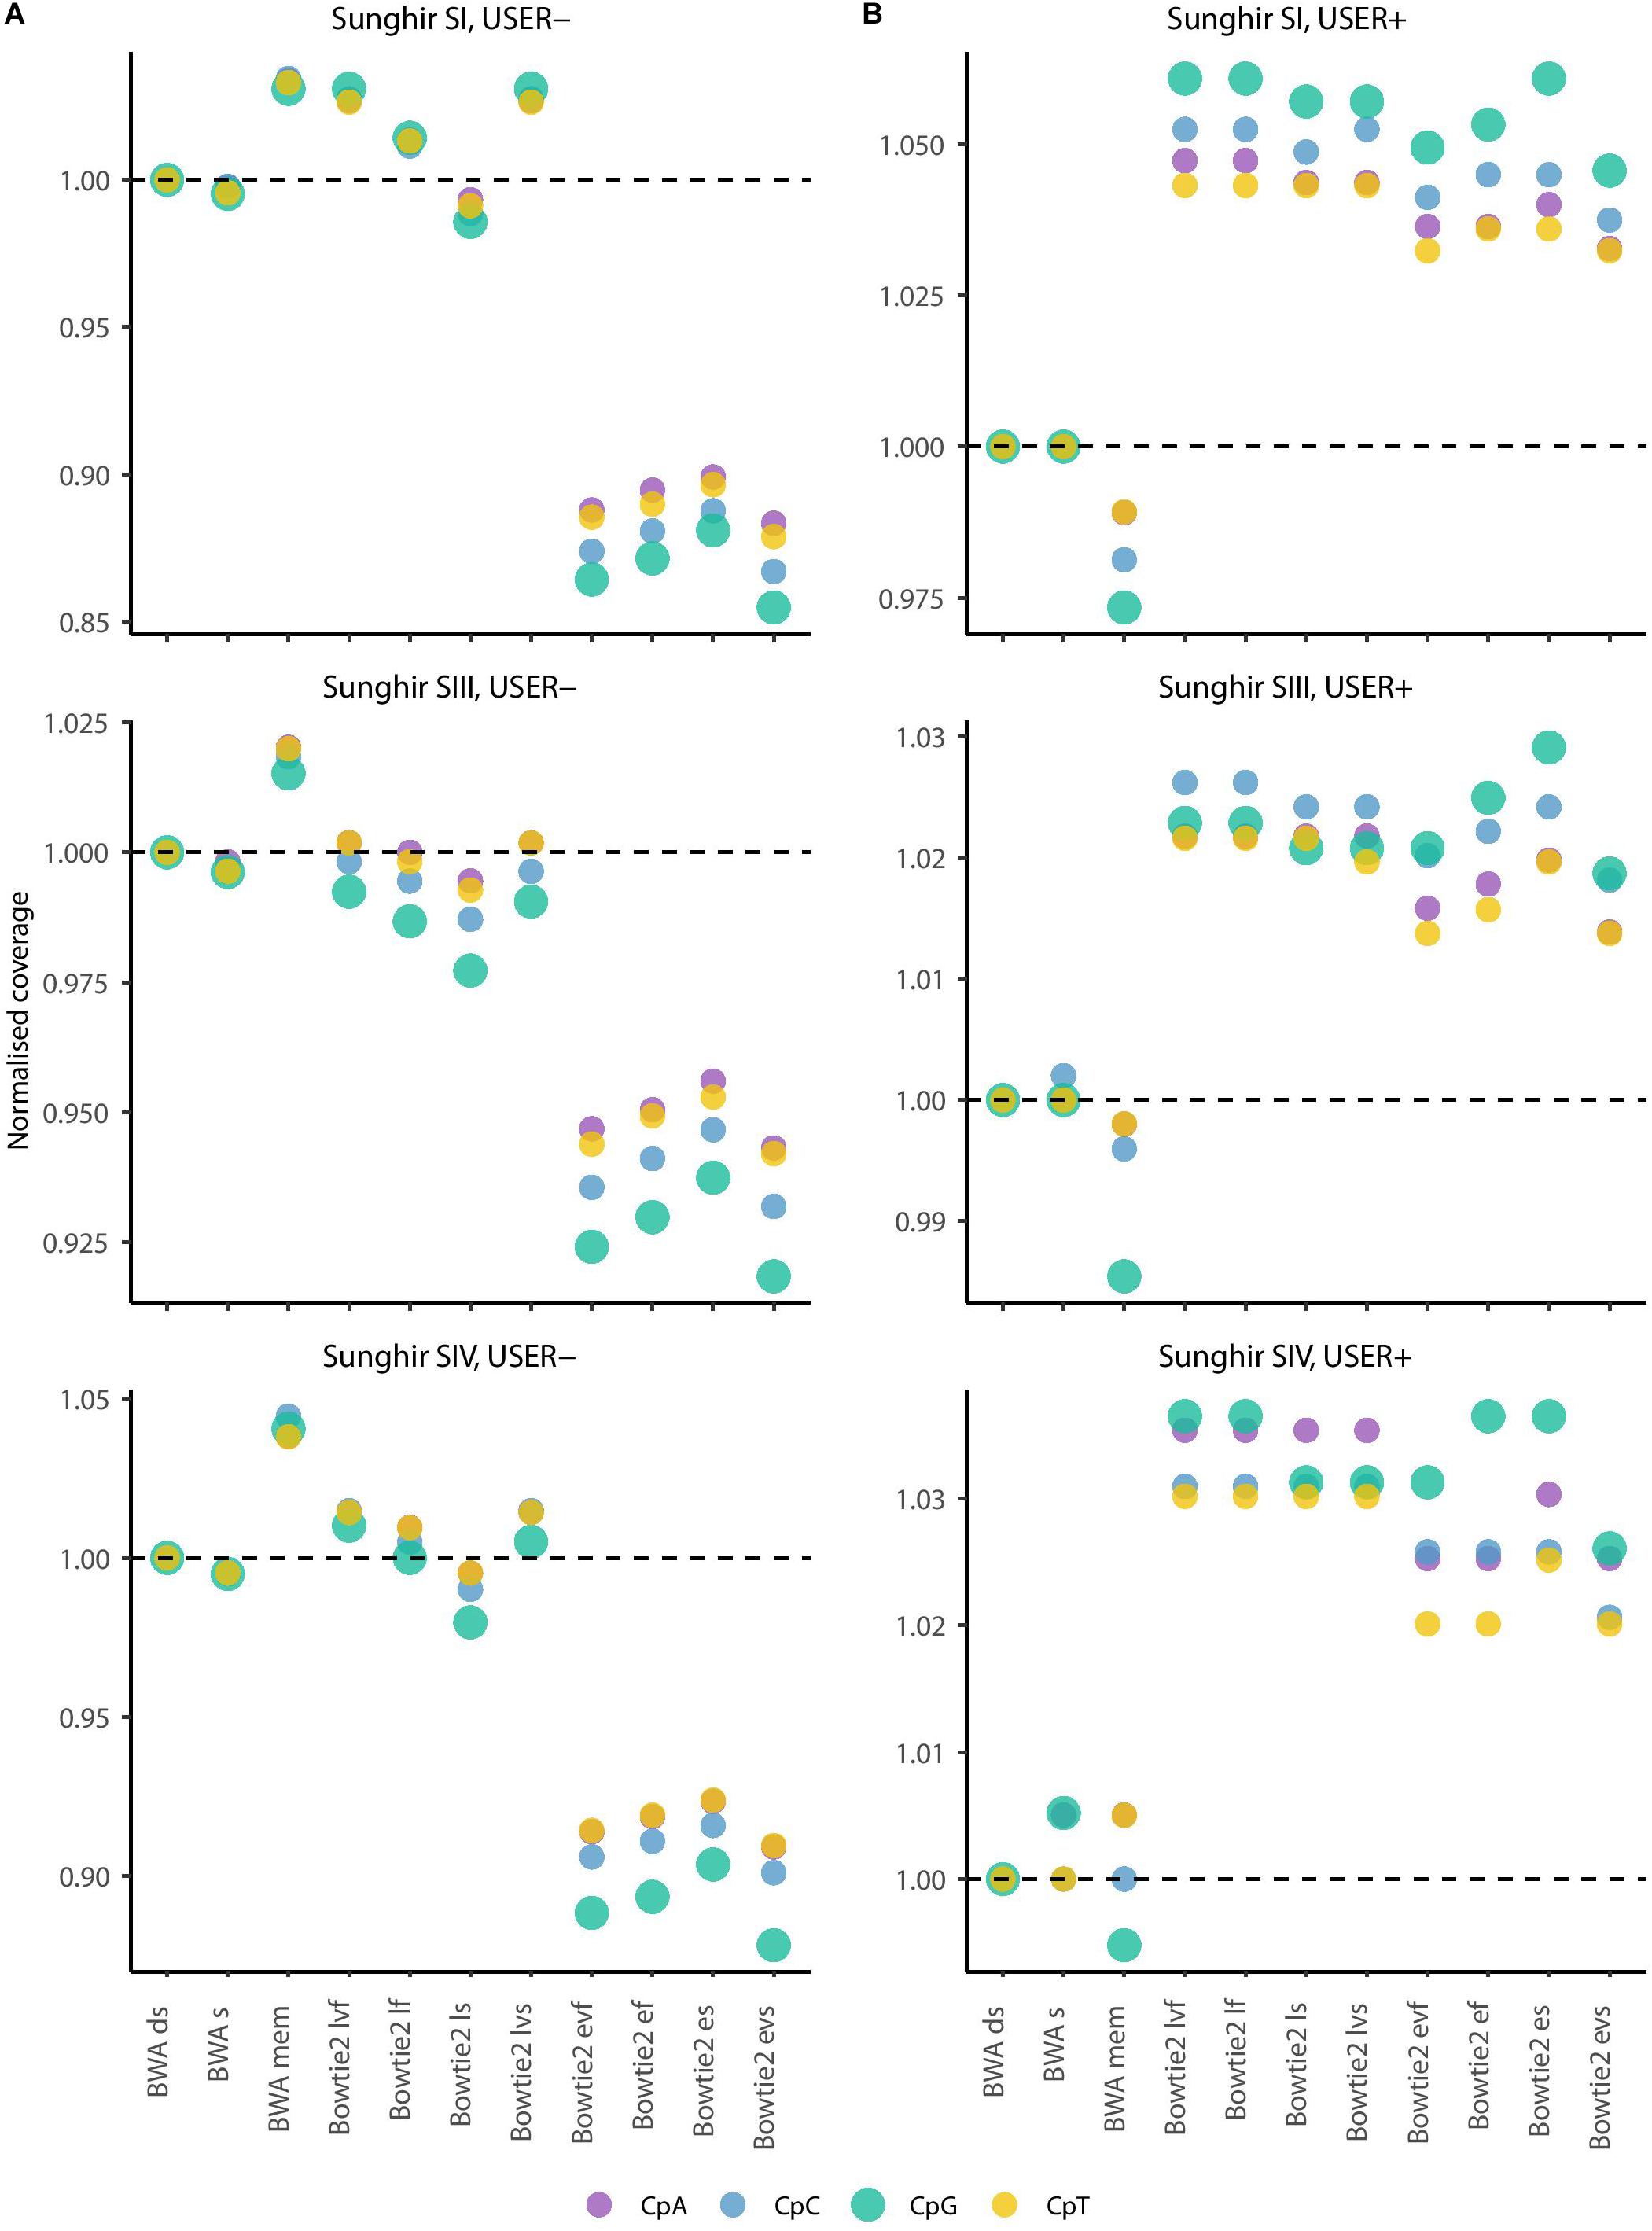
Figure 4. Average depth of coverage in four dinucleotide contexts (real data). (A) Average depth of coverage when real data are generated in the absence of USER treatment. (B) Average depth of coverage when real data are generated following USER treatment. The average depth of coverage was estimated by filtering alignments for minimal mapping quality scores of 30 (MQ ≥ 30) and removing PCR duplicates. Coverage values are calculated in the dinucleotide sequence context most affected by DNA methylation (CpG), as well as the three other dinucleotides potentially affected by post-mortem cytosine deamination at the same position (i.e., CpA, CpC, and CpT). The differences observed are not due to soft-clipped bases as the values returned in the presence or not of soft-clipping masking are identical (Supplementary Figure S4).
In striking contrast, Bowtie2 showed increased performance for all eight alignment conditions investigated when considering data generated following USER treatment (Figure 4, USER+). The performance gain was generally found to be especially pronounced within CpG dinucleotide contexts. This indicates that the USER treatment restored a fraction of reads that could not be previously aligned by reducing the read-to-reference edit distance. Since USER treatment is inefficient on those CpG dinucleotides that are methylated (Briggs et al., 2010; Pedersen et al., 2014; Hanghøj et al., 2016), we deduce that the Bowtie2 alignment conditions tested are more prone to result in gain of coverage at unmethylated CpG dinucleotides, which could have important consequences when deriving estimates of ancient DNA methylation levels.
The sensitive option of the end-to-end Bowtie2 alignment mode was found to show favorable running performance speed (Supplementary Figure S5). It also returned maximal sensitivity using simulated sequence data (Supplementary Figure S3) and maximal coverage gain at CpG dinucleotides on ancient DNA sequence data generated following USER treatment (Figure 4). We, thus, next compared the impact of this mapping condition on DNA methylation estimates relative to that used in all previous ancient DNA data work and consisting of disabling seeding in BWA (Gokhman et al., 2014, 2019; Pedersen et al., 2014; Hanghøj et al., 2016). To achieve this, we divided the human reference genome in windows comprising a total of 100 CpG dinucleotides and counted the number of such windows covered by at least one sequencing read in both alignment conditions. Although both alignment conditions identified read alignments in the vast majority of such genomic windows, we found that the total number of windows returning non-null coverage was larger for Bowtie2 than for BWA (Figure 5A), in line with the increased coverage observed with both simulated and real data with this mapper. This demonstrates that Bowtie2 retrieves data within regions for which no sequencing data could be aligned with BWA, thereby extending the genomic contexts into which DNA methylation can be estimated. Additionally, the distribution of sequencing depth obtained across genomic windows of 100 CpG dinucleotides was shifted toward larger values when applying Bowtie2 instead of BWA (Figure 5B, in which dashed lines indicate mean depth of coverage). This indicates that regional DNA methylation inference based on Bowtie2 alignments can build on more data than when based on BWA. This is important as the inference accuracy for ancient DNA methylation levels was previously shown to improve with sequencing depth (Hanghøj et al., 2019).
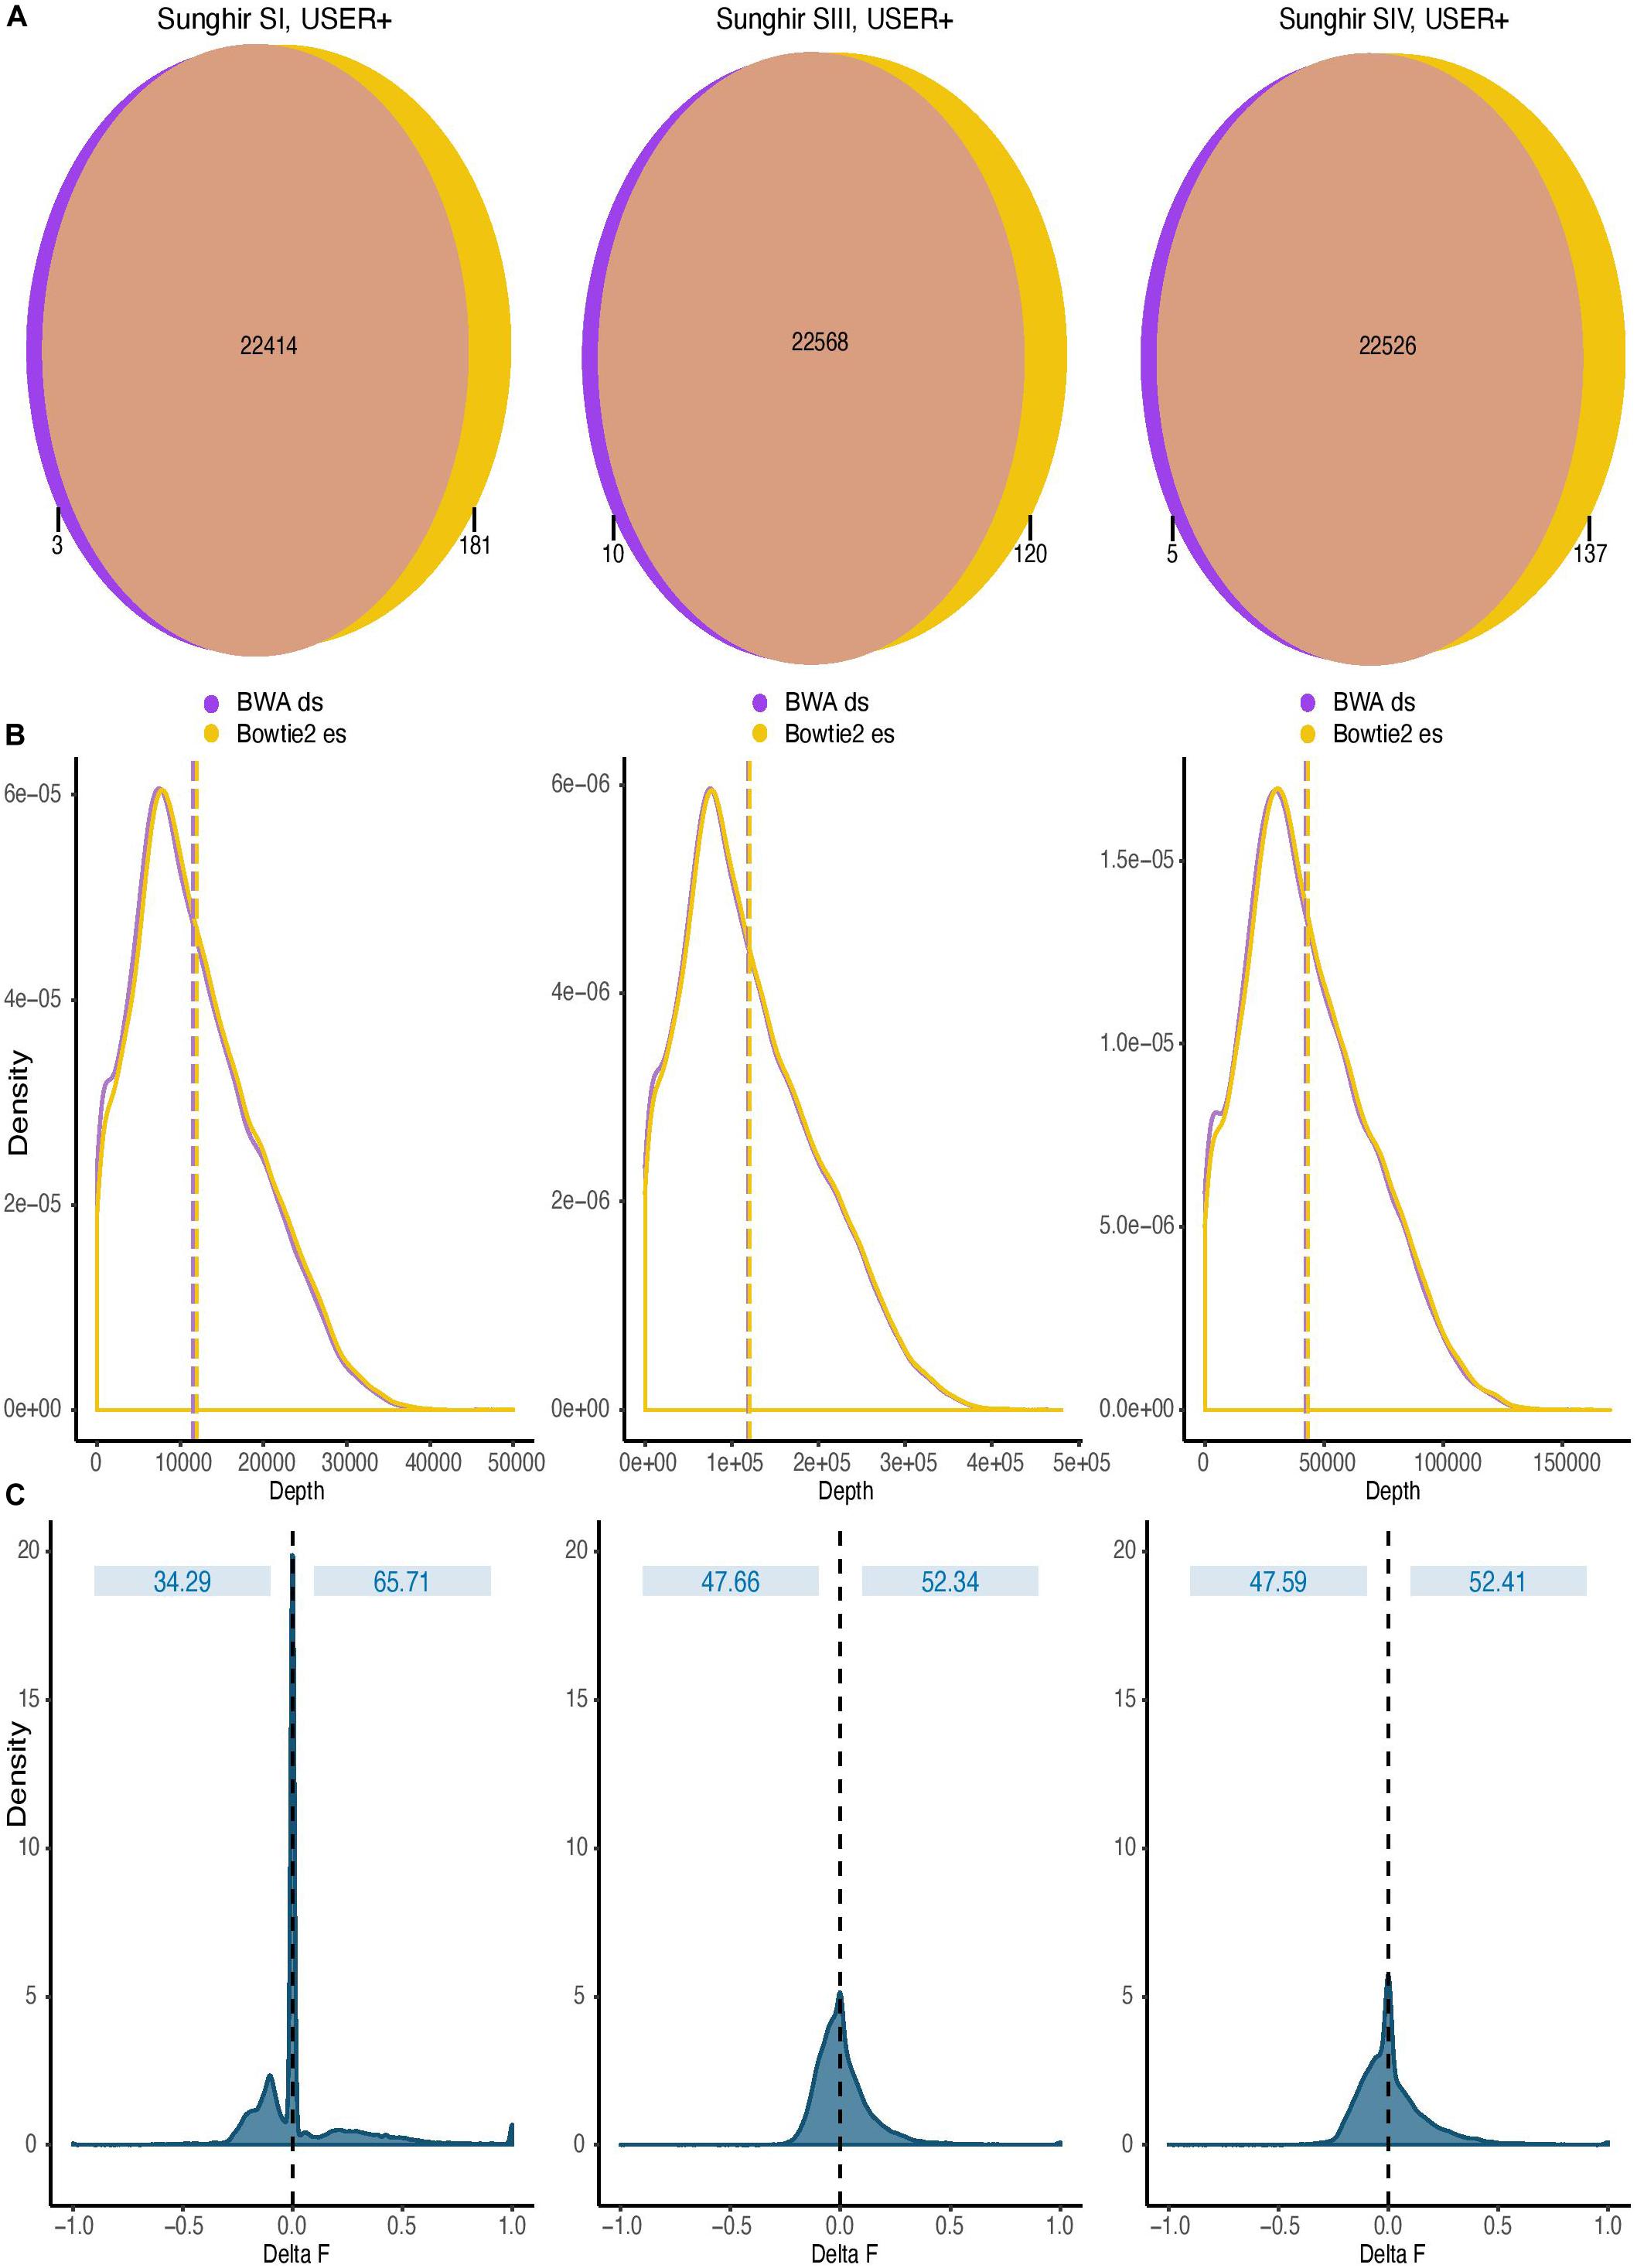
Figure 5. Impact of read alignment conditions on ancient DNA methylation inference. The analyses were carried out using the sequence data generated following USER treatment of the raw DNA extracts of the three ancient Sunghir individuals (SI, left; SIII, center, and; SIV, right). The consequences of two mapping conditions on DNA methylation inference are investigated (BWA disabling seeding, BWA ds versus Bowtie2 end-to-end sensitive, Bowtie2 es). (A) Venn diagram of genomic windows showing non-null sequence coverage. Numbers indicate the total of genomic windows comprising 100 CpG dinucleotides and for which non-null sequence coverage was observed. Most windows are covered in both mapping conditions, but a fraction was exclusively identified by only one read aligner. Each circle is not scaled proportionally to increase readability. (B) Coverage distribution of genomic windows containing 100 CpG dinucleotides. Dashed lines represent the mean depth, respectively. (C) Distribution of the difference observed between the DNA methylation values inferred by two mapping conditions (Delta F). The difference (Delta F) reported corresponds to the difference between the f values estimated from Bowtie2 es alignments and those estimated from BWA ds alignments (f.Bowtie2 es - f.BWA ds).
We next used DamMet (Hanghøj et al., 2019) to calculate in both alignment conditions the DNA methylation levels, f, for those genomic windows encompassing 100 CpG dinucleotides (Figure 5C). We found that the distributions of differences between the f values returned from Bowtie2 and BWA read alignments were centered around zero, indicating that the two mapping conditions resulted in similar regional methylation estimates. However, a fraction of the windows considered returned f values of one (i.e., full methylation) when using the sequence data aligned with BWA and values of zero (i.e., full demethylation) when using Bowtie2 alignments. This represented a fraction of 0.040–0.103% of the windows across the three ancient individuals investigated. Reciprocally, a fraction of the windows considered returned f values of zero when using the sequence data aligned with BWA and values of one when using Bowtie2 alignments. This represented a larger fraction of the windows across the three ancient individuals investigated (0.316–1.392%), which demonstrates the increased sensitivity of the Bowtie2 aligner for those reads carrying CpG→TpG substitutions and informing on regional methylation levels. This demonstrates that the alignment procedures can significantly impact on the inference of regional DNA methylation levels.
Discussion
In this study, we report that Bowtie2 shows a higher performance than BWA when aligning ancient DNA data generated following USER treatment. This effect is especially pronounced within the shorter size range (25–70 bp), due to the combined effects of a higher sensitivity for the Bowtie2 read aligner, and more conservative mapping quality scores for the BWA aligner. Moreover, in the absence of USER treatment, BWA mem was found to impact positively the coverage estimates for some samples, but negatively for others. This may be related to the respective representation of ultrashort templates among the sequencing data, as the most positive impact is found for those libraries showing the shortest average sizes. Although this remains to be tested systematically, it suggests that individual post-mortem DNA preservation conditions will significantly affect the performance of this alignment procedure. Nonetheless, the vast majority of DNA fragments retrieved from archeological and paleontological remains are of limited sizes; the mapping conditions investigated with Bowtie2 can be expected to substantially improve genome coverage estimates and, hence, data quality. Using the sequence data obtained from three Upper Paleolithic Sunghir individuals, we found that Bowtie2 could improve the genome average depth of coverage by up to 1.62–3.72%. This improvement may appear modest at first glance but represents a significant improvement for ancient DNA research as the material available for destructive DNA extraction is finite and not replaceable. Additionally, improving sequencing depth is not always possible due to the limited molecular complexity of the DNA libraries available for sequencing. Importantly, read alignment conditions were found to impact not only depth of coverage but also the inference of regional ancient DNA methylation levels.
While ancient DNA methylation has received increasing scholar attention over the last 5 years, and while several statistical inference methods have been developed (e.g., BindDB, Livyatan et al., 2015; epiPaleomix, Hanghøj et al., 2016; and DamMet, Hanghøj et al., 2019), how much different read alignment methods could impact on methylation predictions had not been investigated. This study reveals that the Bowtie2 mapping conditions recommended (sensitive option, end-to-end mode) returns with larger numbers of read alignments that increase the number of genomic windows available for inference as well as their sequence coverage, which improves accuracy of the predictions. This has important consequences for the nascent field of ancient epigenomics, which, to the best of our knowledge, based all previous predictions on BWA DNA alignments. The fact that different read alignment conditions significantly impact the inference of ancient DNA methylation levels also implies that strictly identical alignment procedures are used when comparing DNA methylation levels in different ancient remains, including when groups showing different evolutionary distances to the reference genome used for alignments are considered (e.g., archaic hominins and anatomically modern humans, Gokhman et al., 2019).
Recent work has revealed that mapping ancient, ultrashort, and damaged ancient DNA reads against a linear reference genome can introduce substantial reference bias in the data, with possible impact on downstream population genetics inference (Günther and Nettelblad, 2019). Alignment procedures including a variation graph recapitulating the known genetic variation within a panel of modern individuals further mitigated this bias and helped effectively recover non-reference variants (Martiniano et al., 2019). Future work should focus on assessing the impact of such alignment procedures on ancient DNA methylation inference.
Data Availability Statement
The datasets generated for this study can be found in the ENA Accession number Sunghir: PRJEB22592, ENA Accession number NE1: PRJNA240906.
Ethics Statement
Ethical review and approval was not required for the study on human participants in accordance with the local legislation and institutional requirements. Written informed consent for participation was not required for this study in accordance with the national legislation and the institutional requirements.
Author Contributions
LO conceived the study and provided material and infrastructure, and wrote the manuscript. MP carried out the analyses, with significant input from LO and plotted the figures.
Funding
This work was supported by the Initiative d’Excellence Chaires d’attractivité, Université de Toulouse (OURASI), AMADEUS (CNRS LIA), and the Villum Fonden miGENEPI research project. LO has received funding from the European Research Council (ERC) under the European Union’s Horizon 2020 Research and Innovation Program (grant agreement no. 681605-PEGASUS).
Conflict of Interest
The authors declare that the research was conducted in the absence of any commercial or financial relationships that could be construed as a potential conflict of interest.
The reviewer, PH, declared a past collaboration with one of the author, LO, to the handling Editor.
Acknowledgments
We are grateful to all members of the AGES research group (Archaeology, Genomics, Evolution and Societies) for discussions.
Supplementary Material
The Supplementary Material for this article can be found online at: https://www.frontiersin.org/articles/10.3389/fevo.2020.00105/full#supplementary-material
References
Allentoft, M. E., Sikora, M., Sjögren, K.-G., Rasmussen, S., Rasmussen, M., Stenderup, J., et al. (2015). Population genomics of Bronze Age Eurasia. Nature 522:167. doi: 10.1038/nature14507
Briggs, A. W., Stenzel, U., Meyer, M., Krause, J., Kircher, M., and Pääbo, S. (2010). Removal of deaminated cytosines and detection of in vivo methylation in ancient DNA. Nucleic Acids Res. 38:e87. doi: 10.1093/nar/gkp1163
Brunson, K., and Reich, D. (2019). The promise of paleogenomics beyond our own species. Trends Genet. 35, 319–329. doi: 10.1016/j.tig.2019.02.006
Cahill, J. A., Heintzman, P. D., Harris, K., Teasdale, M. D., Kapp, J., Soares, A. E. R., et al. (2018). Genomic evidence of widespread admixture from polar bears into brown bears during the last ice age. Mol. Biol. Evol. 35, 1120–1129. doi: 10.1093/molbev/msy018
Dabney, J., Knapp, M., Glocke, I., Gansauge, M.-T., Weihmann, A., Nickel, B., et al. (2013). Complete mitochondrial genome sequence of a middle pleistocene cave bear reconstructed from ultrashort DNA fragments. Proc. Natl. Acad. Sci. U.S.A. 110, 15758–15763. doi: 10.1073/pnas.1314445110
Damgaard, P. D. B., Marchi, N., Rasmussen, S., Peyrot, M., Renaud, G., Korneliussen, T., et al. (2018a). 137 ancient human genomes from across the Eurasian steppes. Nature 557, 369–374. doi: 10.1038/s41586-018-0488-1
Damgaard, P. D. B., Martiniano, R., Kamm, J., Moreno-Mayar, J. V., Kroonen, G., Peyrot, M., et al. (2018b). The first horse herders and the impact of early Bronze Age steppe expansions into Asia. Science 360:eaar7711. doi: 10.1126/science.aar7711
Fagny, M., Patin, E., MacIsaac, J. L., Rotival, M., Flutre, T., Jones, M. J., et al. (2015). The epigenomic landscape of African rainforest hunter-gatherers and farmers. Nat. Commun. 6:10047. doi: 10.1038/ncomms10047
Gamba, C., Jones, E. R., Teasdale, M. D., McLaughlin, R. L., Gonzalez-Fortes, G., Mattiangeli, V., et al. (2014). Genome flux and stasis in a five millennium transect of European prehistory. Nat. Commun. 5:5257. doi: 10.1038/ncomms6257
Gokhman, D., Lavi, E., Prüfer, K., Fraga, M. F., Riancho, J. A., Kelso, J., et al. (2014). Reconstructing the DNA Methylation maps of the neandertal and the denisovan. Science 344, 523–527. doi: 10.1126/science.1250368
Gokhman, D., Mishol, N., de Manuel, M., de Juan, D., Shuqrun, J., Meshorer, E., et al. (2019). Reconstructing denisovan anatomy using DNA Methylation maps. Cell 179, 180–192. doi: 10.1016/j.cell.2020.01.020
Green, R. E., Krause, J., Briggs, A. W., Maricic, T., Stenzel, U., Kircher, M., et al. (2010). A draft sequence of the neandertal genome. Science 328, 710–722.
Günther, T., and Nettelblad, C. (2019). The presence and impact of reference bias on population genomic studies of prehistoric human populations. PLoS Genet. 15:e1008302. doi: 10.1371/journal.pgen.1008302
Haak, W., Lazaridis, I., Patterson, N., Rohland, N., Mallick, S., Llamas, B., et al. (2015). Massive migration from the steppe was a source for Indo-European languages in Europe. Nature 522:207. doi: 10.1038/nature14317
Hanghøj, K., and Orlando, L. (2018). “Ancient epigenomics,” in Population Genomics, ed. O. P. Rajora (Cham: Springer).
Hanghøj, K., Renaud, G., Albrechtsen, A., and Orlando, L. (2019). DamMet: ancient methylome mapping accounting for errors, true variants, and post-mortem DNA damage. Gigascience 8:giz02. doi: 10.1093/gigascience/giz025
Hanghøj, K., Seguin-Orlando, A., Schubert, M., Madsen, T., Pedersen, J. S., Willerslev, E., et al. (2016). Fast, accurate and automatic ancient nucleosome and methylation maps with epiPALEOMIX. Mol. Biol. Evol. 33, 3284–3298. doi: 10.1093/molbev/msw184
Jónsson, H., Ginolhac, A., Schubert, M., Johnson, P. L. F., and Orlando, L. (2013). MapDamage2.0: fast approximate bayesian estimates of ancient DNA damage parameters. Bioinformatics 29, 1682–1684. doi: 10.1093/bioinformatics/btt193
Langmead, B., and Salzberg, S. L. (2012). Fast gapped-read alignment with Bowtie 2. Nat. Methods 9, 357–359. doi: 10.1038/nmeth.1923
Laubach, Z. M., Faulk, C. D., Dolinoy, D. C., Montrose, L., Jones, T. R., Ray, D., et al. (2019). Early life social and ecological determinants of global DNA methylation in wild spotted hyenas. Mol. Ecol. 28, 3799–3812. doi: 10.1111/mec.15174
Lea, A. J., Vockley, C. M., Johnston, R. A., Del Carpio, C. A., Barreiro, L. B., Reddy, T. E., et al. (2018). Genome-wide quantification of the effects of DNA methylation on human gene regulation. eLife 7:e37513. doi: 10.7554/eLife.37513
Li, H., and Durbin, R. (2009). Fast and accurate short read alignment with Burrows-Wheeler transform. Bioinformatics 25, 1754–1760. doi: 10.1093/bioinformatics/btp324
Li, H., Handsaker, B., Wysoker, A., Fennell, T., Ruan, J., Homer, N., et al. (2009). The sequence alignment/Map format and SAMtools. Bioinformatics 25, 2078–2079. doi: 10.1093/bioinformatics/btp352
Lindenbaum, P. (2015). JVarkit: Java-Based Utilities for Bioinformatics. Available online at: https://github.com/lindenb/jvarkit (accessed July 22, 2019).
Livyatan, I., Aaronson, Y., Gokhman, D., Ashkenazi, R., and Meshorer, E. (2015). BindDB: an integrated database and webtool platform for “reverse-ChIP” epigenomic analysis. Cell Stem Cell 17, 647–648. doi: 10.1016/j.stem.2015.11.015
Llamas, B., Holland, M. L., Chen, K., Cropley, J. E., Cooper, A., and Suter, C. M. (2012). High-resolution analysis of cytosine Methylation in ancient DNA. PLoS One 7:e30226. doi: 10.1371/journal.pone.0030226
Marciniak, S., and Perry, G. H. (2017). Harnessing ancient genomes to study the history of human adaptation. Nat. Rev. Genet. 18:659. doi: 10.1038/nrg.2017.65
Martiniano, R., Garrison, E., Jones, E. R., Manica, A., and Durbin, R. (2019). Removing reference bias in ancient DNA data analysis by mapping to a sequence variation graph. BioRxiv [Preprint], doi: 10.1101/782755
Mathieson, I., Lazaridis, I., Rohland, N., Mallick, S., Patterson, N., Roodenberg, S. A., et al. (2015). Genome-wide patterns of selection in 230 ancient Eurasians. Nature 528:499. doi: 10.1038/nature16152
Narasimhan, V. M., Patterson, N., Moorjani, P., Rohland, N., Bernardos, R., Mallick, S., et al. (2019). The formation of human populations in South and Central Asia. Science 365:eaat7487. doi: 10.1126/science.aat7487
Pacis, A., Tailleux, L., Morin, A. M., Lambourne, J., MacIsaac, J. L., Yotova, V., et al. (2015). Bacterial infection remodels the DNA methylation landscape of human dendritic cells. Genome Res. 25, 1801–1811. doi: 10.1101/gr.192005.115
Pedersen, J. S., Valen, E., Velazquez, A. M. V., Parker, B. J., Rasmussen, M., Lindgreen, S., et al. (2014). Genome-wide nucleosome map and cytosine methylation levels of an ancient human genome. Genome Res. 24, 454–466. doi: 10.1101/gr.163592.113
Quinlan, A. R., and Hall, I. M. (2010). BEDTools: a flexible suite of utilities for comparing genomic features. Bioinformatics 26, 841–842. doi: 10.1093/bioinformatics/btq033
Rasmussen, M., Li, Y., Lindgreen, S., Pedersen, J. S., Albrechtsen, A., Moltke, I., et al. (2010). Ancient human genome sequence of an extinct Palaeo-Eskimo. Nature 463, 757–762. doi: 10.1038/nature08835
Reich, D., Green, R. E., Kircher, M., Krause, J., Patterson, N., Durand, E. Y., et al. (2010). Genetic history of an archaic hominin group from denisova cave in Siberia. Nature 468, 1053–1060. doi: 10.1038/nature09710
Renaud, G., Hanghøj, K., Willerslev, E., and Orlando, L. (2017). Gargammel: a sequence simulator for ancient DNA. Bioinformatics 33, 577–579. doi: 10.1093/bioinformatics/btw670
Renaud, G., Petersen, B., Seguin-Orlando, A., Bertelsen, M. F., Waller, A., Newton, R., et al. (2018). Improved de novo genomic assembly for the domestic donkey. Sci. Adv. 4:eaaq0392. doi: 10.1126/sciadv.aaq0392
Rohland, N., Harney, E., Mallick, S., Nordenfelt, S., and Reich, D. (2015). Partial uracil – DNA – glycosylase treatment for screening of ancient DNA. Philos. Trans. R. Soc. B Biol. Sci. 370:20130624. doi: 10.1098/rstb.2013.0624
Santos, H. P., Bhattacharya, A., Martin, E. M., Addo, K., Psioda, M., Smeester, L., et al. (2019). Epigenome-wide DNA methylation in placentas from preterm infants: association with maternal socioeconomic status. Epigenetics 14, 751–765. doi: 10.1080/15592294.2019.1614743
Sanz, J., Maurizio, P. L., Snyder-Mackler, N., Simons, N. D., Voyles, T., Kohn, J., et al. (2019). Social history and exposure to pathogen signals modulate social status effects on gene regulation in rhesus macaques. Proc. Natl. Acad. Sci. U.S.A. 201820846. doi: 10.1073/pnas.1820846116
Schubert, M., Ermini, L., Sarkissian, C. Der, Jónsson, H., Ginolhac, A., Schaefer, R., et al. (2014). Characterization of ancient and modern genomes by SNP detection and phylogenomic and metagenomic analysis using PALEOMIX. Nat. Protoc. 9:1056. doi: 10.1038/nprot.2014.063
Schubert, M., Ginolhac, A., Lindgreen, S., Thompson, J. F., Al-Rasheid, K. A. S., Willerslev, E., et al. (2012). Improving ancient DNA read mapping against modern reference genomes. BMC Genomics 13:178. doi: 10.1186/1471-2164-13-178
Schubert, M., Lindgreen, S., and Orlando, L. (2016). AdapterRemoval v2: rapid adapter trimming, identification, and read merging. BMC Res. Notes 9:88. doi: 10.1186/s13104-016-1900-2
Seguin-Orlando, A., Gamba, C., Sarkissian, C. Der, Ermini, L., Louvel, G., Boulygina, E., et al. (2015). Pros and cons of methylation-based enrichment methods for ancient DNA. Sci. Rep. 5:11826. doi: 10.1038/srep11826
Ségurel, L., and Bon, C. (2017). On the evolution of lactase persistence in humans. Annu. Rev. Genomics Hum. Genet. 18, 297–319.
Shen, W., Le, S., Li, Y., and Hu, F. (2016). SeqKit: a cross-platform and ultrafast toolkit for FASTA/Q file manipulation. PLoS One 11:e0163962. doi: 10.1371/journal.pone.0163962
Sikora, M., Seguin-Orlando, A., Sousa, V. C., Albrechtsen, A., Korneliussen, T., Ko, A., et al. (2017). Ancient genomes show social and reproductive behavior of early upper paleolithic foragers. Science 358, 659–662. doi: 10.3389/fpsyg.2017.02247
Smith, O., Clapham, A. J., Rose, P., Liu, Y., Wang, J., and Allaby, R. G. (2014). Genomic methylation patterns in archaeological barley show de-methylation as a time-dependent diagenetic process. Sci. Rep. 4:5559. doi: 10.1038/srep05559
Smith, R. W. A., Monroe, C., and Bolnick, D. A. (2015). Detection of cytosine methylation in ancient DNA from five native american populations using bisulfite sequencing. PLoS One 10:e0125344. doi: 10.1371/journal.pone.0125344
Snyder-Mackler, N., Sanz, J., Kohn, J. N., Voyles, T., Pique-Regi, R., Wilson, M. E., et al. (2019). Social status alters chromatin accessibility and the gene regulatory response to glucocorticoid stimulation in rhesus macaques. Proc. Natl. Acad. Sci. U.S.A. 116, 1219–1228. doi: 10.1073/pnas.1811758115
The Genome Sequencing Consortium (2001). Initial sequencing and analysis of the human genome. Nature 409, 860–921. doi: 10.1038/35057062
Wang, C.-C., Reinhold, S., Kalmykov, A., Wissgott, A., Brandt, G., Jeong, C., et al. (2019). Ancient human genome-wide data from a 3000-year interval in the caucasus corresponds with eco-geographic regions. Nat. Commun. 10:590. doi: 10.1038/s41467-018-08220-8
Keywords: ancient DNA, DNA methylation, DNA damage, alignment, mapping, coverage, genome, methylome
Citation: Poullet M and Orlando L (2020) Assessing DNA Sequence Alignment Methods for Characterizing Ancient Genomes and Methylomes. Front. Ecol. Evol. 8:105. doi: 10.3389/fevo.2020.00105
Received: 28 November 2019; Accepted: 31 March 2020;
Published: 06 May 2020.
Edited by:
Michael Knapp, University of Otago, New ZealandReviewed by:
Kieren James Mitchell, University of Adelaide, AustraliaKatharina Dulias, University of York, United Kingdom
Peter D. Heintzman, UiT The Arctic University of Norway, Norway
Copyright © 2020 Poullet and Orlando. This is an open-access article distributed under the terms of the Creative Commons Attribution License (CC BY). The use, distribution or reproduction in other forums is permitted, provided the original author(s) and the copyright owner(s) are credited and that the original publication in this journal is cited, in accordance with accepted academic practice. No use, distribution or reproduction is permitted which does not comply with these terms.
*Correspondence: Ludovic Orlando, ludovic.orlando@univ-tlse3.fr