Temperature Modifies Consumer-Resource Interaction Strength Through Its Effects on Biological Rates and Body Mass
 Azenor Bideault
 Michel Loreau
 Dominique Gravel1
- 1Integrative Ecology Lab, Department de Biologie, Université de Sherbrooke, Sherbrooke, QC, Canada
- 2Centre for Biodiversity Theory and Modelling, Theoretical and Experimental Ecology Station, CNRS and Paul Sabatier University, Moulis, France
Temperature is the most significant environmental gradient at the global scale, impacting the distributions of species and their ecological interactions. It is now established that temperature affects several biological rates and body mass, and can, in turn, alter interaction strength. Latitudinal variation in the strength of interactions has been observed for trophic and competitive interactions and many studies support that biotic interactions are more intense at low latitudes. Nevertheless, the mechanisms underlying the temperature dependence of trophic regulation, the effect of consumers on their preys, remain unclear. The aim of our study is to get better insights on the effects of temperature on trophic regulation. We used a consumer-resource model and considered that organisms' biological rates present a unimodal thermal response and that body mass decreases with temperature. We compared three measures of interaction strength: per capita, per population and net interaction strength. Our results demonstrate that the effect of temperature on interaction strength is contingent upon which species' biological rates are temperature dependent. When all biological rates are temperature dependent, the thermal response of interaction strength is hump-shaped following the scaling of search rate, whilst it is monotonically decreasing when only mortality rates vary with temperature. Finally, we show that temperature can indirectly impact trophic interaction strength through the temperature-size rule. A decrease in organisms' body size due to temperature induces a decrease in per capita and per population interaction strength and tend to decrease net interaction strength, depending on which trophic level follows the temperature-size rule. Our analysis gives an overview of how temperature, through various effects, may impact different measures of interaction strength.
1. Introduction
Temperature can strongly affect food-web structure and interaction strength (Beveridge et al., 2010; Rodríguez-Castañeda, 2013). Understanding its impact on trophic regulation is vital for predicting the consequences of climate change on communities and ecosystems stability. The strength of consumer–resource interactions is expected to vary along large-scale latitudinal and climatic gradients (Schemske et al., 2009), with recent evidence suggesting that these interactions are stronger toward lower latitudes and in warmer regions. Several studies have indeed shown that changes in temperature can induce shifts in the magnitudes of top-down and bottom-up forces. For instance, it can strengthen the effect of fishes on primary producers in aquatic systems (Kratina et al., 2012; Shurin et al., 2012), of spiders and vertebrate predators on plants in terrestrial systems (Barton et al., 2009) and of large mammalian herbivores on primary producers (Gibert and Delong, 2014). Within the Arctic, predation tends to decrease with latitude whilst herbivory tends to increase (Legagneux et al., 2014). Indirect effects (cascading effects through trophic levels) may thus increase the complexity of the impact of temperature by inducing antagonistic effects between trophic levels (Beveridge et al., 2010). Moreover, the short- to long-term responses of interacting species may diverge. Warming may induce accelerated feeding rates, resulting in stronger top-down control over short time-scales, whereas, in the longer term, food-web reorganization could lead to weaker top-down control (Brose et al., 2012). Some interactions are then magnified with warming while others are weakened depending on the study system and the duration of the study. This diversity of empirical observations suggests that the response of trophic regulation to warming could be context-dependent (Gilbert et al., 2014; Sentis et al., 2014; Amarasekare, 2015). Discrepancies among studies about the impact of temperature on trophic regulation can arise for two reasons, among others: (1) increased temperatures induce various changes on individual metabolism and body mass that can in turn impact interaction strength in multiple ways, and (2) different measures of interaction strength are typically used from one study to another and thus lead to different interpretations.
Temperature affects individuals' life-history (reproduction, development and survival) and foraging traits (search rates and handling times) (Savage et al., 2004; Englund et al., 2011). It has long been established that, in addition to body mass, temperature affects biochemical reaction rates, metabolic rates, and nearly all other biological activities (Gillooly et al., 2001; Brown et al., 2004; Savage et al., 2004). However, the temperature dependence of some biological rates may vary from one species to another. For instance, the temperature dependence of search rates varies according to foraging strategies. For sit-and-wait predators, it may not be dependent upon temperature (Sentis et al., 2017b), while it can be temperature dependent for predators that actively search for prey. Temperature changes can also induce reductions in body mass for many organisms, including diatoms (Montagnes and Franklin, 2001), phyto- and zooplankton, and fishes (Daufresne et al., 2009; Gardner et al., 2011). Within the range of physiologically tolerable temperatures for ectothermic organisms, individual body mass is expected to decrease with warming according to the temperature-size rule (TSR) (Atkinson, 1994). This phenotypically plastic response can be explained by the fact that adult size is a combination of individual growth rate (increase in weight per time) and development rate (increase in life stage per time). Because development rates are more sensitive to temperature (i.e., increase faster with warming) than are growth rates (Forster et al., 2011; Gardner et al., 2011; Zuo et al., 2012), individuals reared at warmer temperatures typically reach a maturity at a smaller size than those reared at colder temperatures (Atkinson, 1994; Zuo et al., 2012). Reduced body mass has been considered as the third universal ecological response to global warming (Daufresne et al., 2009). Body mass is a key aspect of community structure as it strongly determines life history rates and the strength of interaction between species (Pawar et al., 2016). As body mass affects biological rates and foraging traits, temperature can, through the TSR, indirectly impact consumer-resource dynamics (Osmond et al., 2017; Sentis et al., 2017a). Integrating these different effects of temperature into a general framework is thus essential to predict its effect on interaction strength (Osmond et al., 2017; Sentis et al., 2017a).
Even though many theoretical studies analyze the effect of temperature on the dynamics of food chains, most of them focus on how temperature impacts stability (oscillations and predator persistence) (Vasseur and McCann, 2005; Gilbert et al., 2014; Amarasekare, 2015) via its effect on biological rates only. These studies neglect indirect effects of temperature on food webs via the TSR and do not explicitly consider interaction strength. Sentis et al. (2017a) and Osmond et al. (2017), in contrast, study the effect of warming on interaction strength through its effects on biological rates and body mass. However, they consider conditions under which organisms remain below their optimal and only one interaction strength measure [the dynamic index (Berlow et al., 1999) or net interaction strength, called BCR in Osmond et al. (2017)]. Yet it is known that some tropical ectotherm species already experience stressful body temperatures impacting their physical performance (Huey et al., 2009). Understanding the dynamics of species interaction under a sufficiently consequent temperature range is essential to tackle the effects of climate change on communities. To bridge these gaps we consider temperatures above optima but also different interaction strength measures.
Although the concept of interaction strength seems intuitive, many definitions have been used (Laska and Wootton, 1998; Berlow et al., 2004). Generally speaking, interaction strength is a measure of the magnitude of the effect of a species on the growth rate of another (Laska and Wootton, 1998). However, theoreticians and empiricists measure interaction strength in different ways (Laska and Wootton, 1998); and, even within theoretical and empirical studies, there are discrepancies in the way it is quantified. Berlow et al. (2004) enumerated a set of interaction strength measures that include for instance elements of the community matrix, biomass flux, maximum consumption rate or perturbation effects on population abundance. Field experiments have shown that the removal of species from ecosystems can highly impact species communities (Paine, 1980, 1992). Various indices of net interaction strength have thus been derived from removal experiments and describe how a focal species impacts the abundance of other species in the community. These experiments are however limited because their results can vary with experimental duration, with the density of the focal species and with the species composition of the community (Wootton and Emmerson, 2005). Several indices have also been used for the analysis of theoretical models. Many studies use per capita effect of a species on the growth rate of another one because it is defined without reference to the equilibrium state, explicit in many models and because many other measures can be derived from it (Laska and Wootton, 1998; Wootton and Emmerson, 2005; Novak and Wootton, 2010). Commonly used interaction strength indices relate to various food web properties and dynamics therefore may lead to misleading conclusions (Berlow et al., 2004). For instance, a strong interaction strength measured from the community matrix does not always coincide with a strong effect of species removal (Berlow et al., 2004). There is then a need to clarify the haziness around how temperature impacts different interaction strength measures, to help bridge the gap between theory and experiments.
Hence, while most studies focus on one interaction strength measure at a time, we investigate here, how temperature affects three aspects of interaction strength. We aim at decomposing the different mechanisms that may influence the effect of temperature on trophic regulation in a linear food chain. We develop a nutrient explicit tri-trophic model of consumers and resources to tackle the joint effects of temperature on interaction strength and compared three different commonly used theoretical and experimental measures of interaction strength: per capita, per population and net (i.e., log response ratio) interaction strength. We derive predictions of how the temperature dependence of species' biological rates impacts the relationship between temperature and theses measures of interaction strength. Finally, we examine how temperature indirectly affects interaction strength through decreasing organisms' body mass.
2. Modeling Framework
2.1. Consumer-Resource Model
The model is nutrient explicit and describes the dynamics of a three level linear food chain (see Figure 1). The nutrient (N) is assimilated by an autotrophic primary producer (P), itself eaten by a herbivore (H) which is consumed by a carnivorous top-predator (C). The dynamics are given by:
where N is the nutrient concentration and P, H and C the total biomasses of primary producer, herbivore and carnivore, respectively. Temperature and body mass dependencies of parameters are omitted for clarity of the representation. Nutrients are continuously added and leached out of the system at rates I and d, respectively. μ is the primary producer growth rate and q the carbon-to-nitrogen ratio. Some biomass is lost due to respiration and mortality at rates zi and bi, respectively, for the different compartments i. aij is the mass-specific search rate and eij is the conversion efficiency of resource i to consumer j biomass. We consider a Type-I functional response as a first approximation in order to track equilibrium densities. bi is a constant mortality rate to account for various processes that do not depend upon temperature, such as dilution, sedimentation or natural disturbances. Similarly, eij does not vary with body mass and temperature (O'Connor et al., 2011; Dell et al., 2014; Pawar, 2015). Conversely, biomass production rate μ, biomass loss rate zi and search rate aij may all vary with body mass and temperature.
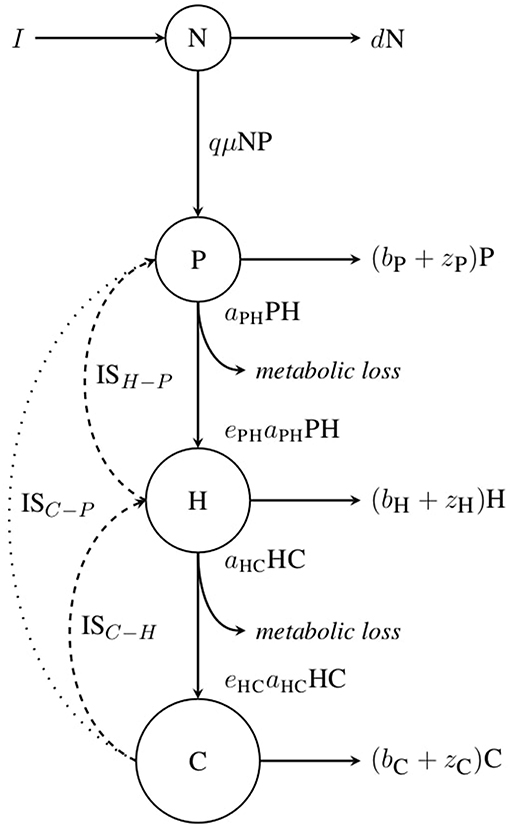
Figure 1. Conceptual diagram of the model. N, P, H and C respectively represent the nutrient, primary producer, herbivore and carnivore variables. Complete arrows stand for fluxes between variables and metabolic losses and dashed arrows correspond to the effects of consumers on resources. IS stands for interaction strength. ISH−P and ISC−H represent the direct interaction between herbivores and primary producers and between carnivores and herbivores, respectively; while ISC−P represents the indirect interaction between carnivores and primary producers.
2.2. Body Mass and Thermal Dependence of Biological Rates
Following the “Metabolic Theory of Ecology,” we used the Boltzmann-Arrhenius model from chemical reaction kinetics to describe the rise of several biological rates with temperature (Gillooly et al., 2001; Brown et al., 2004; Savage et al., 2004). Many biological rates also decline at high temperatures, often due to changes in enzyme kinetics (Johnson and Lewin, 1946), and therefore we also consider the Johnson-Lewin function. Hence, according to the Boltzmann-Arrhenius-Johnson-Lewin model (BAJL model here after), the scaling of a metabolic (or a biological) rate, ri, with average adult body mass mi and body temperature T, in Kelvin, is given by:
with,
where r0 is a rate-dependent constant and β the allometric scaling exponent. E is the activation energy in eV (electronvolts) of the rising response and ED the average energy constant at which proteins denature, therefore controlling the rate of decline beyond Toptr, the temperature at which rate r is maximal. Finally, k is the Boltzmann constant (8.617 × 10⁻⁵ eV.K−1). The thermal response of biological rates according to Equation 2 is illustrated in Figure 2. We take the average values of activation energy E from Dell et al. (2011) for a given trophic level and a given biological rate. As few data are available for the de-activation energy ED, we consider the average value across all trophic levels and biological rates (Dell et al., 2011). The growth rate μ and the search rate aij vary with temperature and body mass according to Equation 2. However, the biomass loss rate zi follows an exponential increase with temperature, as described by the first part of Equation 2 when l(T) = 1. Biological rates and body temperature are assumed to be uniform within species. Parameters are summarized in Table 1.
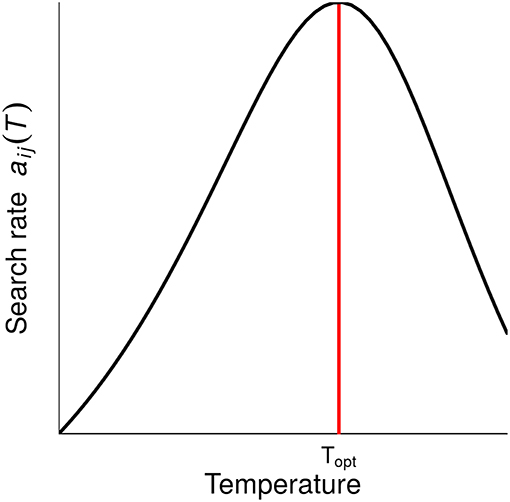
Figure 2. Effect of temperature on the search rate aij which is equal to per capita interaction strength, ISpc, as described by Equation 2. Topt is the temperature at which the rate value is maximal. Below Topt, the individual stands within its PTR (“Physiological Temperature Range”), where the trait performance increases with temperature, whilst above Topt the trait performance decreases. Note that growth rate μ also follows this equation, but mortality rates zi monotonically increase with temperature.
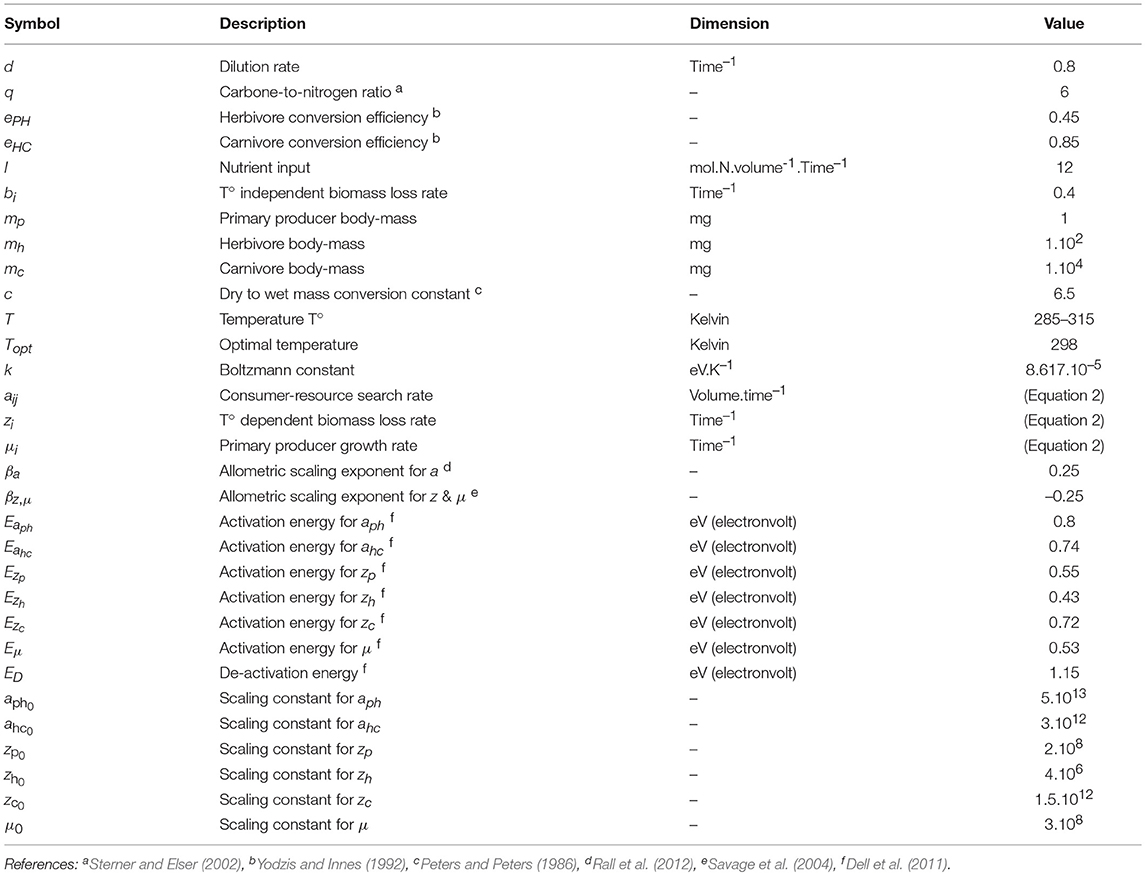
Table 1. Parameters descriptions and values.
2.3. Temperature-Size Rule
We use the estimates of temperature-size response slopes from Forster and Hirst (2012) (see also Sentis et al., 2017a) to simulate the temperature dependence of body mass according to the following equation:
where c is the conversion of dry mass into wet mass, mi293 is the dry mass of species i at 293.15 K and T is temperature. s quantifies the sign and magnitude of the TS response and is determined by the percentage change in body mass per degree (originally in Celsius in Forster and Hirst (2012), we converted from Kelvin) : PCM = (es − 1) × 100. TS response slopes vary between ecosystem types but we consider only the mean TS response for aquatic organisms (the average response for freshwater and marine metazoa), which is negative. The reference body masses are measured at 293.15 K, in our case body masses therefore decrease for temperatures above 293.15 K (Forster and Hirst, 2012):
From this TS response slope, we investigate three possible scenarios where either (1) only the carnivores, (2) herbivores and carnivores and (3) all species follow a TS response, in addition to the case with no TSR at all. We chose these scenarios because, according to Forster and Hirst (2012), in aquatic environments, increases in species' sizes cause the temperature-size response to become increasingly negative.
2.4. Measuring Interaction Strength
The strength of ecological interactions can be assessed through several ways. We consider here three different interaction strength (IS hereafter) measures (Berlow et al., 2004). Per capita IS, ISpc, measures the direct and instantaneous effect of a consumer individual j on the growth rate of a resource individual i; it equals search rate, aij, in our model (Figure 2, Equation 2). This measure is commonly used in theoretical studies because it is defined without reference to the equilibrium state (Laska and Wootton, 1998; Wootton and Emmerson, 2005; Novak and Wootton, 2010), contrary to other measures, which typically include equilibrium densities. The second IS measure we consider is per population IS, ISpp, which is the direct long term effect of the population of consumer j on the growth rate of the resource i at equilibrium and is equal to , where J* is the equilibrium density of consumer j. This index also corresponds to the coefficient of the Jacobian matrix, that describes the dynamics of species at equilibrium, in our model. It has been commonly used in ecology to quantify interaction strength (May, 1974) and is reviewed in Montoya et al. (2009). Finally, net IS, ISnet, is the net long term effect of the population of consumers j on the equilibrium density of the resource i and is equal to the (log) ratio of resource equilibrium densities, I*, in absence and in presence of the consumer, . This definition of IS is typically used in experimental removal studies (Paine, 1980; Laska and Wootton, 1998; Berlow et al., 2004).
We assess interactions between the three trophic levels. We thus consider the direct effect of herbivores on primary producers in absence of carnivores, ISH−P; the direct effect of carnivores on herbivores, ISC−H; and, for ISnet, the indirect effect of carnivores on primary producers, ISC−P, as carnivores can indirectly impact primary producers by reducing herbivore density when feeding on them. In the following analyses, we focus on ISpp and ISnet which are analytically derived as they are dependent upon equilibrium biomasses. We compare their thermal responses with the one of ISpc which is given by Equation 2. Equilibrium densities, I* for species i, are obtained by solving the system of differential equations (Equation 1) when dI/dt = 0. We first investigate how temperature directly affects IS. We then look at the effect of varying the temperature dependence of biological rates (by alternately fixing model parameters at their optimal value) and temperature independent mortality rates. Finally we explore how the indirect effect of temperature through decreasing body mass affects IS. Note that, for brevity, we mainly illustrate our results for the interaction between carnivores and herbivores.
3. Results
3.1. Thermal Dependence of Biological Rates
When all parameters are temperature dependent, the relationship between temperature and consumer-resource IS follows the shape of Equation 2. Because of the definition of the search rate aij, ISpc (which is equal to search rate in our model) follows exactly the shape of the temperature-dependence of biological rates. This measure of IS propagates and thus affects ISpp and ISnet similarly. All three measures of IS therefore increase with temperature, up to a point above which it starts decreasing (Figure 3). Importantly, the temperature-IS relationship holds for the interactions between all trophic levels: for the interactions between primary producers and herbivores (in the absence of carnivores), between herbivores and carnivores and between carnivores and primary producers (for ISnet). Note that for this indirect interaction, primary producers are more abundant in the presence than in the absence of carnivores. The log of is thus negative. A hump-shaped relationship demonstrates that trophic cascades also increase with warming under the PTR before decreasing at the warmest temperatures.
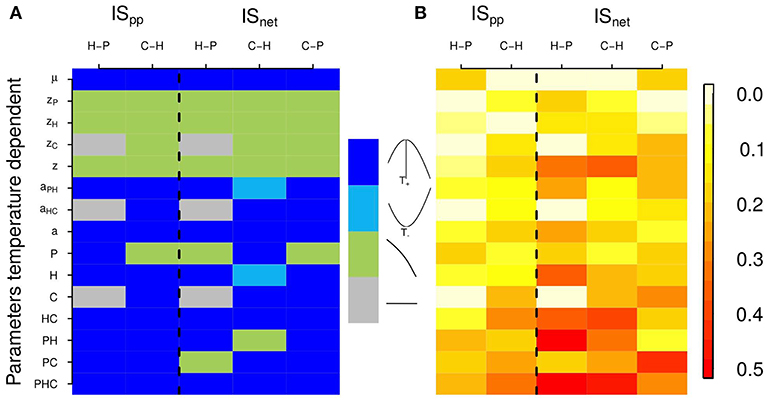
Figure 3. Effects of temperature on two interaction strength measures: interaction strength per population, ISpp, and net interaction strength, ISnet. Each column corresponds to different interactions between consumers and resources: H-P stands for the interaction between herbivores and primary producers in absence of carnivores, C-H for the interaction between carnivores and herbivores and C-P for the indirect interaction between carnivores and primary producers. (Note that to facilitate the comparison between those different interactions, we represented here the inverse of ISC−P. Hence, for all interactions, a hump-shaped relationship means that IS first increases with temperature and a U-shaped relationship means that IS first decreases with temperature.) Each row corresponds to a different scenario of thermal dependence of parameters. Parameters that vary with temperature are specified on the left of the plot (e.g., second row: only zP, the primary producer mortality rate, varies with temperature, other parameters being fixed). When the subscript is not indicated, biological rates of every trophic levels vary with temperature (e.g., 5th row: z, mortality rates of primary producers, herbivores and carnivores vary with temperature). When the trophic level is indicated (P, H and/or C), the parameters of the given trophic level(s) vary with temperature (e.g., 9th row: primary producer parameters, μ and zp, vary with temperature). Hence for the last row (PHC), all parameters vary with temperature. Fixed parameters are set at their optimal value. (A) Qualitative representation of the shape of the thermal response of IS measures for different scenarios of parameters temperature dependence (as in Figure 2). The shapes of the thermal dependence of interaction strength are color coded; see color key, dark blue: hump-shaped, light blue: U-shaped, light green: decrease and gray: no temperature dependence. (In the last case, gray cells, there is no effect of temperature because all parameters are fixed for those interactions. Indeed, here the interactions between primary producers and herbivores are independent of carnivore's biological rates). (B) Thermal sensitivity of interaction strength for different scenarios of parameters temperature dependence, quantified as the standard deviation of interaction strength measures (color coded, see color key).
The sensitivity of IS to temperature varies significantly according to which parameter varies with temperature (Figure 3). The thermal response of IS can be hump-shaped, U-shaped or decrease with temperature. It is then determined by the temperature dependence of the biological rates that are expressed in the IS measures' formulas, which are based on equilibrium biomasses (see Table S1 and Figure S2). In our model, mortality rate increases with temperature whilst growth and search rates follow a hump-shaped relation with temperature. These differences in the shape of the thermal responses of biological rates show in the thermal responses of IS measures. When only mortality rates zi vary with temperature, intraspecific competition increases leading to a decrease in population biomass i at equilibrium, but also to an increase in equilibrium biomass of the resource of species i (if any). Equilibrium biomasses influence ISpp and ISnet, which in turn decrease with increasing temperature. The intrinsic growth rate varies with temperature because of its effect on both mortality and consumption rates. The equilibrium biomass of a consumer species i decreases with mortality rate zi, while the equilibrium biomass of its resource does increase because of lower regulation. The change of equilibrium with increasing temperature of both consumer and resource therefore influences both ISpp and ISnet. When only search rates ai vary with temperature, the thermal dependence of equilibrium biomasses can be hump-shaped or U-shaped. As equilibrium biomasses of the different trophic levels are interdependent, the relationships between biomasses at equilibrium and ISpp and ISnet are not straightforward. ISpp and ISnet are generally hump-shaped, although they can be U-shaped (for ). This shows that generally, ISpp and ISnet directly follow the scaling relationship of ISpc. When consumption rates increase or decrease, IS increases/decreases too. We also vary the parameters by trophic level (i.e., mortality and growth or search rates are temperature dependent only for a given level). For these scenarios, the thermal response of IS measures is generally determined by search or growth rates (hump-shaped or U-shaped relationship) but can also be determined by mortality rates (decrease with temperature) according to IS measures. The variation in the shape of IS thermal responses is more important for ISnet than for ISpp, which can be explained by the fact that ISnet is equal to the ratio of equilibrium biomasses of resources and consumers.
The shapes of the thermal responses of IS measures are qualitatively described in Figure 3A. However, the magnitude of the temperature effect, as well as the strength of the interaction, varies from one scenario of parameter temperature dependence to another. We find that the occurrence of temperature-independent rates can alter the thermal sensitivity of ISpp and ISnet (Figure 3B), which is highly variable from one IS measure to another, and according to which rate is fixed. It tends to increase with the number of rates that are temperature dependent and is stronger for ISnet. The equilibrium biomass of a given trophic level is dependent upon equilibrium biomasses of other trophic levels (Table S1). These interactions between parameters and trophic levels in equilibrium biomasses can in turn lead to an increase in the temperature sensitivity of ISpp and ISnet. We further investigate the response of IS between carnivores and herbivores, and its thermal dependence, to a change in temperature-independent biomass loss rate (Figure 4). The shape of the thermal response of both IS measures remains hump-shaped whatever the value of biomass loss rate. However, increasing biomass loss rate bi decreases both IS measures and shifts the temperature at which IS is maximal toward higher temperatures, mainly for ISnet. Increasing mortality rate bi diminishes carnivore equilibrium biomass, which in turn lead to a decrease in ISpp. Increasing mortality rate bi also decreases herbivore equilibrium biomass in absence of carnivores but increases its equilibrium biomass in presence of carnivores, resulting in a decrease in ISnet (see Table S1 and Figure S3).
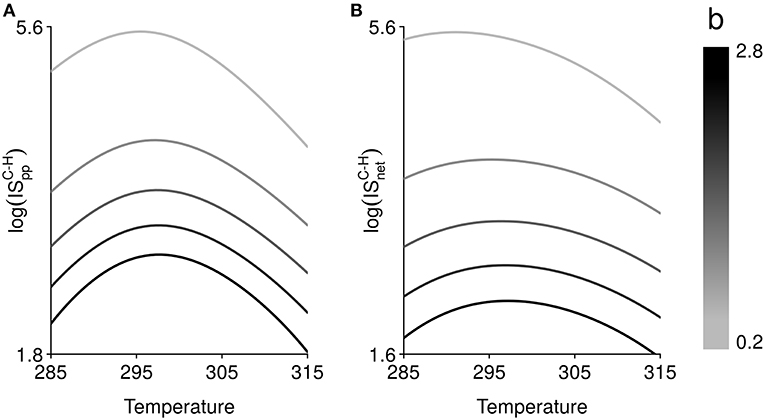
Figure 4. Effect of temperature (in Kelvin) on, (A), interaction strength per population, , and, (B), net interaction strength, , between carnivores C and herbivores H. The relationship between temperature and both interaction strength measures is hump-shaped and follows the thermal dependence function of search rate (or per capita interaction strength) and growth rate (Figure 2). Varying the mortality rate, from 0.2 to 2.8 time–1, changes the magnitude of the temperature effect, the relative strength of interaction and shifts the temperature at which interaction strength is maximal.
3.2. Temperature-Size Rule
Temperature, through its effect on body mass, can indirectly induce changes in IS (for the interaction between carnivores and herbivores in Figure 5). The TSR does not alter the shape of the thermal response of IS, which remains hump-shaped for all TS scenarios. According to Equation 4, the temperature of reference is 293.15 K. Organisms are larger for temperatures under 293.15 K and smaller for temperatures above 293.15 K. Hence IS values with and without TSR are equal at 293.15 K (lines are crossing at 293.15 K on Figure 5). However, below and above this temperature of reference, IS can either decrease or increase with the TSR. We also observe a shift in the temperature at which IS is maximal.
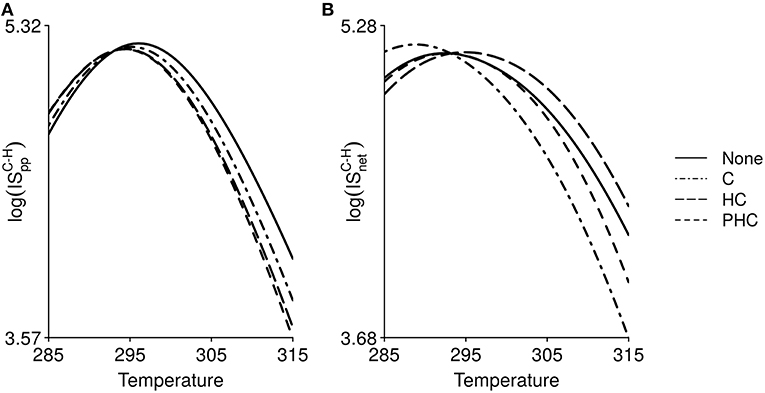
Figure 5. Effect of temperature (in Kelvin) on, (A), interaction strength per population, , and, (B) net interaction strength, , between carnivores and herbivores, when organisms body mass decreases with temperature due to the temperature-size rule. Four scenarios are simulated: no TS response in either species (None), only carnivores follow a TS response (C), herbivores and carnivores follow a TS response (HC) and the three trophic levels follow a TS response (PHC).
ISpc (Equation 2, Figure S1) and ISpp (Figure 5A) both increase for temperature below 293.15 K (increase in body mass) and decrease for temperature above 293.15 K (decrease in body mass). These IS measures then directly depend on species body mass. ISpp gradually becomes lower as more trophic levels experience a decrease in body mass (Figure 5A). ISnet declines with decreasing carnivore body mass regardless of whether or not herbivore body mass also decreases (Figure 5B). However, when the three trophic levels follow the TSR, ISnet increases with reduced body mass compared to the case with no TSR effect. This is due to the fact that a reduction in body mass can affect equilibrium biomasses of the different trophic levels in distinct ways. The equilibrium biomass of herbivores increases in both the presence and absence of carnivores when the three trophic levels follow the TSR (Figure S2), which results in an increase of ISnet. Hence, the indirect effect of temperature through altering body mass does not qualitatively affect the relationship between temperature and IS except for a shift of the location of the maximal IS. However, it changes the relative strength of the interactions.
4. Discussion
There is no consensus about the effect of temperature on trophic regulation, as studies are often based on different assumptions, models or measures of interaction strength (IS). It is known that temperature directly influences the physiology of organisms by changing their biological rates (Gillooly et al., 2001; Brown et al., 2004; Savage et al., 2004) and inducing a change in body mass (Forster and Hirst, 2012). These effects then propagate to the population- and community-level. The comparison of IS measures allows us to reveal three main mechanisms by which temperature affects trophic regulation : (i) temperature directly affects metabolic rates and body mass, which in turn induces changes in biological rates and in the rate at which individuals consume their resource (and in ISpc). As a result, (ii) population sizes at equilibrium become temperature dependent, which in turn infuences ISpp, the total effect of consumers on resource populations. Moreover, (iii) the effect of temperature propagates between trophic levels meaning that interactions between parameters (or trophic levels) that are temperature dependent may make more sensitive ISpp and ISnet to temperature changes. We thus support the widely believed hypothesis that temperature has an effect on trophic interaction strength, but we also show that this effect can vary in direction, magnitude and location of its peak.
More precisely, in our analyses, the relationship between temperature and interaction strength follows the scaling relationship between search rates and temperature when all compartments respond to temperature. This result is obvious for a linear functional response but nonetheless underlines parameters that need to be better documented empirically. Sensitivity of the different IS measures to temperature increases when all parameters are temperature dependent. A precise definition of IS is therefore essential to link multiple experimental and theoretical studies. Yet many indices have been used, making it difficult to compare outcomes from different studies (Wootton and Emmerson, 2005). The coherence in the thermal response of the different IS measures considered here demonstrates that different indices can behave similarly to an increase in temperature.
When all parameters are temperature dependent, IS thus increases with temperature up to a certain threshold above which it decreases. Our result is consistent with previous studies that experimentally manipulated the presence of predators and measured either net IS (log ratio of prey biomass in absence/presence of predators) (Barton et al., 2009; Kratina et al., 2012; Shurin et al., 2012; Gray et al., 2015) or per capita IS (ratio of predation rate and resource density) (Sentis et al., 2014). Sentis et al. (2014) theoretically and experimentally measured omnivory strength, computed as the number of resources and consumers eaten. Their model predict that omnivory strength increases with temperature but rapidly decreases at extreme temperatures due to the hump-shaped thermal response of search rate. However, they did not experimentally measure this decrease at extreme temperatures because their warmest temperature was 30 °C. On a narrow range of temperature, Osmond et al. (2017) also found that net IS monotonically increases with temperature. Hence, most experimental studies found that temperature increases IS but few of them detailed the different rates that are temperature dependent. Our results also show that IS decreases at higher temperatures, in agreement with Sentis et al. (2014). These authors suggest that the effect of temperature on interaction strength is mediated by its effect on predator foraging activities. Temperature, through increasing search rate, promote predation of resources. However, at higher temperatures, search rate decreases and so does IS. It is therefore critical to characterize the thermal response of search rates and other biological rates over a large range of conditions to catch this peak. Yet few data or theories exist for the decline in individuals rate performance at higher temperatures (Dell et al., 2011) as the majority of studies concentrates on the rising part of biological rates responses to temperature. The decreasing phase has raised less attention, partly because organisms usually live within their physiological temperature range (PTR), and partly because a majority of experiments perform a marginal warming relative to current conditions (Sentis et al., 2014).
We also find that the relationship between temperature and IS can differ according to which biological rates are temperature dependent. Thermal sensitivity of IS when multiple rates are affected by temperature appears stronger than the sum of individual effects, suggesting interactions and synergies between trophic levels are taking place (Figure 3B). Indeed, effects of temperature propagate through the entire food chain, from primary producers at the bottom to carnivores at the top and conversely. For instance, when only the primary producer mortality rate zP varies with temperature, the interactions between carnivores and herbivores, e.g , still vary with temperature. This arises because zP influences the equilibrium concentration of the nutrient, which in turn influences the equilibrium biomass of the primary producers, and so does the equilibrium biomass of the carnivores (Table S1), all together impacting . Similarly, when only the carnivore mortality rate zC varies with temperature, , which is the ratio of primary producers biomass in absence and in presence of carnivores, still varies with temperature (Figure 3B). zC influences the equilibrium biomass of herbivores and subsequently the equilibrium biomass and concentration of primary producers and nutrients. The same reasoning applies for herbivore parameters. Hence, even though some parameters are not directly involved in IS measures, they can indirectly influence IS through the interdependence of equilibrium biomasses across trophic levels.
There is usually coherence in the thermal response of IS when multiple parameters from different trophic levels vary together. For instance, when mortality rates of all trophic levels vary with temperature (search rates and growth rates are fixed), the relationship between IS and temperature is no longer hump-shaped but instead exponential (Figure 3A). Similarly, when consumption rates of all trophic levels vary together, the thermal response of IS is unimodal. When multiple rates are temperature dependent, the thermal response of IS is also usually stronger than when a single parameter varies (Figure 3B). For instance, when the mortality rate z of the three trophic levels vary with temperature, the thermal sensitivity of ISpp and ISnet is stronger than when the mortality rate of a single trophic level is temperature dependent. There may be however interactive effects that can lead in some cases to surprising IS thermal responses. We find this situation for instance when only the search rate of herbivore aPH varies with temperature. In that case, the equilibrium biomass of herbivores in presence of carnivores is then temperature independent but the equilibrium biomass of herbivores in absence of carnivores is U-shaped (Figure 3A), resulting in a U-shaped thermal response for . All in all, this variation in the thermal response of IS indicates that there are multiple pathways by which temperature may affect IS.
Knowledge of which rates are influenced by temperature, and how, is therefore critical to document (Dell et al., 2011; Englund et al., 2011; Huey and Kingsolver, 2011; Vucic-Pestic et al., 2011; Burnside et al., 2014; Amarasekare, 2015). It will also be important to better measure activation energies for each rate since some parameters are more sensitive than others. It has been shown for instance that search rate can have a steeper temperature response than maximal intake rate or handling time (Englund et al., 2011; Sentis et al., 2014), and that it can be temperature independent for sit-and-wait predators (Sentis et al., 2017b). However, even when search rate (i.e., ISpc) is fixed, ISnet can vary with temperature. This result is in agreement with previous experimental studies (Sentis et al., 2017b) and emphasize the importance of considering different IS measures. Temperature sensitivity can also vary across trophic levels. Climate sensitivity is assumed to increase with trophic levels (Voigt et al., 2003), possibly due to the fact that respiration increases faster than photosynthesis with warming (Pawar et al., 2015). On the other hand, upper trophic levels are often endotherms which can control their body temperature to a certain extent. According to our results, differences in the thermal sensitivity of species can in turn alter the shape of the thermal response of interaction strength but also its sensitivity. We also find that the thermal sensitivity of IS can be contingent on parameters that are not temperature dependent, such as mortality rates, that can magnify thermal responses. Mortality can increase via many other mechanisms than temperature. Natural disturbances or dilution, for instance, can affect mortality rates and in turn species biomasses leading to a change in the strength of their interactions. Hence, we show that, in addition to temperature, other factors can impact trophic regulation and, more importantly, magnify the temperature effect, without altering the shape of its thermal response.
Finally, we investigated the effect of a shift in body mass due to temperature on IS. Warming is assumed to have a negative effect on ectothermic organisms' body mass due to the temperature-size rule (Ashton et al., 2000). Despite body mass being a key determinant of trophic interactions (Brose et al., 2006; Sentis et al., 2017a), the ecological consequences of such phenotypic responses remain largely unexplored. Here we show that the unimodality of the relationship between temperature and interaction strength (for the case where all parameters vary with temperature) holds even when body mass decreases with temperature. However, per population interaction strength decreases with decreasing body mass whilst net interaction strength tends to either increase or decrease depending on which trophic levels follow the TSR. Osmond et al. (2017) found that the TSR had little effect on net IS but increases the stability of the interaction. While they considered symmetric TS responses between resources and consumers, we demonstrated, in agreement with (Sentis et al., 2017a) that heterogeneous TS reponses across trophic levels lead to different responses of IS. By altering resource and consumer body mass ratios, TS responses may alter IS. Increasing body mass ratio is expected to increase the relative rate of consumption per unit consumer biomass which decreases IS and stabilizes the food chain (Sentis et al., 2017a). We indeed find that when carnivores' body mass decreases, thus decreasing body mass ratio between carnivores and herbivores, the effect of carnivores on herbivores (ISC−H) is lower. The indirect effect of temperature through body mass can then be opposite to its direct effect (which increases interaction strength under the PTR). Nevertheless, we also found that TS responses can further enhance the direct effect of warming on IS. We demonstrate that TS responses can impact IS in various directions depending on TS scenarios, consistent with Sentis et al. (2017a), but also show that these responses can vary from one measure of IS to another. This also raises the point that experiment duration is essential to accurately measure IS: experiments that are too short to observe a decrease in body mass could lead to under or overestimation of IS.
In summary, we find that temperature has numerous effects on IS. Presently, studies investigating how temperature influences ecosystem functioning mainly focus on only one effect of climate change at a time (Yvon-Durocher and Allen, 2012). Our results show that developing a framework that integrates the diverse effects of temperature on species' interactions is key to understand food web dynamics. Hence, through a simple model, we show that the impact of temperature on IS can be complex but that different measures of IS behave similarly with warming. Our approach however did not account for thermal adaptation of the species, which can reduce the physiological responses of organisms to warming. Furthermore, we considered a simple trophic chain, whereas a food-web approach would be relevant to investigate how various effects of temperature affect more complex communities. Hence, our analysis provides insights on various outcomes arising from communities under warming and demonstrates the importance of considering diverse effects of temperature.
Data Availability
Data have not been archived because this article does not contain data. Codes are available to download on https://github.com/Azenor/Temp_effect_trophic_interaction.
Author Contributions
AB and DG conceived and developed the models. AB conducted the modeling work and wrote the first draft of the manuscript. All authors discussed the results and substantially revised the manuscript.
Funding
This work was supported by the University of Sherbrooke, the CRSNG and the Canada Research Chair program. ML was supported by the TULIP Laboratory of Excellence (ANR-10-LABX-41).
Conflict of Interest Statement
The authors declare that the research was conducted in the absence of any commercial or financial relationships that could be construed as a potential conflict of interest.
Acknowledgments
We would like to thank A. Sentis, D. Watts, the Integrative Ecology (IE) lab and the Centre for Biodiversity Theory and Modelling (CBTM) members for enlightening discussions.
Supplementary Material
The Supplementary Material for this article can be found online at: https://www.frontiersin.org/articles/10.3389/fevo.2019.00045/full#supplementary-material
References
Amarasekare, P. (2015). Effects of temperature on consumer–resource interactions. J. Ani. Ecol. 84, 665–679. doi: 10.1111/1365-2656.12320
Ashton, K. G., Tracy, M. C., and de Queiroz, A. (2000). Is bergmann's rule valid for mammals? Am. Nat. 156, 390–415. doi: 10.1086/303400
Atkinson, D. (1994). Temperature and organism size: a biological law for ectotherms? Adv. Ecol. Res. 25, 1–1. doi: 10.1016/S0065-2504(08)60212-3
Barton, B. T., Beckerman, A. P., and Schmitz, O. J. (2009). Climate warming strengthens indirect interactions in an old-field food web. Ecology 90, 2346–2351. doi: 10.1890/08-2254.1
Berlow, E. L., Navarrete, S. A., Briggs, C. J., Power, M. E., and Menge, B. A. (1999). Quantifying variation in the strengths of species interactions. Ecology 80, 2206–2224. doi: 10.1890/0012-9658(1999)080[2206:QVITSO]2.0.CO;2
Berlow, E. L., Neutel, A.-M., Cohen, J. E., De Ruiter, P. C., Ebenman, B., Emmerson, M., et al. (2004). Interaction strengths in food webs: issues and opportunities. J. Anim. Ecol. 73, 585–598. doi: 10.1111/j.0021-8790.2004.00833.x
Beveridge, O. S., Humphries, S., and Petchey, O. L. (2010). The interacting effects of temperature and food chain length on trophic abundance and ecosystem function. J. Anim. Ecol. 79, 693–700. doi: 10.1111/j.1365-2656.2010.01662.x
Brose, U., Dunne, J. A., Montoya, J. M., Petchey, O. L., Schneider, F. D., and Jacob, U. (2012). Climate change in size-structured ecosystems. Phil. Trans. R. Soc. B 367, 2903–2912. doi: 10.1098/rstb.2012.0232
Brose, U., Jonsson, T., Berlow, E. L., Warren, P., Banasek-Richter, C., Bersier, L.-F., et al. (2006). Consumer-resource body-size relationships in natural food webs. Ecology 87, 2411–2417. doi: 10.1890/0012-9658(2006)87[2411:CBRINF]2.0.CO;2
Brown, J. H., Gillooly, J. F., Allen, A. P., Savage, V. M., and West, G. B. (2004). Toward a metabolic theory of ecology. Ecology 85, 1771–1789. doi: 10.1890/03-9000
Burnside, W. R., Erhardt, E. B., Hammond, S. T., and Brown, J. H. (2014). Rates of biotic interactions scale predictably with temperature despite variation. Oikos 123, 1449–1456. doi: 10.1111/oik.01199
Daufresne, M., Lengfellner, K., and Sommer, U. (2009). Global warming benefits the small in aquatic ecosystems. Proc. Natl. Acad. Sci. U.S.A. 106, 12788–12793. doi: 10.1073/pnas.0902080106
Dell, A. I., Pawar, S., and Savage, V. M. (2011). Systematic variation in the temperature dependence of physiological and ecological traits. Proc. Natl. Acad. Sci. U.S.A. 108, 10591–10596. doi: 10.1073/pnas.1015178108
Dell, A. I., Pawar, S., and Savage, V. M. (2014). Temperature dependence of trophic interactions are driven by asymmetry of species responses and foraging strategy. J. Anim. Ecol. 83, 70–84. doi: 10.1111/1365-2656.12081
Englund, G., Ohlund, G., Hein, C. L., and Diehl, S. (2011). Temperature dependence of the functional response. Ecol. Lett. 14, 914–921. doi: 10.1111/j.1461-0248.2011.01661.x
Forster, J., and Hirst, A. G. (2012). The temperature-size rule emerges from ontogenetic differences between growth and development rates. Funct. Ecol. 26, 483–492. doi: 10.1111/j.1365-2435.2011.01958.x
Forster, J., Hirst, A. G., and Woodward, G. (2011). Growth and development rates have different thermal responses. Am. Nat. 178, 668–678. doi: 10.1086/662174
Gardner, J. L., Peters, A., Kearney, M. R., Joseph, L., and Heinsohn, R. (2011). Declining body size: a third universal response to warming? Trends Ecol. Evol. 26, 285–291. doi: 10.1016/j.tree.2011.03.005
Gibert, J. P., and Delong, J. P. (2014). Temperature alters food web body-size structure. Biol. Lett. 10:20140473. doi: 10.1098/rsbl.2014.0473
Gilbert, B., Tunney, T. D., McCann, K. S., DeLong, J. P., Vasseur, D. A., Savage, V., et al. (2014). A bioenergetic framework for the temperature dependence of trophic interactions. Ecol. Lett. 17, 902–914. doi: 10.1111/ele.12307
Gillooly, J. F., Brown, J. H., West, G. B., Savage, V. M., and Charnov, E. L. (2001). Effects of size and temperature on metabolic rate. science 293, 2248–2251. doi: 10.1126/science.1061967
Gray, S. M., Poisot, T., Harvey, E., Mouquet, N., Miller, T. E., and Gravel, D. (2015). Temperature and trophic structure are driving microbial productivity along a biogeographical gradient. Ecography 39, 981–989. doi: 10.1111/ecog.01748
Huey, R. B., Deutsch, C. A., Tewksbury, J. J., Vitt, L. J., Hertz, P. E., Pérez, H. J. Á., et al. (2009). Why tropical forest lizards are vulnerable to climate warming. Proc. R. Soc. Lond. 276, 1939–1948. doi: 10.1098/rspb.2008.1957
Huey, R. B., and Kingsolver, J. G. (2011). Variation in universal temperature dependence of biological rates. Proc. Natl. Acad. Sci. U.S.A. 108, 10377–10378. doi: 10.1073/pnas.1107430108
Johnson, F. H., and Lewin, I. (1946). The growth rate of E. coli in relation to temperature, quinine and coenzyme. J. Cell. Physiol. 28, 47–75. doi: 10.1002/jcp.1030280104
Kratina, P., Greig, H. S., Thompson, P. L., Carvalho-Pereira, T. S., and Shurin, J. B. (2012). Warming modifies trophic cascades and eutrophication in experimental freshwater communities. Ecology 93, 1421–1430. doi: 10.1890/11-1595.1
Laska, M. S. M., and Wootton, J. T. J. (1998). Theoretical concepts and empirical approaches to measuring interaction strength. Ecology 79, 461–476. doi: 10.1890/0012-9658(1998)079[0461:TCAEAT]2.0.CO;2
Legagneux, P., Gauthier, G., Lecomte, N., Schmidt, N. M., Reid, D., Cadieux, M., et al. (2014). Arctic ecosystem structure and functioning shaped by climate and herbivore body size. Nat. Clim. Change 4, 379–383. doi: 10.1038/nclimate2168
May, R. M. (1974). Stability and Complexity in Model Ecosystems, Vol 6. Princeton, NJ: Princeton University Press.
Montagnes, D. J., and Franklin, M. (2001). Effect of temperature on diatom volume, growth rate, and carbon and nitrogen content: reconsidering some paradigms. Limnol. Oceanogr. 46, 2008–2018. doi: 10.4319/lo.2001.46.8.2008
Montoya, J. M., Woodward, G., Emmerson, M. C., and Solé, R. V. (2009). Press perturbations and indirect effects in real food webs. Ecology 90, 2426–2433. doi: 10.1890/08-0657.1
Novak, M., and Wootton, J. T. (2010). Using experimental indices to quantify the strength of species interactions. Oikos 119, 1057–1063. doi: 10.1111/j.1600-0706.2009.18147.x
O'Connor, M. I., Gilbert, B., and Brown, C. J. (2011). Theoretical predictions for how temperature affects the dynamics of interacting herbivores and plants. Am. Nat. 178, 626–638. doi: 10.1086/662171
Osmond, M. M., Barbour, M. A., Bernhardt, J. R., Pennell, M. W., Sunday, J. M., and O'Connor, M. I. (2017). Warming-induced changes to body size stabilize consumer-resource dynamics. Am. Nat. 189, 718–725. doi: 10.1086/691387
Paine, R. T. (1980). Food webs: linkage, interaction strength and community infrastructure. J. An. Ecol. 49:666. doi: 10.2307/4220
Paine, R. T. (1992). Food-web analysis through field measurement of per capita interaction strength. Nature 355, 73–75. doi: 10.1038/355073a0
Pawar, S. (2015). Chapter eight-the role of body size variation in community assembly. Adv. Ecol. Res. 52, 201–248. doi: 10.1016/bs.aecr.2015.02.003
Pawar, S., Dell, A. I., and Savage, V. M. (2015). From metabolic constraints on individuals to the dynamics of ecosystems. Aquat. Funct. Biodiv. 1, 3–36.
Pawar, S., Dell, A. I., Savage, V. M., and Knies, J. L. (2016). Real versus artificial variation in the thermal sensitivity of biological traits. Am. Nat. 187, E41–E52. doi: 10.1086/684590
Peters, R. H., and Peters, R. H. (1986). The Ecological Implications of Body Size, Vol 2. Cambridge: Cambridge University Press.
Rall, B. C., Brose, U., Hartvig, M., Kalinkat, G., Schwarzmüller, F., Vucic-Pestic, O., et al. (2012). Universal temperature and body-mass scaling of feeding rates. Phil. Trans. R. Soc. B 367, 2923–2934. doi: 10.1098/rstb.2012.0242
Rodríguez-Castañeda, G. (2013). The world and its shades of green: a meta-analysis on trophic cascades across temperature and precipitation gradients. Global Ecol. Biogeogr. 22, 118–130. doi: 10.1111/j.1466-8238.2012.00795.x
Savage, V. M., Gillooly, J. F., Brown, J. H., West, G. B., and Charnov, E. L. (2004). Effects of body size and temperature on population growth. Am. Nat. 163, 429–441. doi: 10.1086/381872
Schemske, D. W., Mittelbach, G. G., Cornell, H. V., Sobel, J. M., and Roy, K. (2009). Is there a latitudinal gradient in the importance of biotic interactions? Annu. Rev. Ecol. Evol. Syst. 40, 245–269. doi: 10.1146/annurev.ecolsys.39.110707.173430
Sentis, A., Binzer, A., and Boukal, D. S. (2017a). Temperature-size responses alter food chain persistence across environmental gradients. Ecol. Lett. 20, 852–862. doi: 10.1111/ele.12779
Sentis, A., Gémard, C., Jaugeon, B., and Boukal, D. S. (2017b). Predator diversity and environmental change modify the strengths of trophic and nontrophic interactions. Global Change Biol. 23, 2629–2640. doi: 10.1111/gcb.13560
Sentis, A., Hemptinne, J. L., and Brodeur, J. (2014). Towards a mechanistic understanding of temperature and enrichment effects on species interaction strength, omnivory and food-web structure. Ecol. Lett. 17, 785–793. doi: 10.1111/ele.12281
Shurin, J. B., Clasen, J. L., Greig, H. S., Kratina, P., and Thompson, P. L. (2012). Warming shifts top-down and bottom-up control of pond food web structure and function. Philos. Trans. R. Soc. B Biol. Sci. 367, 3008–3017. doi: 10.1098/rstb.2012.0243
Sterner, R. W., and Elser, J. J. (2002). Ecological Stoichiometry: The Biology of Elements From Molecules to the Biosphere. Princeton University Press.
Vasseur, D. A., and McCann, K. S. (2005). A mechanistic approach for modeling temperature-dependent consumer-resource dynamics. Am. Nat. 166, 184–198. doi: 10.1086/431285
Voigt, W., Perner, J., Davis, A. J., Eggers, T., Schumacher, J., Bährmann, R., et al. (2003). Trophic levels are differentially sensitive to climate. Ecology 84, 2444–2453. doi: 10.1890/02-0266
Vucic-Pestic, O., Ehnes, R. B., Rall, B. C., and Brose, U. (2011). Warming up the system: higher predator feeding rates but lower energetic efficiencies. Glob Change Biol. 17, 1301–1310. doi: 10.1111/j.1365-2486.2010.02329.x
Wootton, J. T., and Emmerson, M. (2005). Measurement of interaction strength in nature. Annu. Rev. Ecol. Evol. Syst. 36, 419–444. doi: 10.1146/annurev.ecolsys.36.091704.175535
Yodzis, P., and Innes, S. (1992). Body size and consumer-resource dynamics. Am. Nat. 139, 1151–1175. doi: 10.1086/285380
Yvon-Durocher, G., and Allen, A. P. (2012). Linking community size structure and ecosystem functioning using metabolic theory. Philos. Trans. R Soc. Lond. B Biol. Sci. 367, 2998–3007. doi: 10.1098/rstb.2012.0246
Keywords: consumer-resource, interaction strength, temperature, metabolic theory, body mass, temperature-size rule
Citation: Bideault A, Loreau M and Gravel D (2019) Temperature Modifies Consumer-Resource Interaction Strength Through Its Effects on Biological Rates and Body Mass. Front. Ecol. Evol. 7:45. doi: 10.3389/fevo.2019.00045
Received: 31 August 2018; Accepted: 06 February 2019;
Published: 25 February 2019.
Edited by:
Angelica L. Gonzalez, Rutgers The State University of New Jersey, United StatesReviewed by:
Matthew Miles Osmond, University of California, Davis, United StatesCelia C. Symons, University of California, Santa Cruz, United States
Copyright © 2019 Bideault, Loreau and Gravel. This is an open-access article distributed under the terms of the Creative Commons Attribution License (CC BY). The use, distribution or reproduction in other forums is permitted, provided the original author(s) and the copyright owner(s) are credited and that the original publication in this journal is cited, in accordance with accepted academic practice. No use, distribution or reproduction is permitted which does not comply with these terms.
*Correspondence: Azenor Bideault, azenor.bideault@usherbrooke.ca