Evaluation of the Sustainable Development of the Social-Economic-Natural Compound Ecosystem in the Guangdong-Hong Kong-Macao Greater Bay Area Urban Agglomeration (China): Based on Complex Network Analysis
 Zhijun Feng
 Zinan Chen1,2
  Hechang Cai
 Zaoli Yang
- 1School of Economic and Management, Dongguan University of Technology, Dongguan, China
- 2Faculty of Management and Economics, Kunming University of Science and Technology, Kunming, China
- 3College of Economics and Management, Nanjing University of Aeronautics and Astronautics, Nanjing, China
- 4College of Economics and Management, Beijing University of Technology, Beijing, China
In the Guangdong-Hong Kong-Macao Greater Bay Area (GBA), a series of natural environmental, economic, and social issues have emerged sequentially in the process of rapid economic and social development. Therefore, for the sustainable development of the GBA, how to closely integrate nature protection with economic and social development to improve the sustainable development level of the social-economic-natural compound ecosystem, and realize the coordinated development of the system is particularly important. Based on the perspective of complex network and the theory of compound ecosystem, this study proposes a set of sustainable development evaluation model based on complex network modeling to evaluate the sustainable development level of compound ecosystem in GBA from 2014 to 2018, and further analyze the coupling coordination degree. The major findings include: 1) For the sustainable development in the GBA, the development of the natural subsystem is an important foundation, and the synchronous development of the social and economic subsystems are the main driving force. 2) The sustainable development level in the GBA shows an overall steady upward trend; the average level of the compound ecosystem’s coupling coordination development is in a “good” state, and it shows an evident upward trend. 3) Whether it is within the GBA or the GBA and its surrounding regions, there are problems of unbalanced and insufficient regional development. Policy recommendations include increasing the emphasis on the sustainable development of the natural subsystem, promoting the coordinated development of the economic, social, and natural subsystems, and promoting the balanced development of cities within the GBA, as well as the GBA and surrounding regions.
1 Introduction
Sustainable development has become global issue. In 2015, the United Nations Sustainable Development Summit officially adopted “Transforming our World: The 2030 Agenda for Sustainable Development”, establishing a global sustainable development goal system (The United Nations Sustainable Development Summit, 2015). As the core area of the world’s population concentration and an important entity for sustainable economic, social, and environmental development, the issue of urban development is more complex (Uchiyama and Mori, 2017). China is paying increasing attention to the sustainable development of cities, and the government has adopted multiple strategies and new urbanization models to promote the healthy and sustainable development of cities (Bai et al., 2014). In December 2016, the State Council issued “China’s implementation of the 2030 Agenda for Sustainable Development Innovative Demonstration Zone Construction Plan” to promote sustainable urban development. With the development of economic globalization and urbanization, competition between cities has begun to shift from single cities to urban agglomerations (Fang and Yu, 2017). Urban agglomerations have become the most dynamic and potential areas in the economic development of all countries in the world, and are at the core strategic position in the country’s sustainable development (Tan, 2016). However, in the process of rapid development, most urban agglomerations have over-emphasized economic development and pursued short-term benefits; consequently, they are generally faced with environmental pollution (Liang et al., 2019), resource shortages (Guo et al., 2020; Prabha et al., 2020), greenhouse effects (Han et al., 2018; Song et al., 2019), and other issues, which bring many unstable factors to their sustainable development.
The Guangdong-Hong Kong-Macao Greater Bay Area (GBA) is the fourth largest bay area in the world after the New York Bay Area, the San Francisco Bay Area, and the Tokyo Bay Area. It is also a world-class urban agglomeration of China’s national strategic significance and an important space carrier to participate in global competition. In 2019, the “Outline Development Plan for the Guangdong-Hong Kong-Macao Greater Bay Area” was released. The outline proposes adherence to the basic principles of “green development and ecological protection” to provide residents with a good ecological environment and promote the sustainable development of the GBA. However, with rapid population growth and economic development, the GBA is facing increasing social and environmental pressures. In particular, the nine cities in Guangdong Province (i.e., the Pearl River Delta) in the GBA are the first areas in Chinese mainland to open to the outside world. They experienced urban population gathering and rapid expansion of construction land, which caused a series of resource and environmental problems (He and Li, 2020). Therefore, what is the current level of sustainable development of the social-economic-natural compound ecosystem in the GBA? How is the coupling coordination degree between the three subsystems of economy, society, and nature? How does the development level compare with surrounding regions, such as the East, the West, and the Mountainous Regions in Guangdong Province? These are important issues to be considered for the sustainable development of the GBA. The most appropriate development path can be formulated according to local conditions, only by further understanding the weaknesses of the GBA’s sustainable development. Therefore, it is necessary to scientifically evaluate and analyze the sustainable development level of the social-economic-natural compound ecosystem in the GBA. Based on the perspective of complex network and the theory of social-economic-natural compound ecosystem, this study proposes a set of sustainable development evaluation model based on complex network modeling. The key of the model is to use the evaluation of the importance of complex network nodes and the TOPSIS method to determine the index weight. Then, it uses the model to evaluate the sustainable development level of the social-economic-natural compound ecosystem in the GBA from 2014 to 2018, and further analyze the coupling coordination degree of the compound ecosystem. This study further explores the application of complex network method in sustainable development evaluation, and the research results provide a scientific basis and reference for the sustainable development management decisions in the GBA.
The main contributions of this study are as follows. First, based on the perspective of complex network and the theory of compound ecosystem, this study proposes a set of sustainable development evaluation model based on complex network modeling to evaluate the sustainable development level of compound ecosystem in GBA. The key of this model is to use the evaluation of the importance of complex network nodes and the TOPSIS method to determine the index weight. This model not only avoids the subjective error caused by qualitative analysis method to determine the weight to a certain extent, obtain more objective, accurate and reasonable results, but also explores the application of complex network method in sustainable development evaluation.
2 Literature Review
Ma and Wang (1984) first stated the view that a compound ecosystem is composed of society, economy, and nature systems; these systems have mutually causal constraints and complementary relationships. Modern city is a social-economic-natural compound ecosystem. In this complex system, the natural system supports human economic and social development through different forms of natural capital and ecosystem services. The economic value and social well-being created by human society also have certain positive and negative effects on the natural system (Wang et al., 2016). Many scholars have explored the factors affecting environmental sustainability. It is found that energy development (Khan et al., 2022), financial development (Tang et al., 2022), information and communication technology (Zhang et al., 2022), education (Zafar et al., 2020), and many other factors will affect the sustainable development of the natural environment. For sustainable urban development, it pursues the high harmony of social prosperity, economic development, a beautiful environment, and the full integration of technology and nature (Zhang et al., 2005). Sustainable urban development can only be ensured by clarifying the complex interactions between social, economic, and environmental factors, and planning and management according to ecological principles (Wang et al., 2011). Therefore, the issue of sustainable urban development is not only for a specific aspect, but mainly focuses on the balanced development of social progress, economic growth, ecological construction, and environmental protection (Sun et al., 2017).
In recent years, scholars have studied sustainable urban development from the perspective of compound ecosystems. Based on energy theory, Wang et al. (2016) proposed a method to measure the regional sustainability of the Yellow River Delta based on a social-economic-natural ecosystem, and analyzed the sustainability of Dongying in 2009. Sun et al. (2017) evaluated the sustainable development level of 277 cities in China based on the economic-social-natural ecosystem. The results show that to achieve sustainable development, attention must be paid to the synchronous and balanced development of economic, social, and ecological infrastructures. Sara et al. (2018) constructed an index system from three aspects of environment, society and economy, and proposed a comprehensive multi-standard method tool to evaluate the sustainability of Spanish cities. Feleki et al. (2018) proposed a set of suitable indexes from the three systems of environment, society, and economy and conducted sustainability evaluations on European cities. Starting from the three pillars of sustainability (social, economic, and environmental), Rama et al. (2020) evaluated the sustainable development level of 31 representative Spanish cities through multiple sustainability indexes. Based on the analysis of the social-economic-natural compound ecosystem, Tai et al. (2020) constructed a coal mine city vulnerability evaluation index system, and evaluated the vulnerability of coal mine cities that produced more than 10 million tons of coal in 2015. Peng and Deng (2020) took Guiyang as the study object, and calculated sustainable development based on relative carrying capacities of natural, economic, environmental, and social resources from 2003 to 2017.
With the acceleration of urbanization, urban agglomeration has gradually become an important development model, and more and more scholars have studied the sustainable development of a certain region or urban agglomeration (Tan et al., 202; Zinatizadeh et al., 2017), mainly focusing on China’s Yangtze River Delta urban agglomeration (Huang et al., 2020), Beijing-Tianjin-Hebei urban agglomeration (Chen et al., 2019), Chengdu-Chongqing urban agglomeration (Cheng et al., 2020), the Yangtze River urban agglomeration (Gu et al., 2015; Luo et al., 2021), etc. In addition, in recent years, research on the sustainable development of foreign urban agglomerations has gradually emerged (Butsch et al., 2017). Rahayu et al. (2018) discussed the strategic challenges in development planning for Denpasar City and the coastal urban agglomeration of Sarbagita. Karima et al. (2020) used DEA model to conduct double decoupling analysis on the environmental performance of urban agglomerations, and evaluated the urban agglomerations with the best performance in urban sustainability.
Since research on sustainable development issues must consider the development background and actual conditions of the specific study area, different evaluation methods have also been applied to different backgrounds and different purposes (Zhang et al., 2021b; Swain and Ranganathan, 2021). The main methods in the field of sustainable development evaluation include the AHP (Choi and Koo, 2017; Ye, 2019; Irfan et al., 2022), the full permutation polygon synthetic indicator method (Pan et al., 2019), entropy method (Ding et al., 2019; Tai et al., 2020), and ecological footprint method (Liu and Yang, 2020; Luo and Wang, 2020). Among them, the AHP belongs to the subjective evaluation method, and personal subjective factors of the experts have a certain influence on the scientificity of evaluation results. the full permutation polygon synthetic indicator method is simple to calculate, but it cannot reflect the contribution rate of each index to the comprehensive evaluation result. The entropy method is an objective evaluation method; although it can effectively avoid the deviation of human factors, to some extent, it ignores the importance of the index itself. The ecological footprint method is difficult to fully reflect the sustainability status of the system. It is mainly applicable to global- and national-level assessments, and it is difficult to promote to a small regional scope (Sun and Ma, 2018). Therefore, exploring new sustainable development evaluation methods is an important direction to promote and enrich the field of sustainable development. A complex network is defined as a dynamic evolution system with an irregular structure, which provides an intuitive and effective method for describing the structure of complex system. It is easy to construct and can also clearly reflect the internal relationships of the complex system (Nazempour et al., 2018). Considering the shortcoming of traditional methods in single and one-sided analysis of the evaluation object, the complex network analysis uses the statistical characteristics of nodes to construct a complex multi-factor evaluation index system that conforms to actual research, and then use evaluation index as nodes to study the evaluation objects in a complex network structure diagram (Zhang et al., 2018; Xue et al., 2020). Some scholars have introduced complex networks to explain the interrelationships of the social-economic-environmental system of resource-based cities on multiple scales, and to analyze the sustainable development mechanism of complex urban systems (Jing and Wang, 2020).
Based on the above related research (Table 1 lists these studies), this study mainly expands on the following aspects. First, in terms of research objects, existing studies on the sustainable development of urban agglomerations in China mainly focus on the Beijing-Tianjin-Hebei urban agglomeration and the Yangtze River Delta urban agglomeration, etc., but few studies have analyzed the sustainable development in the GBA. The construction of the GBA is a major national development strategy. The “Outline Development Plan for the Guangdong-Hong Kong-Macao Greater Bay Area” clearly states that the development in the GBA should follow the basic principle of “green development and ecological protection”. Therefore, based on this basic principle, this study selects the GBA with one country, two systems, three separate customs territories as the research object, and to study its sustainable development. Second, in terms of research content, on the one hand, most research focuses on the evaluation of the overall level of urban sustainable development, ignoring the essence of the city as a social-economic-natural compound ecosystem, and failing to explore the coordinated development degree among subsystems. On the other hand, most of the existing research data are annual cross-sectional data, making it difficult to reveal the long-term dynamic variation rule of the research object’s sustainable development. Based on the dynamic perspective, this study selects panel data to examine the sustainable development level in the GBA urban agglomeration, and to deeply analyze its coupling coordination development. Third, in terms of research methods, different from traditional evaluation methods, this study begins with the interrelationship between the evaluation indexes, proposes a set of sustainable development evaluation model based on complex network modeling. The key of the model is to use the evaluation of the importance of complex network nodes and the TOPSIS method to determine the index weight. This model not only avoids the subjective error caused by qualitative analysis method to determine the weight to a certain extent, obtain more objective, accurate and reasonable results, but also explores the application of complex network method in sustainable development evaluation.
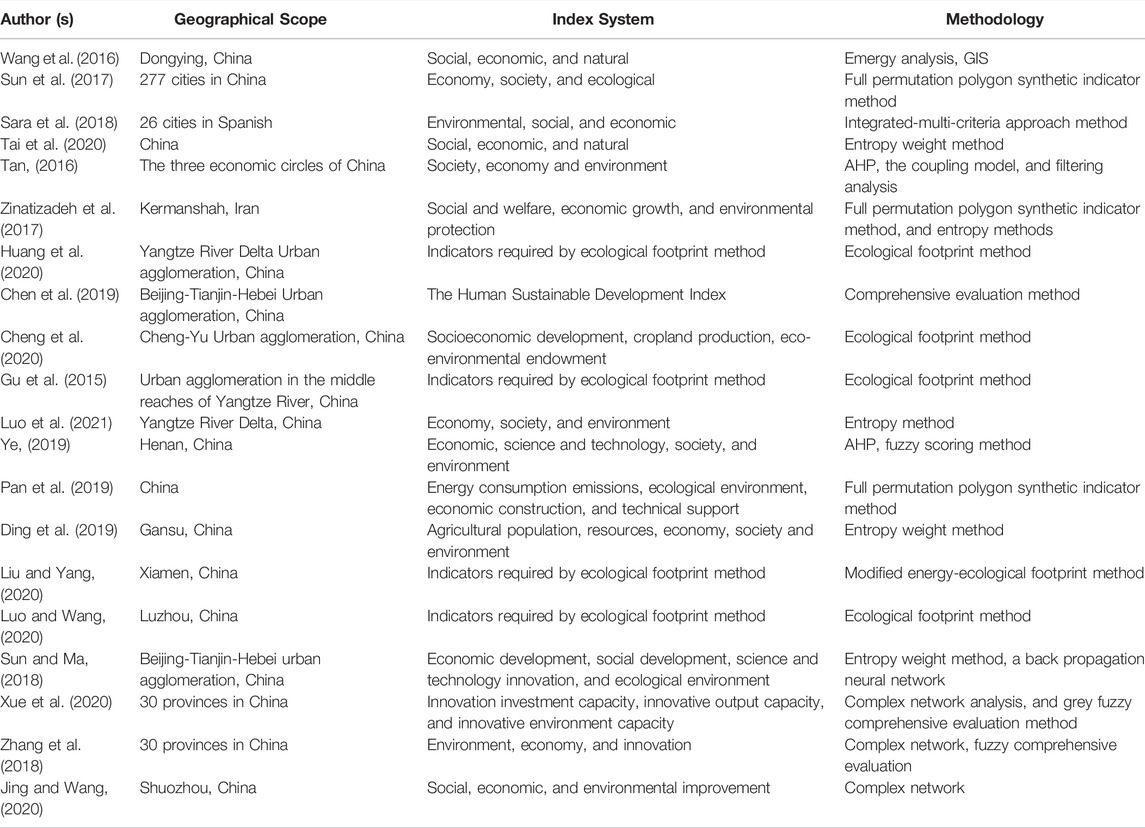
TABLE 1. Overview of relevant studies.
3 Study Area and Data Source
3.1 Study Area
The GBA is an urban agglomeration composed of nine cities in the Pearl River Delta, including Guangzhou, Shenzhen, Zhuhai, Foshan, Huizhou, Dongguan, Zhongshan, Jiangmen, and Zhaoqing, and the special administrative regions of Hong Kong and Macao. In February 2019, the Central Committee of the Communist Party of China and the State Council issued the “Outline Development Plan for the Guangdong-Hong Kong-Macao Greater Bay Area.” This outline referred to the development of a “vibrant world-class urban agglomeration” as one of its strategic positioning and proposed building a beautiful bay area with ecological security, beautiful environment, social stability, and cultural prosperity. However, according to the strategic positioning of a world-class urban agglomeration and the development vision of building a beautiful bay area, the GBA faces many economic, social, and natural environmental issues during the rapid urbanization process, which poses major challenges to sustainable development. In this study, we consider the GBA cities and the other Guangdong cities around the GBA that have strong social-economic relations with it. Therefore, the spatial scope of this study includes the GBA, the East Region (Chaozhou, Shantou, Jieyang, Shanwei), the West Region (Zhanjiang, Maoming, Yangjiang), and the Mountainous Region (Shaoguan, Qingyuan, Heyuan, Meizhou, Yunfu); a total of 23 cities at or above the prefecture level (see Figure 1), that is, the “21 + 2” pattern of “one province and two special administrative regions” in Guangdong province plus Hong Kong and Macao special administrative regions.
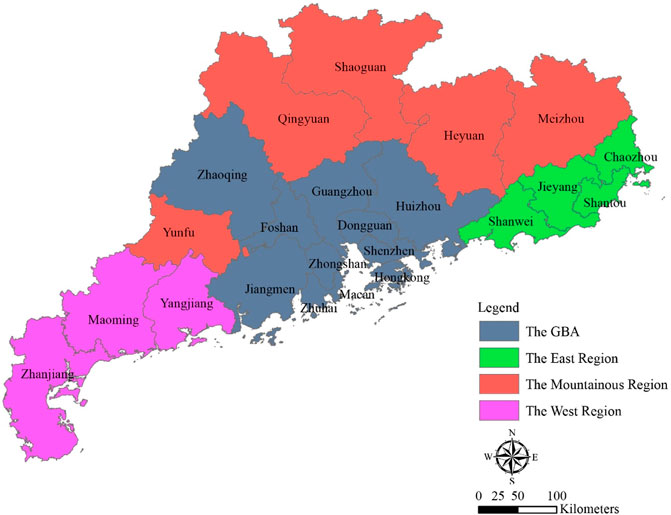
FIGURE 1. Cities of and around the GBA.
3.2 Data Source
In this study, a total of 23 cities in the GBA and the East, West, and Mountainous regions of Guangdong Province are selected as research objects. The data on the index system of sustainable development of the social-economic-natural compound ecosystem are collected, and the sample span was from 2014 to 2018. Specific indexes are based on data from the “Statistical yearbook of Guangdong,” “Hong Kong Annual Digest of Statistics,” “Macao statistical yearbook,” and “China City Statistical Yearbook.” Part of the data comes from the relevant yearbooks and environmental bulletins of 21 cities in Guangdong Province issued by the National Bureau of Statistics, and relevant survey data published on official websites, such as the Hong Kong Census and Statistics Department and the Macao Statistics and Census Bureau. The missing data for some years was replaced using the linear trend method. This study unifies the currency units of the main economic indexes of Guangdong Province, Hong Kong, and Macao, and uses the annual average exchange rate for conversion. The exchange rate uses the official average exchange rate of the Hong Kong dollar and Macao Pataca to RMB for that year.
4 Evaluation Index System and Methods
4.1 Evaluation Index System
Establishing an appropriate index system is the premise and important basis for the scientific evaluation of the sustainable development of a compound ecosystem. At present, there are different standards for the construction of sustainable development evaluation index system in different countries and regions. The comprehensive index system for sustainable development established by the US Environmental Protection Agency covers 12 categories, including economy, education, environment, government, and health (Hart, 1999). The urban sustainability index jointly launched by United Kingdom’s National Bureau of Statistics and Department for Environment Food and Rural Affairs include the four major indexes of sustainable production and consumption, climate change and energy, natural resources and environmental protection, and sustainable development of communities and the world equality (Department for Environment Food and Rural Affairs. 2009). The index system of sustainable development proposed by China’s National Bureau of Statistics and Management Centre of Agendum in the 21st Century includes six major systems: economy, society, environment, resources, population and science and education (Lu et al., 2003). The Sustainable Development Goals (SDGs) proposed in the 2015 United Nations Development Summit have also been widely adopted by the international community and many countries, which cover the three dimensions of economy, society and the environment, including 17 sustainable development goals and 169 items (Shao et al., 2021). In addition, due to the difference of evaluation objects, scholars at home and abroad have different opinions on the construction of evaluation index system of urban sustainable development, and there is no unified evaluation index system up to now. However, when constructing the evaluation index system of sustainable development, most existing studies almost include three important elements of social, economic and natural environment (Ding et al., 2016; Wang et al., 2016; Jing and Wang, 2020; Tai et al., 2020).
The compound ecosystem is a form of harmonious symbiosis between man and nature. It is composed of three subsystems: society, economy and nature (Jiang, 2018). Cities are the most intensive areas of human activities. Cities integrate various social, economic, environmental, and cultural factors and conflicts to form a typical social-economic-natural compound ecosystem (He and Li, 2020). From this perspective, referring to the various sustainable development evaluation standards mentioned above and the research of domestic and foreign scholars, combined with the actual situation of the GBA and the availability of index data, this study selects 21 indexes to construct the evaluation index system for the sustainable development of GBA. The specific index system is shown in Table 2. Among them, the explanation and description of each index are as follows.
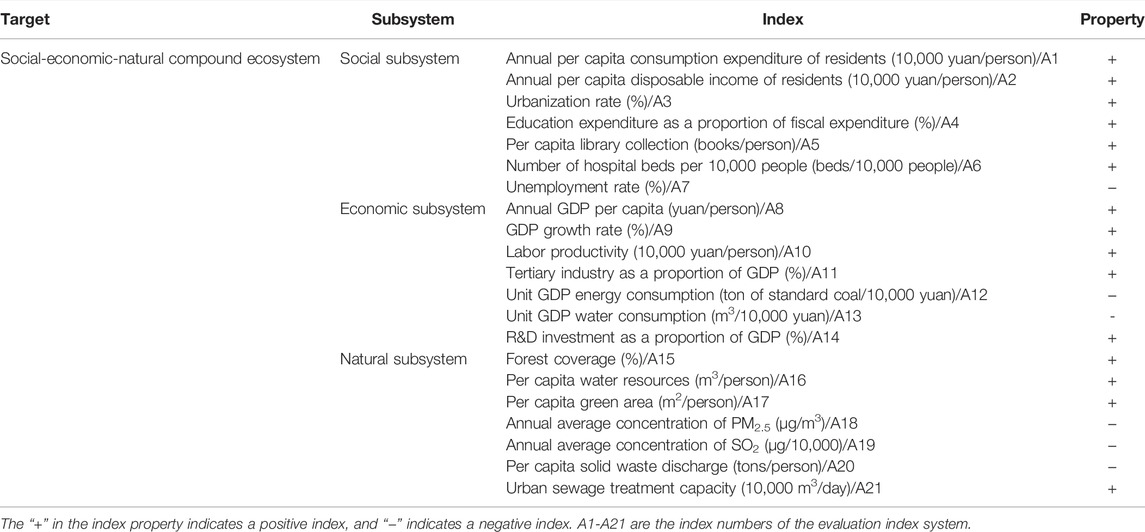
TABLE 2. Index system for sustainable development of compound ecosystem in the GBA.
For the social subsystem, the essence of sustainable social development lies in improving living standards and guarantees of people, and creating a harmonious and stable social environment. A1 and A2 reflect living standards. The higher the consumption expenditure and disposable income, the higher the living standard of residents will be. A3 reflects the urbanization level of a city, and the growth of the urbanization level will promote the further development of society. A4 and A5 reflect the city’s emphasis on education and culture. A6 and A7 reflect a city’s current health and employment situation.
For the economic subsystem, sustainable economic development must consider the level of economic development and the rationality of the economic development structure. A8 and A9, as important economic development evaluation indexes, reflect the “quantity” and “speed” of urban economic development. A10 refers to the ratio of GDP to the total employed population, reflecting the overall economic development strength of a city. A11 reflects the modern level of industrial structure. A12 and A13 reflect the consumption of energy and water resources in urban economic activities. A14 reflects a city’s emphasis on scientific research.
The natural subsystem mainly involves two aspects: natural resource endowment and environmental pollution. A15 and A16 reflect the forest resources and water resources of a city. Due to differences in the statistical calibers of cities in Guangdong Province, Hong Kong and Macau, Hong Kong’s and Macao’s forest coverage rate are replaced by the ratio of the forest area to land area and ratio of green area to land area, respectively. A17 shows the greening coverage within urban areas. A18 and A19 reflect the air quality. A20 and A21 reflect urban solid waste discharge and sewage treatment capacity.
4.2 Evaluation Model
4.2.1 Constructing Complex Network of Index System
A complex network is a unified whole that contains multiple nodes. In this study, each node represents an index in the index system, and there are complex correlations between these nodes. The complex network of the index system is constructed through the following steps (Wang et al., 2017).
Step 1. By using the index data of 23 cities from 2014 to 2018, the Pearson correlation coefficient among indexes is calculated to form the correlation coefficient matrix. A significant correlation test was conducted at a confidence level of 0.05 to obtain the corresponding significant p-value among the indexes.
Step 2. Defining the complex network as
where
where
Step 3. Inputting the weighted complex network adjacency matrix and using R software to output the complex network structure diagram.
Step 4. In complex network, the importance of a node is usually described by the concept of centrality (Yang et al., 2021). Using R software to calculate the four attributes used to measure the node importance: degree centrality (
4.2.2 Calculation of the Index Weight based on the Node Importance
The TOPSIS comprehensive evaluation method was used to calculate the node importance (Du et al., 2014; Hu et al., 2016). It is more comprehensive to determine the importance of a node by integrating multiple node attributes than analyzing the importance of a node based on a single attribute, and the determination of index weight is more accurate and reliable.
Step 1. Constructing a decision matrix X with N rows and m columns:
where N is the number of nodes in the above complex network,
Step 2. Normalizing the matrix X and marking the normalized matrix as
Step 3. Using the AHP method to calculate the subjective weight
Among them, 0 suggests attribute
Step 4. The objective weight (
Step 5. Combining the weights obtained by the two assignment methods, which can simultaneously reflect the different advantages of the two types of weights. According to the principle of minimum relative entropy, the combination method is used to obtain the combination weight:
Using the Lagrangian multiplier method to get the combined weight of each attribute
Step 6. Determining the positive ideal point
Step 7. Calculating the distance from each plan
Step 8. Calculating the closeness
Step 9. Calculating the index weight in the evaluation system
4.2.3 Calculation of Comprehensive Evaluation Results
Step 1. The original indexes values are used to construct the initial matrix
Step 2. Standardizing the initial matrix
Step 3. The weighted summation formula is used to calculate the comprehensive score of sustainable development
4.3 Coupling Coordination Degree Model
Step 1. The coupling degree directly reflects the coordination of multiple systems, and the specific calculation formula is as follows (Hashim et al., 2020):
Step 2. Calculating the coupling coordination degree based on the coupling degree (Li et al., 2020):
where
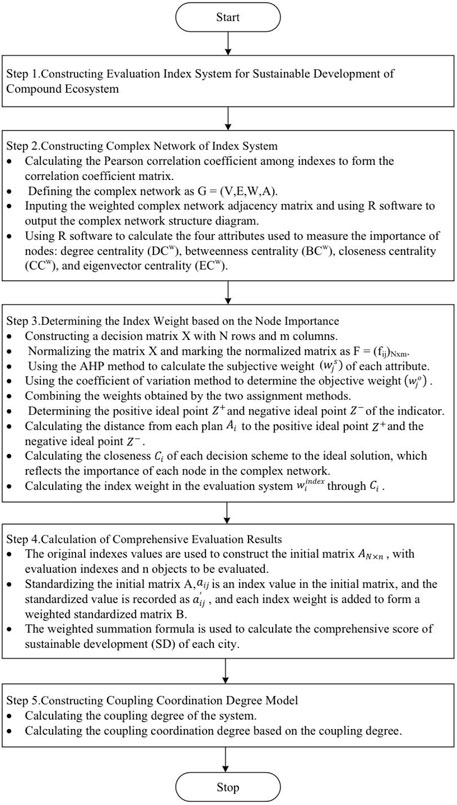
FIGURE 2. Flowchart of evaluation model.
5 Results
5.1 Index Weight Analysis
Based on the adjacency and the weighting matrices, the R software is used to draw the topological diagram of the 21 nodes (indexes) of the compound ecosystem, as shown in Figure 3 (the size of the node indicates its importance). The social, economic, and natural subsystems exhibit a very close coupling relationship. There are complex correlations between nodes, and the turbulence of any node will have an impact on the entire system. On this basis, according to formulas (3)– (17), the index weight is determined based on the node importance of each node in the compound ecosystem network. The specific index weight results are shown in Table 3.
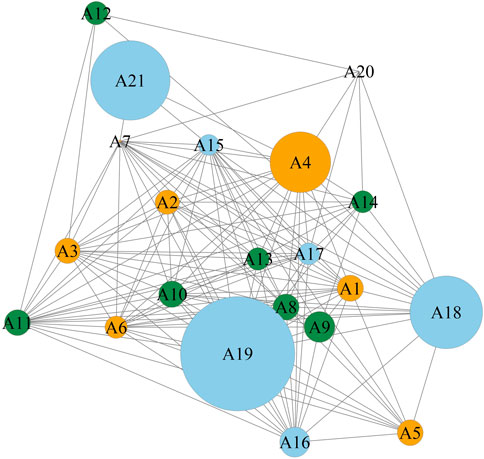
FIGURE 3. The influencing factors topological diagram of the social-economic-natural compound ecosystem in the GBA.
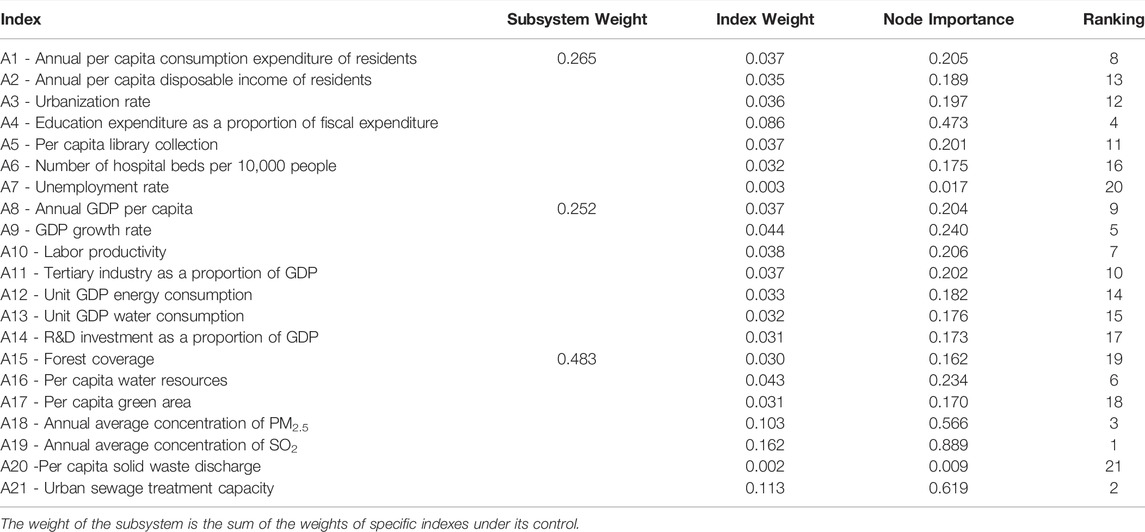
TABLE 3. Node importance and index weight.
In terms of specific indexes, except for A7 (unemployment rate) and A20 (per capita solid waste discharge), which rank the last two, the weight of most of the other indexes is between 0.03 and 0.05. The top three indexes are A19 (annual average concentration of SO2), A21 (urban sewage treatment capacity), and A18 (annual average concentration of PM2.5). The weights of these three indexes are 0.162, 0.113, and 0.103, all of which are greater than 0.1. Their weights are far exceeding other indexes, demonstrating that they have the greatest impact on the compound ecosystem. Meanwhile, these three indexes are closely related to environmental pollution, which shows it is the primary factor restricting the sustainable development of the social-economic-natural compound ecosystem in the GBA. Second, A4 (the education expenditure as a proportion of fiscal expenditure) has a weight of 0.086, which shows that the emphasis on the development of education is important for the sustainable development of the social-economic-natural compound ecosystem in the GBA. From another perspective, indexes with higher weights also have high node importance in the network and are connected with most other nodes; therefore, their change will cause a change in many other nodes in the network, which has a high impact on the compound ecosystem network.
In terms of the weight of each subsystem, the natural subsystem has the highest weight (0.483), the economic subsystem has the lowest weight (0.252), and the social subsystem’s weight (0.265) is almost the same as the economic subsystem. The natural subsystem is the most important subsystem in the social-economic-natural compound ecosystem in the GBA. However, there is still a large gap between the ecological environment quality in the GBA and the strategic goal of building a world-class bay area and urban agglomeration. High energy consumption and pollutant emissions also increase the pressure on the natural environment in the GBA. Therefore, the GBA must pay more attention to the sustainable development of the natural subsystem and promote environmental governance in depth, instead of focusing solely on economic benefits. It can also be seen from the weight of the subsystems that the economic and social subsystems are almost equally important, indicating that the sustainable development of the compound ecosystem cannot be separated from the simultaneous development of economy and society. The GBA is currently transitioning from the development of the port and industrial economy to the service and innovative economy. To achieve sustainable development, we must further emphasize scientific development, strive to achieve the simultaneous development of economic and social benefits, and accelerate the formation of a new cross-regional development pattern with simultaneous economic and social development.
5.2 Sustainable Development of the Compound Ecosystem in the GBA
Based on the weight of each index determined by the importance of each node in the compound ecosystem network, the sustainable development level of the social-economic-natural compound ecosystem (SDC), the coupling coordination degree of social-economic-natural compound ecosystem (DC), the sustainable development levels of the social subsystem (SDS), the economic subsystem (SDE), and the natural subsystems (SDN) in the GBA from 2014 to 2018 are calculated according to Eqs 18–23. Table 4 lists the mean values of each city. In addition, Figures 4–7 visually analyzes the sustainable development level and trend of the social-economic-natural compound ecosystem in the GBA.
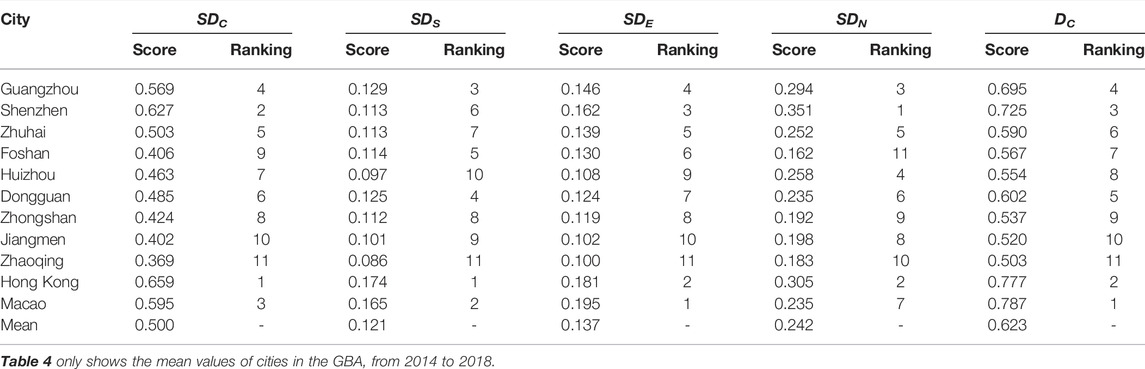
TABLE 4. Results of the sustainable development level of the compound ecosystem in the GBA.
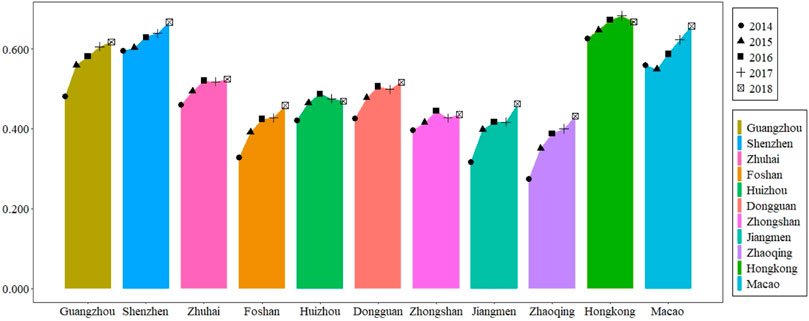
FIGURE 4. Sustainable development level of the compound ecosystem in the GBA.
5.2.1 Sustainable Development Level of the Compound Ecosystem
From the mean value of the overall SDC shown in Table 4, Hong Kong, Shenzhen, Macao, Guangzhou, and Zhuhai are the top five among the GBA urban agglomeration; the sustainable development levels of compound ecosystem are higher than the mean value of the GBA. The remaining six cities are all lower than the mean value of the GBA, of which Zhaoqing (0.369) ranks last. In addition, the sustainable development levels of Macao’s social and economic subsystems are ranked second and first in the GBA, but its comprehensive ranking is ranked third. Further analysis shows that the sustainable development level of its natural subsystem ranks seventh in the GBA, indicating a big gap and deficiency in the level of natural sustainable development of Macao. The levels of sustainable social and economic development of Shenzhen have not yet reached that of the Hong Kong and Macao. However, the sustainable development level of its natural subsystem ranks first in the GBA, indicating that Shenzhen has a solid foundation for sustainable development and will have a stronger development momentum in the future.
Figure 4 shows that the SDC in Hong Kong, Shenzhen, Macao, and Guangzhou far exceeds other cities. In terms of development trends, Hong Kong began to show a slight decline after reaching its peak in 2017, and Macao began to steadily rebound after experiencing a decline in 2015. Among the nine cities in the Pearl River Delta, except for Huizhou and Zhongshan, which showed a small decline and fluctuation, the sustainable development level of the other cities showed a gradual upward trend, among which Guangzhou, Shenzhen, Foshan, Jiangmen, and Zhaoqing showed a noticeable upward trend. In general, the SDC of cities in the GBA shows a stable and positive trend. Guangzhou and Shenzhen form the first echelon with Hong Kong and Macao and have a high level of sustainable development, but there is still a big gap between other cities and them. Therefore, there are certain problems of uneven development in the GBA.
5.2.2 Sustainable Development Level of Subsystems
According to the mean value of SDS shown in Table 4, Hong Kong, Macao, Guangzhou, and Dongguan rank as the top four in the GBA, and their sustainable development level is higher than the mean value (0.121). The remaining seven cities are all lower than the mean value, with Zhaoqing ranking the lowest (0.086). Figure 5 shows that the sustainable development level of the social subsystem in Hong Kong and Macao is much higher than that of other cities in the GBA, and they are at a high level. In terms of development trends, the SDS in Hong Kong and Macao showed a steady upward trend. Among the nine cities in the Pearl River Delta, except Guangzhou and Shenzhen, which show a distinct upward trend, most cities show a certain fluctuation or decline. Among them, the sustainable development level of Zhongshan’s social subsystem decreased significantly, but it began to increase in 2018. In general, there is still a large gap between the nine cities in the Pearl River Delta and Hong Kong and Macao in terms of the level of social sustainable development.
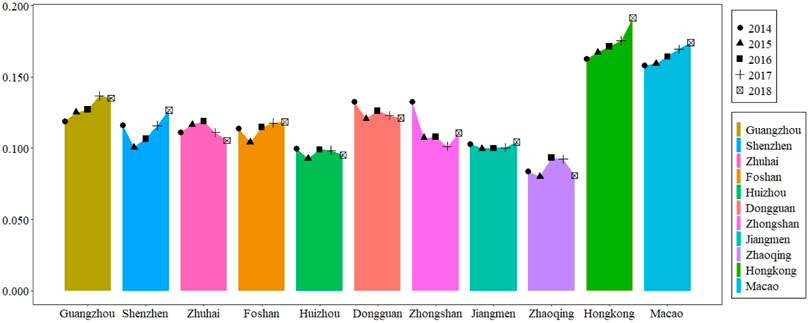
FIGURE 5. Sustainable development level of the social subsystem in the GBA.
From the mean value of the SDE shown in Table 4, it can be observed that among the GBA, Macao, Hong Kong, Shenzhen, Guangzhou, and Zhuhai are the top five, in a leading position, with their economic sustainable development level are higher than the mean value (0.137). The other six cities are all lower than the mean value, and Zhaoqing (0.100) ranks lowest. Figure 6 shows that Hong Kong, Macao, Shenzhen, and Guangzhou are at a high level, followed by Zhuhai, Foshan, Dongguan, and Zhongshan. In contrast, the SDE of Huizhou, Jiangmen, and Zhaoqing lags behind. In terms of development trends, except for Macao’s significant decline in the export of gaming and tourism services in 2015, which led to a significant decline in economic development, the sustainable development level of the other urban economic subsystem is almost in a stable state, with slight rises and falls. This indicates that the economic subsystems of cities in the GBA are relatively stable from 2014 to 2018.
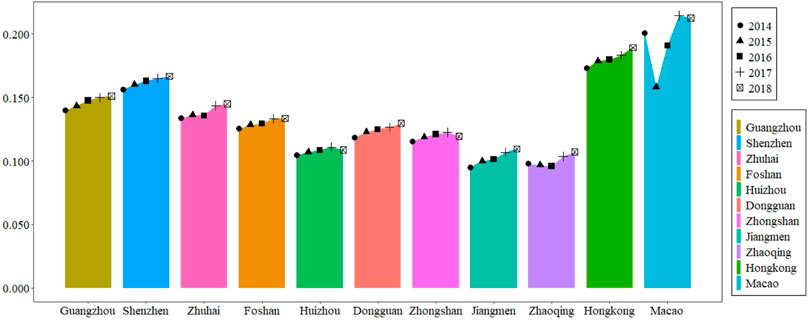
FIGURE 6. Sustainable development level of the economic subsystem in the GBA.
From the mean value of the SDN shown in Table 4, it can be observed that in the GBA, Shenzhen, Hong Kong, Guangzhou, Huizhou, and Zhuhai are the top five, which is higher than the mean value (0.242). The remaining six cities are all lower than the mean value, and Foshan (0.162) is the lowest. As shown in Figure 7, Shenzhen, Guangzhou, and Hong Kong are at a high level. In particular, the SDN in Shenzhen is much higher than that of other cities, while the SDN in Foshan, Zhongshan, Jiangmen, and Zhaoqing is relatively low. This result shows that the sustainable development level of the natural subsystem in the eastern cities in the GBA is relatively high, while the sustainable development level of western cities in the GBA is generally low. In terms of development trends, the SDN in the GBA has shown an overall upward trend, with a noticeable increase in Guangzhou, Shenzhen, Foshan, Jiangmen, and Zhaoqing. This result indicates that with the government’s emphasis on energy conservation, emission reduction, and environmental protection, the quality and environmental protection of the natural environment are constantly improving, thus improving the level of natural sustainable development.
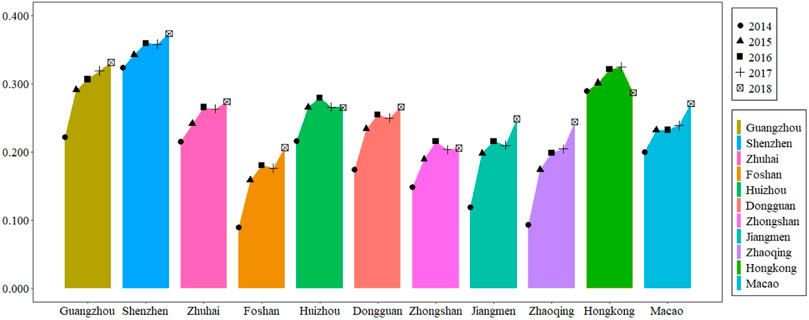
FIGURE 7. Sustainable development level of the natural subsystem in the GBA.
5.2.3 Coupling Coordination Degree of the Compound Ecosystem in the GBA
From the mean value of the DC shown in Table 4, it can be observed that among the GBA, Macao (0.787), Hong Kong (0.777), Shenzhen (0.725), Guangzhou (0.695), and Dongguan (0.602) ranks the top five, with an average coupling coordination degree between 0.6 and 0.8, which is at high-quality coupling coordination. The mean value of the coupling coordination degree of the other six cities is between 0.5 and 0.6, which is at moderate coupling coordination. In general, the mean value of the DC in the GBA is 0.623, which is at moderate coupling coordination and has not reached high-quality coupling coordination. Figure 8 reveals that the level of coupling coordination degree of Hong Kong and Macao is significantly higher than that of other cities, and is followed by Guangzhou and Shenzhen, which belong to the second echelon; there is a large gap between the other five and these four cities. In terms of development trends, the coupling coordination degree of most cities in the GBA shows a slow upward trend and is basically in a stable stage. This shows that the coupling coordination of social, economic, and natural environment in the GBA has been improving in recent years.
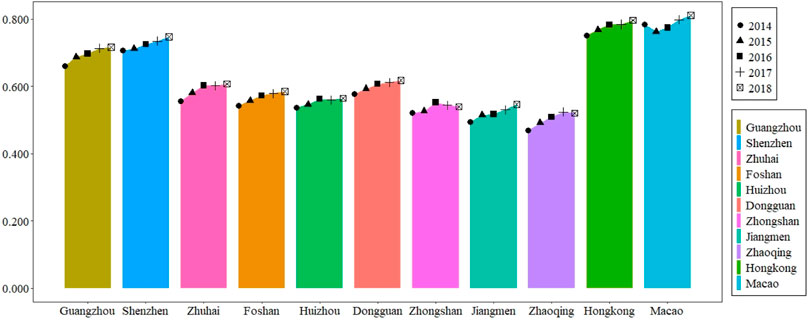
FIGURE 8. Coupling coordination degree of compound ecosystem in the GBA.
5.3 Comparison Between the GBA and Three Surrounding Regions
Table 5 lists the sustainable development of the social-economic-natural compound ecosystem in the GBA, the East, West, and Mountainous regions from 2014 to 2018.
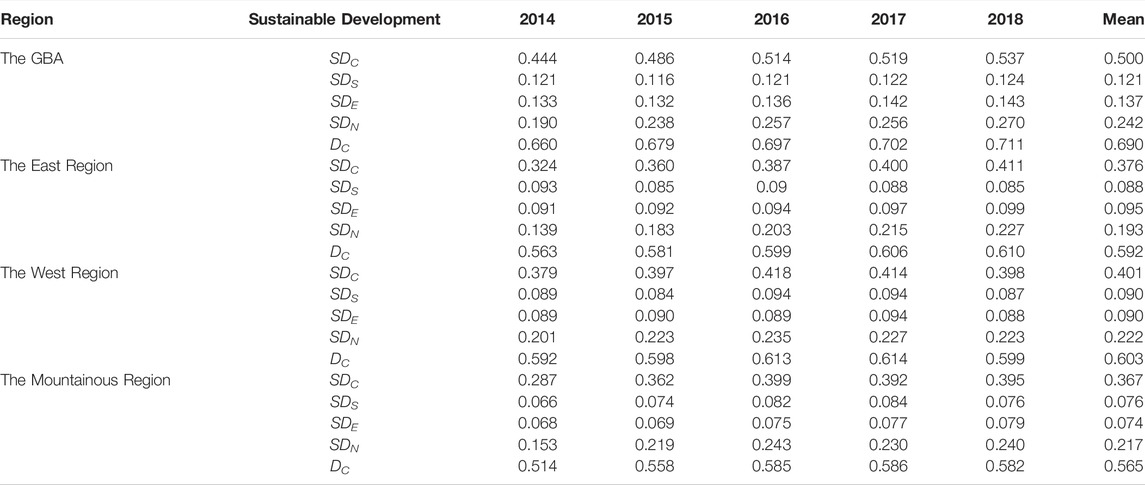
TABLE 5. Sustainable development of the compound ecosystem in the GBA and three surrounding regions.
5.3.1 Comparison of Sustainable Development Level of the Compound Ecosystem
Based on the mean value of the SDC in the four regions from 2014 to 2018 (see Table 5), the levels of the GBA, the East Region, the West Region and the Mountainous Region are 0.500, 0.376, 0.401 and 0.367, respectively. In general, the GBA has a strong performance in sustainable development and has a leading advantage over other regions. The sustainable development level with obvious advantage also lays a solid foundation for its strategic positioning of building a world-class urban agglomeration. In terms of development trends, the sustainable development level in the GBA has always been higher than that of the three surrounding regions from 2014 to 2018, which has shown an upward trend year by year. After 5 years of development in the three regions of the East, West, and Mountainous regions, the sustainable development level has gradually become the same. However, there is still a large gap between these three regions and the GBA. Although the mean value of sustainable development in the East Region is lower than that in the West Region, the trend is gradually increasing annually. Since 2016, the sustainable development level of the West Region has shown a downward trend, and it was lower than the East Region in 2018. The sustainable development level of the Mountainous Region has greatly improved from 2014 to 2018, and it was almost the same as that in the West Region in 2018. The sustainable development of the West Region shows a downward trend. The sustainable development level of the three cities in the West Region fluctuates and declines, with Zhanjiang declining the most.
5.3.2 Comparison of Sustainable Development Level of Subsystems
Based on the mean value of the SDS in the four regions from 2014 to 2018 (see Table 5), the levels of the GBA, the East Region, the West Region and the Mountainous Region are 0.121, 0.090, 0.088, and 0.07, respectively. The SDS in the GBA ranks first and far exceeds the other three regions. In terms of development trends, the GBA experienced a slight decline in 2015, and then showed a relatively stable and slow upward trend. The SDS in the East Region has shown a clear downward trend and has gradually lagged behind the West Region since 2016. The SDS in the Mountainous Region has increased significantly in the first 4 years, but there is still a certain gap with other regions.
Based on the mean value of the SDE in the four regions from 2014 to 2018 (see Table 5), the levels of the GBA, the East Region, the West Region and the Mountainous Region are 0.137, 0.095, 0.090, and 0.074, respectively. The SDE in the GBA surpasses that of the other three regions. In terms of development trends, except for small fluctuations in the West Region, the other three regions are in a relatively stable and slowly rising trend, and the GBA has the largest increase.
Based on the mean value of the SDN in the four regions from 2014 to 2018 (see Table 5), the levels of the GBA, the East Region, the West Region and the Mountainous Region are 0.242, 0.193, 0.222, and 0.217, respectively. Although the SDN in the GBA is not much higher than that of other regions, it surpassed the Western Region in 2015 and became the first, and it has always been on a steady rise. In terms of development trends, the GBA and East Region showed a relatively noticeable rise, while the West Region has declined since 2016, and fell from the first place in 2014 to the last place. Although there is a certain fluctuation in the Mountainous Region, the overall trend is increasing.
In general, the sustainable development level of the social, economic, and natural subsystems in the GBA is higher than that of the other three regions, and it is in a leading position. In particular, the sustainable development levels of the social and economic subsystems have been in the top position from 2014 to 2018, and much higher than those in other regions. In terms of development trends, the SDS, SDE, and SDN in the GBA have shown a gradually increasing trend. Among them, the SDN has risen the most, indicating that the government has attached great importance to the ecological and environmental protection of the GBA in recent years, and has achieved remarkable results in environmental pollution control and environmental quality improvement.
5.3.3 Comparison of Coupling Coordination Degree of the Compound Ecosystem
Based on the mean value of the DC in the four regions from 2014 to 2018 (see Table 5), the levels of the GBA, the East Region, the West Region and the Mountainous Region are 0.690, 0.592, 0.603, and 0.565, respectively. This result shows that the social-economic-natural compound ecosystem coupling coordination level in the GBA surpasses that of the other three regions. In addition, the DC in the GBA reached 0.711 in 2018, and the coupling coordination level approached high-quality coupling coordination. Among them, the mean value coupling coordination level in the GBA and the West Region is good (coupling coordination degree is greater than 0.600), while the remaining two regions is at a moderate coupling coordination level. In terms of development trends, the DC in the GBA and the East Region is increasing gradually but at a slow rate. The East Region has reached a good coupling coordination level since 2017, and the development trend is stable and positive. The coupling coordination level of the Western Region has transitioned from a moderate to a good level, but it has returned to a moderate level due to a certain degree of decline in 2018. The DC in the Mountainous Region has always been at a moderate level, but it shows a slow growth trend, and the gap with other regions is gradually narrowing.
6 Conclusion and Policy Recommendation
6.1 Conclusion
In order to explore issues related to the sustainable development of the social-economic-natural compound ecosystem in the GBA, this study proposes a set of sustainable development evaluation model based on complex network modeling to evaluate the sustainable development of compound ecosystem. This model not only avoids the subjective error caused by qualitative analysis method to determine the weight to a certain extent, obtain more objective, accurate and reasonable results, but also explores the application of complex network method in sustainable development evaluation. Specifically, this study uses this model to evaluate the sustainable development level of the social-economic-natural compound ecosystem in the GBA from 2014 to 2018, and analyzes the coupling coordination degree of the compound ecosystem. On this basis, we also compare and analyze the sustainable development of the compound ecosystem in the GBA and the surrounding regions (the East, West, and Mountainous regions). The main conclusions are as follows:
First, for the sustainable development in the GBA, the development of the natural subsystem is an important foundation, and the synchronous development of the social and economic subsystems are the main driving force. It was found that in the compound ecosystem, the weight of the natural subsystem is 0.483, indicating that the natural subsystem has the greatest impact on the sustainable development of the compound ecosystem, which confirms its position as an important basis for sustainable development. In addition, the weights of the social and economic subsystems are 0.265 and 0.252, respectively. The social and economic subsystems are almost as important to the compound ecosystem, suggesting that to develop a sustainable compound ecosystem, we must adhere to the concept of scientific development and promote the synchronization of the economic and social subsystems. To a certain extent, economic and social development can bring benefits, reduce environmental pollution and promote conservation.
Second, the sustainable development level in the GBA shows an overall steady upward trend. From 2014 to 2018, the sustainable development level of the natural subsystems rose significantly, and the quality of the natural environment continuously improved. Meanwhile, the development of social and economic subsystems has been relatively stable. Overall, the sustainable development level in the GBA has been improving annually, whether it was the compound ecosystem or the social, economic, and natural subsystems. In addition, the coupling coordination degree of the social-economic-natural compound ecosystem in the GBA is at a good level, and it also shows a significant upward trend (the coupling coordination degree reached a maximum value of 0.711 in 2018), transitioning from a good to a high-quality coupling coordination stage.
Third, the GBA has the problem of unbalanced and insufficient regional development. in terms of the cities in the GBA, the four cities of Guangzhou, Shenzhen, Hong Kong, and Macao have created a large gap with other cities in terms of sustainable development level or the coupling coordination degree of the compound ecosystem. Guangzhou, Shenzhen, Hong Kong, and Macao are developing at a high level, while other cities are in a disjointed state of unbalanced and inadequate development. In terms of the comparison between GBA and the surrounding regions, the sustainable development level in the GBA is significantly better than the East, West, and Mountainous regions, and the problem of insufficient development between regions is severe. The gap between the GBA and the other three regions continues to widen in terms of development trends.
6.2 Policy Recommendation
Based on the above conclusion, this study draws the following policy recommendations.
First, the government should strengthen ecological and environmental protection in the GBA and further enhance the sustainable development level of the natural subsystem. The construction of the GBA should give priority to the sustainable development of the natural subsystem, and consolidate an important foundation of sustainable social and economic development. On the one hand, it should implement the most stringent environmental protection system, fight for air, water, and soil pollution prevention; strengthen ecological protection and restoration, and achieve sustainable development of green cycles. On the other hand, Guangdong, Hong Kong, and Macao should carry out more in cross-regional environmental governance, and confirm a legislation to jointly promote the improvement of the ecological environment in the GBA.
Second, further promoting the coordinated development of the economic, social, and natural subsystems of the GBA, and pushing forward the compound ecosystem to move towards a stage of high-quality coupling coordination. Above all, referring to the development experience of the world-class bay area, the GBA should rely on technological innovation to drive the social and economic development to achieve sustainable social and economic development. Specifically, it should proceed from two aspects: consolidating the talent base for innovative development and increasing the investment in R&D. Then, while ensuring the improvement of the economic development level, government should pay attention to people’s livelihood and welfare, continuously improve people’s living standards, and resolve inequalities in people’s livelihood security and social governance. Finally, the relationship between economic and social development and ecological and environmental protection should be properly handled; government should play an active role in promoting green transformation of economic and social development in an all-round way. It is necessary to set high standards to force the green transformation of the industry and promote green and low-carbon development, but also to carry out in-depth energy-saving, emission-reduction, and carbon-reduction actions for all citizens to form a common sense of green development and ecological protection.
Third, promoting the balanced development of cities in the GBA, as well as the GBA and surrounding regions. On the one hand, within the GBA, the development gap between other cities and the four cities of Guangzhou, Shenzhen, Hong Kong, and Macao must be narrowed. The efforts to accelerate cracking the institutional barriers in Guangdong, Hong Kong, and Macao, optimizing the allocation of resource elements and the spatial layout of productivity, promoting the complementary advantages and orderly division of labor between cities, and sharing various production resource elements are essential in narrowing the development gap between cities. On the other hand, for the East, West, and Mountainous regions in Guangdong Province surrounding the GBA, the development gap with the GBA should be narrowed. This can be achieved by implementing a precise differentiation strategy, emphasizing the division of functions and industries, giving the ecological environment a clear priority, and promoting the green development and revitalization of the East, West, and Mountainous regions. We should focus on building the coastal industries in the East and West regions, linking with the coastal areas of the Pearl River Delta to form a coastal economic belt. The Mountainous Region will be an ecological development zone, guided by ecological priority and green development, to achieve high-quality development in high-level protection.
However, there are some limitations in this study. First, as the research object is the GBA, due to the limitations of data acquisition, the selected evaluation indexes are not comprehensive, resulting in the evaluation index system fails to fully reflect the sustainable development of the compound ecosystem, which affects the evaluation results to a certain extent. Second, the research period of this paper is relatively short, and only 5 years’ data are selected. In future, a longer period can be selected to better reflect the sustainable development of the social-economic-natural compound ecosystem in the GBA.
Data Availability Statement
The raw data supporting the conclusion of this article will be made available by the authors, without undue reservation.
Author Contributions
All authors listed have made a substantial, direct, and intellectual contribution to the work and approved it for publication.
Funding
This work was supported by the Ministry of education of Humanities and Social Science project (No. 21YJC630022), Young Innovative Research Team of Dongguan University of Technology (No. TDQN2019013), Quality and Brand Development Research Center in Dongguan University of Technology (No. GB200101), Key Laboratory of Science and Finance of Dongguan University of Technology (No. KCYXM2019001), Guangdong University Innovation Team Project (No. 2019WTSCX080). Construction of Characteristic disciplines of Dongguan University of Technology (No. 2061008014), and Guangdong Philosophy and Social Science Project (No. GD20CYJ35).
Conflict of Interest
The authors declare that the research was conducted in the absence of any commercial or financial relationships that could be construed as a potential conflict of interest.
Publisher’s Note
All claims expressed in this article are solely those of the authors and do not necessarily represent those of their affiliated organizations, or those of the publisher, the editors and the reviewers. Any product that may be evaluated in this article, or claim that may be made by its manufacturer, is not guaranteed or endorsed by the publisher.
References
Bai, X., Shi, P., and Liu, Y. (2014). Society: Realizing China's Urban Dream. Nature 509, 158–160. doi:10.1038/509158a
Bali Swain, R., and Ranganathan, S. (2021). Modeling Interlinkages between Sustainable Development Goals Using Network Analysis. World Dev. 138, 105136. doi:10.1016/j.worlddev.2020.105136
Butsch, C., Kumar, S., Wagner, P., Kroll, M., Kantakumar, L., Bharucha, E., et al. (2017). Growing 'Smart'? Urbanization Processes in the Pune Urban Agglomeration. Sustainability 9 (12), 2335. doi:10.3390/su9122335
Chen, S., Huang, Q., Liu, Z., Meng, S., Yin, D., Zhu, L., et al. (2019). Assessing the Regional Sustainability of the Beijing-Tianjin-Hebei Urban Agglomeration from 2000 to 2015 Using the Human Sustainable Development Index. Sustainability 11 (11), 3160. doi:10.3390/su11113160
Cheng, C., Liu, Y., Liu, Y., Yang, R., and Chen, Y. (2020). Cropland Use Sustainability in Cheng–Yu Urban Agglomeration, China: Evaluation Framework, Driving Factors and Development Paths. J. Clean. Prod. 256, 120692. doi:10.1016/j.jclepro.2020.120692
Choi, S.-H., and Koo, B.-H. (2017). A Study on the Development of Eco-Cultural City Evaluation Indicator Using AHP (Analytic Hierarchy Process). J. Korean Soc. Environ. Restor. Technol. 20 (6).
Department for Environment Food and Rural Affairs (2009). Sustainable Development Indicators in Your Pocket. London: Department for Environment Food and Rural Affairs.
Ding, L., Shao, Z., Zhang, H., Xu, C., and Wu, D. (2016). A Comprehensive Evaluation of Urban Sustainable Development in China Based on the TOPSIS-Entropy Method. Sustainability 8 (8), 746. doi:10.3390/su8080746
Ding, W., Liu, X., Geng, Y., Chen, H., and He, L. (2019). Evaluation of Agricultural Sustainable Development and Analysis of Coordination in Gansu Province. Chin. J. Agric. Resour. Regional Plan. 40 (3), 61129–61169.
Du, Y., Gao, C., Hu, Y., Mahadevan, S., and Deng, Y. (2014). A New Method of Identifying Influential Nodes in Complex Networks Based on TOPSIS. Phys. A Stat. Mech. its Appl. 399, 57–69. doi:10.1016/j.physa.2013.12.031
Fang, C., and Yu, D. (2017). Urban Agglomeration: An Evolving Concept of an Emerging Phenomenon. Landsc. Urban Plan. 162, 126–136. doi:10.1016/j.landurbplan.2017.02.014
Feleki, E., Vlachokostas, C., and Moussiopoulos, N. (2018). Characterisation of Sustainability in Urban Areas: An Analysis of Assessment Tools with Emphasis on European Cities. Sustain. Cities Soc. 43, 563–577. doi:10.1016/j.scs.2018.08.025
Gu, Q., Wang, H., Zheng, Y., Zhu, J., and Li, X. (2015). Ecological Footprint Analysis for Urban Agglomeration Sustainability in the Middle Stream of the Yangtze River. Ecol. Model. 318, 86–99. doi:10.1016/j.ecolmodel.2015.07.022
Guo, S., Wang, Y., Wang, Y., Wang, M., He, P., and Feng, L. (2020). Inequality and Collaboration in North China Urban Agglomeration: Evidence from Embodied Cultivated Land in Jing-Jin-Ji's Interregional Trade. J. Environ. Manag. 275, 111050. doi:10.1016/j.jenvman.2020.111050
Han, F., Xie, R., Lu, Y., Fang, J., and Liu, Y. (2018). The Effects of Urban Agglomeration Economies on Carbon Emissions: Evidence from Chinese Cities. J. Clean. Prod. 172, 1096–1110. doi:10.1016/j.jclepro.2017.09.273
Hart, M. (1999). Guide to Sustainable Community Indicators. 2nd ed. USA: QLF/Atlantic Center for the Environment.
Hashim, Z., Humaira, Y., Rong, W., Jing, T., and Nasir, M. (2020). An Empirical Investigation of the Coordinated Development of Natural Resources, Financial Development and Ecological Efficiency in China. Resour. Policy 65, 101580.
He, J., and Li, X. (2020). Sustainable Development Assessment and Analysis of Guangdong-Hongkong-Macao Greater Bay Area. Geogr. Geo-Information Sci. 36 (02), 119–125.
Hu, J., Du, Y., Mo, H., Wei, D., and Deng, Y. (2016). A Modified Weighted TOPSIS to Identify Influential Nodes in Complex Networks. Phys. A Stat. Mech. its Appl. 444, 73–85. doi:10.1016/j.physa.2015.09.028
Huang, Y., Zhang, J., and Wu, J. (2020). Integrating Sustainability Assessment into Decoupling Analysis: A Focus on the Yangtze River Delta Urban Agglomerations. Sustainability 12 (19), 7872. doi:10.3390/su12197872
Irfan, M., Elavarasan, R. M., Ahmad, M., Mohsin, M., Dagar, V., and Hao, Y. (2022). Prioritizing and Overcoming Biomass Energy Barriers: Application of AHP and G-TOPSIS Approaches. Technol. Forecast. Soc. Change 177, 121524. doi:10.1016/j.techfore.2022.121524
Jing, Z., and Wang, J. (2020). Sustainable Development Evaluation of the Society-Economy-Environment in a Resource-Based City of China:A Complex Network Approach. J. Clean. Prod. 263, 121510. doi:10.1016/j.jclepro.2020.121510
Karima, K., Peter, N., and Soushi, S. (2020). Are Global Cities Sustainability Champions? A Double Delinking Analysis of Environmental Performance of Urban Agglomerations. Sci. Total Environ. 709, 134963.
Khan, I., Zakari, A., Dagar, V., and Singh, S. (2022). World Energy Trilemma and Transformative Energy Developments as Determinants of Economic Growth amid Environmental Sustainability. Energy Econ. 108, 105884. doi:10.1016/j.eneco.2022.105884
Li, W., Yi, P., Zhang, D., and Zhou, Y. (2020). Assessment of Coordinated Development between Social Economy and Ecological Environment: Case Study of Resource-Based Cities in Northeastern China. Sustain. Cities Soc. 59, 102208. doi:10.1016/j.scs.2020.102208
Liang, L., Wang, Z., and Li, J. (2019). The Effect of Urbanization on Environmental Pollution in Rapidly Developing Urban Agglomerations. J. Clean. Prod. 237, 117649. doi:10.1016/j.jclepro.2019.117649
Liu, C., and Yang, M. (2020). An Empirical Analysis of Dynamic Changes in Ecological Sustainability and its Relationship with Urbanization in a Coastal City: The Case of Xiamen in China. J. Clean. Prod. 256, 120482. doi:10.1016/j.jclepro.2020.120482
Lu, Y., Wang, J., and Li, Y. (2003). Research and Application on Sustainable Development Index System in China. Environ. Prot. 11 (17–21), 26.
Luo, D., Liang, L., Wang, Z., Chen, L., and Zhang, F. (2021). Exploration of Coupling Effects in the Economy–Society–Environment System in Urban Areas: Case Study of the Yangtze River Delta Urban Agglomeration. Ecol. Indic. 128, 2021.
Luo, H., and Wang, F. (2020). Evaluation of Regional Sustainable Development Based on Ecological Footprint Model: Take Luzhou City as an Example. IOP Conf. Ser. Earth Environ. Sci. 568 (1).
Nazempour, R., Monfared, M. A. S., and Zio, E. (2018). A Complex Network Theory Approach for Optimizing Contamination Warning Sensor Location in Water Distribution Networks. Int. J. Disaster Risk Reduct. 30, 225–234. doi:10.1016/j.ijdrr.2018.04.029
Pan, S., Li, B., and Nie, H. (2019). Comprehensive Evaluation and Analysis of Obstacles to Sustainable Development of Low-Carbon Transformation of China's Economy. Inq. into Econ. Issues 6, 165–173.
Peng, T., and Deng, H. (2020). Comprehensive Evaluation for Sustainable Development Based on Relative Resource Carrying Capacity-A Case Study of Guiyang, Southwest China. Environ. Sci. Pollut. Res. Int. 27, 20090–20103. doi:10.1007/s11356-020-08426-8
Prabha, A. S., Ram, A., and Irfan, Z. B. (2020). Exploring the Relative Water Scarcity across the Indian Million-Plus Urban Agglomerations: An Application of the Water Poverty Index. Hydroresearch 3, 134–145. doi:10.1016/j.hydres.2020.10.001
Rahayu, H., Haigh, R., and Amaratunga, D. (2018). Strategic Challenges in Development Planning for Denpasar City and the Coastal Urban Agglomeration of Sarbagita. Procedia Eng. 212, 1347–1354. doi:10.1016/j.proeng.2018.01.174
Rama, M., González-García, S., Andrade, E., Moreira, M. T., and Feijoo, G. (2020). Assessing the Sustainability Dimension at Local Scale: Case Study of Spanish Cities. Ecol. Indic. 117, 106687. doi:10.1016/j.ecolind.2020.106687
Sara, G.-G., Rocío, M., Maria Teresa, M., and Feijoo, G. (2018). Assessing the Sustainability of Spanish Cities Considering Environmental and Socio-Economic Indicators. J. Clean. Prod. 178, 599–610.
Shao, C., Chen, S., Gao, J., He, Y., and Zhou, H. (2021). Design of China’s Sustainable Development Evaluation Index System Based on the SDGs. China Popul. Resour. Environ. 31 (4), 1–12.
Song, J., Feng, Q., Wang, X., Fu, H., Jiang, W., and Chen, B. (2019). Spatial Association and Effect Evaluation of CO2 Emission in the Chengdu-Chongqing Urban Agglomeration: Quantitative Evidence from Social Network Analysis. Sustainability 11 (1), 1. doi:10.3390/su11226503
Sun, X., Liu, X., Li, F., Tao, Y., and Song, Y. (2017). Comprehensive Evaluation of Different Scale Cities' Sustainable Development for Economy, Society, and Ecological Infrastructure in China. J. Clean. Prod. 163, 329–337. doi:10.1016/j.jclepro.2015.09.002
Sun, Z., and Ma, H. (2018). Assessment of the Sustainable Development of the Beijing-Tianjin-Hebei Urban Agglomeration Based on a Back Propagation Neural Network. Acta Ecol. Sin. 38 (12), 4434–4444. doi:10.5846/stxb201802050302
Tai, X., Xiao, W., and Tang, Y. (2020). A Quantitative Assessment of Vulnerability Using Social-Economic-Natural Compound Ecosystem Framework in Coal Mining Cities. J. Clean. Prod. 258, 120969. doi:10.1016/j.jclepro.2020.120969
Tan, F. (2016). Comparative Analysis of Sustainable Development of the Three Economic Circles of China. Soft Sci. 30 (7), 40–44.
Tang, C., Irfan, M., Razzaq, A., and Dagar, V. (2022). Natural Resources and Financial Development: Role of Business Regulations in Testing the Resource-Curse Hypothesis in ASEAN Countries. Resour. Policy 76, 102612. doi:10.1016/j.resourpol.2022.102612
The United Nations Sustainable Development Summit (2015). Transforming Our World: The 2030 Agenda for Sustainable Development. UN. Available at: https://undocs.org/zh/A/RES/70/1.
Uchiyama, Y., and Mori, K. (2017). Methods for Specifying Spatial Boundaries of Cities in the World: The Impacts of Delineation Methods on City Sustainability Indices. Sci. Total Environ. 592, 345–356. doi:10.1016/j.scitotenv.2017.03.014
Wang, C., Wang, Y., Geng, Y., Wang, R., and Zhang, J. (2016). Measuring Regional Sustainability with an Integrated Social-Economic-Natural Approach: a Case Study of the Yellow River Delta Region of China. J. Clean. Prod. 114, 189–198. doi:10.1016/j.jclepro.2015.05.121
Wang, R., Li, F., Hu, D., and Larry Li, B. (2011). Understanding Eco-Complexity: Social-Economic-Natural Complex Ecosystem Approach. Ecol. Complex. 8 (1), 15–29. doi:10.1016/j.ecocom.2010.11.001
Wang, Y., Guo, J., and Liu, H. (2017). A New Evaluation Method of Node Importance in Directed Weighted Complex Networks. J. Syst. Sci. Inf. 5 (4), 367–375. doi:10.21078/jssi-2017-367-09
Xue, Y., Zhang, W., and Lei, J. (2020). Evaluation of Regional Strategic Emerging Industry Innovation Ability Based on Complex Network Analysis. Sci. Decis. Mak. 4, 49–66.
Yang, Z., Zhang, W., Yuan, F., and Islam, N. (2021). Measuring Topic Network Centrality for Identifying Technology and Technological Development in Online Communities. Technol. Forecast. Soc. Change 167, 120673. doi:10.1016/j.techfore.2021.120673
Ye, C. (2019). Research on the Evaluation of Sustainable Development of Beautiful Countryside in Henan Province. Chin. J. Agric. Resour. Regional Plan. 40 (5), 202–208.
Zafar, M. W., Shahbaz, M., Sinha, A., Sengupta, T., and Qin, Q. (2020). How Renewable Energy Consumption Contribute to Environmental Quality? the Role of Education in OECD Countries. J. Clean. Prod. 268, 122149. doi:10.1016/j.jclepro.2020.122149
Zhang, C., Khan, I., Dagar, V., Saeed, A., and Zafar, M. W. (2022). Environmental Impact of Information and Communication Technology: Unveiling the Role of Education in Developing Countries. Technol. Forecast. Soc. Change 178, 121570. doi:10.1016/j.techfore.2022.121570
Zhang, W., Yu, Q., Yang, F., and Fan, H. (2018). Evaluation of Green Innovation Ability of Regional Manufacturing Industry under Innovation Driven Strategy: Modeling and Analysis of Complex Network Based on 30 Regional Data. J. Ind. Technol. Econ. 37 (8), 86–94.
Zhang, W., Zhang, M., Wu, S., and Liu, F. (2021a). A Complex Path Model for Low-Carbon Sustainable Development of Enterprise Based on System Dynamics. J. Clean. Prod. 321, 128934. doi:10.1016/j.jclepro.2021.128934
Zhang, W., Zhang, X., and Wu, G. (2021b). The Network Governance of Urban Renewal: A Comparative Analysis of Two Cities in China. Land Use Policy 106, 105448. doi:10.1016/j.landusepol.2021.105448
Zhang, Y., Yang, Z., and Li, W. (2005). Measurement and Evaluation of Interactive Relationships in Urban Complex Ecosystem. Acta Ecol. Sin. 7, 1734–1740.
Keywords: Guangdong-Hong Kong-Macao Greater Bay Area (GBA), social-economic-natural compound ecosystem, sustainable development, coupling coordination degree, complex network, node importance
Citation: Feng Z, Chen Z, Cai H and Yang Z (2022) Evaluation of the Sustainable Development of the Social-Economic-Natural Compound Ecosystem in the Guangdong-Hong Kong-Macao Greater Bay Area Urban Agglomeration (China): Based on Complex Network Analysis. Front. Environ. Sci. 10:938450. doi: 10.3389/fenvs.2022.938450
Received: 07 May 2022; Accepted: 06 June 2022;
Published: 27 June 2022.
Edited by:
Qingsong He, Huazhong University of Science and Technology, ChinaReviewed by:
Peipei Tian, Shandong University, ChinaVishal Dagar, Great Lakes Institute of Management, India
Copyright © 2022 Feng, Chen, Cai and Yang. This is an open-access article distributed under the terms of the Creative Commons Attribution License (CC BY). The use, distribution or reproduction in other forums is permitted, provided the original author(s) and the copyright owner(s) are credited and that the original publication in this journal is cited, in accordance with accepted academic practice. No use, distribution or reproduction is permitted which does not comply with these terms.
*Correspondence: Zaoli Yang, yangzaoli@bjut.edu.cn