Geochemical cycling in aquifers contributes to the transport, storage and transfer of anthropogenically-derived phosphorus to surface waters
 Evangelos M. Mouchos1,2*
  Penny J. Johnes1
  Heather L. Buss2
  Sam T. Bingham2,3
  Dianne Matthews4 John P. Bagnall5
  Daren C. Gooddy6
- 1School of Geographical Sciences, University of Bristol, Bristol, United Kingdom
- >2School of Earth Sciences, University of Bristol, Bristol, United Kingdom
- 3Atkins, Bristol, United Kingdom
- 4Natural England, Bristol, United Kingdom
- 5Wessex Water, Bath, United Kingdom
- 6British Geological Survey, Wallingford, United Kingdom
Phosphorus (P) is a key element which can contribute to the eutrophication of waters draining intensively farmed or populated catchments, driving adverse impacts on ecosystem and human health. An often overlooked source of P in permeable catchments is weathering of P-bearing minerals in bedrock. P release from primary minerals, present when the rock formed, controls background P concentrations in groundwater, but secondary P-bearing minerals may form in aquifers in the presence of anthropogenic P fluxes from agriculture and septic tanks. Using cores from the Upper Greensand (UGS) aquifer, United Kingdom, we show the relative contributions of P from primary and secondary minerals. Bulk rock chemical analysis indicates solid P concentrations of 0–0.8 wt%, while porewater analyses from the same samples indicate phosphate-P concentrations of <5 μg/L - 1 mg/L and dissolved organic P concentrations of <5 μg/L - 0.7 mg/L. These data, coupled with core stratigraphy, reveal the presence of multiple primary and secondary P-bearing minerals in the UGS, and suggest that secondary P-bearing minerals are largely of anthropogenic origin. The weathering of primary P nodules produces a very low background P flux to surface waters, while the anthropogenic P-bearing minerals undergo rapid dissolution, re-precipitation and re-dissolution cycles, controlled by porewater pH and P concentrations, in turn controlling dissolved P flux to groundwater. We show that secondary P-bearing minerals are a dynamic component of the P transfer system linking anthropogenic activities on the land surface to P in groundwater and surface waters and contributing to the eutrophication of surface waters.
1 Introduction
Phosphorus (P) is a key element for crop production and food security (Cordell et al., 2009; Cordell and White, 2014). It is applied as a fertiliser to crops and grass and is present in all foodstuffs and therefore in all animal wastes including both human sewage and livestock manures (Schoumans et al., 2015; MacDonald et al., 2016; George et al., 2018). It is an essential nutrient, forming the sugar backbone that holds DNA together (Butusov and Jernelöv, 2013) and is only found naturally in mineral formations (Oelkers and Valsami-Jones, 2008; Tõnsuaadu et al., 2012; Hughes and Rakovan, 2015). As its natural abundance is very low, compared to other key nutrients like nitrogen and carbon, it can limit biological production in natural and unpolluted waters (Davies et al., 2014; Brailsford et al., 2019; Mackay et al., 2020). When applied to the land to stimulate food production, and when consumed and excreted by livestock and humans it inevitably is transported to, or directly discharged to, water bodies from diffuse agricultural and point sources in any catchment (White and Hammond, 2009; Withers et al., 2012; Ascott et al., 2018; Lloyd et al., 2019). This stimulates increased biological production in the water body and contributes to the adverse impacts on ecosystem and human health that result from the process of eutrophication (Mainstone and Parr, 2002; Smith and Schindler, 2009; Stuart and Lapworth, 2016; Johnes et al., 2022).
The most abundant P-bearing minerals on Earth are the apatite group minerals with the general formula Ca5(PO4)3(F,OH,Cl) (Oelkers and Valsami-Jones, 2008). When fluorine or hydroxyl is accommodated in their crystal lattice fluorapatite (FAP) and hydroxyapatite (HAP) are formed respectively. A carbonate rich variety (Ca5(PO4,CO3)3F) of fluorapatite (CFA) is commonly found in sedimentary rocks in the form of minute spheroidal nodules reaching up to a few millimetres in length (Marshall-Neill and Ruffell, 2004; Stamatakis, 2004; Föllmi, 2016). In weathered rock surfaces, almost all of the mineral P is apatite, but with time and soil development P is released and incorporated in other phases or flushed from the system (Filippelli et al., 2006). In natural environments with minimum anthropogenic influence, soil P is gradually depleted as P is flushed to surface and groundwaters via surface and subsurface runoff and consequently the total amount of P available in the soil profile decreases over time (McDowell and Sharpley, 2001). However, in farmed soils, P distribution is controlled by both the weathering of natural minerals derived from the soil parent material and the anthropogenic P added to the soil via fertiliser or manure applications.
Phosphate ions from dissolved fertilisers react rapidly in most soils, resulting in P fixation in the soil (Zhang et al., 2014; Weeks and Hettiarachchi, 2019). The formation of secondary, and largely anthropogenically derived, P-bearing minerals takes place through adsorption of phosphate ions onto minerals or organic colloids, precipitation of phosphate minerals, and co-precipitation during formation of other secondary minerals under low-temperature conditions. P in soil solution tends to precipitate with Fe or Al oxy (hydr)oxides at acidic pH and with Ca at alkaline pH, while a greater abundance of P remains in solution phase at circumneutral pH values (Penn and Camberato, 2019). P sorption capacity in soils is controlled by the clay content and mineralogy in addition to the organic matter and the exchangeable Al, Fe and Ca concentrations (Syversen and Borch, 2005; Owens et al., 2007; Roberts et al., 2012).
Field studies suggest that HAP precipitation is favourable in alkaline aqueous solutions, although recent research suggests that carbonate hydroxyapatite can precipitate at pH 2 (Oubagha et al., 2016; Cichy et al., 2019; Delgadillo-Velasco et al., 2020). Laboratory and modelling studies suggest that HAP is chemically less stable and more soluble compared to FAP and CFA, and that it can dissolve in acidic aqueous solutions (Dorozhkin, 2012; Tõnsuaadu et al., 2012; Aljerf and Choukaife, 2017). In the same context, recent research demonstrates experimentally that in presence of Ca and P at a ∼2:1 ratio in a de-ionised water solution with quartz grains, it is feasible for HAP to precipitate and dissolve very rapidly at pH > 7 and pH < 7, respectively (Bingham et al., 2020).
In agricultural systems where P is applied in excess of soil storage capacity and crop uptake requirements, P can move over the surface of the land to streams as particulate phosphorus in the form of sediment-bound and particulate organic phosphorus. It can also move vertically in solution and then laterally to streams as dissolved organic phosphorus or soluble reactive phosphorus or may carry on vertically into the porewater of underlying aquifers in permeable catchments (Johnes and Hodgkinson, 1998). Phosphorus in transit can react with soil or bedrock surfaces to form P minerals in the soils and aquifers of a catchment. High fertiliser application rates associated with intensive crop and grass production can lead to the formation of secondary P-minerals such as HAP or to the sorption of P onto Fe/Al oxides in the soil matrix (Eriksson et al., 2015, 2016; Giroto et al., 2017). However, the application of P-rich manures, slurries or directly voided urine to livestock grazing land can also contribute significant organic P flux to waters, both laterally to surface waters (Lloyd et al., 2019) and vertically through soils (George et al., 2018). Both pre-existing natural and neoformed apatite minerals may then release P to soil porewater by weathering. Similarly, phosphate ions may desorb from solid amorphous colloid phases and move to the porewater aqueous phase or remobilise vertically in saturated soil profiles as P bound to suspended particles and colloids (Ilg et al., 2003; Zang et al., 2013).
Many studies have focused on P cycling, transfer and export among plants, soils and freshwaters, but the geochemical cycling, storage and transfer of P in aquifers is poorly understood. This knowledge gap is particularly notable in sedimentary aquifer bedrocks hosting natural P-bearing minerals in high abundance. A few studies have investigated the natural background P concentrations produced in catchments containing P-bearing sedimentary rocks (Smith et al., 2003; McGinley et al., 2016; Stuart and Lapworth, 2016). Recent research involving mineralogical characterisation, batch experiments and geochemical modelling of injected pre-treated wastewater in a deep P nodule-bearing siliciclastic aquifer of Cretaceous age in Western Australia indicated that powdered CFA may release P and F to the groundwater under anoxic conditions (Schafer et al., 2018; Schafer et al., 2021). However, these studies lack robust geochemical evidence on direct porewater-rock interactions within a bedrock profile, and an assessment of the natural versus anthropogenic origins of phosphorus minerals within the aquifer.
Catchment management focuses on monitoring nutrient concentrations and loading in rivers and lakes to control the adverse impacts on ecosystems that result from eutrophication (Johnes et al., 2007; Records et al., 2016; Riley et al., 2018). To date, little research has been carried out to test the P thresholds set for waterbodies in environmental legislation, defining the natural or background P concentration as this varies according to natural geological sources of phosphorus in catchments. In the presence of natural P-bearing minerals, P may be released through weathering adding a background P concentration to groundwater and hence to surface waters, in any natural and unpolluted catchment. Natural phosphate-bearing minerals are separate from any secondary P mineral forms, which may precipitate in the rock matrix from dissolved P travelling into the aquifer. The latter are formed by anthropogenic P derived from fertilisers and manures applied to the land surface or by septic tank seepage to groundwater. The main reasons that restrict research on defining natural background P concentrations in agricultural catchments are 1) the limited existence of pristine sites in an industrialised and densely populated world, 2) the different characteristics (e.g. climate, hydrology, natural vegetation and mineral composition of soils and bedrocks) between the remaining natural and undisturbed sites and 3) the fact that most natural sites in the United States of America, EU and the UK are usually found in small watersheds that have remained undeveloped and hence nutrient concentration and loading data from such sites are difficult to upscale to larger water bodies where there will be significant in-river or lake processing of materials flushed to them from sources in their catchments (Smith et al., 2003).
This paper tackles this knowledge gap, using of a range of geochemical methods to identify and discriminate between the natural versus anthropogenic mineral P sources in sedimentary rock environments, and the relative rates of P dissolution and precipitation that control the net flux of P from these mineral forms to the aquifer and then to surface waters.
2 Methodology
2.1 Area of study
The Hampshire Avon catchment is an agricultural catchment covering an area of about 1750 km2. It has been continuously farmed for centuries (Baggs et al., 1999; Tubb, 2009; Hare, 2011), contributing to legacy P accumulation to the soils, aquifers and the river for as long as there has been agriculture and settlement in the catchment. The Hampshire Avon rises in the north of the catchment in the Vale of Pewsey (Figure 1). Its two tributaries converge at Upavon, flow southwards through Salisbury Plain where radial drainage from a range of tributaries (Wylye, Ebble, Bourne and Sem/Nadder) amplifies the flow volume as the river flows south, to discharge into the English Channel at Christchurch Harbour (Yates et al., 2016; Lloyd et al., 2019). It is a Chalk dominated catchment, where Chalk is a soft and porous CaCO3-rich sedimentary rock of Cretaceous age, located predominantly in Southern England, extending in an arc up to the NE of England, and expanding to Western Europe. The catchment also has three large Upper Greensand (UGS) outcrops in its northern and western parts, underlain by the Gault formation. UGS is a fine-grained glauconitic sand and sandstone formed in the Upper Cretaceous, whereas Gault is a dark clay or mudstone, partially glauconitic with a sandy base, formed during the Lower Cretaceous period. The Hampshire Avon headwaters (the East Avon and West Avon) that drain the Vale of Pewsey derive the vast majority of their flow from the underlying UGS aquifer (Marsh and Hannaford, 2008; Allen et al., 2014).
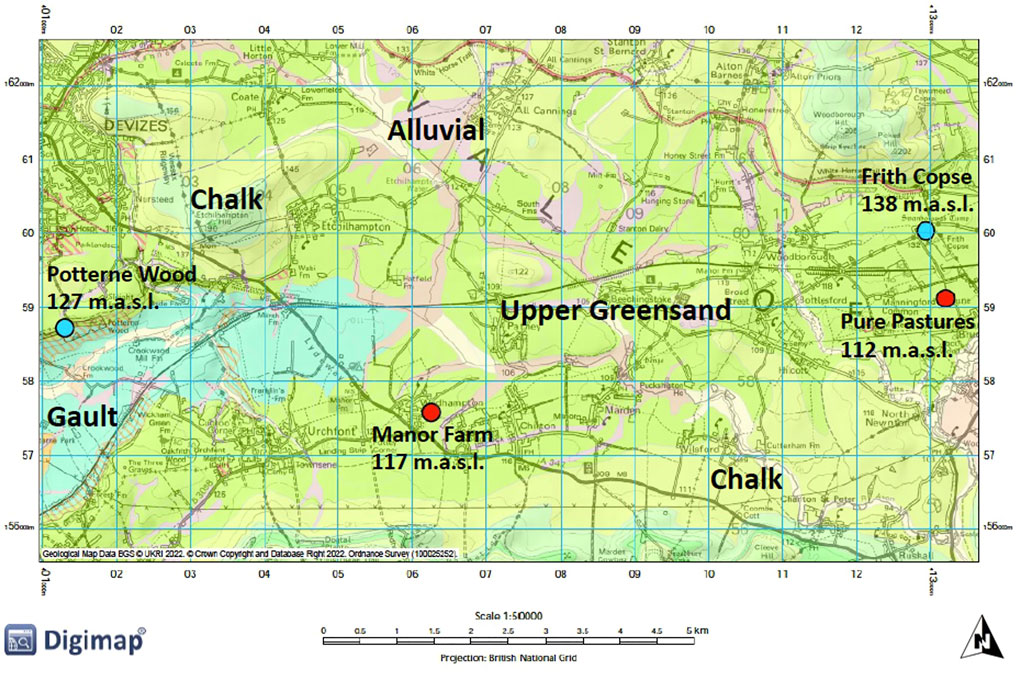
FIGURE 1. Geological map of the Vale of Pewsey highlighting the drilling sites and their elevation (in metres above sea level). Sites overlain by ancient or old secondary woodland are marked by blue dots and sites overlain by crop production are marked by red dots.
2.2 Sources of phosphorus in waters draining the upper greensand aquifer
The Hampshire Avon receives nutrient enrichment from both diffuse and point sources (Yates and Johnes, 2013; Whitehead et al., 2014; Lloyd et al., 2019). Diffuse sources include inorganic and organic fertiliser applications to crops and grass as well as organic wastes voided by livestock on intensive grazing land underlain by Gault and UGS formations and from sheep grazing on the less intensively farmed scarp slopes of the Chalk downland. Point sources include releases of consented discharges from sewage treatment works, small packet sewage treatment works and septic tanks in riverside villages and towns within the Vale and point source seepage from leaking sewerage infrastructure and septic tanks, particularly in the headwaters at distance from mains sewage treatment works, where septic tanks are common (Yates et al., 2019).
Greensands among other sedimentary rocks are known to contain natural phosphate minerals (primary minerals), which may release P into their porewaters via weathering and contribute to P flux to adjacent surface water bodies (McGinley et al., 2016; Stuart and Lapworth, 2016). Woods et al. (2008) identified the presence of phosphatic clasts and nodules in the UGS formation across the Devizes region. These are found scattered within the UGS profile to a maximum depth of 35 m below surface, and may reach a diameter of up to a few millimetres. Allen et al. (2014) showed that UGS groundwater is relatively high in P and low in N concentrations compared to the Chalk groundwater in the catchment and argued that this resulted from the dissolution of primary P minerals in the UGS. Meanwhile Butcher (2013) studied the hydrochemistry of UGS porewaters revealing marked variations in P concentration per site and with depth, without determining whether this was of natural or anthropogenic origin. In fact, little is known about the natural P concentrations in the Hampshire Avon deriving from the dissolution of primary minerals in the UGS aquifer, and their quantitative significance compared to P released from secondary P minerals in the aquifer. The latter are formed through the percolation of anthropogenic P from farming and septic tanks sources into the UGS unit and mineral formation on contact surfaces in the pore spaces. Interpretation of the P mineralogy and chemistry is required to determine how much of the P signal in the rivers and lakes of the Hampshire Avon catchment derive from primary versus anthropogenically derived secondary P minerals. This is necessary to properly inform the setting of thresholds and targets to control eutrophication impacts in this catchment.
2.3 Field sampling approach
A drilling campaign was undertaken to recover material from UGS outcrops in the Hampshire Avon catchment. Land cover distribution within the Vale of Pewsey was examined first to find sites which were overlain by ancient or old (>100 years) secondary woodland, which might have experienced lower rates of P enrichment than sites overlain by farmland. Few such sites persist in this intensively farmed landscape. Woodland sites were selected as far from adjoining agricultural land as possible, to avoid lateral flows of agricultural P sources into the coring sites, though it is acknowledged that this may have influenced the representativity of these core samples. Four coring sites were identified in total. Two with ancient or secondary woodland (Frith Copse, Potterne Wood) and two overlain by crop production (Manor Farm, Pure Pastures) (Figure 1). From each site two cores were acquired, a deep one intending to reach a maximum depth of 25 m to collect UGS material down to and below the water table, and a shallow core (about 5 m depth) to investigate the anthropogenic influence with better accuracy through higher resolution shallow sampling and some duplicate sampling at the same shallow depths as taken from the deeper cores.
2.3.1 Drilling
Drilling was carried out using an air flush rotary drill to recover undisturbed material while avoiding potential contamination may be caused by using fluids or lubricants. Dry coring led occasionally to poor recovery of the upper 5 m of the UGS succession. Therefore, an extra manual auger was used to collect additional samples from 0–5 m depth, ensuring shallow horizons were sampled properly. The coring material was logged as it was extracted at each site to develop a clear understanding of the stratigraphy of the Vale of Pewsey and the relationship between the material recovered at each location.
2.3.2 Core Sampling
About 100 m of the UGS sequence was drilled in total at four sites. Drilling material was received as sleeved 1.5 m length and 78.8 mm diameter continuous cores in plastic capped cases, or as broken samples in plastic capped buckets (particularly from the shallow depths). Samples were sealed to prevent evaporative losses and consequent changes in porewater chemistry during transport or storage. Core material processing was carried out at BGS laboratories (Wallingford) immediately after the drilling was complete. Depending on differences in lithology, one or two samples from each core, about 15–30 cm long and 2 kg in weight, were collected for analysis.
2.4 Materials and methods
Over 50 samples were analysed in total, involving: 1) determination of the major ion chemistry and P fraction concentrations in porewater samples extracted at a series of depths from each core and 2) determination of the bulk rock geochemistry as this varied down each extracted UGS core.
2.4.1 Porewater extraction and analysis
About 0.5–1 kg of each UGS core sample was centrifuged at high speed (14,000 rpm) with a gravity force of 30,000 g for 45 min under partial vacuum and at a fixed temperature of 4°C to produce 30 ml of porewater (after Gooddy et al., 1995). Water content was determined by reweighing 150 g of each centrifuged rock sample after been dried in the oven overnight at 120°C. Porewater chemical analysis on samples extracted from the fifty drill core samples was carried out at the University of Bristol laboratories using three different methods depending on the analytes.
All samples were analysed using a Skalar San++ Continuous Flow Analyser to determine the concentration of soluble reactive P (SRP, measured as orthophosphate PO4-P) on fresh extracted samples. Total dissolved P (TDP) was determined on a digested, filtered sample using the persulphate oxidation method (Johnes and Heathwaite, 1992; Yates et al., 2019), and dissolved organic P (DOP) was calculated as the difference between TDP and SRP. The analytical method is based on the reaction of PO43- in the presence of ammonium molybdate to form a blue colour complex measured at 660 nm (Yates and Johnes, 2013; Lloyd et al., 2019). Instrument precision was calculated using replicate standards or drift standards from the run. Calibration was done at the start of the analysis and the analysis only proceeded if the r2 of the calibration curve was >0.99. Phosphate standards were made up following serial dilution of a 1,000 mg/L-P standard made from anhydrous potassium dihydrogen phosphate as outlined in the Skalar manual (Skalar Analytical, 2014). The Skalar detection limit for P fractions is < 5 μg/L. Further details on our QA and QC methods are available in Yates et al. (2019).
Silicon was also determined through colourimetry using a Thermo Scientific Gallery Plus discrete photometric analyser and pH through the electrochemical (ECM) unit of the discrete photometric analyser. Major ion chemistry was the determined on all porewater samples using Thermo Scientific Dionex, where sufficient amount of remaining porewater sample was available, comprising the major anions F-, Cl-, SO42- and NO3- and major cations Ca2+, Na+, K+ and Mg2+. Due to low quantity of the extracted porewaters it was not possible to conduct duplicate analyses. However, blank samples of deionised water were run between the porewater samples to ensure that no contamination in the porewaters, following the QA methods of Yates et al. (2019).
2.4.2 Bulk rock analysis
Bulk rock geochemical analysis was undertaken to determine the distribution of P in the UGS and its elemental associations. This was completed at ALS Laboratories, Ireland using Inductively Coupled Plasma Atomic Emission Spectroscopy (ICP-AES) and Inductively Coupled Plasma Mass Spectrometry (ICP-MS), after lithium metaborate fusion digestion of dehydrated and pulverised (<75 µm) UGS samples. These included centrifuged drill core material used for the porewater extraction, hard rock core material that was water depleted, and hand-augured core material. Analysed samples included randomly selected duplicates, blanks and certified reference material standards [BCR-667 (EC-JRC-IRMM)] for quality control. Loss on Ignition (LOI) was determined by heating samples at 1000°C in a muffle furnace.
2.4.3 Statistical analysis
The statistical analysis of bulk rock and porewater data was performed using the Seaborn Statistical Analysis and Data Visualisation package (Python 2.7). Bulk rock major and trace element datasets as well as porewater datasets were log-ratio transformed to minimise the effects of compositional closure (Grunsky, 2010; Pingitore and Engle, 2022). Clustered heatmaps show the Pearson product-moment correlation coefficient (r) as calculated for the respective variables (x and y axis) and presented as a heatmap (white r > 0, black r < 0). Variables with similar r against each other are grouped closer together (clusters).
2.4.4 Modelling
In Bingham et al. (2020) we used a continuous flow-through reactor to experimentally determine mineral dissolution rates of HAP at various pH, P and Ca concentrations, from which we derived a dissolution rate constant for HAP. The rate constant was then used in a 1D reactive transport model (Geochemist’s Workbench® Professional v.12 software, Bethke et al., 2018, with the Thermo database, Daveler and Wolery, 1992) to understand HAP mineral dissolution and precipitation reactions and rates over time during downward transport in a sandstone aquifer as functions of groundwater chemistry and flow rate. In the present study, the concentration of baseflow phosphorus entering the headwaters of the Hampshire Avon was quantified using a 2D reactive transport model. Briefly, 1D reactive transport models (as per Bingham et al., 2020), representing conditions at 25 points near the East Avon and West Avon, were linked to the Wessex Basin groundwater model (Soley et al., 2012) to estimate mineral-derived P fluxes along 2D transects parallel to groundwater flow paths and concentrations of mineral-derived P along the rivers over 120-days intervals. HAP and CFA dissolution and precipitation reactions were modelled using rate constants from Bingham et al. (2020) and Guidry and Mackenzie, 2003, respectively. The 2D models incorporated data from the UGS stratigraphy (Section 2.3.1) to constrain the zones of CFA occurrence, and the chemical analysis of the extracted porewaters (Section 2.4.1) and bulk rock (Section 2.4.2) to estimate the mass of apatite minerals in the stratigraphic layers.
3 Results
3.1 Stratigraphy
The UGS stratigraphy in the Vale of Pewsey comprises three major lithologies. These are, from top to bottom, the Easterton Sandstone member, the Potterne Sandstone member and the Cann Sand member (Figure 2). The stratigraphic correlation between sites was based mainly on the hard sandstone/limestone horizons, which are distinct and found at specific depths, and the presence of visible P nodules that are very limited in the sequence (Figure 3). These were identified in all drilling sites at various depths, hosted in both hard and soft UGS material, comprising three P-rich horizons. Woods et al. (2008) suggest the presence of two P-nodule bearing horizons in the UGS, one in the Potterne Sandstone member and another one in the middle of the Cann Sand member. This study confirms these two occurrences and suggests an additional P-nodule rich horizon further down in the Cann Sand member.
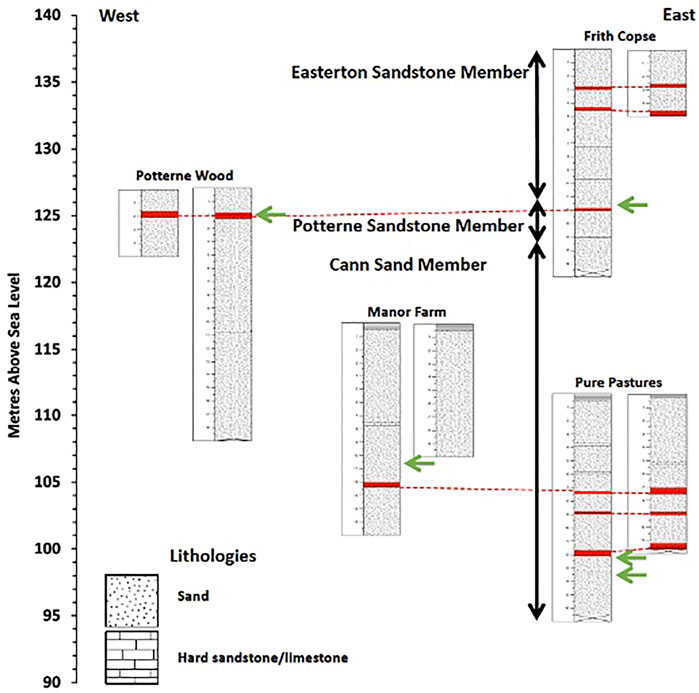
FIGURE 2. Combined UGS stratigraphy showing the four P nodule bearing horizons marked with green arrows. Stratigraphic units of hard sandstone/limestone marked in red and connected with dotted lines correlate across cores and sites. Profile depth is in metres (m) and elevation is in metres above sea level (m.a.s.l.).
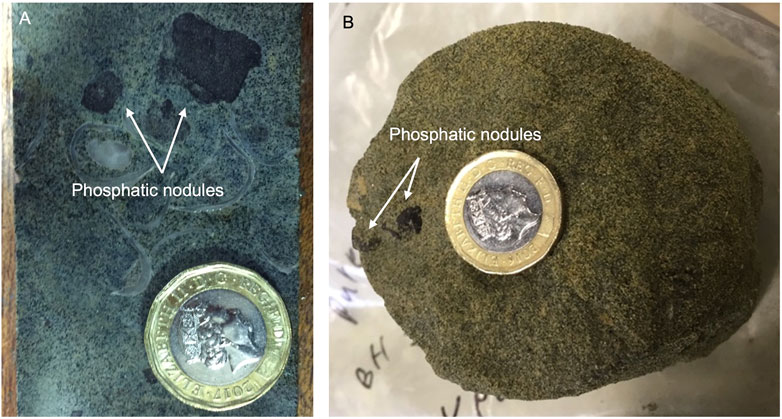
FIGURE 3. Images showing phosphatic nodules hosted in (A) a parallel-cut hard, shelly UGS core sample and (B) a cross-cut soft UGS core sample. Both samples were collected from Pure Pastures drilling site in cores recovered from 12.5 to 13.5 m below the surface, respectively, representing the third P-rich horizon found at the lower parts of the Cann Sand UGS member.
3.2 Porewater chemistry
Porewater major ion concentrations for each drilling site including the pH and the porewater content (porosity) of centrifuged samples are shown in Tables 1–4. Missing data in the tables are due to a low quantity of the extracted sample for analysis. Porewater SRP concentrations range from below the limit of detection (<5 μg/L) to 1 mg/L) (Figures 4A,B). The TDP concentrations are found to exceed 1 mg/L in a small number of samples, with SRP as the dominant P fraction at all sites and depths. Silicon concentrations are relatively high in UGS porewaters compared to other groundwaters (Allen et al., 2014). It ranges between ∼4 mg/L and 17 mg/L. Porewater pH ranges from 6.2 to 7.8 with an average pH of approximately 7.3, with pH neutral to slightly acidic in the aquifer, except for shallow samples (<2 m) that are close to the topsoil, where pH is slightly basic. Freshwater and groundwater pH in the Hampshire Avon aquifers ranges from ∼7.0 to >8.0 (Yates and Johnes, 2013; Allen et al., 2014) with lower pH recorded in waters draining through the UGS.
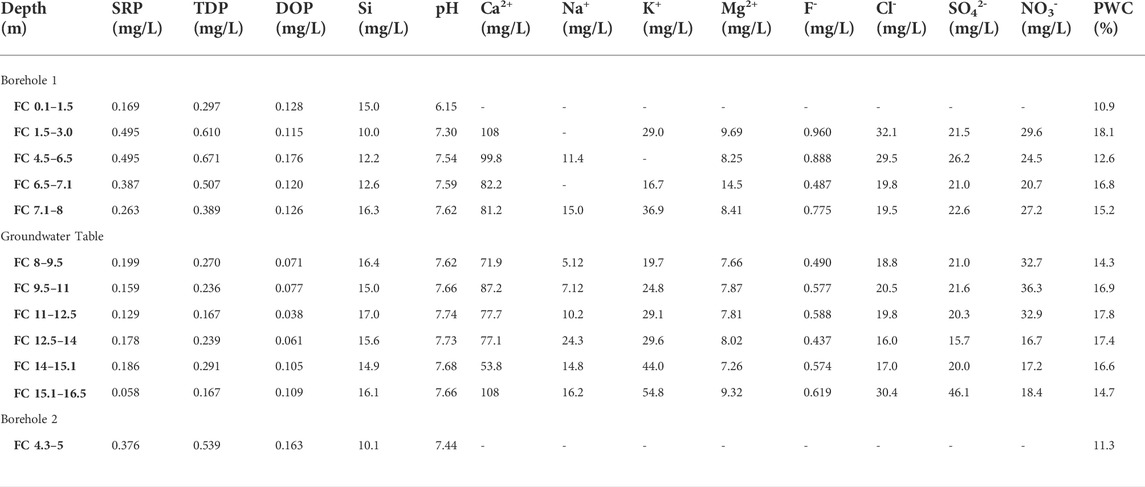
TABLE 1. Chemical composition of extracted porewater from Frith Copse core samples. SRP and TDP were measured colourimetrically following persulphate oxidation. DOP was calculated by difference as TDP-SRP. Si was also measured colourimetrically, and the pH was measured using a glass electrode. Other elements were measured using ion chromatography. Porewater content (PWC) was measured by drying each core sample prior to porewater extraction.
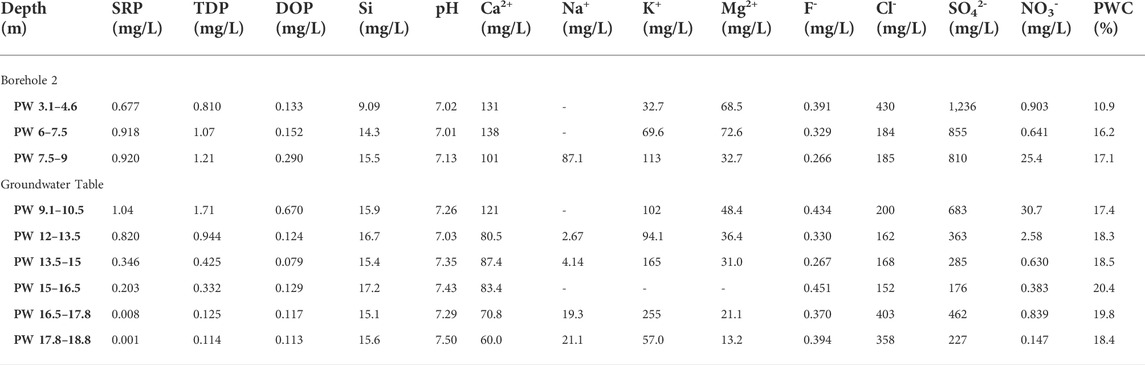
TABLE 2. Chemical composition of extracted porewater from Potterne Wood core samples. SRP and TDP were measured colourimetrically following persulphate oxidation. DOP was calculated by difference as TDP-SRP. Si was also measured colourimetrically, and the pH was measured using a glass electrode. Other elements were measured using ion chromatography. Porewater content (PWC) was measured by drying each core sample prior to porewater extraction.
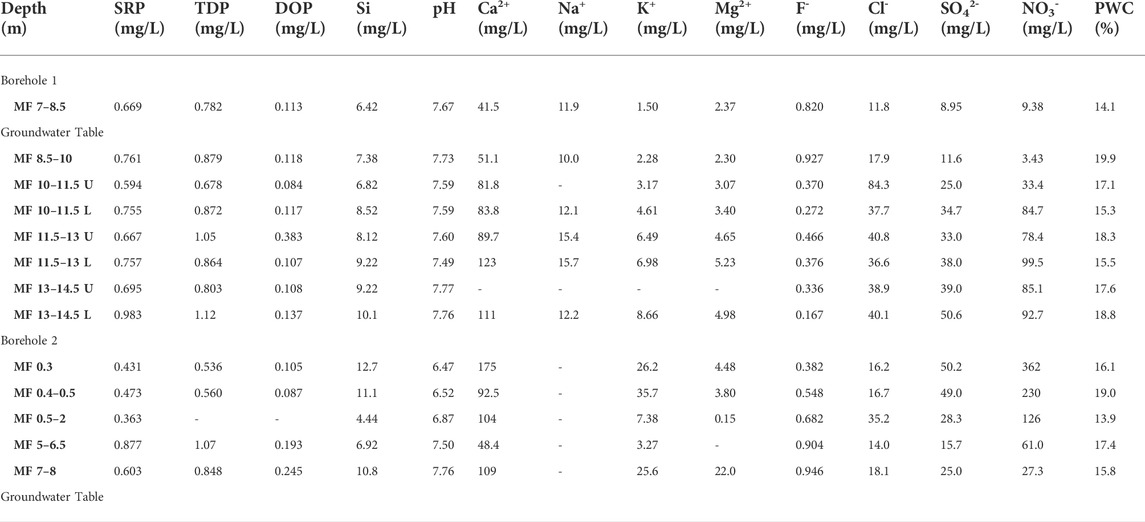
TABLE 3. Chemical composition of extracted porewater from Manor Farm core samples. SRP and TDP were measured colourimetrically following persulphate oxidation. DOP was calculated by difference as TDP-SRP. Si was also measured colourimetrically, and the pH was measured using a glass electrode. Other elements were measured using ion chromatography. Porewater content (PWC) was measured by drying each core sample prior to porewater extraction. U and L: upper and lower sample collected from the same core.
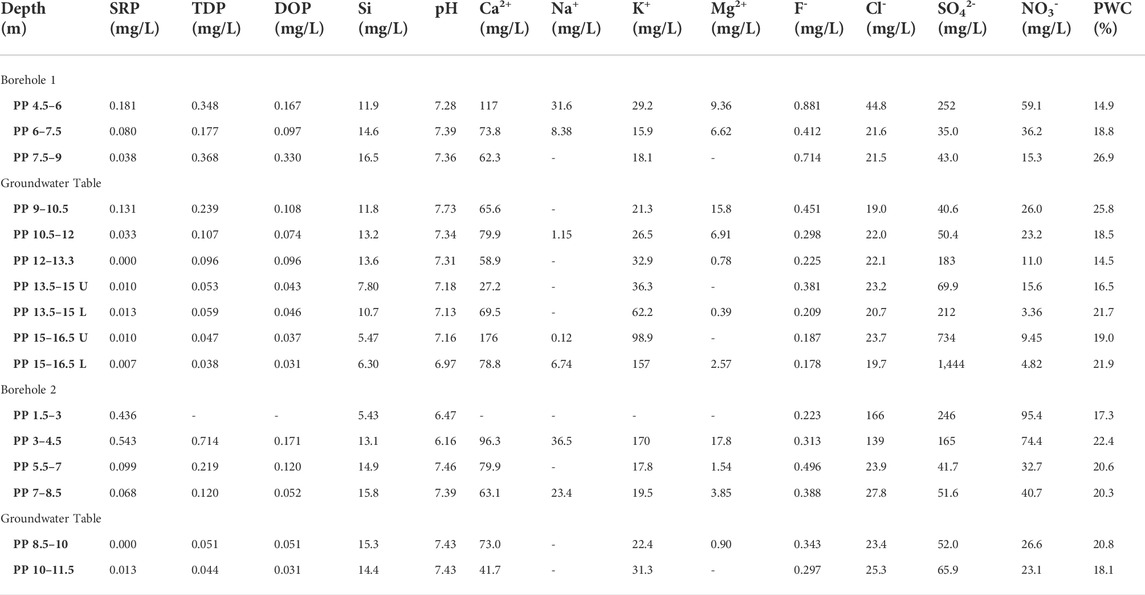
TABLE 4. Chemical composition of extracted porewater from Pure Pastures core samples. SRP and TDP were measured colourimetrically following persulphate oxidation. DOP was calculated by difference as TDP-SRP. Si was also measured colourimetrically, and the pH was measured using a glass electrode. Other elements were measured using ion chromatography. Porewater content (PWC) was measured by drying each core sample prior to porewater extraction. U and L: upper and lower sample collected from the same core.
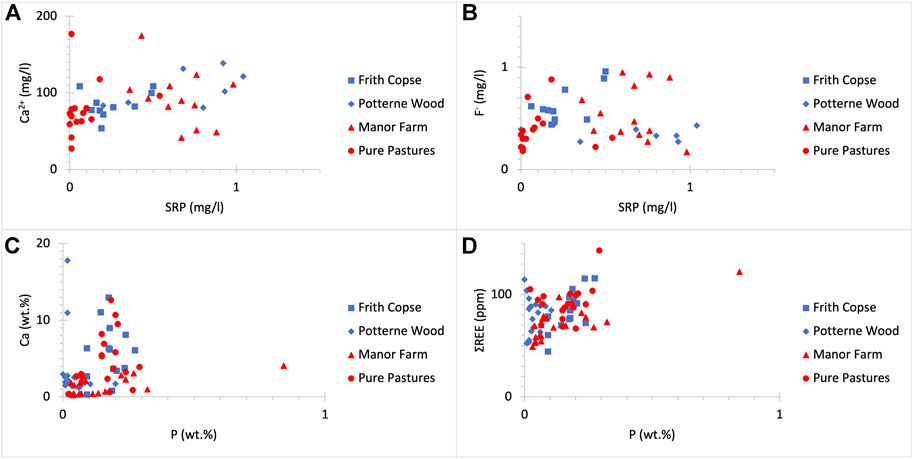
FIGURE 4. SRP (mg/L) concentrations do not clearly correlate with those of (A) Ca2+ (mg/L) (R2 = 0.098) and (B) F- (mg/L) (R2 = 0.015) in drilled sites regardless of land use. Additionally, P (wt%) concentrations do not clearly correlate to these of (C) Ca (wt%) (R2 = 0.035) and (D) ΣREE (ppm) (R2 = 0.178) in drilled sites regardless of land use.
Ca2+ concentrations ranged between 27 mg/L and 177 mg/L and K+ between 1.5 and 255 mg/L, while Na+ and Mg2+ concentrations are much lower ranging between about 1 mg/L and 87 mg/L for Na+ and between about 1 mg/L and 73 mg/L for Mg2+. For the anions, F- was found in very low concentrations ranging between approximately 0.2 mg/L and 1 mg/L, Cl- concentrations vary from 12 mg/L to 430 mg/L, while SO42- concentrations varied markedly from 9 to 1,444 mg/L. Finally, NO3- concentrations range from <1 mg/L to 362 mg/L, the latter in soil porewaters in a recently fertilised arable field at Manor Farm.
Overall, the UGS porewaters can be described as siliceous and calcium rich, with a small number of samples being alkali rich. Concentrations of the dissolved P fractions (SRP and TDP) are not spatially associated with dissolved Si or the concentrations of other analysed ions in the porewater (Supplementary Tables S1–S4).
3.3 Bulk rock chemistry
UGS rock samples show a narrower range of variation in elemental composition across the Vale of Pewsey (see Supplementary Tables S1–S4). The UGS soft horizons are siliceous (∼65–88 wt% SiO2) containing large amounts of quartz. Within the UGS hard horizons, SiO2 content is lower than in the soft horizons (∼45–65 wt%) and the CaO content is higher (∼10–25 wt% compared to ∼0.5–10 wt% in the soft horizons). Less abundant compounds found in the UGS include Al2O3, Fe2O3, K2O and MgO. These range between 1 and 10 wt% and correspond to the glauconite content in the UGS. The P2O5 concentrations in bulk rock samples are relatively low and range from <0.1 to about 2 wt%. The volatile content measured as LOI ranges between 2 wt% and 21 wt%. Hence, low SiO2 and hard UGS horizons are sandy limestones rich in CaCO3. Although, there is a clear correlation between CaO concentrations and LOI values, this is not observed when comparing between Ca and P concentrations (Figure 4C). The total REE content including yttrium in the UGS ranges from 44 to 144 ppm, with an average concentration of 82 ppm. UGS is enriched in light REE (La to Sm) and depleted in heavy REE (Eu to Lu) and yttrium, which is considered a heavy REE. The average light to heavy REE ratio is 3.3. The ΣREE content is not clearly associated with the P content (Figure 4D). Since there is no relationship between P and Ca and/or REE, data suggest that more than UGS likely hosts more than one type of phosphate minerals.
Most of the UGS samples analysed are very high in SiO2, but this decreases significantly in horizons where CaCO3 (reflected in CaO and LOI measurements) is more abundant. Most of the Fe2O3 content in the UGS corresponds to glauconite that has been visually identified in both soft and hard UGS layers. The bulk P content in the UGS is low and not clearly associated with other elements, most likely because it appears in more than one mineral form in most UGS samples. However, P concentrations higher than 0.5 wt% found in one sample likely indicate the presence of P nodules accumulated in some UGS horizons rather than P enrichment from the use of fertilisers (Figures 2, 3). Fertilisers containing 10 wt% N, 10 wt% PO4 (as P2O5) and 15 wt% K (as K2O) have specific REE chemical patterns (Otero et al., 2005). The UGS samples show a similar REE pattern with a characteristic negative Eu anomaly and very small variations at the heavy REE in all samples (Figure 5). This pattern, normalised against chondrite (c.f. Bao and Zhao, 2008; Sanematsu et al., 2013; Deady et al., 2016; Santana et al., 2015) is similar to the REE pattern reported for Upper Cretaceous Sandstones (Eker and Korkmaz, 2011), indicating that the REE-bearing mineral content seems to be distributed evenly across the UGS bedrock. This similarity suggests a uniform REE pattern in all UGS sites regardless of land use, stemming from the presence of light and heavy REE minerals in the rock matrix rather than application of a fertiliser type with a standard REE pattern in the Vale of Pewsey farms.
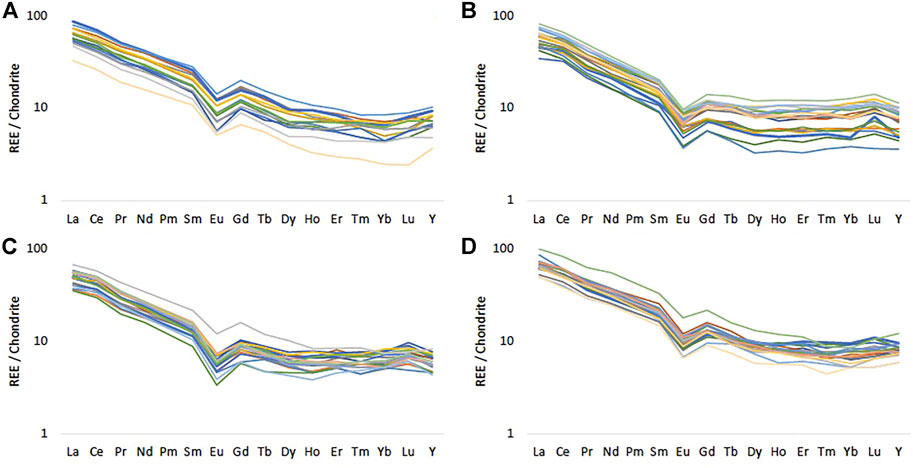
FIGURE 5. Chondrite normalised REE patterns for (A) Frith Copse (B) Potterne Wood (C) Manor Farm and (D) Pure Pastures using McDonough and Sun (1995). Different colours represent the REE pattern for each sample.
3.4 Statistical analysis
The clustered heatmap for all UGS porewater samples shows a positive correlation between the P fractions, some correlation between Cl-, Mg2+, SO42- and K+ and no correlation in other elements (Supplementary Figure S1A). Data analysis with regard to the land use shows different chemistries in porewaters under woods and under farms. In UGS porewaters under woodlands there is a positive correlation between the P fractions, Ca2+, SO42-, Cl-, Mg2+ and K+ (Supplementary Figure S1B). By contrast, the porewater chemistry under farms is clearly different with a positive correlation between the P fractions, Na+, NO3- and F-, reflecting the impact of influx of geochemically different water from the overlying soils as a result of the different land use practices at each site (Supplementary Figure S1C).
The clustered heatmap for all UGS bulk rock samples shows positive correlations in three sets of elements. These represent the hard limestone horizons (CaO, LOI and SrO), the clayey horizons (TiO2, Al2O3, BaO and Na2O) and the main quarzitic glauconite UGS material (Cr2O3, K2O, SiO2, MgO and Fe2O3) (Supplementary Figure S2A). These horizons were identified during core logging of the material collected from drilling sites (Section 2.3.1). The positive correlation between P2O5 and Fe2O3 compared to the slightly positive correlation between P2O5 and CaO indicates that a large proportion of bulk P is deposited in the soft glauconite rich UGS horizons while a lower proportion of it is deposited in the hard CaCO3 rich bands. As far as the trace elements are concerned, there is a strong correlation between the rare earth elements and U and Th due to the presence of REE-bearing minerals. A slight differentiation in the correlation between the light and heavy rare earth elements indicates the presence of various REE-bearing minerals occurring in the UGS. The relationship between Hf and Zr, and Cr and V is due to very low concentrations of zircon and other metallic minerals in the UGS (Supplementary Figure S3A).
Data analysis of bulk rock UGS samples relevant to land use show minor variations in correlations between elements, indicating that the UGS stratigraphy controls the distribution of most elements in the rock rather than the anthropogenic activity on the surface. The woodland sites are comprised of all the three UGS units (Easterton Sandstone, Potterne Sandstone and Cann Sand), whereas the farm sites are comprised entirely of the Cann Sand member (Figure 2). The clustered heatmap for woodland sites (Supplementary Figure S2B) shows a similar correlation between the major elements to this for all UGS samples (Supplementary Figure S2A), while all rare earth elements are grouped together (Supplementary Figure S3B). By contrast, the bulk rock chemistry data for farmland sites show positive correlations in two sets of elements (Supplementary Figure S2C). These include the hard limestone horizons (CaO, LOI and SrO) and the quartz and glauconite-rich UGS horizons (SiO2, Al2O3, TiO2, Fe2O3, MgO, K2O and Cr2O3), with clay-rich horizons not being distinct but rather being incorporated in the glauconitic material. Trace and rare earth elements (Supplementary Figure S3C) show similar correlation to this for all UGS samples (Supplementary Figure S3A). In terms of the bulk P distribution, clustered heatmaps show that P2O5 is more strongly correlated with Fe2O3, MgO and MnO than with CaO and LOI under woods (Supplementary Figure S2B), while the opposite occurs under farms (Supplementary Figure S3B).
3.5 Calculating the background phosphorus concentration arising from natural and anthropogenic sources in the upper greensand
Only the dominant anthropogenic and natural P minerals identified in the UGS, HAP and CFA (Woods et al., 2008; Bingham et al., 2020; Mouchos, 2021), were assessed in the 2D model. As there is substantial overlap in the chemical composition of these two minerals, it is not possible to quantify their relative abundances from the bulk rock chemical analysis of the drill core material (Figure 4C), while the REE phosphate content is negligible (Mouchos, 2021) (Figure 4D). Therefore, two model scenarios were constructed to estimate the contributions of P from natural (CFA) and anthropogenic (HAP) P-bearing minerals to the headwaters of the Hampshire Avon:
Scenario 1: Assumes that all bulk P in the UGS is HAP. This is an unrealistic “endmember” scenario to demonstrate a maximum flux using the most reactive mineral source of P.
Scenario 2: Assumes that all bulk P at the depths where CFA nodules were observed and interpreted (based on UGS stratigraphy), is CFA and that all solid-state P at the other depths (between the nodule layers) is HAP. This scenario is more realistic than Scenario 1 as CFA nodules were observed in the layers where they were modelled (Figure 2), however, some of the P in these layers may be present as HAP and some of the P in the other layers may be CFA, in smaller accumulations. Although the P nodules are abundant, this mineral form is significantly less reactive (i.e., it has slower dissolution kinetics) than HAP (Guidry and Mackenzie, 2003; Zhu et al., 2009).
The model using Scenario 1, where all of the bulk P is HAP, results in high P fluxes to the West and East Avon from the UGS and baseflow P concentrations of 0–0.05 mg/L (Figure 6A), with markedly higher P concentrations in the West Avon than in the East Avon. Scenario 2, where bulk P is attributed to CFA at depths where nodules were found (Figure 2) and the remaining P is considered to be HAP, results in lower P flux from the UGS in both tributaries, with higher P concentrations in the range of 0 to less than 0.05 mg/L in the West Avon, and no P contribution from groundwater in the East Avon (Figure 6B). Under both scenarios, there is substantially more contribution of mineral-P to the West Avon than to the East Avon, with no predicted baseflow contribution of mineral-P to the headwaters of either river. Scenario 2 produces lower contributions of mineral-P to both rivers than Scenario 1, reflecting the slower dissolution kinetics of primary CFA relative to secondary hydroxyapatite. For comparison, SRP concentrations for these rivers reported in earlier work under the Defra PSYCHIC research project for the period 1993–2000, are 0.21–0.32 mg/L in the West Avon and 0.31–0.42 mg/L in the East Avon (Jarvie et al., 2005a; Johnes, 2007). Monitoring data from Wessex Water in the East and West Avon report SRP concentrations in the range of 0.1–0.6 mg/L between 1998 and 2018, while this study reports SRP concentrations in the range <0.03–0.05 mg/L in the UGS porewater samples in 2016 (Mouchos, 2021). More recently (2019), Natural England reports PO4-P concentrations in the range of <0.03–0.8 mg/L in boreholes and springs across the Vale of Pewsey (Mouchos, 2021). Differences in concentration ranges may be attributable to the release of P to these tributaries and to the aquifer from anthropogenic sources in their catchments, with a maximum of less than 0.05 mg/l P contributed to surface waters through dissolution of a combination of primary and secondary minerals in the UGS.
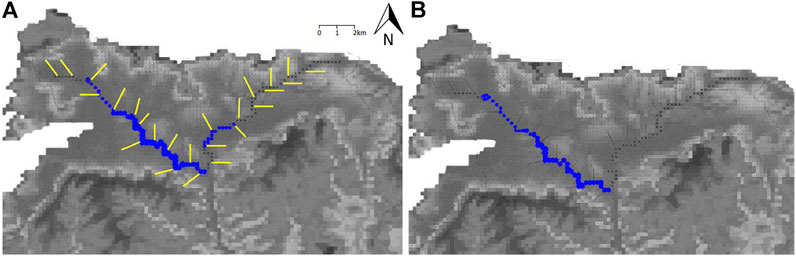
FIGURE 6. Concentrations of baseflow phosphate attributable to minerals from the UGS in the West and East Avon under the two model scenarios (A) one and (B) two, assuming an average water table. The base maps show the topography of the Vale of Pewsey. Yellow lines indicate 2D transects parallel to groundwater flow paths. The size of the blue circles indicate the P concentrations released to the rivers from dissolution of minerals within the aquifer (mg/L).
4 Discussion
4.1 The importance of land use and stratigraphy
Porewater and bulk rock P concentrations when studied separately do not provide a clear picture of P distribution in the UGS, relevant to their P sources. Therefore, it is necessary to combine the two datasets for a more complete interpretation of the P behaviour, considering spatial information on catchment morphology and land use, in addition to vertical bedrock profile characteristics such as mineralogy and stratigraphy and the groundwater table depth in the area of study. Figure 7 shows that high CaCO3 (LOI) and low SiO2 contents at 5, 12, 34 and 37 m depth in the UGS stratigraphy correspond to the four hard sandstone/sandy limestone bands as illustrated in Figure 2.
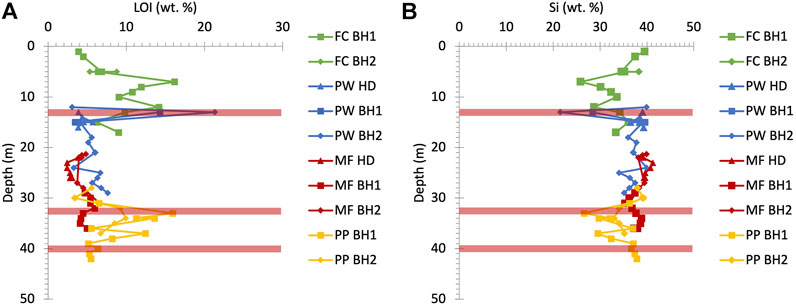
FIGURE 7. Vertical distribution of (A) LOI and (B) Si wt% in the UGS bulk rock. LOI spikes, which represent the CaCO3 rich hard sandstone/sandy limestone bands, increase as the Si rich soft quarzitic sandy material content decreases at 5, 12, 34 and 37 m depth. Red bars illustrate the phosphatic nodule horizon depths as shown in Figure 3. FC: Frith Copse, PW: Potterne Wood, MF: Manor Farm, PP: Pure Pastures, BH 1 and 2: borehole numbers and HD: hand drilling.
The distribution of these hard bands is particularly important as porosity decreases significantly in these horizons and intergranular flow turns to fracture flow (Allen et al., 2014). These horizons likely affect porewater flow pathways within the aquifer and thus, porewater P concentrations therein. Figures 8–11 illustrate the bulk P and Ca wt% concentrations and the porewater SRP fraction concentrations (mg/L) and the ionic Ca2+ and F- concentrations in addition to pH plotted against depth (m) for all drilling sites. Boreholes overlain by farms are located at a lower elevation (metres above sea level) compared to those in woodland sites, and therefore are composed entirely of the Cann Sand UGS member, lacking the overlying Easterton Sandstone and Potterne Sandstone members and their respectively hard bands (Figure 2). This means the trends in the data presented in Figures 8–11 need to be interpreted relative to the stratigraphy shown in Figure 2, rather than as absolute depths below the soil surface.
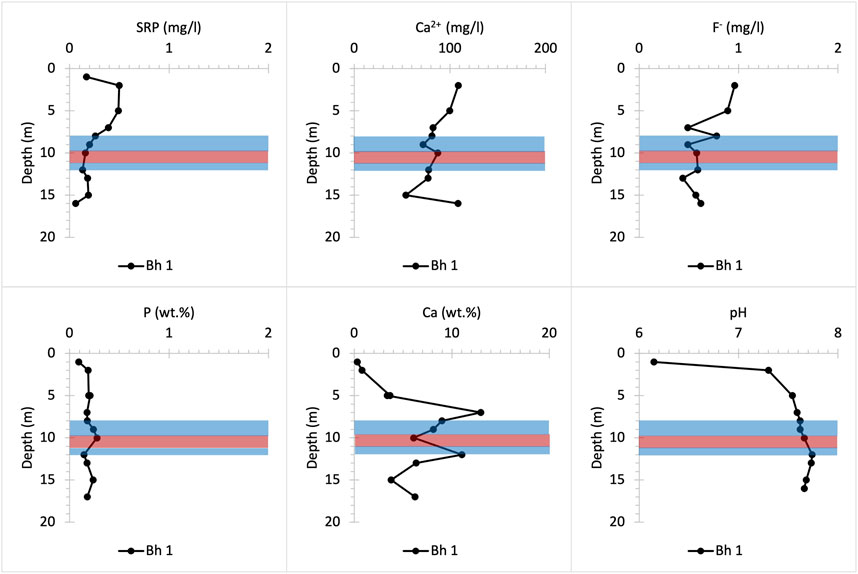
FIGURE 8. Chemical profiles illustrating bulk rock (P and Ca) and porewater (SRP, Ca2+, F- and pH) distribution versus depth at Frith Copse woodland drilling site. Bh 1 stands for borehole number.
4.1.1 Woodland sites
The UGS beneath Frith Copse is composed of soft sands interbedded with hard sandstone layers and contains low concentrations of bulk P (Figure 8). The upper part of the profile corresponds to the Easterton Sandstone UGS member. The Potterne Sandstone member appears in the middle part of the profile and corresponds to the highest P (∼0.3 wt%) concentration that is found in the P nodule bearing horizon at about 12 m depth (Figure 2). The lower part of the profile corresponds to the Cann Sand UGS member. SRP concentrations are highest in the upper part of the profile and may be due to lateral P influx to the UGS below Frith Copse from adjacent farmland (Allen et al., 2014; Lloyd et al., 2019), the distance of which from the coring location is less than 100 m Ca2+ concentrations increase with depth at shallower core depths, then fluctuate below ∼7 m, likely due to pH increase to basic values, which favours HAP precipitation and decreases the SRP concentrations in porewater solution (Penn and Camberato, 2019; Bingham et al., 2020). SRP concentrations slightly increase below the P nodule horizon, as this lies below the groundwater table, promoting P mineral dissolution. High F- concentrations which occur at shallow depths are likely to be linked to anthropogenically derived, as fluoride is not removed by conventional water treatment (Edmunds and Smedley, 2013).
The Potterne Wood profile includes the P nodule-bearing Potterne Sandstone member in the upper part which overlies the Cann Sand UGS member (Figure 2). This profile displays high SRP concentrations reaching up to 1 mg/L at about 10 m depth, which is at the level of the water table (Figure 9). Concentrations of SRP below 10 m depth decrease due to dilution of porewater P concentrations at the water table. Ca2+ concentration decreases with depth in a basic pH environment similarly to the Frith Copse profile (Figure 8). However, the P availability is so high in the upper parts of the Potterne Wood profile that, although HAP may form, porewater P vertical enrichment still takes place until the water table is reached (Bingham et al., 2020). By contrast, F- concentration does not show any significant change with depth indicating that CFA dissolution in the upper parts of the profile is low. Thus, a significant proportion of the porewater SRP concentration increases with depth as a result of vertical and lateral mobility of P in solution rather than from the dissolution of P nodules.
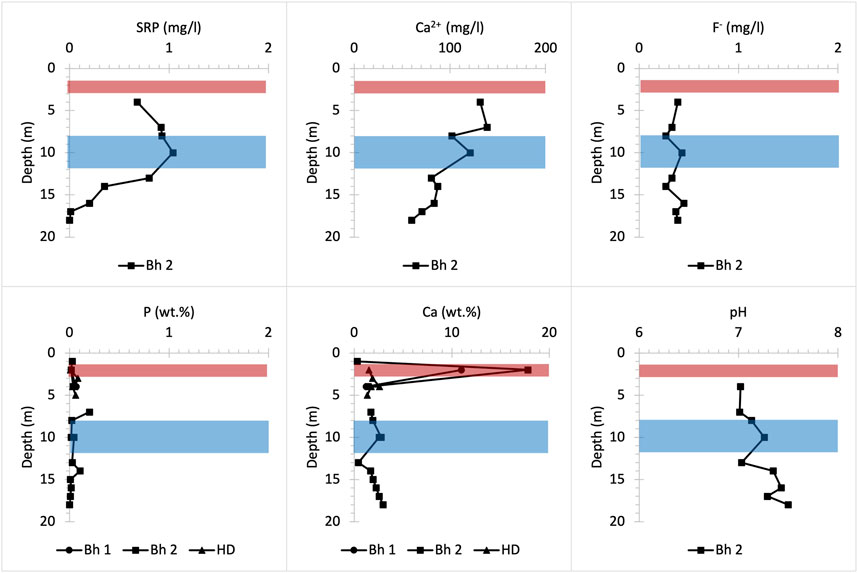
FIGURE 9. Chemical profiles illustrating bulk rock (P and Ca) and porewater (SRP, Ca2+, F- and pH) distribution versus depth at Potterne Wood woodland drilling site. Bh 1 and 2 stand for borehole numbers and HD for hand drilling.
4.1.2 Farmland sites
Bulk P concentrations in the UGS below Manor Farm are relatively low except for a P spike occurring approximately 10 m below the surface (Figure 10), which coincides with the P nodule bearing horizon (Figure 2). Within the soil layer (<1 m depth), bulk solid P and Ca concentrations are extremely low, whereas Ca2+ concentrations in porewater are high at a slightly acidic pH that favours dissolution of P-bearing solid forms (Penn and Camberato, 2019). This suggests that a nutrient input of ∼0.45 mg/L SRP and >200 mg/L NO3- measured in the porewaters within the soil layer (less than 0.5 m below the surface) is likely largely anthropogenic and may enter the UGS bedrock at Manor Farm (Table 3). This SRP concentration is further enriched with depth. At depths below 2 m the pH becomes basic and bulk P concentration increases slightly due to HAP precipitation, as shown in Bingham et al. (2020). However, SRP concentration fluctuations below 10 m depth, in addition to the slight increase in F- concentration in solution are likely due to the dissolution from weathering of the CFA nodule bearing horizon that is in contact with the groundwater mixed with P influxes from the shallower UGS parts and from the soil.
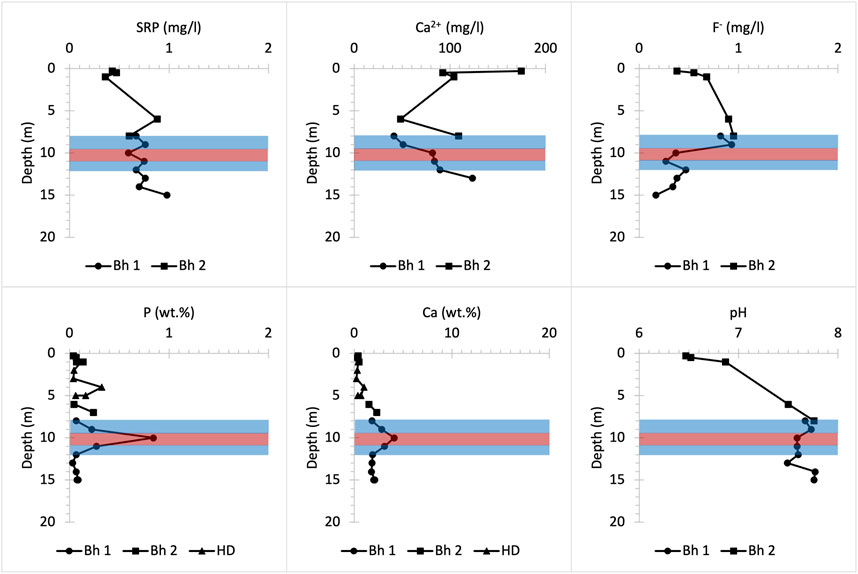
FIGURE 10. Chemical profiles illustrating bulk rock (P and Ca) and porewater (SRP, Ca2+, F- and pH) distribution versus depth at Manor Farm farmland drilling site. Bh 1 and 2 stand for borehole numbers and HD for hand drilling.
The same P concentration of about 0.45 mg/L SRP is observed in the surface layers of the Pure Pastures profile, which may be linked to the use of fertilisers on farmland in this area (Figure 11). That is because this concentration is almost three times higher than the P concentration of 0.17 mg/L SRP measured in the soil layer of the Frith Copse woodland (Figure 8), which is located close to Pure Pastures (Figure 1). In contrast with Manor Farm site, Ca2+ porewater concentrations near the surface are very low. Below 4 m depth, the pH goes basic allowing HAP precipitation. This increases bulk P content and decreases porewater P concentrations up to 8 m depth where SRP starts to dilute as the groundwater table interacts with the UGS (Bingham et al., 2020). Finally, two P nodule horizons below 12 m depth were identified macroscopically (Figures 2, 3). However, low bulk P content indicates that these nodules are either very small in size or very scattered in these horizons. Despite that, a slight increase in porewater F- concentration provides evidence for both the presence and the slow dissolution of these P nodules in both farmland sites (Figures 10, 11).
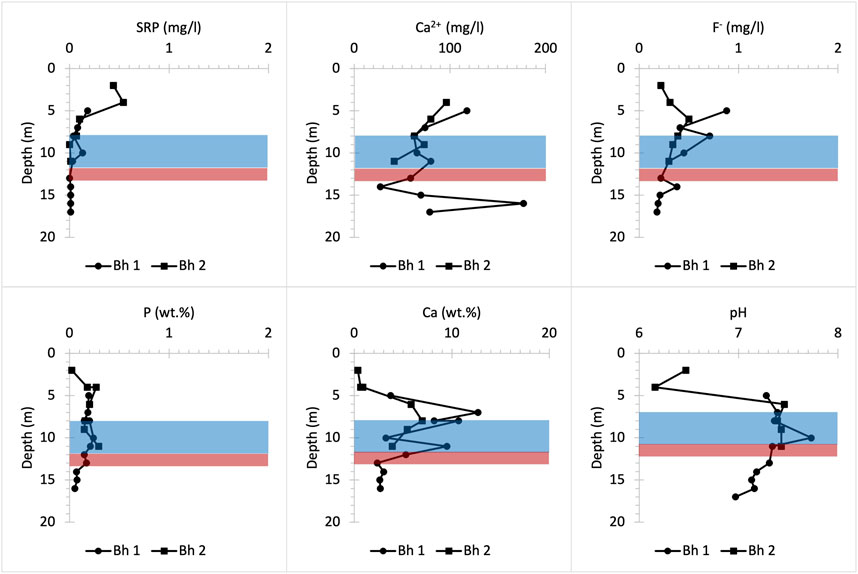
FIGURE 11. Chemical profiles illustrating bulk rock (P and Ca) and porewater (SRP, Ca2+, F- and pH) distribution versus depth at Pure Pastures farmland drilling site. Bh 1 and 2 stand for borehole numbers.
4.2 Mineral and soluble P distribution
The porewater and bulk rock chemical data were interpreted in the context of land use and stratigraphy in the previous section. Overall, SRP and TDP concentrations are not significantly higher in samples collected under farmland than those samples collected under woodland, suggesting P enrichment as a result of fertiliser or manure applications may undergo lateral transport through the UGS aquifer. The high Ca2+ concentrations in porewaters suggest that the UGS aquifer receives Ca2+ rich loads via surface flows and throughflows from the eroding Chalk outcrops surrounding the Vale of Pewsey (Allen et al., 2014) (Figure 1). The very low concentrations of F- (lower than 1 mg/L) in the porewater (Figures 8–11) may indicate minimal dissolution of natural fluoride-containing phosphate minerals (FAP and CFA) in the UGS, as reported in prior research on P-bearing mineral dissolution (Rasmussen, 1996; Marshall-Neill and Ruffell, 2004; Harding et al., 2014). Variations in the Na+, Mg2+ and K+ concentrations are likely associated with the concentration and the weathering rates of mineral glauconite in the UGS (Harding et al., 2014).
No clear trend is evident in the porewater chemistry that indicates a single driving factor controlling the distribution of P in solution in the UGS. SRP concentrations decrease with depth under farmland at Pure Pastures, which may be linked to P accumulation near the surface from farming practices. This P profile is also seen at Frith Copse, which is close to Pure Pastures (Figure 1), suggesting both sites may be responding to the same P inputs to the soil system, with lateral transfers into the UGS below Frith Copse from the surrounding farmland. This is not evident at Manor Farm where SRP concentrations clearly increase with depth, while Potterne Wood has peak SRP concentration in porewater at 10 m depth, which is 8 m below the P nodule horizon.
Porewater and bulk rock P chemistry trends relevant to the profile depth are not co-incident (Figures 8–11). There is no evidence that higher porewater P concentrations occur at the same depth or immediately below the locations with high bulk P content in the rock matrix (those zones where CFA P nodules are abundant). More precisely, high SRP concentrations in the porewaters are never coincident with P nodule bands recorded during logging of core material (Figure 2). Bulk rock P content is mainly controlled by the presence of natural CFA nodules in the UGS rock matrix. By contrast, there is no apparent relationship between the distribution of P nodule bands and P concentrations in the porewaters. Therefore, it is suggested that P concentrations in the porewaters are controlled by other sources, one of which may be the application of P-rich fertilisers and manures to the land surface overlying the aquifer.
The UGS is a heterogenous bedrock incorporating hard, CaCO3-rich bands in a soft sandy to clayey porous material, while both soft and hard horizons show similar Fe and Mn contents (see Supplementary Tables S1–S4). Additionally, UGS porewater pH ranges from 6.2 to 7.8 with an average value of pH 7.3, but pH < 7 commonly occurs in the shallow UGS, in contact with or within the soil. Batch experiments simulating the UGS conditions in the laboratory show a rapid precipitation of HAP at pH > 7, whereas HAP dissolution is favoured at pH 4–7 (Bingham et al., 2020). However, pH values within the UGS range do not significantly change the HAP dissolution rate; instead when the solution is near neutral pH, the rate of HAP dissolution is primarily controlled by porewater P concentrations (Bingham et al., 2020). The thermodynamic saturation state of the extracted porewaters with respect to HAP (a function of temperature, pH, P and Ca concentrations, and HAP mineral solubility) ranges from undersaturated to supersaturated with depth and across sites (Mouchos, 2021), favouring dissolution and precipitation of HAP, respectively. The woodland sites were supersaturated (favouring precipitation) except below 16 m, whereas the farmland sites were strongly undersaturated (favouring dissolution) in the upper few metres, and either strongly supersaturated (Manor Farm) or highly variable (Pure Pastures) deeper (Mouchos, 2021). However, time-series water chemistry data from Wessex Water groundwater wells across the catchment indicate temporal, as well as spatial, variability in saturation state, with undersaturation indicated at most sites most of the time (Bingham et al., 2020). Apart from pH, P and Ca concentrations, the precipitation/dissolution or sorption/desorption of P in the UGS are affected by other factors including the grain surface area, porosity of the UGS matrix and rate of flow through the matrix. Each of these acts as a control on reaction kinetics as these vary with depth (Bingham et al., 2020).
4.3 Natural versus anthropogenic sources and fluxes of P
The data presented here show that HAP dissolution conditions can be met in the soil layer or in very shallow UGS depths adjacent to the soil, where pH is commonly is less than 7. Below this depth, solution phase porewater P moves vertically in the UGS sequence and is likely to precipitate as HAP. Precipitated anthropogenic P-bearing mineral phases in the UGS are likely to dissolve below the water table. Variations in pH below 8 m depth, where it may drop to values <7 and the water table position fluctuates, indicate that chemical conditions in the system change dynamically, leaving too little reaction time for the anthropogenic P-bearing mineral forms to accumulate. Therefore, most of the anthropogenic P is likely to remain in the solution below the water table. By contrast, CFA nodules appear to accumulate in high concentrations at specific depths of the UGS sequence since its formation in the Upper Cretaceous, dissolving very slowly and contributing little P to the porewater P pool in the aquifer.
The modelled UGS P flux under Scenario 1 varies spatially across the Vale of Pewsey due to geochemical and hydrological variability within the Vale. Groundwater chemistry in the north-western side of the Vale, drained by the West Avon tributary is typically more conducive to HAP dissolution (due to lower concentrations of P in the groundwater, which allows mineral dissolution to occur), compared to the north-eastern side of the Vale, drained by the East Avon. This leads to a higher rate of predicted P dissolution and flux to the West Avon than the East Avon from the dissolution of HAP in the UGS. The water table, which also varies in space and time across the vale, also has a significant effect on the results: only a higher-than-average water table produces a baseflow contribution from the UGS to the headwaters, and even then only in the West Avon tributary. The baseflow contribution of P from the UGS also changes down the course of both East and West Avon, reflecting a variable depth to water table and changing groundwater velocity along the length of the river. This is a key input to the models, as a faster velocity results in faster rates of dissolution of both mineral forms, and this too varies between the West and East Avon rivers.
The modelled UGS P flux under Scenario 2 dissolves less mineral-P and results in lower contributions of P from the UGS to baseflow, compared to Scenario 1 (Figure 6). HAP is a highly reactive phase, some of which is replaced by CFA in Scenario 2, which is significantly less reactive. In the model, the CFA nodules, due to their low reactivity, remain largely unchanged by weathering processes, and the groundwater at those depths instead favours the formation of HAP. Thus, the lower P flux from the UGS in Scenario 2 (at or close to zero P flux to porewaters) is not only due to the lower reactivity of CFA nodules and the less HAP available to dissolve, but also due to the reprecipitation of some of the dissolved HAP, actively removing P from the porewaters. Consequently, anthropogenic P in the form of HAP is unlikely to accumulate permanently in the UGS forming a legacy P store in the UGS, but more likely represents a transient store for P, rapidly cycled and transferred through the aquifer until it eventually discharges into the rivers.
5 Conclusion
The stratigraphy of the UGS provides a useful basis for exploring the spatial trends evident in bulk rock and porewater chemical data sets and has supported geochemical modelling and interpretation at landscape scale. Through the examination of the mineralogy and geochemistry of the UGS it was found that although total bulk P is very low in the rock matrix, higher concentrations are present in P-rich nodules int three key horizons. The main P mineral form in these nodules is CFA, a natural mineral formed as the rock itself was formed. P is likely released very slowly from these nodules, as high P concentrations in the porewaters in the UGS are not coincident with the location of these horizons. Geochemical modelling work and the experimental findings of other studies on the rates of dissolution of CFA indicates that these contribute very little P flux to surface waters in the Vale of Pewsey.
By contrast, secondary HAP is rapidly formed and is also more rapidly dissolved under the specific hydrogeological and geochemical conditions in the UGS than the primary, natural mineral forms (Bingham et al., 2020). P is released approximately 100–100,00x faster by dissolution of secondary mineral HAP, than by dissolution of the primary minerals CFA and FAP (Valsami-Jones et al., 1998; Guidry and Mackenzie, 2003; Bingham et al., 2020). Secondary P minerals thus comprise a dynamic component of the P transfer system linking anthropogenic activities on the land surface to P in adjacent surface and groundwaters.
While the most abundant mineral phase of P in the UGS is the slowly dissolving P nodules, the secondary mineral P phases are the main transient form of P, forming and re-dissolving in a matter of minutes to days within the UGS as P migrates from land to stream through the aquifer. The majority of P in the porewaters in the UGS is likely to be associated with anthropogenic activity on the land surface, with P flux to the aquifer passing through several phases of precipitation and dissolution in the form of HAP and amorphous Fe oxy (hydroxides) as the P migrates through the unsaturated zone to the water table. Natural or near-natural P concentrations in the aquifer, deriving from the much slower dissolution of natural phosphate minerals in the UGS would be substantially lower than current concentrations, based on the mineralogical, geochemical and modelling evidence. Efforts aimed at defining the P concentration in natural, unpolluted waters as part of efforts to determine the nature, origins and scale of P enrichment in eutrophicated waters, need to take account of the geochemical cycling of P within aquifers. In order to effectively target and control P enrichment of surface waters in permeable catchments, it is important to account for P release to surface waters through weathering of P-bearing minerals hosted within the bedrock. Importantly, however, there is also a need to account explicitly for the differing presentation, exposure to weathering and dissolution processes, and geochemical cycling controls experienced by these primary and secondary P mineral forms when attempting to define the ‘natural’ baseline P concentration in any surface water body.
Data availability statement
The original bulk rock and porewater chemistry data presented in this study are included in the article/Supplementary Material. Further enquiries can be directed to the corresponding author.
Author contributions
EM is corresponding author and carried out the field programme, laboratory analyses and data interpretation, and produced a PhD thesis including this work (Mouchos, 2021) under the supervision of PJ, HB, DG and JB. PJ was the Principal Investigator and secured the funding for this programme. PJ, HB and DG worked with EM to design the sampling programme, laboratory analyses and interpretation. SB carried out the modelling work under the supervision of HB. The manuscript was jointly written by EM, PJ, HB, SB and DG, while JB and DM contributed to programme design, interpretation of outcomes and revisions to the manuscript.
Funding
This research programme was funded by Wessex Water plc. and Natural England. Partial support for Penny Johnes was provided by Natural Environment Research Council, United Kingdom Large Grant NE/K010689/1 (DOMAINE: Characterising the Nature, Origins and Ecological Significance of DOM in Freshwater Ecosystems).
Acknowledgments
This work was undertaken as part of the Wessex Water and Natural England funded programme: Determining the nature and origins of phosphorus in catchments underlain by Upper Greensand. The authors would like to thank Christopher Yates, Fotis Sgouridis and Adam McAleer (University of Bristol) for assisting in porewater analysis, Vasileios Myrgiotis (University of Edinburgh) for contributing to the statistical analysis, and Bentje Brauns, Lee Gumm and Peter Williams (British Geological Survey) for their support during drilling and core processing. DCG publishes with the permission of the Director of the British Geological Survey.
Conflict of interest
SB was employed by Atkins. DM was employed by Natural England. JB was employed by Wessex Water. DG was employed by British Geological Survey.
The remaining authors declare that the research was conducted in the absence of any commercial or financial relationships that could be construed as a potential conflict of interest.
Publisher’s note
All claims expressed in this article are solely those of the authors and do not necessarily represent those of their affiliated organizations, or those of the publisher, the editors and the reviewers. Any product that may be evaluated in this article, or claim that may be made by its manufacturer, is not guaranteed or endorsed by the publisher.
Supplementary material
The Supplementary Material for this article can be found online at: https://www.frontiersin.org/articles/10.3389/fenvs.2022.932566/full#supplementary-material
References
Aljerf, L., and Choukaife, A. E. (2017). Hydroxyapatite and fluoroapatite behavior with pH change. Int. Med. J. 24 (5), 407–410.
Allen, D. J., Darling, W. G., Davies, J., Newell, A. J., Gooddy, D. C., and Collins, A. L. (2014). Groundwater conceptual models: Implications for evaluating diffuse pollution mitigation measures. Q. J. Eng. Geol. Hydrogeo. 47, 65–80. doi:10.1144/qjegh2013-043
Ascott, M. J., Gooddy, D. C., Lapworth, D. J., Davidson, P., Bowes, M. J., Jarvie, H. P., et al. (2018). Phosphorus fluxes to the environment from mains water leakage: Seasonality and future scenarios. Sci. Total Environ. 636, 1321–1332. doi:10.1016/j.scitotenv.2018.04.226
Baggs, A. P., Freeman, J., Smith, C., Stevenson, J. H., and Williamson, E. (1999). “Pewsey,” in A history of the county of Wiltshire: Volume 16, Kinwardstone Hundred. Editors D. A. Crowley (Oxford University Press.
Bao, Z., and Zhao, Z. (2008). Geochemistry of mineralization with exchangeable REY in the weathering crusts of granitic rocks in South China. Ore Geol. Rev. 33, 519–535. doi:10.1016/j.oregeorev.2007.03.005
Bethke, C., Farrell, B., and Yeakel, S. (2018). The geochemist’s Workbench release 12.0. Champaign, Illinois: Aqueous Solution, LLC.
Bingham, S. T., Buss, H. L., Mouchos, E. M., Johnes, P. J., Gooddy, D. C., and Bagnall, J. P. (2020). Rates of hydroxyapatite formation and dissolution in a sandstone aquifer: Implications for understanding dynamic phosphate behaviour within an agricultural catchment. Appl. Geochem. 115, 104534. doi:10.1016/j.apgeochem.2020.104534
Brailsford, F. L., Glanville, H. C., Golyshin, P. N., Johnes, P. J., Yates, C. A., and Jones, D. L. (2019). Microbial uptake kinetics of dissolved organic carbon (DOC) compound groups from river water and sediments. Sci. Rep. 9, 11229. doi:10.1038/s41598-019-47749-6
Butcher, A. S. (2013). Project activity summary: Phosphate in porewaters of the upper Greensand and grey Chalk subgroup of wiltshire and dorset. Groundwater science programme. Wallingford: British Geological Survey. Commissioned Report CR/13/095.
Butusov, M., and Jernelöv, A. (2013). Phosphorus in the organic life: Cells, tissues, organisms. Phosphorus: An element that could have been called lucifer. New York: Springer.
Cichy, B., Kużdżał, E., and Krztoń, H. (2019). Phosphorus recovery from acidic wastewater by hydroxyapatite precipitation. J. Environ. Manag. 232, 421–427. doi:10.1016/j.jenvman.2018.11.072
Cordell, D., Drangert, J. O., and White, S. (2009). The story of phosphorus: Global food security and food for thought. Glob. Environ. Change 19, 292–305. doi:10.1016/j.gloenvcha.2008.10.009
Cordell, D., and White, S. (2014). Life’s bottleneck: Sustaining the world’s phosphorus for a food secure future. Annu. Rev. Environ. Resour. 39, 161–188. doi:10.1146/annurev-environ-010213-113300
Daveler, S. A., and Wolery, T. J. (1992). A data file preprocessor for the EQ3/6 software package – user’s guide and related documentation. Livermore, CA: Lawrence Livermore National Laboratory. UCRL-MA-110662 PT II. (Version 7.0), s.l.
Davies, C. L., Surridge, B. W. J., and Gooddy, D. C. (2014). Phosphate oxygen isotopes within aquatic ecosystems: Global data synthesis and future research priorities. Sci. Total Environ. 496, 563–575. doi:10.1016/j.scitotenv.2014.07.057
Deady, É., Mouchos, E., Goodenough, K., Williamson, B., and Wall, F. (2016). A review of the potential for rare-Earth element resources from European red muds: examples from seydişehir, Turkey and parnassus-giona, Greece. Mineral. Mag. 80 (1), 43–61. doi:10.1180/minmag.2016.080.052
Delgadillo-Velasco, L., Hernández-Montoya, V., Montes-Morán, M. A., Gómez, R. T., and Cervantes, F. J. (2020). Recovery of different types of hydroxyapatite by precipitation of phosphates of wastewater from anodizing industry. J. Clean. Prod. 242, 118564. doi:10.1016/j.jclepro.2019.118564
Dorozhkin, S. (2012). Dissolution mechanism of calcium apatites in acids: A review of literature. World J. Methodol. 26 (2), 1–17. doi:10.5662/wjm.v2.i1.1
Edmunds, W. M., and Smedley, P. L. (2013). “Fluoride in natural waters,” in Essentials of medical geology. Editors O. Selinus, B. Alloway, J. A. Centeno, R. B. Finkelman, R. Fuge, U. Lindhet al. Second Edition (Springer).
Eker, Ç. S., and Korkmaz, S. (2011). Mineralogy and whole rock geochemistry of late Cretaceous sandstones from the eastern Pontides (NE Turkey). njma. 188 (3), 235–256. doi:10.1127/0077-7757/2011/0202
Eriksson, A. K., Gustafsson, J. P., and Hesterberg, D. (2015). Phosphorus speciation of clay fractions from long-term fertility experiments in Sweden. Geoderma 241, 68–74. doi:10.1016/j.geoderma.2014.10.023
Eriksson, A. K., Hiller, S., Hesterberg, D., Klysubun, W., Ulén, B., and Gustafsson, J. P. (2016). Evolution of phosphorus speciation with depth in an agricultural soil profile. Geoderma 280, 29–37. doi:10.1016/j.geoderma.2016.06.004
Filippelli, G. M., Souch, C., Menounos, B., Slater-Atwater, S., Jull, A. J. T., and Slaymaker, O. (2006). Alpine lake sediment records of the impact of glaciation and climate change on the biogeochemical cycling of soil nutrients. Quat. Res. 66, 158–166. doi:10.1016/j.yqres.2006.03.009
Föllmi, K. B. (2016). Sedimentary condensation. Earth-Science Rev. 152, 143–180. doi:10.1016/j.earscirev.2015.11.016
George, T. S., Giles, C. D., Menezes-Blackburn, D., Condron, L. M., Gama-Rodrigues, A. C., Jaisi, D., et al. (2018). Organic phosphorus in the terrestrial environment: A perspective on the state of the art and future priorities. Plant Soil 427 (1-2), 191–208. doi:10.1007/s11104-017-3391-x
Giroto, A. S., Guimarães, G. G. F., Foschini, M., and Ribeiro, C. (2017). Role of slow-release nanocomposite fertilizers on nitrogen and phosphate availability in soil. Sci. Rep. 7, 46032. doi:10.1038/srep46032
Gooddy, D. C., Shand, P., Kinninurgh, D. G., and Van Riemsdijk, W. H. (1995). Field-based partition coefficients for trace elements in soil solutions. Eur. J. Soil Sci. 46 (2), 265–285. doi:10.1111/j.1365-2389.1995.tb01835.x
Grunsky, E. C. (2010). The interpretation of geochemical survey data. Geochem. Explor. Environ. Anal. 10, 27–74. doi:10.1144/1467-7873/09-210
Guidry, M. W., and Mackenzie, F. T. (2003). Experimental study of igneous and sedimentary apatite dissolution: Control of pH, distance from equilibrium, and temperature on dissolution rates. Geochim. Cosmochim. Acta 67 (16), 2949–2963. doi:10.1016/s0016-7037(03)00265-5
Harding, S. C., Nash, B. P., Petersen, E. U., Ekdale, A. A., Bradbury, C. D., and Dyar, M. D. (2014). Mineralogy and geochemistry of the main glauconite bed in the middle eocene of Texas: Paleoenvironmental implications for the verdine facies. PloS ONE 9 (2), 87656. doi:10.1371/journal.pone.0087656
Hare, J. (2011). A prospering society: Wiltshire in the later middle ages (studies in regional and local history). Hatfield: University of Hertfordshire Press.
Hughes, J. M., and Rakovan, J. F. (2015). Structurally robust, chemically diverse: Apatite and apatite supergroup minerals. Elements 11 (3), 165–170. doi:10.2113/gselements.11.3.165
Ilg, K., Siemens, J., and Kaupenjohann, M. (2003). Colloidal and dissolved phosphorus in sandy soils as affected by phosphorus saturation. J. Environ. Qual. 34, 926–935. doi:10.2134/jeq2004.0101
ISO International Standard (2018). “Water quality – determination of orthophosphate and total phosphorus contents by flow analysis (FIA and CFA),” in Part 2: Method by continuous flow analysis (CFA). Reference number ISO 15681-2:2018I.
Jarvie, H. P., Jurgens, M., Williams, R., Neal, C., Davies, J., Barrett, C., et al. (2005a). Role of river bed sediments as sources and sinks of phosphorus across two major eutrophic UK river basins: The Hampshire Avon and herefordshire wye. J. Hydrol. X. 304, 51–74. doi:10.1016/j.jhydrol.2004.10.002
Jarvie, H. P., Neal, C., Withers, P. J. A., Wescott, C., and Acornley, R. M. (2005b). Nutrient hydrochemistry for a groundwater-dominated catchment: The Hampshire Avon, UK. Sci. Total Environ. 344, 143–158. doi:10.1016/j.scitotenv.2005.02.012
Johnes, P. J., Foy, R., Butterfield, D., and Haygarth, P. M. (2007). Land use scenarios for England and wales: evaluation of management options to support ‘good ecological status’ in surface freshwaters. Soil Use Manag. 23, 176–194. doi:10.1111/j.1475-2743.2007.00120.x
Johnes, P. J., and Heathwaite, A. L. (1992). A procedure for the simultaneous determination of total nitrogen and total phosphorus in freshwater samples using persulphate microwave digestion. Water Res. 26, 1281–1287. doi:10.1016/0043-1354(92)90122-k
Johnes, P. J., Heathwaite, A. L., Spears, B. M., Brownlie, W. J., Elser, J. J., Haygarth, P. M., et al. (2022). “Chapter 5: Phosphorus and water quality,” in Our phosphorus future. Editors W. J. Brownlie, M. A. Sutton, K. V. Heal, D. S. Reay, and B. M. Spears (Edinburgh: UK Centre for Ecology & Hydrology).
Johnes, P. J., and Hodgkinson, R. A. (1998). Phosphorus loss from agricultural catchments: Pathways and implications for management. Soil Use Manag. 14, 175–185. doi:10.1111/j.1475-2743.1998.tb00637.x
Johnes, P. J. (2007). Uncertainties in annual riverine phosphorus load estimation: Impact of load estimation methodology, sampling frequency, baseflow index and catchment population density. J. Hydrol. X. 332, 241–258. doi:10.1016/j.jhydrol.2006.07.006
Lloyd, C. E. M., Johnes, P. J., Freer, J. E., Carswell, A. M., Jones, J. I., Stirling, M. W., et al. (2019). Determining the sources of nutrient flux to water in headwater catchments: Examining the speciation balance to inform the targeting of mitigation measures. Sci. Total Environ. 648, 1179–1200. doi:10.1016/j.scitotenv.2018.08.190
MacDonald, G. K., Jarvie, H. P., Withers, P. J. A., Doody, D. G., Keeler, B. L., Haygarth, P. M., et al. (2016). Guiding phosphorus stewardship for multiple ecosystem services. Ecosyst. Health Sustain. 2 (12), e01251. doi:10.1002/ehs2.1251
Mackay, E. B., Feuchtmayr, H., De Ville, M. M., Thackeray, S. J., Callaghan, N., Marshall, M., et al. (2020). Dissolved organic nutrient uptake by riverine phytoplankton varies along a gradient of nutrient enrichment. Sci. Total Environ. 722, 137837. doi:10.1016/j.scitotenv.2020.137837
Mainstone, C. P., and Parr, W. (2002). Phosphorus in rivers – ecology and management. Sci. Total Environ. 282–283, 25–47. doi:10.1016/s0048-9697(01)00937-8
Marsh, T. J., and Hannaford, J. (2008). Hydrometric register. Hydrological data UK series. Wallingford, UK: Centre for Ecology and Hydrology.
Marshall-Neill, G., and Ruffell, A. (2004). Authigenic phosphate nodules (Late Cretaceous, Northern Ireland) as condensed succession microarchives. Cretac. Res. 25, 439–452. doi:10.1016/j.cretres.2004.03.001
McDonough, W. F., and Sun, S.-s. (1995). The composition of the Earth. Chem. Geol. 120, 223–253. doi:10.1016/0009-2541(94)00140-4
McDowell, R. W., and Sharpley, A. N. (2001). Approximating phosphorus release from soils to surface runoff and subsurface drainage. J. Environ. Qual. 30, 508–520. doi:10.2134/jeq2001.302508x
McGinley, P. M., Masarik, K. C., Gotkowitz, M. B., and Mechenich, D. J. (2016). Impact of anthropogenic geochemical change and aquifer geology on groundwater phosphorus concentrations. Appl. Geochem. 72, 1–9. doi:10.1016/j.apgeochem.2016.05.020
Mouchos, E. M. (2021). Determination of the nature and origin of phosphorus in catchments underlain by Upper Greensand. PhD Thesis. Bristol: University of Bristol.
Oelkers, E. H., and Valsami-Jones, E. (2008). Phosphate mineral reactivity and global sustainability. Elements 4, 83–87. doi:10.2113/gselements.4.2.83
Otero, N., Vitòria, L., Soler, A., and Canals, A. (2005). Fertiliser characterisation: Major, trace and rare Earth elements. Appl. Geochem. 20, 1473–1488. doi:10.1016/j.apgeochem.2005.04.002
Oubagha, N., Lemlikchi, W., Sharrock, P., Fiallo, M., and Mecherri, M. O. (2016). Hydroxyapatite precipitation with hydron blue dye. J. Environ. Manage. 203, 807–810. doi:10.1016/j.jenvman.2016.09.039
Owens, P. N., Duzant, J. H., Deeks, L. K., Wood, G. A., Morgan, R. P. C., and Collins, A. J. (2007). Evaluation of contrasting buffer features within an agricultural landscape for reducing sediment and sediment-associated phosphorus delivery to surface waters. Soil Use Manag. 23 (1), 165–175. doi:10.1111/j.1475-2743.2007.00121.x
Penn, C. J., and Camberato, J. J. (2019). A critical review on soil chemical processes that control how soil pH affects phosphorus availability to plants. Agriculture 9, 120. doi:10.3390/agriculture9060120
Pingitore, N. E., and Engle, M. A. (2022). Compositional closure—its origin lies not in mathematics but rather in nature itself. Minerals 12, 74. doi:10.3390/min12010074
Rasmussen, B. (1996). Early-diagenetic REE-phosphate minerals (florencite, gorceixite, crandallite, and xenotime) in marine sandstones; a major sink for oceanic phosphorus. Am. J. Sci. 296, 601–632. doi:10.2475/ajs.296.6.601
Records, R. M., Wohl, E., and Arabi, M. (2016). Phosphorus in the river corridor. Earth-Science Rev. 158, 65–88. doi:10.1016/j.earscirev.2016.04.010
Riley, W. D., Potter, E. C. E., Biggs, J., Collins, A. L., Jarvie, H. P., Jones, J. I., et al. (2018). Small water bodies in Great Britain and Ireland: Ecosystem function, human-generated degradation, and options for restorative action. Sci. Total Environ. 645, 1598–1616. doi:10.1016/j.scitotenv.2018.07.243
Roberts, W. M., Stutter, M. I., and Haygarth, P. M. (2012). Phosphorus retention and remobilization in vegetated buffer strips: A review. J. Environ. Qual. 41, 389–399. doi:10.2134/jeq2010.0543
Sanematsu, K., Kon, Y., Imai, A., Watanabe, K., and Watanabe, Y. (2013). Geochemical and mineralogical characteristics of ion-adsorption type REE mineralization in Phuket, Thailand. Min. Depos. 48, 437–451. doi:10.1007/s00126-011-0380-5
Santana, I. V., Wall, F., and Botelho, N. F. (2015). Occurrence and behavior of monazite-(Ce) and xenotime-(Y) in detrital and saprolitic environments related to the Serra Dourada granite, Goiás/Tocantins State, Brazil: Potential for REE deposits. J. Geochem. Explor. 155, 1–13. doi:10.1016/j.gexplo.2015.03.007
Schafer, D., Donn, M., Atteia, O., Sun, J., MacRae, C., Raven, M., et al. (2018). Fluoride and phosphate release from carbonate-rich fluorapatite during managed aquifer recharge. J. Hydrology 562, 809–820. doi:10.1016/j.jhydrol.2018.05.043
Schafer, D., Sun, J., Jamieson, J., Siade, A., Atteia, O., Seibert, S., et al. (2021). Fluoride release from carbonate-rich fluorapatite during managed aquifer recharge: Model-based development of mitigation strategies. Water Res. 193. 116880. doi:10.1016/j.watres.2021.116880
Schoumans, O. F., Bouraoui, F., Kabbe, C., Oenema, O., and van Dijk, K. C. (2015). Phosphorus management in Europe in a changing world. Ambio 44, 180–192. doi:10.1007/s13280-014-0613-9
Skalar Analytical, V. B. (2014). Skalar methods – analysis: Ortho phosphate/(total phosphate). Netherlands: Breda. Catnr. 503-382w/r (+P3) issue 080714/MH/99290607.
Smith, R. A., Alexander, R. B., and Schwarz, G. E. (2003). Natural background concentrations of nutrients in streams and rivers of the conterminous United States. Environ. Sci. Technol. 37 (14), 3039–3047. doi:10.1021/es020663b
Smith, V. H., and Schindler, D. W. (2009). Eutrophication science: where do we go from here? Trends Ecol. Evol. 24 (4), 201–207. doi:10.1016/j.tree.2008.11.009
Soley, R. W. N., Power, T., Mortimore, R. N., Shaw, P., Dottridge, J., Bryan, G., et al. (2012). Modelling the hydrogeology and managed aquifer system of the Chalk across Southern England. Groundw. Resour. Model. Case Stud. U. K. 364, 129–154. doi:10.1144/sp364.10
Stamatakis, M. G. (2004). Phosphate deposits of Neogene age in Greece. Mineralogy, geochemistry and genetic implications. Geochemistry 64, 329–357. doi:10.1016/j.chemer.2003.11.005
Stuart, M. E., and Lapworth, D. J. (2016). Macronutrient status of UK groundwater: Nitrogen, phosphorus and organic carbon. Sci. Total Environ. 572, 1543–1560. doi:10.1016/j.scitotenv.2016.02.181
Syversen, N., and Borch, H. (2005). Retention of soil particle fractions and phosphorus in cold-climate buffer zones. Ecol. Eng. 25, 382–394. doi:10.1016/j.ecoleng.2005.06.005
Tõnsuaadu, K., Gross, K. A., Plūduma, L., and Veiderma, M. (2012). A review on the thermal stability of calcium apatites. J. Therm. Anal. Calorim. 110 (2), 647–659. doi:10.1007/s10973-011-1877-y
Tubb, P. C. (2009). The bronze age-iron age transition in the vale of Pewsey, wiltshire. PhD Thesis. Bristol: University of Bristol.
Valsami-Jones, E., Ragnarsdottir, K. V., Putnis, A., Bosbach, D., Kemp, A. J., and Cressey, G. (1998). The dissolution of apatite in the presence of aqueous metal cations at ph 2-7. Chem. Geol. 151 (1-4), 215–233. doi:10.1016/s0009-2541(98)00081-3
Weeks, J. J., and Hettiarachchi, G. M. (2019). A review of the latest in phosphorus fertilizer technology: Possibilities and Pragmatism. J. Environ. Qual. 48, 1300–1313. Special Section. Celebrating the 350th anniversary of discovering phosphorus-for better or worse. doi:10.2134/jeq2019.02.0067
White, P. J., and Hammond, J. P. (2009). The sources of phosphorus in the waters of Great Britain. J. Environ. Qual. 38 (1), 13–26. doi:10.2134/jeq2007.0658
Whitehead, P. G., Jin, L., Crossman, J., Comber, S., Johnes, P. J., Daldorph, P., et al. (2014). Distributed and dynamic modelling of hydrology, phosphorus and ecology in the Hampshire Avon and Blashford Lakes: Evaluating alternative strategies to meet WFD standards. Sci. Total Environ. 481, 157–166. doi:10.1016/j.scitotenv.2014.02.007
Withers, P. J. A., May, L., Jarvie, H. P., Jordan, P., Doody, D., Foy, R. H., et al. (2012). Nutrient emissions to water from septic tank systems in rural catchments: Uncertainties and implications for policy. Environ. Sci. Policy 23, 71–82. doi:10.1016/j.envsci.2012.07.023
Woods, M. A., Wilkinson, I. P., Lott, G. K., Booth, K. A., Farrant, A. R., Hopson, P. M., et al. (2008). A reappraisal of the stratigraphy and depositional development of the Upper Greensand (Late Albian) of the Devizes district, southern England. Proc. Geologists'. Assoc. 119, 229–244. doi:10.1016/s0016-7878(08)80303-3
Yates, C. A., and Johnes, P. J. (2013). Nitrogen speciation and phosphorus fractionation dynamics in a lowland Chalk catchment. Sci. Total Environ. 444, 466–479. doi:10.1016/j.scitotenv.2012.12.002
Yates, C. A., Johnes, P. J., and Spencer, R. G. M. (2016). Assessing the drivers of dissolved organic matter export from two contrasting lowland catchments, U.K. Sci. Total Environ. 569 (570), 1330–1340. doi:10.1016/j.scitotenv.2016.06.211
Yates, C. A., Johnes, P. J., and Spencer, R. G. M. (2019). Characterisation of treated effluent from four commonly employed wastewater treatment facilities: a UK case study. J. Environ. Manag. 232, 919–927. doi:10.1016/j.jenvman.2018.12.006
Zang, L., Tian, G.-M., Liang, X.-Q., He, M.-M., Bao, Q.-B., and Yao, J. H. (2013). Profile distributions of dissolved and colloidal phosphorus as affected by degree of phosphorus saturation in paddy soil. Pedosphere 23 (1), 128–136. doi:10.1016/s1002-0160(12)60088-5
Zhang, M., Li, C., Li, Y. C., and Harris, W. G. (2014). Phosphate minerals and solubility in native and agricultural calcareous soils. Geoderma 232-234, 164–171. doi:10.1016/j.geoderma.2014.05.015
Keywords: geochemical cycling, aquifers, phosphorus, apatite, eutrophication
Citation: Mouchos EM, Johnes PJ, Buss HL, Bingham ST, Matthews D, Bagnall JP and Gooddy DC (2022) Geochemical cycling in aquifers contributes to the transport, storage and transfer of anthropogenically-derived phosphorus to surface waters. Front. Environ. Sci. 10:932566. doi: 10.3389/fenvs.2022.932566
Received: 29 April 2022; Accepted: 27 July 2022;
Published: 19 September 2022.
Edited by:
Zhongqi He, United States Department of Agriculture, United StatesReviewed by:
Biao Wan, University of Tübingen, GermanyAndrew W. Rate, University of Western Australia, Perth, Australia
Copyright © 2022 Mouchos, Johnes, Buss, Bingham, Matthews, Bagnall and Gooddy. This is an open-access article distributed under the terms of the Creative Commons Attribution License (CC BY). The use, distribution or reproduction in other forums is permitted, provided the original author(s) and the copyright owner(s) are credited and that the original publication in this journal is cited, in accordance with accepted academic practice. No use, distribution or reproduction is permitted which does not comply with these terms.
*Correspondence: Evangelos M. Mouchos, evangelos.mouchos@bristol.ac.uk