Disaster cassification net: A disaster classification algorithm on remote sensing imagery
 Jianye Yuan
 Xinwang Ding1*
 - 1School of Electronic Information, Wuhan University, Wuhan, China
- 2The Second Clinical Medical College, Jinan University, Shenzhen, China
- 3School of Electrical Engineering, Xinjiang University, Urumqi, China
As we all know, natural disasters have a great impact on people’s lives and properties, and it is very necessary to deal with disaster categories in a timely and effective manner. In light of this, we propose using tandem stitching to create a new Disaster Cassification network D-Net (Disaster Cassification Net) using the D-Conv, D-Linear, D-model, and D-Layer modules. During the experiment, we compared the proposed method with “CNN” and “Transformer”, we found that disaster cassification net compared to CNN algorithm Params decreased by 26–608 times, FLOPs decreased by up to 21 times, Precision increased by 1.6%–43.5%; we found that disaster cassification net compared to Transformer algorithm Params decreased by 23–149 times, FLOPs decreased by 1.7–10 times, Precision increased by 3.9%–25.9%. Precision increased by 3.9%–25.9%. And found that disaster cassification net achieves the effect of SOTA(State-Of-The-Art) on the disaster dataset; After that, we compared the above-mentioned MobileNet_v2 with the best performance on the classification dataset and CCT network are compared with disaster cassification net on fashion_mnist and CIFAR_100 public datasets, respectively, and the results show that disaster cassification net can still achieve the state-of-the-art classification effect. Therefore, our proposed algorithm can be applied not only to disaster tasks, but also to other classification tasks.
1 Introduction
Natural disasters refer to natural phenomena that can cause damage to human production and life, including drought, high temperature, low temperature, cold wave, flood and volcanic eruption, etc. (Botzen et al., 2020). Traditional natural disaster detection techniques frequently ignore many natural disasters in various surroundings in favor of detecting a single natural disaster in a particular situation and location. For instance, literature (Barmpoutis et al., 2020) proposed a system to detect forest fires using remote sensing images in real time; literature (Wang and Xu, 2010) proposed a method to track changes in the severity of forest damage following hurricane disasters using remote sensing images; literature (Saad et al., 2021) proposed an earthquake monitoring framework based on deep learning with an algorithm that can be used in four different seismic zones; The literature (Anusha and Bharathi, 2020) monitors flood dangers in real time using wireless sensor networks, whereas the literature (Al Qundus et al., 2020) employs radar and optical data to detect and map flood hazards. In conclusion, we examine the uncertainty and vast scale of natural disaster occurrence, we classify the primary natural hazards in real time, and monitoring is essential. Traditional natural disaster monitoring are monitored in a specific environment for a single catastrophe hazards.
According to the guideline for the loss of people’s life safety from natural disasters issued by the state, we selected the four types of natural disasters with the greatest impact for classification, including hurricanes, earthquakes, floods, and fires. Our contributions are listed as follows:
(1) The modules for the D-Layer and D-model are proposed;
(2) Combining four components, D-Conv, D-model, D-Layer and D-Linear, in tandem to form the D-Net disaster classification algorithm;
(3) Experiments are conducted with natural disaster datasets and two public datasets to demonstrate the effectiveness and generalization ability of our algorithm.
2 Convolutional neural networks and transformers
Deep learning has quickly gained popularity and has produced numerous promising outcomes in areas as image segmentation (Zhu et al., 2022) and classification (Yuan et al., 2022). We used the deep learning method, and the later experiments mainly compared the CNN(Convolutional Neural Networks) (Sun et al., 2021) model and Transformer (Han et al., 2021) model. The CNN and Transformers algorithms will be introduced respectively in the following.
2.1 Convolutional neural networks
CNN is a variant of MLP (Multilayer Perceptron) (Tolstikhin et al., 2021) It is a feedforward neural Network model consisting of learnable weights and bias constants of neurons. In the process of feature extraction, common CNN includes Convolutional layer, Rectified linear units layer, Pooling layer, and Fully-connected layer. Convolutional layer is a three-dimensional feature extractor. Each filter trains a depth, and the features of multiple units are trained through multiple filters, so as to achieve the purpose of feature extraction. In addition, it is characterized by weight and parameter sharing. Pooling layer is a downsampling process, which aims to reduce feature maps and generally includes Max Pooling, Mean Pooling (Zeng et al., 2019), Gauss Pooling (Kobayashi, 2019), etc. The Fully-connected layer acts as a classifier in the whole CNN and converts the previous layer of convolution into 1 × 1 convolution, and it can be replaced by the convolution layer in practical work. CNN is composed of input layer, hidden layer, and output layer. The input layer and output layer only contain one layer, while the hidden layer can be composed of multiple layers. Therefore, the simplest MLP is composed of three layers, as shown in Figure 1.

FIGURE 1. The simplest MLP model structure.
The modern neural Networks mainly stem from the proposal of AlexNet (Zhu et al., 2021) model in 2012, which makes many scientists start to use convolutional neural Networks to solve image problems. Meanwhile, the 3*3 convolution kernel proposed by VGG (Ding et al., 2021) reduced the running time of the model; GoogleNet (Ran et al., 2021) improved the complexity of the model by increasing the width of the model; ResNet (Wightman et al., 2021) proposed in 2016 solved the phenomenon of gradient disappearance and explosion, and further accelerated the development of neural Network. In 2018, SENet (HermineMariette et al., 2021) model was proposed to make the model focus on important parts. With the proposal of EfficientNet (Tan and Le, 2019) and RegNet (Mahbub et al., 2021), deep learning has been developing in image processing tasks and has become a widely accepted technology among scientists.
2.2 Transformers
With the continuous development of CNN Network model, researchers, through in-depth research on the attention mechanism in CNN, found that only attention mechanism (Mormann and Russo, 2021) can be used to carry out machine translation, image classification, and other operations on the Network, without using other modular layer structures of CNN. Therefore, more and more researchers pay attention to the attention mechanism, and Transformer is the best attention mechanism module. Transformer, as a rising star of artificial intelligence, emerged as a result of the application of Google’s BERT model (Tenney et al., 2019) to NLP (Natural Language Processing) (KangCai et al., 2020) tasks in 2019 and achieved remarkable results in machine translation tasks. As shown in Figure 2.
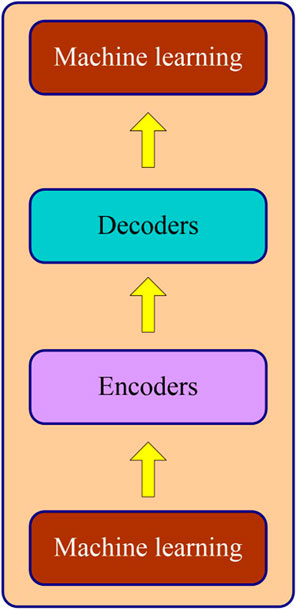
FIGURE 2. Transformer model structure diagram.
With the continuous development of Transformer, many Transformer models have been proposed, such as albert algorithm (GOH et al., 2021), beit algorithm (Lev et al., 2021), deit algorithm (Maurice et al., 2021), vit algorithm (Yuan et al., 2021), and swin algorithm (Liu et al., 2021). This model not only shows satisfactory results in the field of NLP (Cambria and White, 2014) but also achieves satisfactory results in the image classification processing. Therefore, we further optimized the algorithm in the experimental environment and compared it with Transformer, and concluded that our D-Net algorithm had a better classification processing effect and portability.
3 Related work
In view of the continuous development of deep learning and the impact of disasters on people’s life and property, we proposed a new classification Network D-Net for disaster classification tasks. Among them, D-Net is composed of D-Model, D-ConV, D-Layer and D-Linear, the important part of which is D-Model.
3.1 D-model
In order to improve the superiority of D-Net Network, we proposed a D-Model module, which was composed of six convolutional layers and connected with each other through two jump connections, as shown in Figure 3. It can be found that the D-Model was divided into three parts, namely One-part, Two-part, and Three-part. The One-part consisted of two 1 × 1 convolution, a 3 × 3 deep convolution (Guo et al., 2019), three BN (Batch Normalization) layers (Bjorck Gomes et al., 2018), and a ReLU6 activation function (Zou et al., 2020). The output X value was directly added to the output M directly through the short connection on the channel dimension, and the output Y value was obtained; after that, in the Two-part, which was composed of two 1 × 1 convolution and ReLU6 and Sigmoid activation function (Hanna and Kaiser, 2021), the Two-part input value Y was added to the output value Q in the channel dimension to obtain the output characteristic graph N. Finally, the Three-part was composed of a 1 × 1 deep convolution and a BN layer.
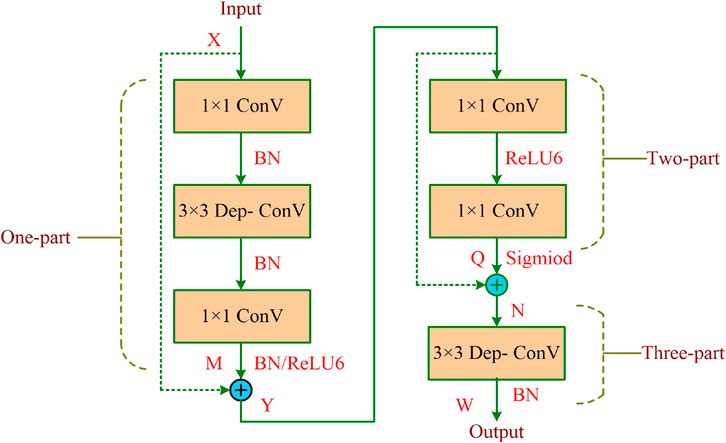
FIGURE 3. D-model module structure diagram.
3.2 D-Net
We open the network structure for building the model from the foundation, the D-Net Network structure is shown in Table 1, which consists of one D-ConV, four D-Model modules, one D-Layer, and one D-Linear. The D-layer consists of One-part and Two-part of the D-Model. Dep-Conv denotes deep convolution, where the number of groups of each Dep-ConV is set to be the same as the number of input channels. Since BN layer and activation function do not change the size of input and output images of the algorithm, Input Size and Output Size in Table 1 both represent the size of input and output images of the convolution layer. Since D-Model contains six convolution layers and D-layer contains five convolution layers, excluding Linear, the full connection layer, D-Net Network has a total of 30 layers. Subsequent experiments verify that the algorithm performs well on disaster data sets, so the D-Net proposed by us is suitable for disaster classification tasks.
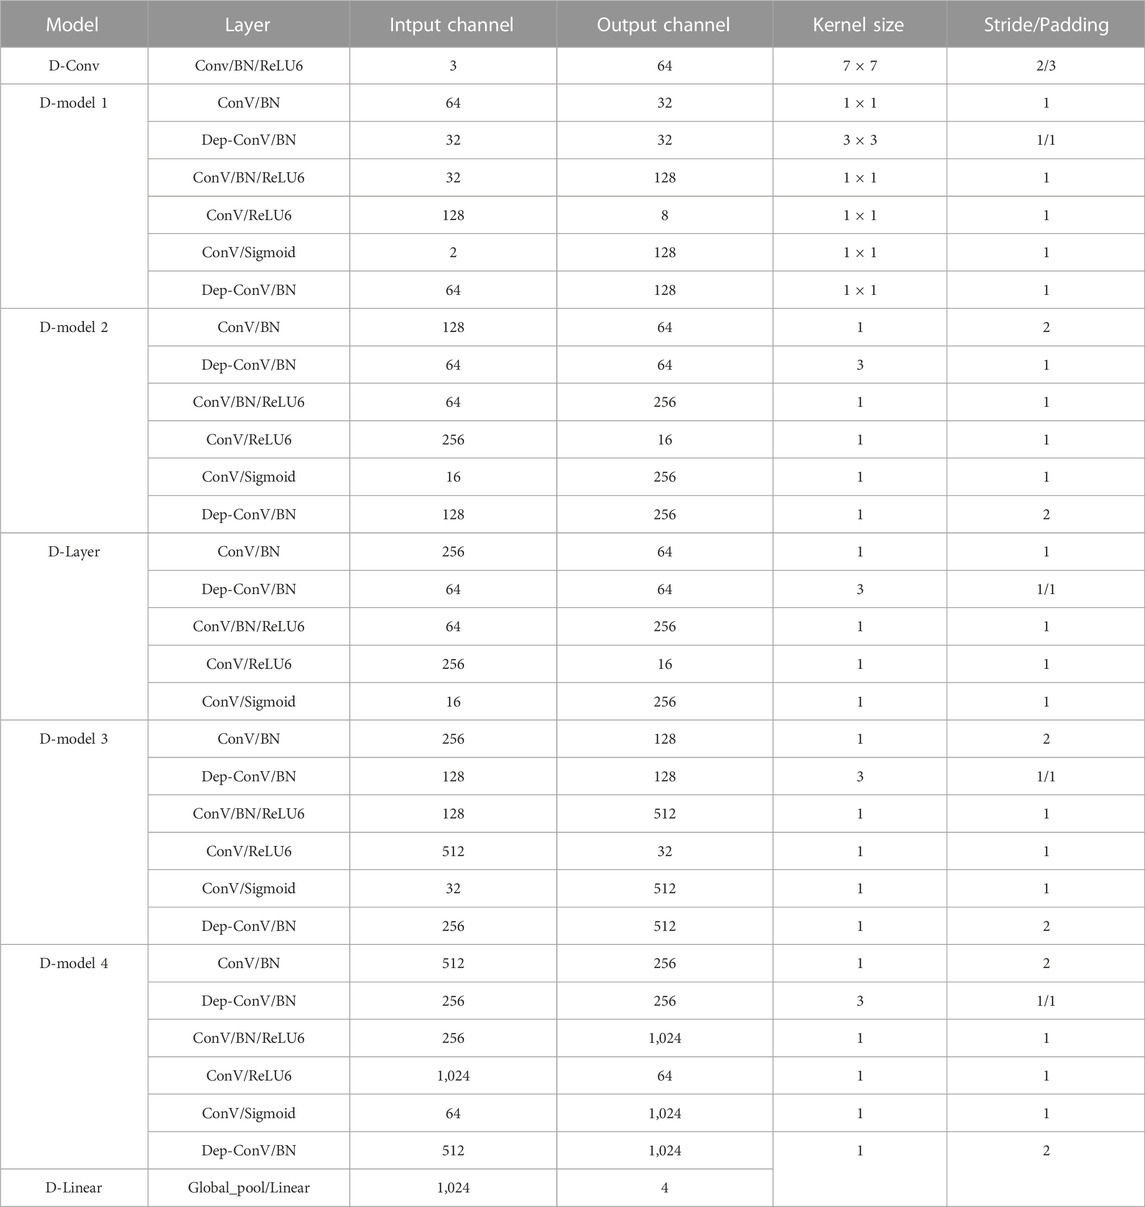
TABLE 1. D-Net Network structure table.
At the same time, we visualize the D-Net network structure, as shown in Figure 4, where each layer of the model is labeled with modules using the output, and by comparison with Table 1, we can find that the D-Module and D-Layer only differ by the last layer “ConV/Sigmoid”, Our algorithm inputs an image and outputs a class of images after feature extraction by each model. At the same time, Figure 4 can better show the algorithm flow of D-Net network structure.
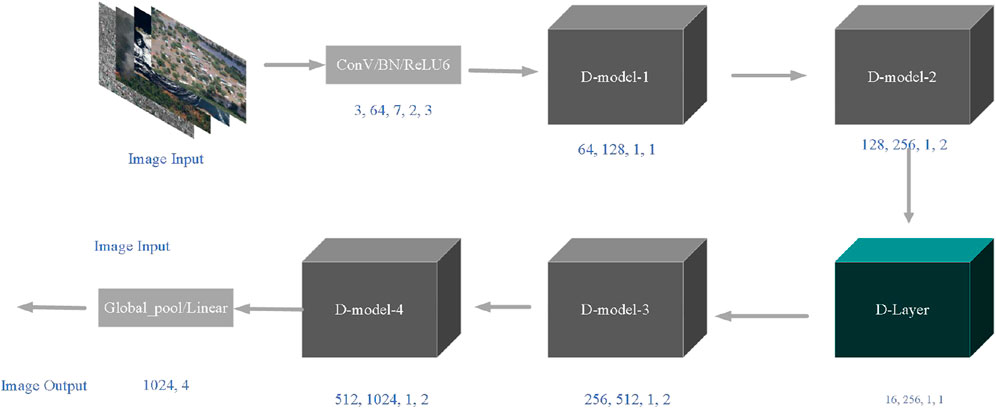
FIGURE 4. D-Net visualization network structure diagram.
4 Experiment procedure
4.1 Lab environment
Our experiment was carried out on ubuntu20.04 system with version 10.1.243 cuda, version 1.7.1 Pytorch and version 3.10 Python. The batch size was 32 and .57 m for each iteration. The dataset was from the kaggle competition dataset (Cyclone, 2021) and the State Key Laboratory of Information Engineering in Surveying, Mapping and Remote Sensing of Wuhan University, with a total of 9,792 pieces. Among them, there were 7,791 in training sets and 2,001 in test sets. For each type of disaster training test, the number of images in training sets accounted for 80% and the number of images in test sets accounted for 20%. The horizontal and vertical resolution of disaster images were 96dpi and the bit depth was 24. Among them, the image output and input size was 224 × 224, the iteration cycle was 100 times, the optimizer was SGD (Woodworth et al., 2020), the initial learning rate was .01, and weight_decay was set to .0004.
4.2 Evaluation indicators
In order to optimize the effect of the data visualization model, the evaluation indicators we selected included confusion matrix (Chicco et al., 2021), accuracy curve, loss function curve, precision rate (top1, top3, and top5) (MitchellBillingsley et al., 2021) and recall rate (Zhong et al., 2021). Confusion matrix is to place all the forecast results and real results of the model in a unified table, and the number of correct and wrong recognition classes can be intuitively displayed through the table using supervised learning method. As shown in Table 2, TP represents that the real result is positive and the forecast result is positive; FN represents that the real result is negative and the forecast result is negative; FP means that the real result is negative and the forecast result is positive; TN means that the real result is positive and the forecast result is negative. Each blank represents the number of categories in this case.
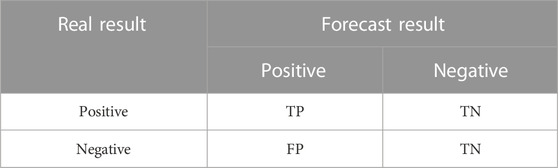
TABLE 2. Confusion matrix classification table.
Among them, Accuracy, Precision, Recall formulas and F1 values are shown in Formula Eqs. 1–4 respectively. Precision reflects the correct number of images detected by the algorithm; Recall reflects the number of images of all the correct categories detected; F1 value is the result of Precision and Recall weighted harmonic averaging.
4.3 Experimental comparison
In order to demonstrate the effect of D-Net algorithm, we compared it with CNN algorithm and Transformer respectively, so as to verify the effect of D-Net algorithm through different experimental effects.
4.3.1 Convolutional neural networks experimental comparison
First, it can be seen from Table 3 that this paper compared the algorithm model D-Net with the CNN models MobileNet_v2 (Zhang and Ding, 2020), ResNet152, MnasNet1_3 (Tan et al., 2019), SqueezeNet1_1 (Koonce, 2021), Efficient_b7 (Wang et al., 2021), and VovNet57a (Su et al., 2022). It can be found that FLOPs and Params are much lower than other algorithm models. The FLOPs of D-Net are close to MnasNet1_3, but Params are 107 times less than MnasNet1_3. Compared with Precision, it is found that the Precision of MnasNet1_3 is only .508, which is not suitable for classifying disaster tasks. D-Net is still far ahead in Precision, which is higher than other algorithm models and has a better classification effect. Therefore, it is concluded that the D-Net algorithm model proposed in this paper has better classification processing ability than the CNN algorithm model.
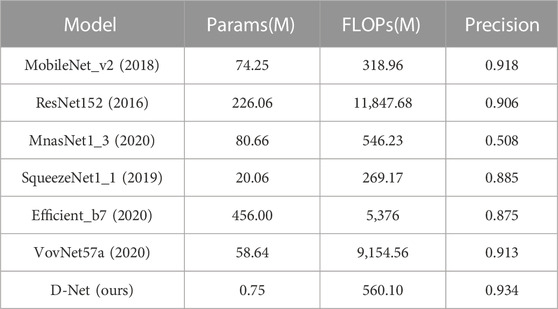
TABLE 3. Comparison of D-Net and CNN model data. MobileNet, MnasNet, SqueezeNet, and Efficient are lighter modeling methods, while ResNet and VovNet are among the better performing methods.
4.3.2 Transformer experimental comparison
In order to further verify the algorithm effect, the D-Net was compared with the Transformer algorithm ViT, DeepViT (Zhou et al., 2021), CaiT (Martín Sujo et al., 2021), CCT (Tang et al., 2021), PiT (Abdulai and Sharifzadeh, 2021), LeViT (Levit and Malenko, 2011) and CvT (Wu et al., 2021) models. It can be seen from Table 4 that D-Net is lower in FLOPs and Params than other models, and its FLOPs are generally 5 to 10 times lower than the Transformer model; Params is generally more than 20 times lower than the Transformer model. Compared with LeViT with the smallest FLOPs and Params of the Transformer model, D-Net is still 435M lower than the LeViT algorithm model in FLOPs; its Params are nearly 20 times lower than the LeViT algorithm model. On Precision, D-Net is about 5% higher than the Transformer model, and the Precision of DeepViT and CCT is only .686 and .675, which is not suitable for disaster classification tasks. Therefore, the algorithm model D-Net in this paper is more suitable for disaster classification tasks than the Transformer model.
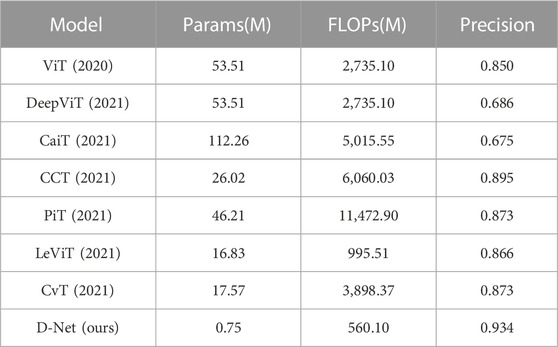
TABLE 4. D-Net and Transformer algorithm model data comparison. While ViT, DeepViT, CaiT, and PiT are more cutting-edge approaches with superior experimental performance, CCT, LeViT, and CvT are lighter ways.
It can be seen from Figure 5 and Figure 6 that the Accuracy and Loss of the D-Net algorithm tend to be stable after 100 iterations, which proves that it is effective to set the number of iterations to 100 in our experiments. In addition, according to the confusion matrix in Figure 7, it can be seen that Flood has the highest number of correct identifications, followed by Wildfire, Earthquake, and Cyclone. The algorithm model misidentified Earthquake as Flood 33 times; Flood was misidentified as Earthquake 23 times; Wildfire was misidentified as Flood 22 times; Flood was misidentified as Wildfire 10 times, and other misidentification rates are lower. As can be seen from Figure 8, the ROC curve of our algorithm performs well, and the effect of AUC reaches .993. This proves that the data in this paper is highly effective, and further verifies that D-Net is suitable for application in disaster classification task processing.
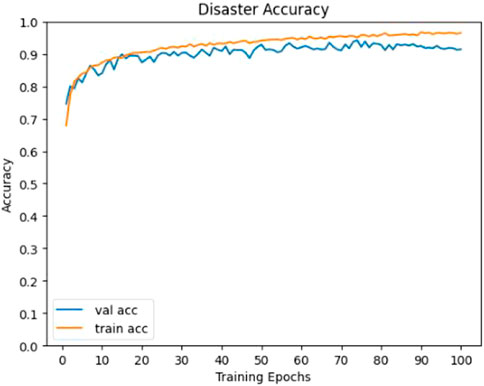
FIGURE 5. D-Net algorithm Accuracy curve.
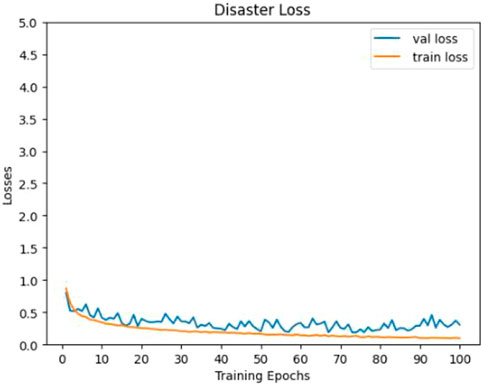
FIGURE 6. D-Net algorithm Loss curve.
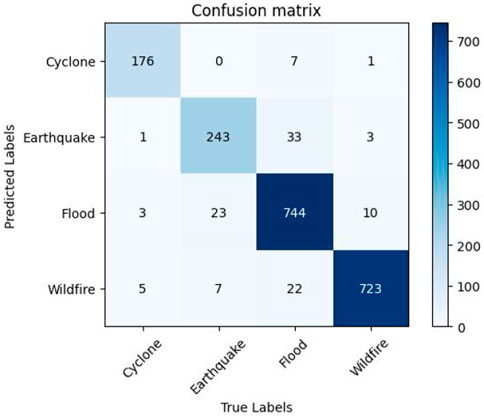
FIGURE 7. D-Net algorithm confusion matrix diagram.
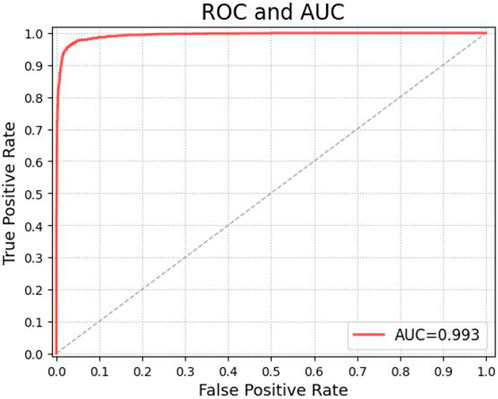
FIGURE 8. D-Net algorithm ROC and AUC curves.
4.4 Public datasets
To further verify the generalization ability of the D-Net algorithm model, we used the fashion_mnist dataset (Khanday et al., 2021) and the cifar_100 dataset (Hirose et al., 2022) for further experiments.
4.4.1 fashion_mnist
The fashion_mnist dataset contains ten data categories, of which there are 60,000 images in training sets and 10,000 in test sets, and each image is 28 × 28 in size, width and height are both 28 pixels. All of the images are in “png” format and are categorized as follows: “T-shirt/top,” “Trouser,” “Pullover,” “Dress,” “Coat,” “Sandal,” “Shirt,” “Sneaker,” “Bag,” and “Ankle boot.” We compared the MobileNet_v2 with better performance in Table 3 and the CCT algorithm model with better performance in Table 4 with D-Net respectively. It can be seen from Table 5 that in terms of Recall and F1 values, D-Net and MobileNet_v2 are basically the same, slightly better than CCT; in terms of accuracy Top-1, Top-3, and Top-5, D-Net is still basically the same as MobileNet_v2 and performs better than the CCT algorithm model. It is concluded that the algorithm model D-Net proposed in this paper has a good generalization ability on the fashion_mnist dataset, and there is no abnormal situation, which is suitable for application in other classification tasks.

TABLE 5. Data comparison of D-Net on fashion_mnist.
4.4.2 cifar_100
The cifar_100 dataset contains 100 categories of images, and each category has 600 three-channel color images of size 32 × 32, including 50,000 for the training set and 10,000 for the test set. We use the cifar_100 (http://www.cs.toronto.edu/∼kriz/cifar.html) dataset from the public data of the official website, width and height are both 32pixels. It can be seen from Table 6 that D-Net is basically the same as CCT in terms of Recall, F1 value and Top-1, and CCT is about 4% higher than Top-3 and Top-5. The comprehensive cost performance shows that D-Net is slightly better than CCT algorithm model. Compared with MobileNet_v2, D-Net is basically the same in Recall, F1 value, Top-1, Top-3 and Top-5, and the impact on the algorithm model is almost negligible. Considering the performance of D-Net on public datasets, it can be concluded that D-Net does not have large abnormal classification errors. Therefore, the D-Net proposed in this paper has good stability and robustness, and is suitable for application in other classification tasks.
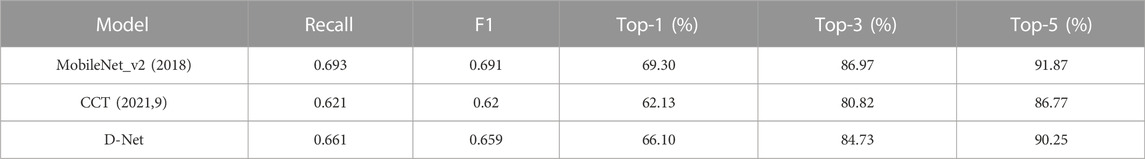
TABLE 6. Data comparison of D-Net on cifar_100.
5 Conclusion
With the increasing number of natural disasters, it is very important to classify and deal with the disasters effectively. Therefore, we propose a fast and efficient disaster classification network D-Net. We compared “CNN” and found that D-Net not only reduced FLOPs and Params by more than 100 times, but also maintained a high classification accuracy; compared with “Transformer” network, we found that D-Net’s FLOPs and Params were reduced by more than 20 times, it Precision is about 5% higher than the “Transformer” model. In addition, we conducted experiments on the public datasets fashion_mnist and cifar_100. We compared the two networks MobileNet_v2, CCT and D-Net, which performed the best on the disaster dataset, and found that D-Net still has a good classification effect. Therefore, we can conclude that the D-Net network is not only suitable for disaster datasets, but also for other classification tasks, with high generalization and portability.
Data availability statement
The original contributions presented in the study are included in the article/Supplementary Materials, further inquiries can be directed to the corresponding author.
Author contributions
JY: wrote the paper, programmed the paper code, etc. XD: provided funding support and reviewed the paper. FL: embellished the language and modified the format of the paper. XC: to review the format of the thesis, etc.
Conflict of interest
The authors declare that the research was conducted in the absence of any commercial or financial relationships that could be construed as a potential conflict of interest.
The handling editor YL declared a shared affiliation with the authors JY and XD at the time of review.
Publisher’s note
All claims expressed in this article are solely those of the authors and do not necessarily represent those of their affiliated organizations, or those of the publisher, the editors and the reviewers. Any product that may be evaluated in this article, or claim that may be made by its manufacturer, is not guaranteed or endorsed by the publisher.
References
Abdulai, M., and Sharifzadeh, M. (2021). Probability methods for stability design of open pit rock slopes: An overview. J. Geosci. 11 (8), 319. doi:10.3390/geosciences11080319
Al Qundus, J., Dabbour, K., Gupta, S., Meissonier, R., and Paschke, A. (2020). Wireless sensor network for AI-based flood disaster detection. Ann. Operations Res. 319, 697–719. doi:10.1007/s10479-020-03754-x
Anusha, N., and Bharathi, B. (2020). Flood detection and flood mapping using multi-temporal synthetic aperture radar and optical data. Egypt. J. Remote Sens. Space Sci. 23 (2), 207–219. doi:10.1016/j.ejrs.2019.01.001
Barmpoutis, P., Papaioannou, P., Dimitropoulos, K., and Grammalidis, N. (2020). A review on early forest fire detection systems using optical remote sensing. Sensors 20 (22), 6442. doi:10.3390/s20226442
Bjorck, N., Gomese, C. P., Selman, B., and Weinberger, K. Q. (2018). Understanding batch normalization. Adv. neural Inf. Process. Syst. 31.
Botzen, W. W., Deschenes, O., and Sanders, M. (2020). The economic impacts of natural disasters: A review of models and empirical studies. Rev. Environ. Econ. Policy 19 (1093), 167–188. doi:10.1093/reep/rez004
Cambria, E., and White, B. (2014). Jumping NLP curves: A review of natural Language Processing research [review article]. IEEE Comput. Intell. Mag. 9 (2), 48–57. doi:10.1109/mci.2014.2307227
Chicco, D, Warrens, M. J., and Jurman, G (2021). The coefficient of determination R-squared is more informative than SMAPE, MAE, MAPE, MSE and RMSE in regression analysis evaluation. PeerJ Comput. Sci. 7, e623. doi:10.7717/peerj-cs.623
Aswin, G., Cyclone, Wildfire, Flood and earthquake[EB/OL](2021-3-30), https://www.kaggle.com/aswin1871/cyclonewildfireflood-and-earthquake.
Ding, X., Zhang, X., Ma, N., Han, J., Ding, G., and Sun, J. (2021). Repvgg: Making vgg-style convnets great again,” in Proceedings of the IEEE/CVF conference on computer vision and pattern recognition, 13733–13742. New Orleans, LA, USA.
Goh, T. S., Henry, H., and Albert, A. (2021). Determinants and prediction of the stock market during COVID-19: Evidence from Indonesia. J. Asian Finance, Econ. Bus. 8 (1), 1–6. doi:10.13106/JAFEB.2021.VOL8.NO1.001
Guo, Y., Li, Y., Wang, L., and Rosing, T. (2019, July). Depthwise convolution is all you need for learning multiple visual domains. In Proc. AAAI Conf. Artif. Intell. (Vol. 33, No. 1, pp. 8368–8375). doi:10.1609/aaai.v33i01.33018368
Han, K., Xiao, A., Wu, E., Guo, J., Xu, C., and Wang, Y. (2021). Transformer in transformer. Adv. Neural Inf. Process. Syst. 34, 15908–15919. doi:10.48550/arXiv.2103.00112
Hanna, M. H., and Kaiser, A. M. (2021). Update on the management of sigmoid diverticulitis. World J. gastroenterology 27 (9), 760–781. doi:10.3748/wjg.v27.i9.760
Hermine, O., Mariette, X., Tharaux, P. L., Resche-Rigon, M., Porcher, R., Ravaud, P., et al. (2021). Effect of tocilizumab vs usual care in adults hospitalized with COVID-19 and moderate or severe pneumonia: A randomized clinical trial. JAMA Intern. Med. 181 (1), 32–40. doi:10.1001/jamainternmed.2020.6820
Hirose, K., Yu, J., Ando, K., Okoshi, Y., and Suzuki, J. (February 2022). Hiddenite: 4K-PE hidden network inference 4D-tensor engine exploiting on-chip model construction achieving 34.8-to-16.0 TOPS/W for CIFAR-100 and ImageNet, Proceedings of the 2022 IEEE international solid-state circuits conference (ISSCC). 1–3. San Francisco, CA, USA.
Kang, Y., Cai, Z., Tan, C. W., Huang, Q., and Liu, H. (2020). Natural language processing (NLP) in management research: A literature review. J. Manag. Anal. 7 (2), 139–172. doi:10.1080/23270012.2020.1756939
Khanday, O. M., Dadvandipour, S., and Lone, M. A. (2021). Effect of filter sizes on image classification in CNN: A case study on CFIR10 and fashion-MNIST datasets. IAES Int. J. Artif. Intell. 10 (4), 872. doi:10.11591/ijai.v10.i4.pp872-878
Kobayashi, T. (2019). Gaussian-based pooling for convolutional neural Networks. Adv. Neural Inf. Process. Syst. 32.
Koonce, B. (2021), SqueezeNet, Convolutional Neural Networks with Swift for Tensorflow, Springer, Berlin, Germany, 73–85.
Lev, A., Lee, Y. N., Sun, G., Hallumi, E., Simon, A. J., Zrihen, K. S., et al. (2021). Inherited SLP76 deficiency in humans causes severe combined immunodeficiency, neutrophil and platelet defects. J. Exp. Med. 218 (3), e20201062. doi:10.1084/jem.20201062
Levit, D., and Malenko, N. (2011). Nonbinding voting for shareholder proposals. J. Finance 66 (5), 1579–1614. doi:10.1111/j.1540-6261.2011.01682.x
Liu, Z., Lin, Y., Cao, Y., Hu, H., Wei, J., Zhang, Z., et al. (2021). “Swin transformer: Hierarchical vision transformer using shifted windows,” inProceedings of the IEEE/CVF international conference on computer vision, 10012–10022. Seoul, Korea
Mahbub, M., Biswas, M., Miah, A. M., Shahabaz, A., and Kaiser, M. S. (2021). “Covid-19 detection using chest x-ray images with a regNet structured deep learning model,” in Proceedings of the International conference on applied intelligence and Informatics (Cham: Springer), Nottingham, UK 358–370.
Martín Sujo, J. C., Golobardes i Ribe, E., and Vilasis Cardona, X. (2021). Cait: A predictive tool for supporting the book market operation using social networks. Appl. Sci. 12 (1), 366. doi:10.3390/app12010366
Maurice, S., Wiens, R. C., Bernardi, P., Caïs, P., Robinson, S., Nelson, T., et al. (2021). The SuperCam instrument suite on the Mars 2020 rover: Science objectives and Mast-Unit description. Space Sci. Rev. 217 (3), 1–108. doi:10.1007/s11214-021-00807-w
Mitchell, , Billingsley, M. M., Haley, R. M., Wechsler, M. E., Peppas, N. A., and Langer, R. (2021). Engineering precision nanoparticles for drug delivery. Nat. Rev. Drug Discov. 20 (2), 101–124. doi:10.1038/s41573-020-0090-8
Mormann, M., and Russo, J. E. (2021). Does attention increase the value of choice alternatives? Trends cognitive Sci. 25 (4), 305–315. doi:10.1016/j.tics.2021.01.004
Ran, H., Wen, S., Shi, K., and Huang, T. (2021). Stable and compact design of memristive GoogLeNet neural network. Neurocomputing 441, 52–63. doi:10.1016/j.neucom.2021.01.122
Saad, O. M., Huang, G., Chen, Y., Savvaidis, A., Fomel, S., Pham, N., et al. (2021). Scalodeep: A highly generalized deep learning framework for real-time earthquake detection. J. Geophys. Res. Solid Earth 126 (4), e2020JB021473. doi:10.1029/2020jb021473
Su, K., Yan, W., Wei, X., and Gu, M. (2022). Stereo VoVNet-CNN for 3D object detection[J]. Multimedia Tools and Applications, 81, (25) 35803–35813. doi:10.1007/s11042-021-11506-7
Sun, P., Zhang, R., Jiang, Y., Kong, T., Xu, C., Zhan, W., et al. (2021). “Sparse r-cnn: End-to-end object detection with learnable proposals,” in Proceedings of the IEEE/CVF conference on computer vision and pattern recognition, 14454–14463. Salt Lake City, Utah, USA.
Tan, M., Chen, B., Pang, R., Vasudevan, V., Sandler, M., Howard, A., et al. (2019). Proceedings of the IEEE/CVF conference on computer vision and pattern recognition, Long Beach, CA, USA 2820–2828. MnasNet: Platform-aware neural architecture search for mobile[C].
Tan, M., and Le, Q. (June 2019). “EfficientNet: Rethinking model scaling for convolutional neural Networks,” in Proceedings of the International conference on machine learning (United States: PMLR), 6105–6114. Atlanta GA USA.
Tang, H. W., Weng, J. H., Lee, W. X., Hu, Y., Gu, L., Cho, S., et al. (2021). mTORC1-chaperonin CCT signaling regulates m 6 A RNA methylation to suppress autophagy. Proc. Natl. Acad. Sci. 118 (10), e2021945118. doi:10.1073/pnas.2021945118
Tenney, I., Das, D., and Pavlick, E. (2019). BERT rediscovers the classical NLP pipeline. https://arxiv.org/abs/2110.00476.
Tolstikhin, I. O., Houlsby, N., Kolesnikov, A., Beyer, L., Zhai, X., Unterthiner, T., et al. (2021). Mlp-mixer: An all-mlp architecture for vision. Adv. Neural Inf. Process. Syst. 34, 24261–24272. doi:10.48550/arXiv.2105.01601
Wang, F., and Xu, Y. J. (2010). Comparison of remote sensing change detection techniques for assessing hurricane damage to forests. Environ. Monit. Assess. 162 (1), 311–326. doi:10.1007/s10661-009-0798-8
Wang, H., Chen, J., Lin, Y., Wang, X., Li, J., Li, Y., et al. (2021). Electronic modulation of non-van der Waals 2D electrocatalysts for efficient energy conversion. Adv. Mater. 33 (26), 2008422. doi:10.1002/adma.202008422
Wightman, R., Touvron, H., and Jégou, H. (2021). ResNet strikes back: An improved training procedure in timm. https://arxiv.org/abs/2110.00476.
Woodworth, B., Patel, K. K., Stich, S., Dai, Z., Bullins, B., Mcmahan, B., et al. (2020), 11. PMLR, Vienna, Austria 10334–10343. Is local SGD better than minibatch SGD?, Int. Conf. Mach. Learn.
Wu, H., Xiao, B., Codella, N., Liu, M., Dai, X., Yuan, L., et al. (2021). Cvt: Introducing convolutions to vision transformers[C]. Proceedings of the IEEE/CVF Int. Conf. Comput. Vis., 22–31. Corfu, Greece.
Yuan, J., Ma, X., Han, G., Li, S., and Gong, W. (2022). Research on lightweight disaster classification based on high-resolution remote sensing images. Remote Sens. 14 (11), 2577. doi:10.3390/rs14112577
Yuan, L., Chen, Y., Wang, T., Yu, W., Shi, Y., Jiang, Z., et al. (2021). “Tokens-to-token vit: Training vision transformers from scratch on imageNet,” in Proceedings of the IEEE/CVF international conference on computer vision, 558–567. Seoul, South Korea.
Zeng, H., Wang, Q., Li, C., and Song, W. (2019). Learning-based multiple pooling fusion in multi-view convolutional neural Network for 3D model classification and retrieval. J. Inf. Process. Syst. 15 (5), 1179–1191. doi:10.3745/JIPS.02.0120
Zhang, J., and Ding, Y. (2020). Underwater target recognition based on spectrum learning with convolutional neural Network[C]//Proceedings of the 2020 IEEE 5th Information Technology and Mechatronics Engineering Conference (ITOEC). IEEE, 1520–1523. Chongqing, China.
Zhong, Z., Friedman, D., and Chen, D. (2021). Factual probing is [mask]: Learning vs. learning to recall. https://arxiv.org/abs/2104.05240.
Zhou, D., Kang, B., Jin, X., Yang, L., Lian, X., Jiang, Z., et al. (2021). Deepvit: Towards deeper vision transformer. https://arxiv.org/abs/2103.11886.
Zhu, Q., Guo, X., Deng, W., Shi, S., Guan, Q., Zhong, Y., et al. (2022). Land-use/land-cover change detection based on a Siamese global learning framework for high spatial resolution remote sensing imagery. ISPRS J. Photogrammetry Remote Sens. 184, 63–78. doi:10.1016/j.isprsjprs.2021.12.005
Zhu, Y., Wang, R., Tang, S., Su, H., and Cao, K. (2021). Intelligent fault diagnosis of hydraulic piston pump based on wavelet analysis and improved AlexNet. Sensors 21 (2), 549. doi:10.3390/s21020549
Keywords: disaster cassification net, remote sensing image, natural disaster, convolutional neural networks and transformer model, portability
Citation: Yuan J, Ding X, Liu F and Cai X (2023) Disaster cassification net: A disaster classification algorithm on remote sensing imagery. Front. Environ. Sci. 10:1095986. doi: 10.3389/fenvs.2022.1095986
Received: 11 November 2022; Accepted: 21 December 2022;
Published: 06 January 2023.
Edited by:
Yansheng Li, Wuhan University, ChinaReviewed by:
Qiqi Zhu, China University of Geosciences Wuhan, ChinaChangshuo Wang, Ningbo University, China
Copyright © 2023 Yuan, Ding, Liu and Cai. This is an open-access article distributed under the terms of the Creative Commons Attribution License (CC BY). The use, distribution or reproduction in other forums is permitted, provided the original author(s) and the copyright owner(s) are credited and that the original publication in this journal is cited, in accordance with accepted academic practice. No use, distribution or reproduction is permitted which does not comply with these terms.
*Correspondence: Xinwang Ding, dingxinwang_upc@163.com