Use of COVID-19 personal protective equipment pollutants to improve physical properties of silty sand in Yellow River flooded area
 Hao Wang1*
  Jianbo Guo
- 1School of Civil Engineering and Architecture of Henan University, Kaifeng, Henan, China
- 2Engineering Research Center for Embankment Safety and Disease Control of Ministry of Water Resources, Zhengzhou, Henan, China
Silty sand in the Yellow River flood area (YRFA) of China exhibits a low cohesive force and water-holding capacity. Its direct use for subgrade filling leads to phenomena such as subgrade bed depression, slurry, and mud. Therefore, from the perspective of waste utilization, this study investigates disposable protective clothing (DPC) and disposable nitrile gloves (DNG) produced due to COVID-19 in combination with silty sand as subgrade filling for the YRFA. Through an unconfined compressive strength and permeability test, we studied the influence of personal protective equipment (PPE) with different moisture content, concentration, and size on the strength and permeability of mixed samples. Further, we discuss its impact on the improvement of subgrade filling in YRFA. Results show that adding DPC improves both the compressive strength and ductility of the sample. However, the impermeability of the sample remains unchanged. In contrast, the addition of DNG does not increase the compressive strength and ductility of the sample at the same time, whereas it significantly improves its impermeability. The size of PPE has a considerable influence on the compressive strength of the mixed sample, whereas it does not affect the sample permeability. This method makes use of the PPE waste produced due to COVID-19, reduces environmental pollution, and provides a novel concept for improving silty sand in the YRFA.
1 Introduction
The COVID-19 pandemic brought tremendous changes to our production trends and life. As of 3 August 2022, the cumulative number of confirmed cases of novel coronavirus pneumonia in the world has exceeded 580 million, the number of deaths has exceeded 6.46 million, and the number of confirmed cases still stands at 27.95 million (Evozi, 2022). The number of newly infected novel coronavirus pneumonia cases in some countries and regions is still increasing rapidly. While fighting the pandemic, a series of PPE made of plastic has played a crucial role in protecting people (Benson et al., 2021). However, their improper treatment impacts the environment and human health, as gloves, masks, protective clothing, and other PPE are discarded in parks, roads, and fields (Ammendolia and Walker, 2022; Km et al., 2022).
Nitrile, vinyl, natural rubber (latex), and neoprene, are several production materials used to make disposable protective gloves (Jędruchniewicz et al., 2021). Nitrile gloves have anti-allergic properties, and their quantity used is increasing rapidly (Patrawoot et al., 2021). Although disposable protective clothing (DPC) is mainly used by medical and public service personnel in the anti-pandemic effort, compared with mask and glove protective equipment, its considerable volume has a more passive impact on the environment. Therefore, due to the sharp increase in disposable nitrile gloves (DNG) and DPC volumes, waste utilization and its effect on the soil environment have become a research focus.
The Yellow River is the second largest river in China. Because of numerous floods in its history, sediment deposition has formed silty sand across a wide range of the Yellow River flood area (YRFA), especially in the Lower Yellow River (Haiguang, 2019). With the increasing expansion of highway construction projects in the YRFA, silty sand often is the preferred material for subgrade filling. The basic mechanical properties of silty sand directly determine the strength and stability of the subgrade (Limin et al., 2014). However, silty sand has the characteristics of a low cohesive force and poor water retention. This leads to subgrade bed depression, slurry, mud, and other phenomena (Lixia et al., 2019). Numerous researchers strive to improve the characteristics of silty sand. A.S. et al. Improved silt’s engineering characteristics by adding lime, waste plastic fiber, etc., further improving the stability and durability of soil (Muntohar et al., 2013). S. V. et al. Found that adding flax fiber to silty sand can increase the compressive strength of soil (Krishna Rao and Nasr, 2012). M. S. et al. studied the effects of natural pozzolanic, oil palm open fruit string, and other fibers on the shear strength and other mechanical properties of silty sand by an unconfined compressive strength test (UCST), triaxial compression test, and other tests. They obtained a series of encouraging results (Chauhan et al., 2008; Ahmad et al., 2010; Abbasi and Mahdieh, 2018; Aouali et al., 2019). S. A. et al. studied the effects of confining pressure and silt content on the cyclic characteristics of silty sand. They found that the cyclic ductility decreases with the increase in salt concentration. Furthermore, adding paper can improve the malleability of the sample (Chegenizadeh and Nikraz, 2012; Naeini and Gholampoor, 2014). Yang and other researchers used modified carboxymethyl cellulose (M-CMC) and other polymers to study their effects on silt shear strength, silty slope stability, and erosion control (Yang et al., 2019; Smitha et al., 2021). Kean-Thai et al. studied the impact of acrylate cement and sodium sulfate slurries on the strength of silt. They showed that the optimal cement ratio of various chemical slurries could improve the soil shear strength (Xu et al., 2016; Chhun et al., 2019; Rajabi and Hosseini, 2022). Zhang et al. added lignin to silt to study the dynamic characteristics of lignin-treated silt (Zhang et al., 2021). With the gradual aggravation of COVID-19 worldwide, several scholars attempted to apply personal protective equipment (PPE) waste to improve engineering mechanical properties. Lynch. S et al. studied the effect of disposable masks and gloves on structural concrete through investigating the elastic modulus, etc. Several findings, such as appropriate proportions that can limit the cracks of concrete and improve the strength of concrete structure were reported (Kilmartin-Lynch et al., 2021, 2022). M. et al. studied the influence of disposable masks and other waste on the pavement foundation through compaction tests, modulus of resilience, and other tests. This yields results that can satisfy the stiffness and strength requirements of the pavement base and improve its ductility (Saberian et al., 2021).
The research on improving silty sand’s physical and mechanical properties mainly focuses on adding fibers and chemical slurry, which has high treatment costs. Abandoned anti-epidemic equipment to improve the soil as subgrade filler also concentrates on the physical and mechanical properties of clay. Whether PPE can be used for silt soil improvement to enhance the performance of silt roadbeds is the relevant question posed in this study. In this case, the waste is put to use, while simultaneously reducing the pollution of the YRFA environment. To this end, we investigate the mixed samples of DNG, DPC, and silty sand, and study the influence of PPE with various moisture content, different concentrations, and sizes on the strength and permeability of the samples. Finally, we discuss the impact of PPE on the physical and mechanical properties of silty sand. This research presents a novel method for improving silty sand in the same area.
2 Materials and methods
2.1 Raw material
Silty sand in the YRFA is distributed over 87,000 km2 of land in Henan, Shandong, and Jiangsu provinces. The silty sand used in the test was collected from the Liu Yuankou danger section in the YRFA (Figure 1). PPE is one of the major pollutants widely distributed in the YRFA (Figures 2A,B). When collecting the soil sample, a depth of 30 cm without evident tree roots and other sundries was excavated, and 50 kg of test soil was collected. The gloves used are DNG conforming to GB/T 10213-2006; DPC complies with GB/T 38462-2020 and technical product requirements, and the main component is polyethylene fiber. The DNG and DPC employed for the test were clean due to the provisions and restrictions of the laboratory work safety system. We eliminated the factors that may lead to experimental errors; for example, we removed the fingertips and rubber band at the wrist of DNG, and the collar and cuff of DPC. The fundamental physical properties of the test soil, DNG, and DPC are listed in Table 1.
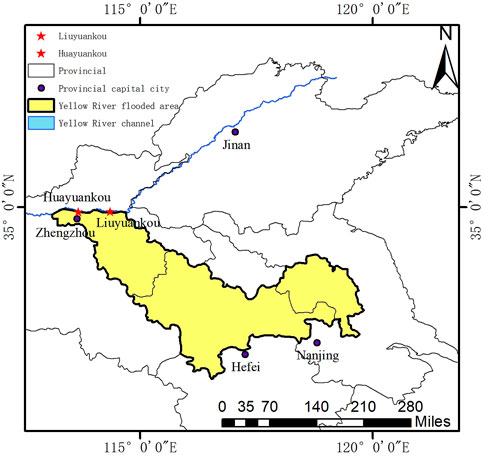
FIGURE 1. Overview of the study area (YRFA).
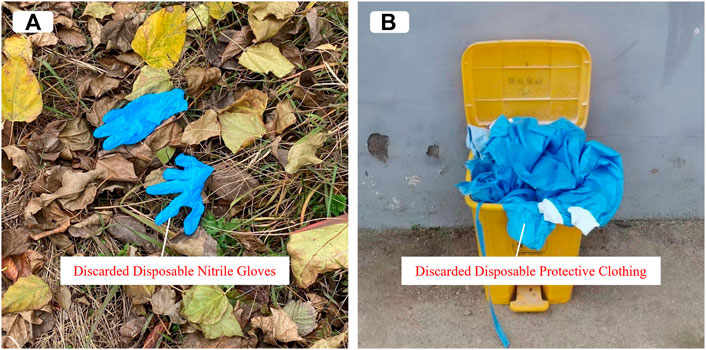
FIGURE 2. Pollution of COVID-19 PPE in YRFA. Pollution by (A) disposable nitrile gloves, (B) disposable protective clothing.
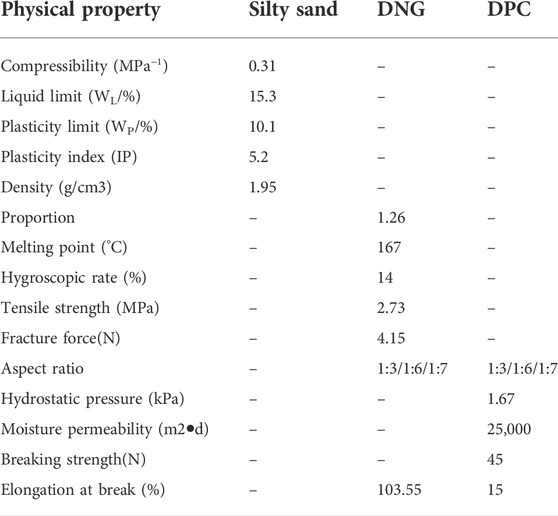
TABLE 1. Fundamental physical properties of test soil, DNG, and DPC.
2.2 Test scheme and naming
Before the test, DNG and DPC were cut into strips of 1.5,3, and 3.5 cm long; 0.5 cm wide respectively. The test soil was baked in an oven at 108°C for 6 hours (State Administration for Market Regulation, 2019). When preparing the soil sample, the treated DNG was mixed with dry test soil at 0.5, 1, and 1.5% mass percentages. This meets the requirements of the range of 0–5% plastic fiber content (soil mass ratio) (Mishra and Kumar Gupta, 2018). The treated DPC was mixed with dry test soil to achieve 0.25, 0.5, 0.75, and 1% mass concentration. The physical properties of the soil tested were natural density, specific gravity, particle analysis, etc. The test settings comply with the geotechnical test method standard (State Administration for Market Regulation, 2019). We conducted the experiment in triplicate to reduce possible errors. The compositions of the eight mixtures are listed in Table 2.
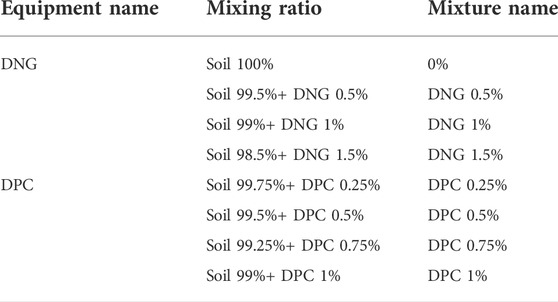
TABLE 2. Nomenclature of PPE and silty sand mixtures.
2.3 Soil sample preparation and curing
The test soil sample is compacted to the target density to ensure sample consistency. The dry test soil, DNG, and DPC are placed separately in a specific container, and the test articles are weighted according to the weight ratio required by the test. The weighing accuracy is 0.01 g, followed by preparation. To ensure the uniform mixing of dry soil and reinforcement materials, a small quantity of reinforcement material is mixed into dry soil. Then, the quantity is gradually increased until all reinforcement materials and dry soil are evenly mixed. The required water is slowly added to the mixture and mixed evenly with a soil mixing knife to ensure the uniform distribution of water, dry soil, and reinforcement materials. After preparation, we place the mixed materials in a plastic sealed box, cover it with fresh-keeping film, and store it in an indoor locker for 6 h. The curing temperature and humidity of all tests shall be consistent.
The UCST soil samples are compacted three times. To ensure consistent soil sample preparation, we consolidate the fixed mixture quality to the same height. Before placing the next layer of mixed soil, we chiseled it in the mold to ensure that the soil sample is not layered without shaking it.
2.4 Specific test contents
2.4.1 Particle analysis test of silty sand
We study on particle gradation of silty sand by conducting the particle analysis test. The test adopts the sieve analysis and type B densitometer methods (State Administration for Market Regulation, 2019). The sieve analysis method uses a standard sieve of 0.075–2 mm for the test. A total of 500 g of the dry soil sample is removed by the quartering method and placed into the standard sieve arranged according to the pore size for the screening test. After the examination, the remaining mass on the sieve is measured and recorded. Take 30 g of soil under the 0.075 mm sieve of sieve analysis method as the test soil sample of type B densimeter. After soaking for 12 h, boiling, cooling, and other steps, the densitometer readings are recorded at 0.5, 1, 2, 5, 15, 30, 60, 120, 180, and 1,440 min. Simultaneously, the temperature of the turbid liquid is measured and recorded. After completing the data collection, the particle grading curve is drawn. Figure 3 shows the test process of the type B densitometer method.
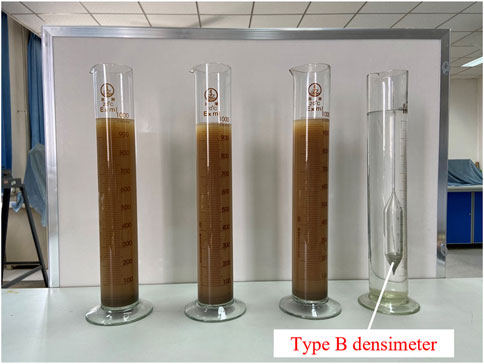
FIGURE 3. Test process of Type B densitometer method.
2.4.2 UCST of a mixed sample of PPE and silty sand
The UCST uses a full-automatic strain triaxial apparatus to study the unconfined compressive strength (UCS) of the mixed sample of protective equipment and silty sand. The size of the mixed sample used in the UCST is 10.5 cm in diameter and 11.55 cm in height (Saberian et al., 2021). For four variables include the moisture content (6, 8, 10%), the content of DNG (0, 0.5, 1, 1.5%), the content of DPC (0, 0.25, 0.5, 0.75, 1%), and size of PPE (1.5 × 0.5, 3.0 × 0.5, and 3.5 × 0.5 cm). During the test, the mixed sample is placed on the lower pressing plate, and the lower pressing plate is raised such that no sample of the mixture is in contact with the upper pressing plate. The following parameters were set: upon starting the instrument, the shear rate of the test is 0.8 mm/min. If the soil sample is crushed, the test stops automatically, removes the mixture sample, and processes the data, generating the stress-strain curve, and obtaining the UCS. At the same water content, the concentration of PPE, and test conditions, the parallel test is repeated three times. We conducted tests on 27 groups of UCST.
2.4.3 Penetration test of a mixed sample of PPE and silty sand
Variable-head permeability test is applicable to fine-grained soil, while silty sand belongs to fine-grained soil (State Administration for Market Regulation, 2019). Therefore, variable-head permeability test is adopted, and the instrument employed is the TST-55 permeability instrument. The test scheme is the same as the UCST. The water head pipe is filled to the predetermined height, and the change in the water head and the specified time interval are recorded in triplicate, as well as the water temperature at the water outlet. Then, the water level of the head pipe is increased to the predetermined height, continuously measured and recorded, and the test is repeated five times. As with UCST, three parallel tests are conducted at the same water content, mixing amount, and test conditions. The data are processed, and the permeability coefficient of the mixture sample is calculated. We conducted penetration tests on 26 groups. Figure 4 shows a schematic diagram of the penetration test process. The permeability coefficient is calculated according to the following formula (State Administration for Market Regulation, 2019):
where a is the section area of the varying-head pipe (cm2), L denotes the penetration diameter (cm), equal to the height of the sample, Hb1 is the head at the beginning (cm), and Hb2 is the head at termination (cm).
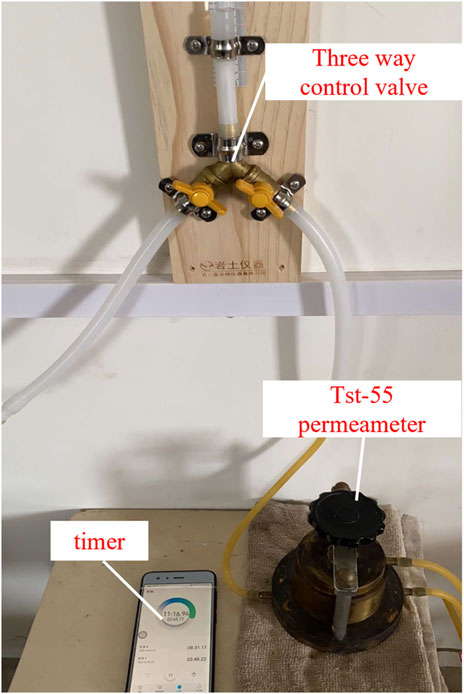
FIGURE 4. Schematic diagram of penetration test process.
3 Results and discussion
3.1 Particle gradation of silty sand
According to the two-particle grading methods of the sieve analysis and type B densimeter, the particle grading curve of the soil is obtained, as shown in Figure 5. The particle content of a particle size larger than 2 mm accounts for 2.67% of the total weight; The content of particles with particle size greater than 0.075 mm accounts for 70.41% of the total weight. According to the engineering classification, the soil used for the test is silty sand (Nanjing Hydraulic Research Institute, 2008).
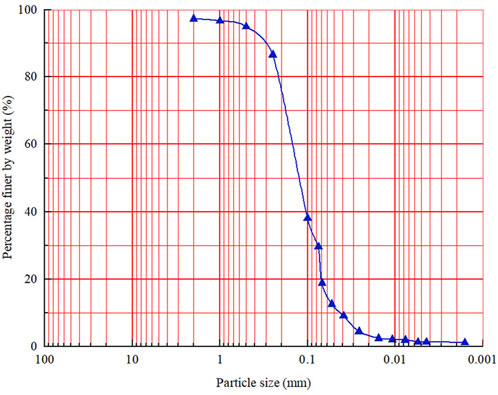
FIGURE 5. Particle grading curve of silty sand.
The particle grading curve is curved and stepped near the particle size of 1 mm, indicating that the particle size composition is discontinuous and lacks intermediate particles, as shown in Figure 5. To quantitatively express the uniformity of soil particles and the advantages and disadvantages of grading, dX (where the mass of soil below this particle size accounts for X% of the total soil mass) is defined as the characteristic particle size. The non-uniformity coefficient Cu and curvature coefficient Cc are calculated according to the following formula (Nanjing Hydraulic Research Institute, 2008):
The Cu and Cc of soil are calculated according to the following parameters: d10 = 0.043, d30 = 0.076, d60 = 0.168, Cu = 3.91, Cc = 0.8. Generally, in engineering, when Cu ≥ 5 and Cc = 1–3, the grading is good, otherwise, the grading is poor. Thus, the soil used in the test is silty sand, and it is poorly graded (Nanjing Hydraulic Research Institute, 2008).
3.2 UCST of PPE and silty sand mixed samples
3.2.1 Stress-strain curve of UCST
The UCST is among the most frequently used test methods to evaluate the compressive performance of soil. Figures 6A,B respectively shows the stress-strain curves of silty sand mixed samples at different contents of DNG and DPC.
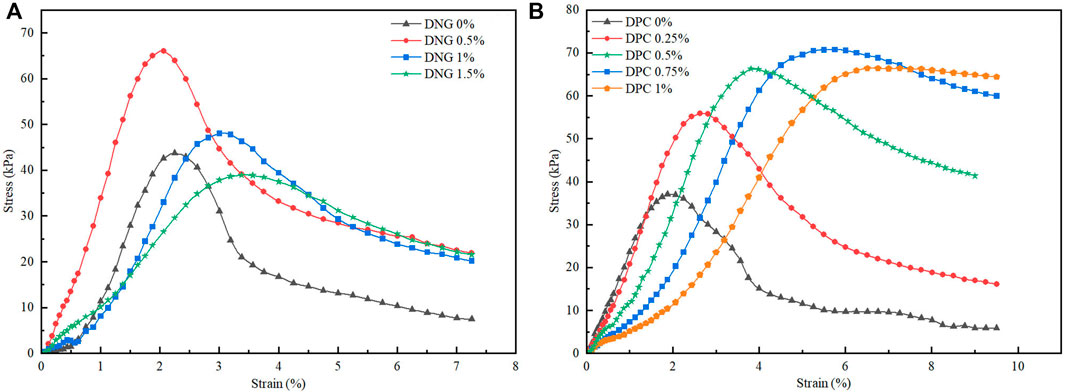
FIGURE 6. Stress–strain curves of mixed sample of PPE and silty sand at different concentrations. (A) –Mixed sample of DNG and silty sand; (B) –Mixed sample of DPC and silty sand.
When the content of DNG is 0.5%, the axial stress reaches the peak value, and the stress loss is not apparent. The axial strain during failure does not increase, but decreases slightly, staying controlled between 2 and 2.3% (Figure 6A). Although the axial strain increases while the stress loss decreases with the rise in DNG concentration, the strength will decrease; Our judgment is that adding gloves cannot improve the strength and ductility of the mixture simultaneously. As shown in Figure 6B, when the concentration of DPC ranges from 0 to 0.75%, the axial stress and strain of the mixture gradually increase from the initial 1.877–5.755%. The stress loss decreases gradually after the pressure reaches its peak. When the DPC concentration is 1%, the strain at failure continues to increase, and the stress loss is smaller, while the peak value of axial stress decreases slightly, but it is much higher than that without addition DPC; The judgment is that adding an appropriate DPC concentration can improve the strength and ductility of the mixture at the same time.
The stress loss in the stress-strain curve of the mixed sample of PPE and silty sand reflects the reduction in strength and change in the toughness of the soil sample (Figure 6). In the test, the hybrid model mixed with DPC exhibits more toughness. The reason is that in the failure stage of the mixture sample, the existence of PPE decreases the failure speed of the mixture and avoids the sudden drop in axial pressure borne by the combination. The test of medium polypropylene short fiber reinforced cement stabilized cohesive soil likewise shows that the higher the fiber concentration, the more evident the lessening stress loss after peak value (Tang et al., 2007). This phenomenon is also reflected in the research on freeze–thaw characteristics of fiber-reinforced fine-grained and reinforced solidified soils by Chang, A. S., and others. The authors state that the stress–strain curve of the UCST belongs to the strain-softening type, i.e., before the strength reaches the peak, the curve exhibits an s-shape, and when the strength rises, the sample undergoes shear failure. After the specimen is damaged, the stress decreases gradually and tends to a stable value (i.e., residual strength) with increased strain (Zaimoglu, 2010; Zhilu et al., 2017).
3.2.2 UCS of mixed samples of PPE and silty sand
Figure 7A shows the results of the UCST of samples mixed with silty sand under different moisture content and different concentrations of DNG. Figures 7B,C shows the UCST results of models mixed with silty sand under other moisture contents and additional DPC.
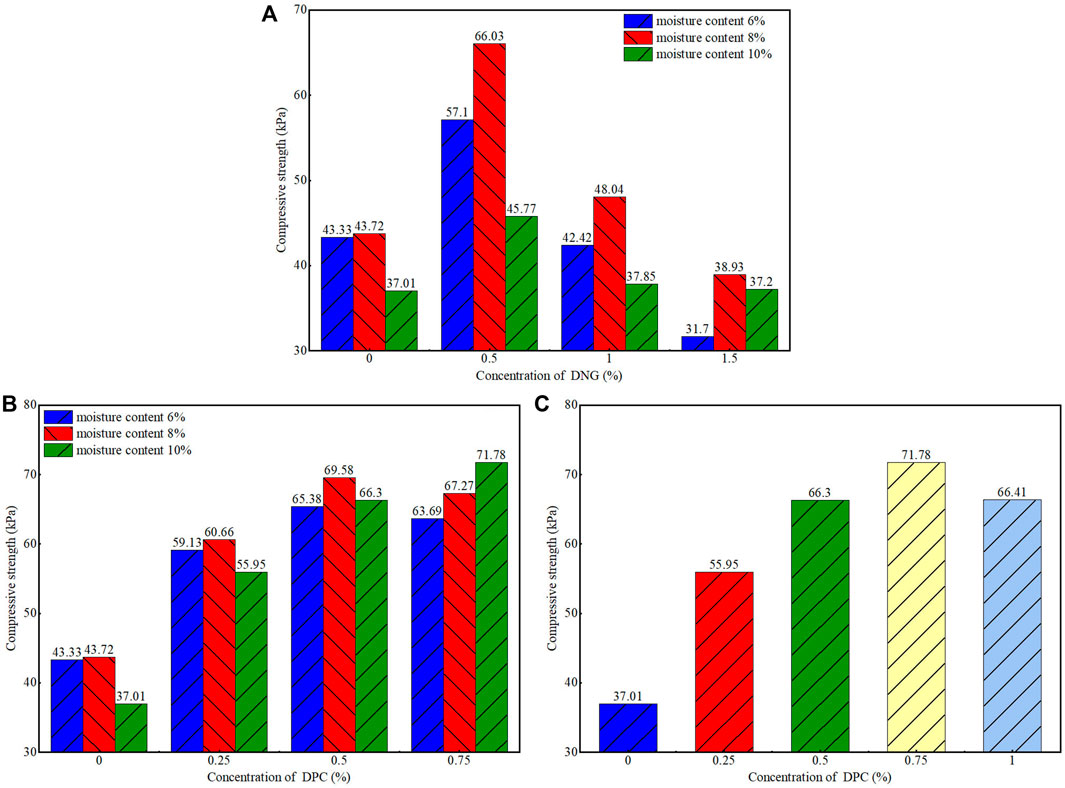
FIGURE 7. UCST results of mixed samples of PPE and silty sand. Different moisture content, different concentration of (A) DNG, and silty sand; (B) DPC and silty sand; (C) UCST of DPC and silty sand when the moisture content is 10%.
Figure 7A indicates that when the water content remains unchanged, the UCS of the mixed sample increases first and subsequently decreases with the rise in the concentration of DNG. When the concentration of DNG is 0.5%, the UCS reaches its maximum. When the moisture content is 6, 8, and 10%, and the concentration of DNG was 0.5%, the UCS of the mixed samples increased by 31.7, 51, and 23.7%, respectively, compared with the control group (0%). When the DNG concentration increases to 1 and 1.5%, the UCS of the mixed samples decreases gradually. When the DNG concentration is 1%, compared with 0.5%, the UCS is lower, but the compressive strength effect is still higher than that without DNG. While keeping the content of DNG constant (0, 0.5, 1, and 1.5%), with the moisture content ranging from 6 to 10%, the UCS of the mixed sample likewise increases first and then decreases, reaching its highest point when the moisture content is 8%.
Figure 7B shows that when the content is 0.25 and 0.5%, the UCS of the mixture increases first and then decreases with the rise in the moisture content; When the moisture content is 0.75%, the UCS increases gradually. When the moisture content is 6 and 8%, the UCS of the mixed sample rises first and then decreases with the increase in DPC concentration. When the content is 0.5%, the UCS reaches its maximum. When the moisture content is 10%, the UCS of the mixed samples increases with the gradual increase of the DPC concentration. However, Figure 7C shows that when the moisture content is 10%, the concentration of DPC increases to 1%, and the inside of the mixed sample increases first, and then decreases. In contrast to the moisture contents of 6 and 8%, when the content of DPC reaches 0.75%, the UCS reaches the peak value of 71.78 kPa, an increase of 94%, whose strong effect is the most significant. After the concentration of DPC surpasses 0.75%, the UCS of the mixture decreases, while it is significantly higher than that of the control group (0%).
As shown in Figure 7, the UCS increases first and then decreases with the increase in PPE content. The rise of UCS is the cementation between soil and PPE. Adding PPE to the pores between structures increases the contact area with soil particles to bond well. Compared with other studies showing an increase of 14% in UCS, this study demonstrates a better effect and growth of 94% (Xu et al., 2016; Tomar et al., 2020). The reduction in UCS is attributed to the excessive amount of PPE, which can entangle the sample’s inclusion, promote further crack development, and hinder bonding. The study on the improvement of Shanghai soft soil by fiber reinforced cement, as well as the improvement of recycled concrete, the UCS decreases due to excessive plastic content, which confirms this result (Chen et al., 2015; Saberian et al., 2021).
When the DPC concentration is above 0.75%, the compaction difficulty of mixed samples increases. While discussing the random addition of polypropylene fiber to study the strength characteristics of clay, Tang found that soil containing more than 1% fiber will lead to difficulties in compaction (Tang et al., 2007). This may be attributed to the low moisture content and excessive mixing amount of DPC. The content of the soil is not sufficient to thoroughly mix with the DPC. Consequently, the DPC is mixed into balls or unevenly mixed with the soil, resulting in low-density pockets.
3.2.3 Effect of PPE size on compressive strength of mixed samples
Figure 8 shows the comparative test results of different PPE sizes on the mixture sample compressive strengths. The size comparison test of PPE maintains a constant moisture content and concentration. The selection standard of moisture content and concentration in the comparative is: When the size of PPE material is 3.0 × 0.5 cm, the moisture content and concentration of the mixed sample at the maximum compressive strength for DPG remain unchanged at 8 and 0.5%, respectively, and those for DPC remain unchanged at 10 and 0.75%, respectively.
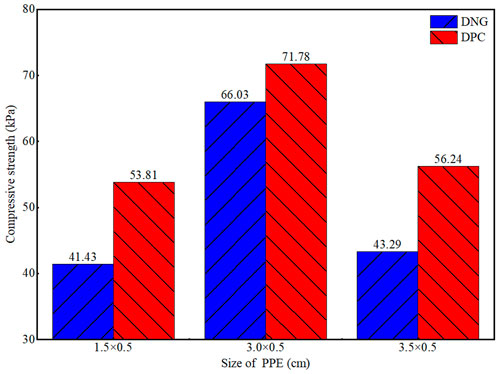
FIGURE 8. Influence of PPE of different sizes on compressive strength of mixed samples.
Irrespectively of whether the sample is mixed with DNG or DPC, the PPE size showing the maximum compressive strength is 3.0 × 0.5 cm. When the size of PPE is less than 3.0 × 0.5 cm, the reason for the lower UCS is: for the shorter PPE, sufficient anchorage cannot be formed, resulting in the bearing capacity of the PPE insufficient mobilization; Kumar et al. Also showed this phenomenon in the study of cement and fiber on the strength characteristics of clay (Kumar and Gupta, 2016). Above this size, the soil-PPE interlock is reduced in the mixed sample, which results in the reduction of compressive strength and further confirms the conclusion of Pradhan et al. in the study of the strength characteristics of cohesive soil with polypropylene fiber random inclusions (Pradhan et al., 2012).
3.2.4 Bridge effect of mixed samples of PPE and silty sand
Figure 9 shows the comparison diagram of the breakdown phenomenon of the mixed sample with or without reinforcement. At the same water content and axial strain after the test, the sidewall of the sample without reinforcement falls off in blocks (Figure 9A). In contrast, the sidewall of the mixed model with support has cracks, but there is no overall shedding of soil, as shown in Figure 9B.
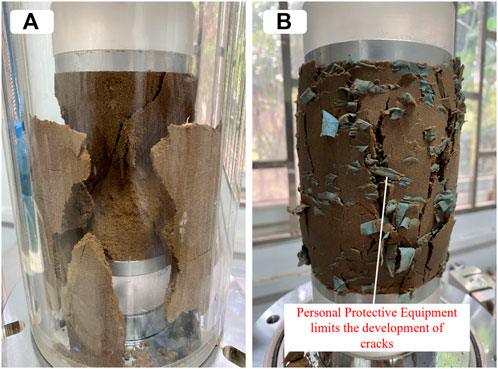
FIGURE 9. Damage of soil samples (A) without PPE, (B) when adding PPE.
This phenomenon is attributed to the bonding between the reinforcement and soil after mixing. When the mixed soil sample cracks, the support receives evident tension to prevent the soil from falling off. This result likewise appeared in the research of disposable masks used in a pavement base, as well as nano-silica and polypropylene fiber that were used to treat cohesive soil, and fiber-reinforced sand expansive soil polluted by old engine oil. The authors refer to the bridge effect, as the fiber plays a reinforcing role and hinders further development of cracks (Zhilu et al., 2017; Bojnourdi et al., 2020; Saberian et al., 2021).
3.3 Permeability test of PPE and silty sand mixed samples
3.3.1 Permeability coefficient of PPE and silty sand mixed samples
The permeability test is the most commonly employed and effective method to evaluate the permeability of the soil. The permeability coefficient reflects the permeability of the soil. In practical engineering, soil permeability is equivalent to soil strength and deformation, which has an important impact on the safety and fuel progress of the project. Figure 10 shows the permeability coefficients of the mixed samples at various moisture levels, PPE concentrations, and silty sand.
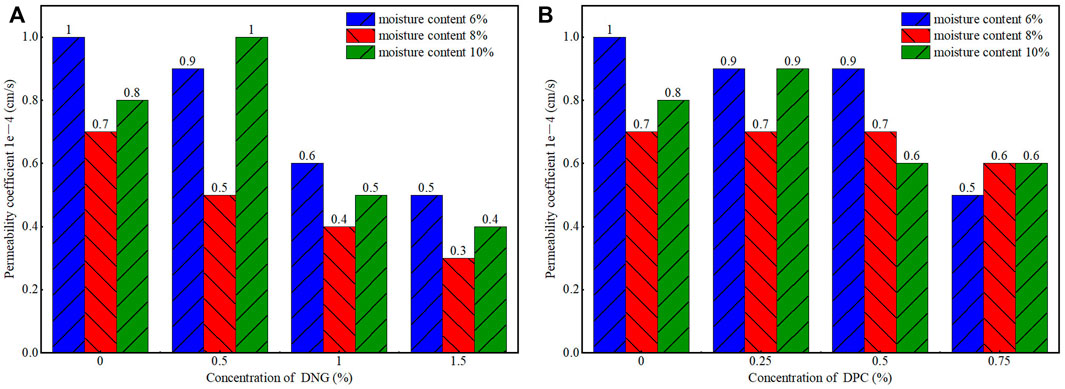
FIGURE 10. Permeability test results of PPE and silty sand mixture samples with different moisture content and concentration. Permeability coefficients of (A) DNG and silty sand samples and (B) DPC and silty sand samples.
Figure 10A shows that when the content of DNG is certain, the moisture content corresponding to the minimum permeability coefficient of the mixed sample is 8%. Hence, the impermeability of the composite model is the optimal one. When the moisture content is constant, the permeability coefficient of the mixed sample shows a gradually decreasing trend with the increase in the concentration of DNG. However, when the moisture content is 10%, and the content of DNG is 0.5%, the permeability coefficient does not conform to the overall trend.
Figure 10B shows that when the concentration of DPC increases from 0 to 0.25%, the permeability coefficient of the mixed sample decreases first, and then increases with rising moisture content. Herein, the permeability coefficient is not larger than the one corresponding to the minimum moisture content. When the DPC concentration rises from 0.5 to 0.75%, the permeability coefficient of the mixture decreases gradually and does not change significantly with the increase in moisture content. When the moisture content is 6 and 8%, only when the DPC concentration increases to 0.75% does the permeability coefficient of the mixed sample decrease sharply. When the moisture content is 10%, the mixed sample permeability coefficient increases and decreases with the increase in the DPC concentration.
The test results after adding DNG are shown in Figure 10A. When the concentration of DNG is certain, the permeability coefficient is more significant when the moisture content is between 6 and 10% than when the moisture content is 8%. We attribute this to the water content of sample preparation being too small, such that there is no water film on the surface of microscopic mixed soil particles, which is not conducive to filling into macropores. When the moisture content of the sample is too large, the water film forms, and when the water film thickness increases to a particular value, the water film tension tightly gathers the small mixed particles together to form a larger aggregate structure. The size of this aggregate is large, which is also not conducive to filling large gaps, thus increasing the permeability coefficient of the mixed sample. Jia likewise observed this phenomenon in the silt test research in the YRFA (Zhigang, 2017).
When the moisture content is maintained constant, the permeability coefficient decreases gradually with the increase in the DNG concentration, as the DNG material is impermeable. The permeability of DNG is less than silty sand. When the glove material gradually increases, the contact between DNG and soil particles becomes increasingly denser, which changes the internal structure of the mixed sample, resulting in more difficult water seepage and a gradual decrease in the permeability coefficient. Hu et al. showed this variation in the study of the influence of MgO on the permeability of fiber cement soil (Qizhi et al., 2021). However, when the moisture content is 10%, and the concentration of DNG is 0.5%, the reason for the increase in permeability coefficient, in this case, is due to the addition of DNG, as the seepage channel inside the mixed sample is increased, and the DNG exerts a diversion effect to improve the permeability of the soil.
The test results in Figure 10B show that when the content of DPC is 0.5%, the permeability coefficient gradually decreases with the increase in the moisture content. This is because, in comparison, the influence of the water film is small, such that the impact from the change of moisture content becomes minimal. At this time, the water in the soil sample is confined, resulting in higher water content and a smaller permeability coefficient. As the content increases to 0.75%, the effect of water content is insignificant.
3.3.2 Effect of PPE size on permeability coefficient of mixed samples
Figure 11 shows the comparative test results of different PPE sizes on the permeability coefficient of mixed samples. The selection standard for the moisture content and concentration in the comparative is: For the size of PPE at 3.0 × 0.5 cm, the moisture content of the mixed model with DNG remains unchanged at 8 and 0.5%, and the moisture content of the composite sample mixed with DPC remains unchanged at 8 and 0.25%. The size of PPE does not affect the permeability of the mixed model, whether it is the composite sample mixed with DNG or the diverse selection combined with DPC. This is because the PPE mixed with the silt sand has the same quality and specific surface area, such that the size of the PPE does not affect the permeability of the mixed sample.
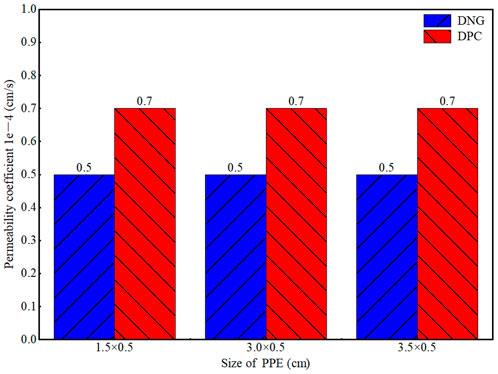
FIGURE 11. Influence of PPE of different sizes on permeability coefficient of mixed samples.
4 Conclusion
Based on the perspective of waste utilization, this study conducts a UCST and penetration test on PPE and silt sand mixed samples at different moisture contents, PPE concentrations, and PPE sizes. The physical and mechanical properties of silty sand in the YRFA after adding DPC and DNG are discussed, and so is the application of PPE in the improvement of silty sand. This provides a novel method for environmental protection and silt improvement in the YRFA. The conclusions are as follows:
1) Adding PPE significantly improves the integrity, strength, and toughness of the mixed sample of silty sand and PPE. This is the result of cementation and reinforcement of silty sand and PPE, which hinders further development of cracks; The optimum concentration range of PPE is 0.5–0.75%.
2) The sizes of DPC and DNG have a significant effect on the compressive strength of the mixed samples, but no effect on their permeability; 3.0 × 0.5 cm is the best size of PPE added to the mixture.
3) The addition of DPC has no significant effect on the impermeability of silty sand, but the result is significantly improved impermeability after adding DNG.
4) DPC and DNG with appropriate parameters can be applied to improve silty sand, which provides a new method for environmental protection and waste utilization.
Data availability statement
The original contributions presented in the study are included in the article/Supplementary Material, further inquiries can be directed to the corresponding author.
Author contributions
Methodology, HW; Resources, HW; Funding, HW; Test, JG, WL, HS, TY, and DF; Data sorting, JG; Visualization, JG, WL, and DF; First draft preparation, HW and JG; Write comments and edit, HW, JG, WL, HS, TY, and DF; supervise, HW; Project administration, TY.
Funding
All authors thank the youth project of Henan Natural Science Foundation (Grant No. 212300410125), the China Postdoctoral Science Foundation General Project (Grant No. 2020M672202), the key projects of universities in Henan Province (Grant No. 20A570002), and the project supported by the open research fund of the Engineering Research Center for Embankment Safety and Disease Control of Ministry of Water Resources (No. LSDP202202) for supporting this study.
Acknowledgments
All authors thank the constructive review of the reviewer and editor for the early version of the manuscript.
Conflict of interest
The authors declare that the research was conducted in the absence of any commercial or financial relationships that could be construed as a potential conflict of interest.
Publisher’s note
All claims expressed in this article are solely those of the authors and do not necessarily represent those of their affiliated organizations, or those of the publisher, the editors and the reviewers. Any product that may be evaluated in this article, or claim that may be made by its manufacturer, is not guaranteed or endorsed by the publisher.
Supplementary material
The Supplementary Material for this article can be found online at: https://www.frontiersin.org/articles/10.3389/fenvs.2022.1011685/full#supplementary-material
References
Abbasi, N., and Mahdieh, M. (2018). Improvement of geotechnical properties of silty sand soils using natural pozzolan and lime. Geo-Engineering 9, 4. doi:10.1186/s40703-018-0072-4
Ahmad, F., Bateni, F., and Azmi, M. (2010). Performance evaluation of silty sand reinforced with fibres. Geotext. Geomembranes 28, 93–99. doi:10.1016/j.geotexmem.2009.09.017
Ammendolia, J., and Walker, T. R. (2022). Citizen science: A way forward in tackling the plastic pollution crisis during and beyond the COVID-19 pandemic. Sci. Total Environ. 805, 149957. doi:10.1016/j.scitotenv.2021.149957
Aouali, N., Benessalah, I., Arab, A., Ali, B., and Abed, M. (2019). Shear strength response of fibre reinforced chlef (Algeria) silty sand: Laboratory study. Geotech. Geol. Eng. (Dordr). 37, 1047–1057. doi:10.1007/s10706-018-0641-5
Benson, N. U., Bassey, D. E., and Palanisami, T. (2021). COVID pollution: Impact of COVID-19 pandemic on global plastic waste footprint. Heliyon 7, e06343. doi:10.1016/j.heliyon.2021.e06343
Bojnourdi, S., Narani, S. S., Abbaspour, M., Ebadi, T., and Mir Mohammad Hosseini, S. M. (2020). Hydro-mechanical properties of unreinforced and fiber-reinforced used motor oil (UMO)-contaminated sand-bentonite mixtures. Eng. Geol. 279, 105886. doi:10.1016/j.enggeo.2020.105886
Chauhan, M. S., Mittal, S., and Mohanty, B. (2008). Performance evaluation of silty sand subgrade reinforced with fly ash and fibre. Geotext. Geomembranes 26, 429–435. doi:10.1016/j.geotexmem.2008.02.001
Chegenizadeh, A., and Nikraz, H. (2012). Using paper as reinforcement in silty sand. Adv. Mat. Res. 537, 1397–1401. doi:10.4028/www.scientific.net/AMR.535-537.1397
Chen, M., Shen, S.-L., Arulrajah, A., Wu, H.-N., Hou, D.-W., and Xu, Y.-S. (2015). Laboratory evaluation on the effectiveness of polypropylene fibers on the strength of fiber-reinforced and cement-stabilized Shanghai soft clay. Geotext. Geomembranes 43, 515–523. doi:10.1016/j.geotexmem.2015.05.004
Chhun, K.-T., Lee, S.-H., Keo, S.-A., and Yune, C.-Y. (2019). Effect of acrylate-cement grout on the unconfined compressive strength of silty sand. KSCE J. Civ. Eng. 23, 2495–2502. doi:10.1007/s12205-019-1968-z
Evozi, (2022). COVID-19 | Malaysia outbreak monitor | live updates. Available at: https://www.outbreak.my (Accessed August 3, 2022).
Haiguang, J. (2019). Discussion on construction technology of filling subgrade with silty sand. Build. Mater. Decor. 23, 268–269. (in Chinese). doi:10.3969/j.issn.1673-0038.2019.23.198
Jędruchniewicz, K., Ok, Y. S., and Oleszczuk, P. (2021). COVID-19 discarded disposable gloves as a source and a vector of pollutants in the environment. J. Hazard. Mater. 417, 125938. doi:10.1016/j.jhazmat.2021.125938
Kilmartin-Lynch, S., Roychand, R., Saberian, M., Li, J., and Zhang, G. (2022). Application of COVID-19 single-use shredded nitrile gloves in structural concrete: Case study from Australia. Sci. Total Environ. 812, 151423. doi:10.1016/j.scitotenv.2021.151423
Kilmartin-Lynch, S., Saberian, M., Li, J., Roychand, R., and Zhang, G. (2021). Preliminary evaluation of the feasibility of using polypropylene fibres from COVID-19 single-use face masks to improve the mechanical properties of concrete. J. Clean. Prod. 296, 126460. doi:10.1016/j.jclepro.2021.126460
Km, A., Pga, B., and Vcs, C. (2022). A critical synthesis of current peer-reviewed literature on the environmental and human health impacts of COVID-19 PPE litter: New findings and next steps - ScienceDirect. J. Hazard. Mater. 422, 126945. doi:10.1016/j.jhazmat.2021.126945
Krishna Rao, S. V., and Nasr, Ahmed. M. A. (2012). Laboratory study on the relative performance of silty-sand soils reinforced with linen fiber. Geotech. Geol. Eng. (Dordr). 30, 63–74. doi:10.1007/s10706-011-9449-2
Kumar, A., and Gupta, D. (2016). Behavior of cement-stabilized fiber-reinforced pond ash, rice husk ash–soil mixtures. Geotext. Geomembranes 44, 466–474. doi:10.1016/j.geotexmem.2015.07.010
Limin, Z., Yuqing, Y., Wei, L., and Tao, G. (2014). Experimental study on static characteristics of silty sand in Yellow River flooded area. Sci. Technol. Eng. 14, 254–258. (in Chinese). doi:10.3969/j.issn.1671-1815.2014.15.053
Lixia, W., Xinyue, Z., Yunlong, Z., Jing, Z., Shuang, S., and Bing, H. (2019). Study on mechanical properties of lime modified silty sand under freeze–thaw cycle. J. Jilin Archit. Univ. 36, 12–16. (in Chinese). CNKI:SUN:JLJZ.0.2019-05-003
Mishra, B., and Kumar Gupta, M. (2018). Use of randomly oriented polyethylene terephthalate (PET) fiber in combination with fly ash in subgrade of flexible pavement. Constr. Build. Mater. 190, 95–107. doi:10.1016/j.conbuildmat.2018.09.074
Muntohar, A. S., Widianti, A., Hartono, E., and Diana, W. (2013). Engineering properties of silty soil stabilized with lime and rice husk ash and reinforced with waste plastic fiber. J. Mat. Civ. Eng. 25, 1260–1270. doi:10.1061/(ASCE)MT.1943-5533.0000659
Naeini, S. A., and Gholampoor, N. (2014). Cyclic behaviour of dry silty sand reinforced with a geotextile. Geotext. Geomembranes 42, 611–619. doi:10.1016/j.geotexmem.2014.10.003
Nanjing Hydraulic Research Institute (2008). Engineering classification standard of soil. Beijing: China Planning Press. (in Chinese).
Patrawoot, S., Tran, T., Arunchaiya, M., Somsongkul, V., Chisti, Y., and Hansupalak, N. (2021). Environmental impacts of examination gloves made of natural rubber and nitrile rubber, identified by life‐cycle assessment. SPE Polym. 2, 10036–10190. doi:10.1002/pls2.10036
Pradhan, P. K., Kar, R. K., and Naik, A. (2012). Effect of random inclusion of polypropylene fibers on strength characteristics of cohesive soil. Geotech. Geol. Eng. (Dordr). 30, 15–25. doi:10.1007/s10706-011-9445-6
Qizhi, H., Yang, Y., and Xinshan, Z. (2021). Experimental study on the effect of MgO on the strength and permeability of fiber cement soil. Highway 66, 262–267. (in Chinese).
Rajabi, A. M., and Hosseini, A. (2022). Effect of liquid polyvinyl acetate and micronized calcium carbonate on strength parameters of silty sand soil. Iran. J. Sci. Technol. Trans. Civ. Eng. 46, 385–395. doi:10.1007/s40996-021-00621-y
Saberian, M., Li, J., Kilmartin-Lynch, S., and Boroujeni, M. (2021). Repurposing of COVID-19 single-use face masks for pavements base/subbase. Sci. Total Environ. 769, 145527. doi:10.1016/j.scitotenv.2021.145527
Smitha, S., Rangaswamy, K., and Keerthi, D. S. (2021). Triaxial test behaviour of silty sands treated with agar biopolymer. Int. J. Geotechnical Eng. 15, 484–495. doi:10.1080/19386362.2019.1679441
State Administration for Market Regulation (2019). Standard for geotechnical testing method. Beijing: China Planning Press. (in Chinese).
Tang, C., Shi, B., Gao, W., Chen, F., and Cai, Y. (2007). Strength and mechanical behavior of short polypropylene fiber reinforced and cement stabilized clayey soil. Geotext. Geomembranes 25, 194–202. doi:10.1016/j.geotexmem.2006.11.002
Tomar, A., Sharma, T., and Singh, S. (2020). Strength properties and durability of clay soil treated with mixture of nano silica and Polypropylene fiber. Mater. Today Proc. 26, 3449–3457. doi:10.1016/j.matpr.2019.12.239
Xu, X., Wang, Y., Bai, R., Zhang, H., and Hu, K. (2016). Effects of sodium sulfate content on mechanical behavior of frozen silty sand considering concentration of saline solution. Results Phys. 6, 1000–1007. doi:10.1016/j.rinp.2016.11.040
Yang, Q. W., Pei, X. J., and Huang, R. Q. (2019). Impact of polymer mixtures on the stabilization and erosion control of silty sand slope. J. Mt. Sci. 16, 470–485. doi:10.1007/s11629-018-4905-6
Zaimoglu, A. S. (2010). Freezing–thawing behavior of fine-grained soils reinforced with polypropylene fibers. Cold Regions Sci. Technol. 60, 63–65. doi:10.1016/j.coldregions.2009.07.001
Zhang, J., Han, Y., Wang, X., and Bian, H. (2021). Experimental investigation of the dynamic characteristics of treated silt using lignin: Case study of Yellow River flood basin. Int. J. Geomech. 21, 04021056. doi:10.1061/(ASCE)GM.1943-5622.0002018
Zhigang, J. (2017). Study on hydraulic characteristic parameters of silt in Yellow River flooded area. (in Chinese) https://oversea.cnki.net/kcms/detail/detail.aspx?dbcode=CDFD&dbname=CDFDLAST2018&filename=1017740139.nh&uniplatform=NZKPT&v=ePq8GRbnOzn1Ljq4jyVrJ4BOtaZUpEnQSqPZn9JepUJXiMkFyTyZ6SUj0uj2ZSsH (Accessed May 10, 2022).
Keywords: COVID-19, personal protective equipment, Yellow River flooded area, improvement of silty sand, compressive strength, permeability coefficient
Citation: Wang H, Guo J, Liu W, Song H, Yan T and Fu D (2022) Use of COVID-19 personal protective equipment pollutants to improve physical properties of silty sand in Yellow River flooded area. Front. Environ. Sci. 10:1011685. doi: 10.3389/fenvs.2022.1011685
Received: 04 August 2022; Accepted: 23 August 2022;
Published: 09 September 2022.
Edited by:
Xinyao Xie, Institute of Mountain Hazards and Environment (CAS), ChinaReviewed by:
Youhong Tang, Flinders University, AustraliaSiming He, Institute of Mountain Hazards and Environment (CAS), China
Copyright © 2022 Wang, Guo, Liu, Song, Yan and Fu. This is an open-access article distributed under the terms of the Creative Commons Attribution License (CC BY). The use, distribution or reproduction in other forums is permitted, provided the original author(s) and the copyright owner(s) are credited and that the original publication in this journal is cited, in accordance with accepted academic practice. No use, distribution or reproduction is permitted which does not comply with these terms.
*Correspondence: Hao Wang, wanghao8023@henu.edu.cn