Assessing Antibiotics Biodegradation and Effects at Sub-inhibitory Concentrations by Quantitative Microbial Community Deconvolution
 Birge D. Özel Duygan
 Caroline Gaille1
  Kathrin Fenner
 Jan R. van der Meer
- 1Department of Fundamental Microbiology, University of Lausanne, Lausanne, Switzerland
- 2Department of Environmental Chemistry, Swiss Federal Institute of Aquatic Sciences (Eawag), Dübendorf, Switzerland
- 3Department of Chemistry, University of Zürich, Zürich, Switzerland
Antibiotics in the environment cause widespread concern as a result of their potent inhibitory action on microbial growth and their role in potentially creating selective conditions for proliferation of antibiotic resistant bacteria. Comprising a carbon skeleton, antibiotics should be amenable to microbial biodegradation, but this is still largely uncharted territory because of their simultaneous strong toxicity. In this study, we estimated potential antibiotics degradation by and effects on mixed microbial communities at concentrations sufficiently high to allow sensitive detection of biomass growth, but simultaneously, low enough to mitigate their toxic action. We used three different mixed inoculum sources freshly derived from freshwater, activated sludge or soil, and tested a series of 15 antibiotics from different classes at 1 mg C-carbon l−1 dosage. Consistent community growth was observed for freshwater and activated sludge with ampicillin, erythromycin and chloramphenicol, and with sulfomethoxazole for activated sludge, which was accompanied by parent compound disappearance. Community growth could be attributed to a few subclasses of recognized cell types by using supervised machine-learning-based classifiers. Most other tested antibiotics resulted in inhibition of community growth on background assimilable organic carbon, concomitant with altered composition of the resulting communities. We conclude that growth-linked biodegradation of antibiotics at low concentrations may be present among typical environmental microbiota, but for a selected subset only, whereas for the majority of antibiotics negative effects prevail without any sign of productive growth.
Introduction
Antibiotics are ubiquitously used and have become widely distributed in the environment at low (ng—μg l−1) concentrations (Kümmerer, 2009; Ma et al., 2014; Carvalho and Santos, 2016). Mostly being used to target pathogenic bacteria and infections, antibiotics act rather indiscriminately and inhibit any sensitive non-target bacterium residing in the same microbiome (Raymann et al., 2017; Grenni et al., 2018; Cycon et al., 2019). Even low (non-clinical) antibiotic concentrations are suspected to lead to selection and outgrowth of tolerant and resistant bacteria (Atashgahi et al., 2018; Cairns et al., 2018; Pärnänen et al., 2019; Yang et al., 2019), resulting in altered compositions and diversity of microbiota (Grenni et al., 2018; Yang et al., 2019; Tong et al., 2020). Hence, there is wide concern about the environmental occurrence and fate of antibiotics. However, while most studies have focused on selection of resistance formation to antibiotics (Cairns et al., 2018; Li et al., 2010; Pärnänen et al., 2019; Paul et al., 2018), there is a clear lack of knowledge on their biodegradation (Cycon et al., 2019; Reis et al., 2020a; b). Having a better grasp on possible antibiotic biodegradation reactions would potentially permit to develop mitigation or treatment procedures that might alleviate some of their negative ecological consequences.
As a result of their toxicity, microbial degradation studies with antibiotics are difficult to carry out. Some studies have claimed widespread existence of bacterial subsistence on antibiotics at high (therapeutic, ∼1 mg ml−1) concentrations (Dantas et al., 2008; Barnhill et al., 2010). However, ‘subsistence’ is relatively poorly defined (a twofold increase of biomass or culturable colonies in typical minimal media with the dosed antibiotic) and not equivalent to compound mineralization. Other studies have failed to reproduce antibiotics degradation at those concentrations and, instead, have attributed observed growth to other carbon-containing compounds in the used media (Walsh et al., 2013), or managed to reproduce the effect but could not show compound transformation (Bello Gonzalez et al., 2015). As emphasized by some recent comprehensive review studies (Cycon et al., 2019; Reis et al., 2020a; b), except for a few compounds such as sulfomethoxazole or penicillin G, hardly any solid data demonstrating biodegradation of antibiotics by bacteria and fungi exists. Furthermore, although for some compounds individual isolates producing possible metabolic intermediates were found, in general most antibiotics appear very recalcitrant and “non-biodegradable” (Cycon et al., 2019; Reis et al., 2020a; b). In contrast, several antibiotic biotransformation reactions are well documented, some of which directly contribute to resistance mechanisms, as they inactivate the inhibitory action of the parent compound (Cycon et al., 2019; Reis et al., 2020a; b). There is thus a major gap in the assessment of antibiotic biodegradation due to the use of high (therapeutic) antibiotic concentrations for microbial growth studies, which leads to toxicity and inhibition of most microbes. This also causes selection for resistant or tolerant microbes and not necessarily degrader bacteria. As a result, it makes it difficult to determine any growth-linked biodegradation of antibiotics by environmental microbial communities.
The aims of our study were to design experimental conditions that would permit to quantify biomass growth at the expense of single dosed antibiotics at low concentrations, and to simultaneously study their effects on community compositions. These concentrations would need to be below the typical minimal inhibitory concentrations (MIC) (Obayiuwana et al., 2018) to improve the chances to observe growth of bacterial strains using antibiotics as sole carbon and energy source. However, considering that the fraction of specialist degrader bacteria in environmental microbiota is very low (Thouand et al., 2011; Johnson et al., 2015; Martin et al., 2017), detection of specific growth at low compound dosages becomes extremely challenging and can be confounded by many factors.
Our hypothesis, therefore, was that productive utilization of antibiotics by strains in the target inoculum may become detectable as a growth surplus compared to a no–carbon medium control. Liquid media frequently contain an estimated 100–150 µg assimilable organic carbon (AOC) l−1 (Özel Duygan et al., 2021), which would be sufficient for growth of ∼106 cells ml−1 (Hammes and Egli, 2005; Vital et al., 2007; Vital et al., 2008). We used starting concentrations of antibiotics of 0.1 or 1 mg C-carbon l−1, which in case of utilization for biomass formation could potentially lead to an increase of 2–20 times the background growth and, as such, become detectable. We tested three inoculum sources (freshwater community; activated sludge community and soil community), with a total of 15 antibiotics. Community growth was quantified by flow cytometry counting of fluorescent-stained cells in time incubation series. Potential inhibitory effects of antibiotics on community growth and compositional shifts were further analyzed by a previously developed supervised machine-learning-based classifier that classifies cell types from flow cytometry data (Özel Duygan et al., 2020), and, in one case, by 16S rRNA gene amplicon analysis. For a subset of antibiotics for which good analytical methods were available, we quantified the fate of the parent compound in the incubations compared to abiotic controls. Our results indicate a few distinct cases of parent compound disappearance concomitant with community growth that can be attributed to a few cell types. For most antibiotics, however, mostly inhibition and corresponding community compositional shifts were observed.
Materials and Methods
Sources of Microbial Communities
Three different samples were used as sources for the starting communities to be tested for antibiotics effects. As freshwater inoculum source, we sampled Lake Geneva water from nearby St. Sulpice, Switzerland. 10 L of sample was recovered from right below the water surface in a Teflon-carboy, transported to the laboratory within 20 min and processed immediately, as described previously (Özel Duygan et al., 2020).
Secondly, 1 L activated sludge was obtained from the effluent Vidy Wastewater Treatment Plant (Lausanne, Switzerland). The activated sludge samples were transferred in Teflon-containers to the laboratory within 20 min and processed immediately. First, the sample was aliquoted in 50 ml Falcon tubes, centrifuged at 3,000 rpm for 5 min and decanted, after which the cell pellets were resuspended in 50 ml PBS (1X phosphate-buffered saline), pooled and mixed in kitchen blender for 3 min to disrupt flocks. The homogenized cell suspension was centrifuged at 800 rpm for 6 min to remove larger particles, the supernatant was decanted and further centrifuged at 5,000 rpm for 5 min. The cell pellet was then resuspended in PBS.
Finally, microbial cells were washed from 20 g of 2-mm sieved forest topsoil (−5–−10 cm), nearby Dorigny, Switzerland, following the protocol described by (Li et al., 2010). In short, cells were detached by mixing with 2 g l−1 sodium pyrophosphate solution at pH 7.5, then purified by sucrose density centrifugation and Nycodenz centrifugation-concentration. Cells were finally washed and diluted in PBS.
For all community preparations, the cell suspensions were kept on ice, serially diluted, stained with SYBR Green I (see below) and measured by flow cytometry to determine the cell density. Three to five replicate samples of the starting material were stored at −80°C for later DNA isolation and 16S rRNA gene amplicon community sequencing (see below). Incubation experiments were then started immediately.
Glassware and Mineral Medium Preparation
In order to minimize interference of background AOC, all Schott borosilicate glassware (500 ml flasks) was rinsed with 6M HCl four times, then four times with MilliQ water to eliminate residual carbon from dishwasher cleaning. Air-dried flasks were covered with aluminium foil and autoclaved. Artificial lake water (ALW) medium was prepared in 5-L size HCl-treated and sterile glass bottles as previously described (Özel Duygan et al., 2021). ALW contains, per L: 36.4 mg CaCl2·2H2O, 0.25 mg FeCl3·6H2O, 112.5 mg MgSO4·7H2O, 43.5 mg K2HPO4, 17 mg KH2PO4, 33.4 mg Na2HPO4·2H2O, and 25 mg NH4NO3, pH = 7.0. For each experiment, the ALW medium was prepared 1 day before starting the incubations and kept at 4°C; then filter-sterilized by passage through a 0.2–µm membrane.
Antibiotic Incubation Experiments
Washed and recovered freshwater, activated sludge and soil microbial community suspensions were diluted to a starting concentration of 105 cells ml−1 in 100 ml ALW in a 500 ml prepared Schott flask, closed with Teflon-lined septa and caps. A set of 14 antibiotics was selected on the basis of their mode of action (Table 1), which were dosed individually to each flask at a concentration of either 0.1 or 1 mg C L−1. As positive control we included 1 mg C l−1 of phenol, whereas non-amended flasks with medium only functioned as no-carbon controls for background growth. Per antibiotic or control three replicate flasks were prepared, which were incubated in the dark at 150 rpm rotary movement and 21°C for a maximum of 8 days (Table 2). Samples (1 ml) were withdrawn each day in a sterile laminar flow hood without opening the caps, using a syringe and long hypodermic needle. Samples were used for community size measurements (flow cytometry) and antibiotic concentrations (liquid chromatography mass spectrometry) as explained below.
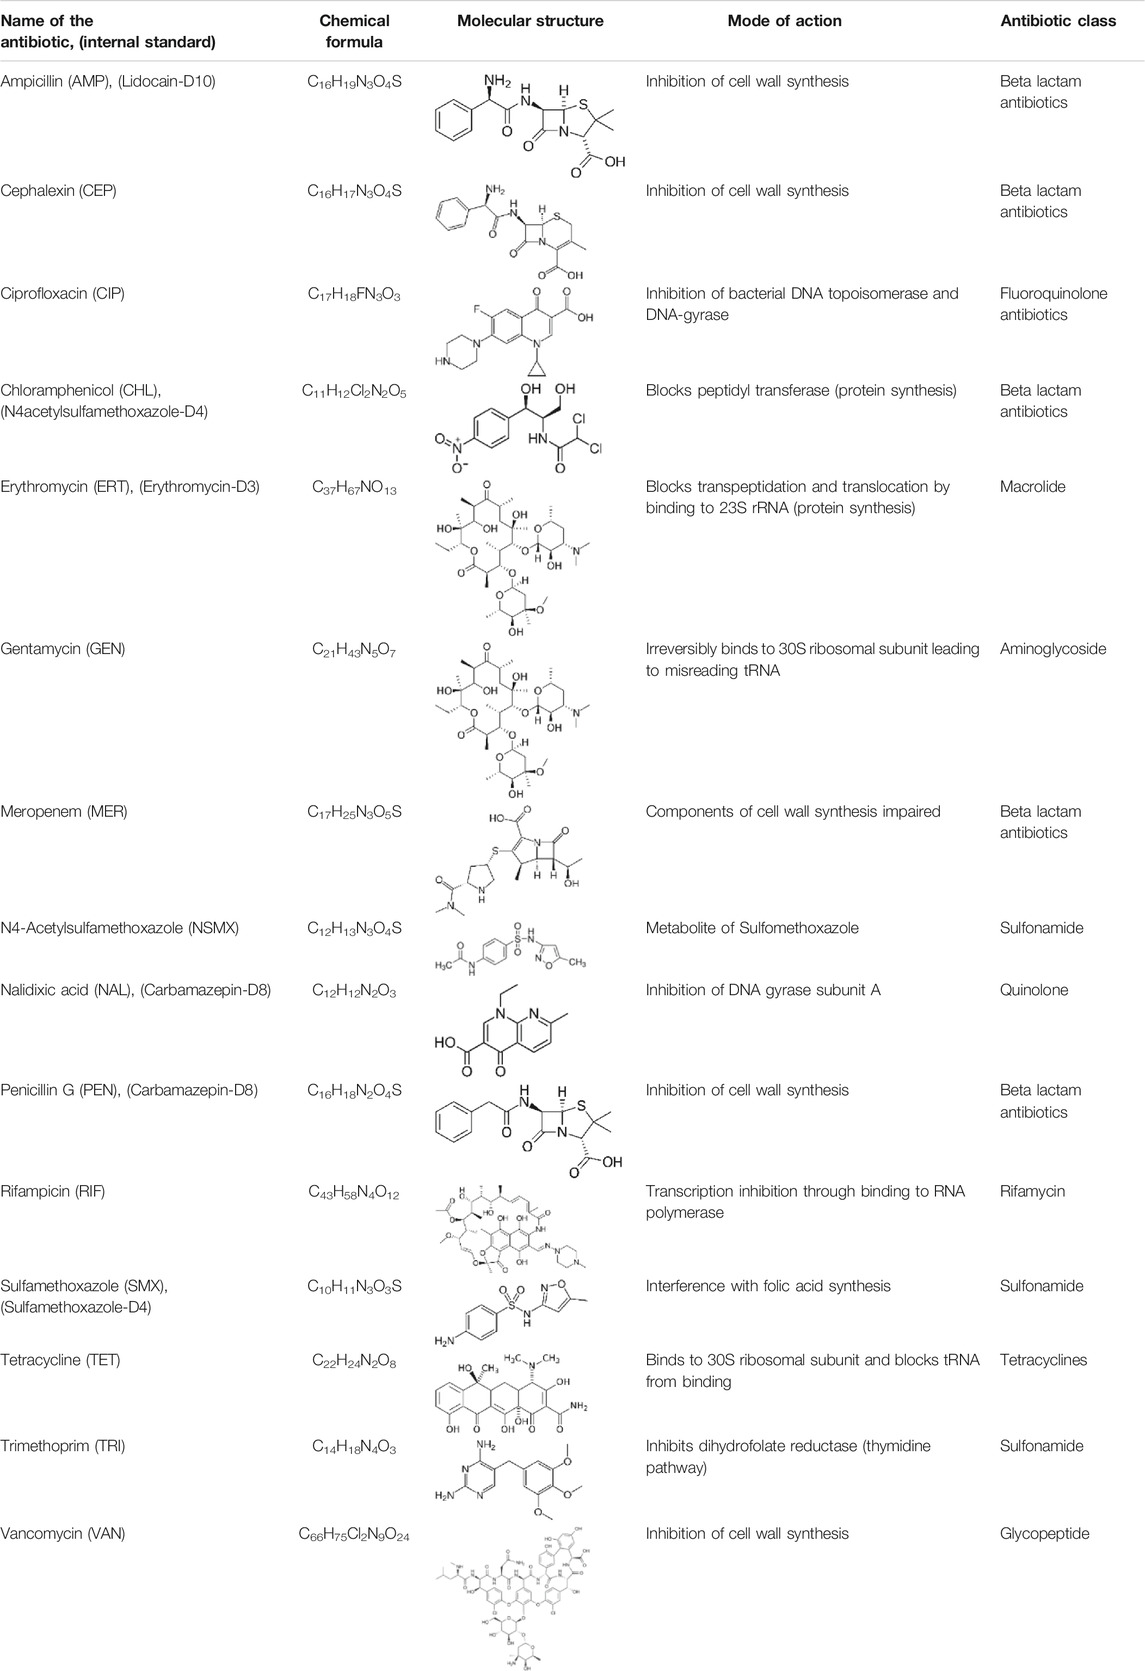
TABLE 1. List of antibiotics used in this study with chemical formula, molecular structure, mode of action and class (PubChem, https://pubchem.ncbi.nlm.nih.gov).
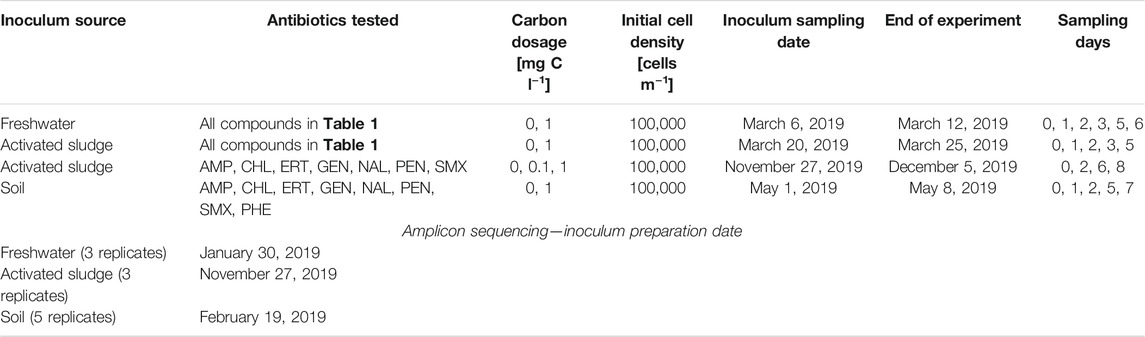
TABLE 2. Overview of the experiments.
Flow Cytometry and Cell Type Fingerprinting
Community samples (200 µL) were stained with 2 µL SYBR Green I (from a dilution of 10 µL original stock in 1 ml DMSO, Molecular Probes) and incubated in 96-flat-bottom-well-plates in the dark for 15 min. In case of counting dead cells, we additionally added 2 µL propidium iodide (from a dilution of 10 µL original stock in 1 ml DMSO, Molecular Probes). 20 µL of the stained samples were then aspired at 14 μL min−1 at a sample acquisition rate of (maximally) 35,000 events s−1 on a NovoCyte flow cytometer (ACEA Biosciences, Inc.), with thresholds as described previously (Özel Duygan et al., 2020). Seven parameters (FITC-A, FITC-H, FSC-A, FSC-H, SSC-A, SSC-H and Width) were recorded for each cell.
Data sets were exported as .csv files for analysis. Cells with negative values in any of the parameters were removed and only cells passing all thresholds were counted. Cells were additionally classified into a set of 32-predefined types (see Table 3) by using five independently acquired algorithms derived from a machine-learned pipeline for cell type classification (CellCognize) (Özel Duygan et al., 2020). For classification we used the maximum probability score for each cell of belonging to any of the 32 classes, as described previously (Özel Duygan et al., 2020).
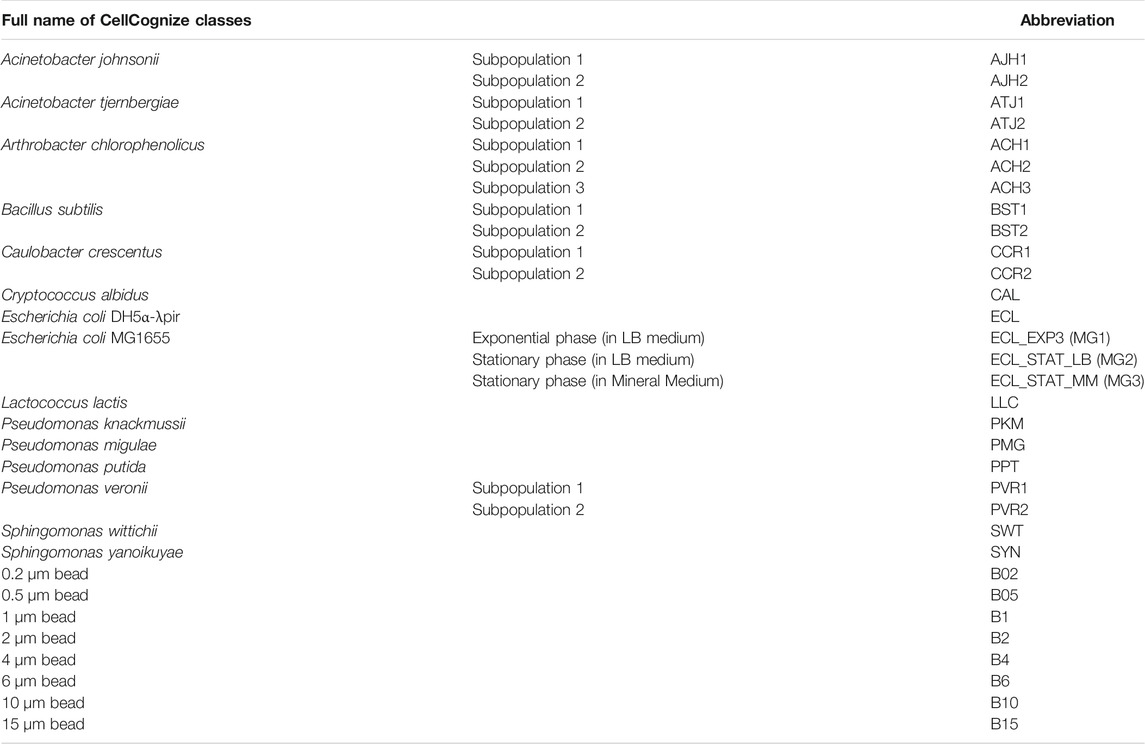
TABLE 3. CellCognize classes.
Analytics of Targeted Antibiotics
Based on preliminary experiments, ampicillin, chloramphenicol, erythromycin, nalidixic acid, penicillin and sulfamethoxazole were selected for chemical analysis. Samples (1 ml) from community incubations were centrifuged for 5 min at 15,000 rpm to remove cells, and 1 ml supernatant was transferred to an amber glass vial, which was capped and stored at –20°C until analysis.
For analysis, samples were thawed and diluted 100 times with ALW medium, and then spiked with internal standard solution (0.1% v/v; final concentration in the samples 0.05 μg L−1). The internal standard solution consisted of 13C-isotope-labeled equivalents of the target antibiotics (see Table 1) with similar chromatographic retention time, dissolved in ethanol (stock concentration of 50 μg L−1). Each targeted antibiotic was dissolved individually and diluted to prepare calibration curve standards (between 100 ng L−1 and 50 μg L−1), which were also spiked with the same internal standard solution. Samples and calibration standards were analyzed by liquid chromatography coupled to high-resolution mass spectrometry, and for analysis, 20 µL were injected. Chromatographic separation was performed over a reversed-phase C18 Atlantis T3® column (3 mm × 150 mm, 3 µm particle size). Mobile phase comprised of nanopure water (solvent A) (18.2 MΩ-cm-resistivity) and methanol (solvent B), both acidified with 0.1% formic acid, and were used to generate the following binary gradient elution profile: 0/95/95/5% B at 0/18.5/28.5/29 min at a flow rate of 0.3 ml min−1. HPLC eluates were introduced into a high-resolution mass spectrometer (Q Exactive Orbitrap, Thermo Scientific) via an electrospray ionization (ESI) probe operated in both positive and negative switching mode (4 kV/3 kV spray voltage, 325°C capillary temperature, 40 arbitrary units (AU) sheath gas, 15 AU auxiliary gas, 0 AU sweep gas, and 40°C auxiliary gas heater temperature). Mass spectra was acquired in full-scan mode at a mass resolution of 140,000 (FWHM at m/z 200) and the scan range was between 50 and 750 m/z. Data were analyzed using XCalibur software (Thermo Scientific, United States) for quantitative analysis with reference standards (the Quan Browser) and for the identification procedure (the Qual Browser).
Solid-Phase Microcolony Growth
Selected community enrichments on antibiotics were sampled and directly spreaded (1–5 µL) on MicroDish® platforms (Ingham et al., 2007) placed on 2 mm thick silica gel disks in ALW medium medium at pH 7, containing 1 mg C L−1 of the same target antibiotic (ampicillin, chloramphenicol, erythromycin, nalidixic acid, penicillin, or sulfamethoxazole). MicroDish-es were incubated for 3 days at 21°C, after which colonies were photographed on an inverted AF6000 LX epifluorescence microscope (Leica AG, Germany) equipped with a DFC350FXR2 camera at 40-fold magnification. Visible larger microcolonies were picked from the MicroDish surface using a MiBot mobile robot equipped with a stainless-steel sterilized needle (Imina Technologies, SA). Needles with colony material were transferred into 4 ml closed-cap teflon-lined glass vials with 1 ml ALW. After resuspending cells from the needles for 24 h at 150 rpm rotary movement, the cell density was measured by flow cytometry, after which the ‘pre-cultures’ were replicated to 104 cells ml−1 at start into three vials each, either dosed with the same antibiotics as used for enrichment (1 mg C l−1) or with medium only (no-carbon control). Vials were incubated and sampled as before for cellular growth.
Community Composition Analysis by 16S rRNA Gene Amplicon Sequencing
DNA was isolated from the time samples from one of the activated sludge incubation experiments, and from the freshwater (n = 3 replicates), activated sludge (n = 3 replicates) and soil inoculum suspensions (n = 5 replicates). Cells were collected from the samples by filtration on a Sartorius in-line filter holder (25 mm, polyethersulfone 0.22 µm, Sartorius), prewashed with 70% (v/v) ethanol in water, then rinsed three times with MilliQ water and air dried, UV-treated for 30 min and assembled to the vacuum line. Filters with cells were rolled with the help of sterile tweezers and stored at −80°C in 2-ml centrifuge tubes of the FastDNA ™ Spin Kit for Soil DNA extraction kit (MP Biochemicals) until processing. DNA was extracted using the protocol provided by the supplier (MP Biochemicals). Aliquots with 10 ng DNA were used to amplify the V3-V4 hypervariable region of the 16S rRNA gene using the 341f/785r primer set, Illumina adapters and barcodes, and PCR conditions, as indicated in the Illumina Amplicon sequencing protocol (https://supportillumina.com/documents/documentation/chemistry_documentation/16s/16smetagenomic- library-prep-guide-15044223-b.pdf). Equal amounts of amplified purified barcoded DNAs per sample were pooled and sent for bidirectional sequencing on the Illumina MiSeq platform at the Lausanne Genomic Technologies Facilities. Raw sequences were separated by barcode, then quality-filtered, concatenated, verified for the absence of chimera, dereplicated and mapped to known bacterial taxonomy using QIIME2 on a UNIX platform (Bolyen et al., 2019) at 99% similarity to the SILVA taxonomic reference database.
Statistics
Multidimensional scaling plots based on Bray-Curtis dissimilarity of the sample replicates were derived from the relative abundance of either each taxon (i.e., 16S rRNA amplicon sequence reads at SILVA taxonomy level 6) or CellCognize class (i.e., FCM fingerprints deconvoluted into 32 classes) in the phyloseq package in R.
Significance of enriched taxa (i.e., at SILVA taxonomy level 3, Class) in an antibiotic-incubated sample versus the no-carbon control at the same incubation time point comparison of triplicate community was calculated using the mattest function (MatLab 2019a) under 1,000 permutations, with a fold change cut-off 10, a false-discovery rate of 0.05 and a q value of 0.05.
Significance of mean community productivity or cell type productivity in an antibiotic-incubated sample versus the no-carbon control comparison of the triplicates was calculated using paired t-test (0 for p > 0.05, 1 for p < 0.05).
Results
Species Distribution in Targeted Microbial Communities
In order to address the capacity of resident microbial communities to subsist on antibiotics, we prepared communities of washed cells from freshwater, activated sludge or forest top soil. All three community inocula covered a wide phyla diversity (Figure 1A) but were distinct in multidimensional scaling plots based on relative abundances of assigned operational taxonomic units (OTU, 99% similarity to SILVA taxonomy of 16S rRNA genes) using Bray-Curtis distance (Figure 1B). Distributions of relative OTU abundances were skewed with 151 (activated sludge), 150 (freshwater) and 439 (soil) OTUs making up 90% of all detected taxa (Figure 1C). The proportion of potentially compromised or dead cells (i.e., propidium iodide positive in flow cytometry) in the washed communities varied from low (2%) in freshwater to high in soil (75–80%). This viability difference may have had effects on detectable community growth within the duration of our assays, as we explain below.
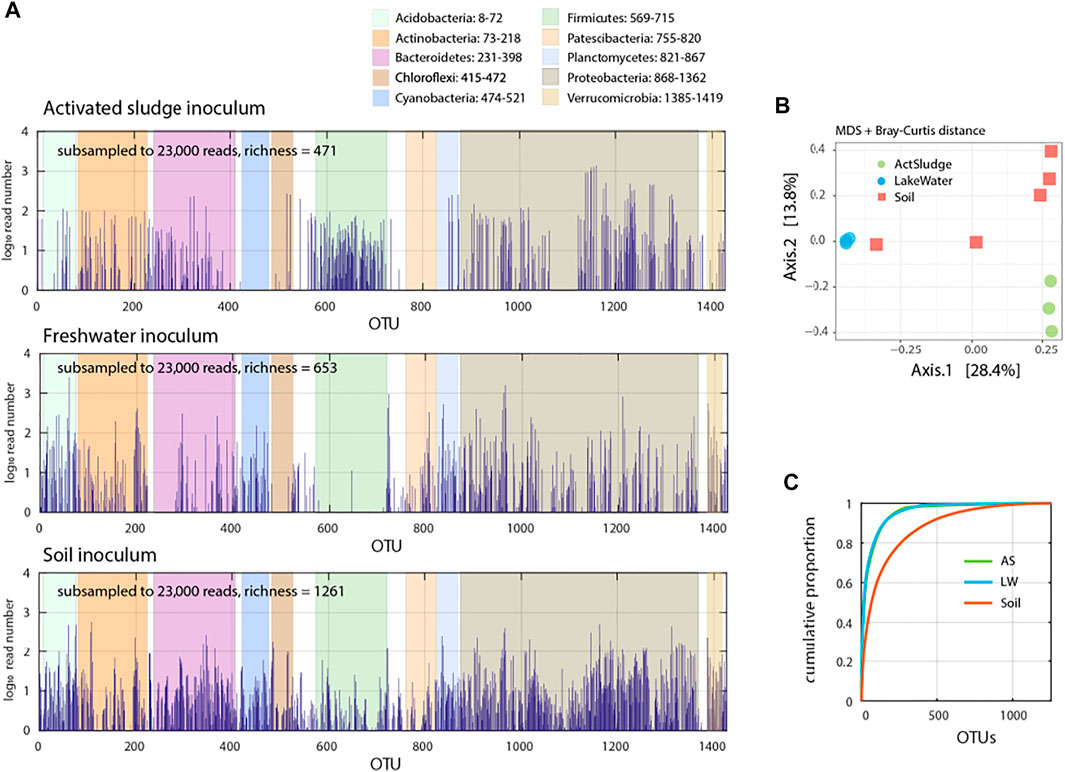
FIGURE 1. Species abundance in the target microbial communities. (A) Species distribution in activated sludge (Vidy Wastewater Treatment Plant), freshwater (Lake Geneva water) and top soil (University of Lausanne forest) microbiota determined from 16S rRNA amplicon sequencing. Read numbers normalized from summed (activated sludge and lake water, n = 3; soil, n = 5 replicates) subsampled down to 23′000 reads and its distribution over determined operational taxonomic unit (OTU), shown in semi-log plot. (B) Multidimensional scaling (MDS) plot of microbial communities Bray-Curtis dissimilarity based on relative abundance of subsampled (23,000) sequence reads. Circles and squares show individual replicates. (C) Cumulative proportion of sequence reads per determined OTU in the target microbiota.
Microbial Community Growth on Antibiotics as Sole Carbon and Energy Source
In order to assess whether antibiotics can be used as substrates for growth, the recovered and washed microbial communities were diluted to 105 cells ml−1 at start in closed batch liquid suspensions, dosed with individual antibiotics, and quantified over time (Table 1, n = 3 replicates per antibiotic, dissolved to 0.1 or 1 mg C l−1 - calculation based on compound carbon mass). Community growth was quantified by flow cytometry counting of SYBR Green I-stained cells. Community size increase in presence of antibiotics was compared to that of a no-added carbon medium control, consisting of the used mineral salts and its inherent background AOC, and further to a positive control, consisting of the same medium with added 1 mg C l−1 phenol, a readily biodegradable reference compound (Özel Duygan et al., 2021).
As expected, the community size in the no-carbon control increased after 5–6 days of incubation to between 2–5 × 10⁵ cells ml−1 depending on the source inoculum, indicative for utilisation of the medium-inherent AOC (Figures 2A–C; overview of all antibiotics shown in Supplementary Figures S1–S3). Incubations with phenol at 1 mg C l−1 led to significantly higher growth of freshwater or activated sludge bacteria to 1–2 × 10⁶ cells ml−1 within 6 days (Figures 2A,B). This was interpreted as a measure for the inherent viability of the inoculum sources, and was subsequently contrasted to potential growth on antibiotics and/or their inhibitory action.
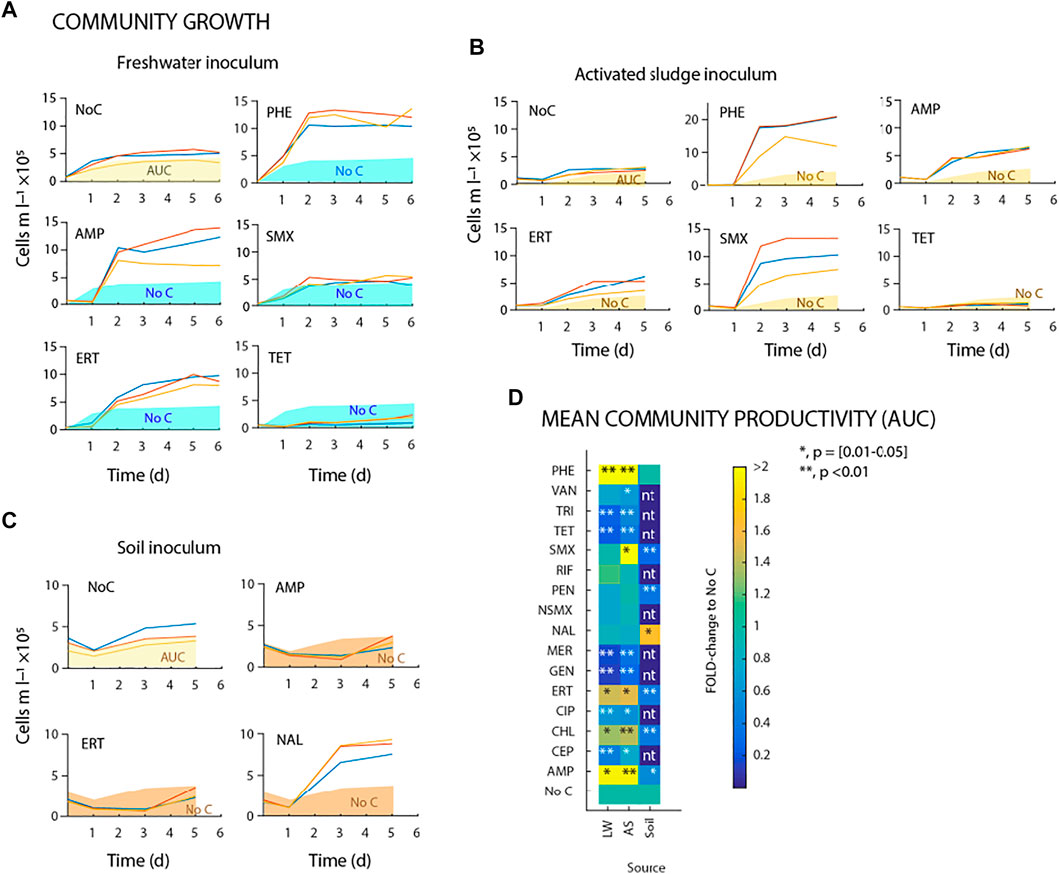
FIGURE 2. Microbial community growth on antibiotics as sole carbon and energy source. (A–C) Freshwater, activated sludge and forest top soil microbial community growth by flow cytometric cell counts during incubations with antibiotics. Shaded areas (green, yellow or brown bars) correspond to average background growth on triplicate no-carbon controls (NoC). (D) Comparison of mean community productivity (Area Under Curve; AUC) during incubation experiments (up to 6 days) with freshwater, activated sludge and forest top soil microbial communities (nbatch = 3 for each condition). The gradient color scale shows fold changes compared to no-carbon control. *indicates significant difference to no-carbon control (paired t-test).
Addition of antibiotics frequently caused an initial decrease in the community sizes compared to those in the no-carbon controls, which may be due to cell lytic action (e.g. day 0 and day 1 in Figures 2A–C). In comparison to the no-carbon control, the freshwater community size increased more during incubation with ampicillin (AMP) or erythromycin (ERT) at 1 mg C l−1 (Figure 2A). In contrast, sulfamethoxazole (SMX) had no effect whereas tetracycline (TET) and most other antibiotics (Supplementary Figure S1) caused clear inhibition of the freshwater community growth compared to the no-carbon control (Figure 2A). With activated sludge inoculum, community sizes increased more with 1 mg C l−1 of AMP or ERT compared to the freshwater communities, and also showed increased growth with SMX compared to the no-carbon control (Figure 2B; for all compounds, see Supplementary Figure S2). Chloramphenicol (CHL) at 0.1 mg C l−1 yielded net growth above that of the no-carbon controls with both inocula (Supplementary Figures S1–S2). Finally, with soil inoculum, neither AMP nor ERT, but in this case nalidixic acid (NAL) yielded net community growth within 5 days, whereas most others resulted in community decline (Figure 2C; for all antibiotics, see Supplementary Figure S3). As discussed below, the starting soil inoculum showed reduced cell viability as inferred from propidium iodide staining and from the lack of growth on PHE. This impeded proper interpretation of growth with dosed antibiotics, and we did not further consider the soil community data in our results.
Given that changes in community size were different in rate and magnitude for dosed compounds (e.g. Figures 2A–C, Supplementary Table S1), we compared compound effects relative to a calculated cumulative “area-under-the-curve” (AUC) as in (Piccardi et al., 2019), rather than relative to maximum community “yield” or a community growth rate, as illustrated in Figures 2A–C. The fold-change normalized ratio of AUC for antibiotic-incubated communities in comparison to the no-carbon control, showed statistically significant increases for AMP, ERT or CHL for both freshwater and activated sludge inocula, and for SMX for the activated sludge inoculum (Figure 2D; Supplementary Table S1). Consistent neutral effects (i.e., no statistically significant difference in AUC compared to that in the no-carbon controls) were observed upon addition of vancomycin, nalidixic acid, penicillin or rifampicin at 1 mg C l−1 (Figure 2D, Supplementary Figures S1–S5). In contrast, addition of trimethoprim (TRI), tetracycline (TET), meropenem (MER), cephalexin (CEP), ciprofloxacin (CIP) or gentamicin (GEN) at 1 mg l−1 reproducibly led to a significant decrease of community AUC across all experiments, indicative of inhibition of the growth of the microbial communities compared to the no-carbon controls (Figure 2D, p < 0.05, n = 3 biological replicates).
We attempted to isolate potential antibiotics-utilizing strains from the primary enrichment cultures. Although plating of the communities with increased AUC on silica-gel surface with artificial lake water (ALW) medium consisting of 1 mg C l−1 of the same antibiotics led to formation of colonies, none of those in isolation were capable of growing in ALW liquid medium with the same antibiotics. These colonies are therefore likely to have been false positives, opportunistically growing on traces of AOC in ALW medium. Alternatively, their growth may have been due to interdependent cooperative interaction among colonies (for details, see Supplementary Text S1). In conclusion, these results showed that few antibiotics led to consistent net community size increase compared to no-carbon controls, which is a first indication for biomass growth that can be attributed to antibiotic dosing. Most others showed inhibitory to neutral effects on community growth.
Disappearance of Antibiotics Dosed as Sole Carbon and Energy Source
The maximum fold-increase of AUC in incubations with dosed antibiotics was between 1.8 (CHL)—4.6 (SMX) (Figure 2D). In order to understand whether this increase could have been due to utilization of the dosed antibiotic as carbon or nutrient substrate, we measured concentrations of a selected number of antibiotics as a function of incubation time in the communities (Figure 3, Supplementary Table S2). In the freshwater community, the observed increase in AUC, compared to no-carbon controls, during incubation with AMP and ERT was accompanied by a decrease in antibiotic concentration (Figure 3A), whereas SMX concentrations remained the same. In the activated sludge incubations, all three compounds (AMP, ERT and SMX) decreased in concentration (Figure 3B). Parallel abiotic controls in ALW did not show any decrease of antibiotics concentration (Figure 3C). Without assuming any kinetic model but taking into account all time points measured, the concentration decreases were statistically significant (i.e., negative slopes of trend lines and r2 > 0.5, Supplementary Table S3) for AMP in both inocula, and for ERT and SMX in activated sludge (Figure 3C). The decrease was not due to sorption of the antibiotic to microbial biomass (Figure 3E), suggesting that it was due to biotransformation and may have led to the increase of community AUC. Also, the observed significant increase in community AUC with CHL (Figure 2D) was accompanied by its frequent disappearance in the medium (Supplementary Table S2), suggesting biotransformation.
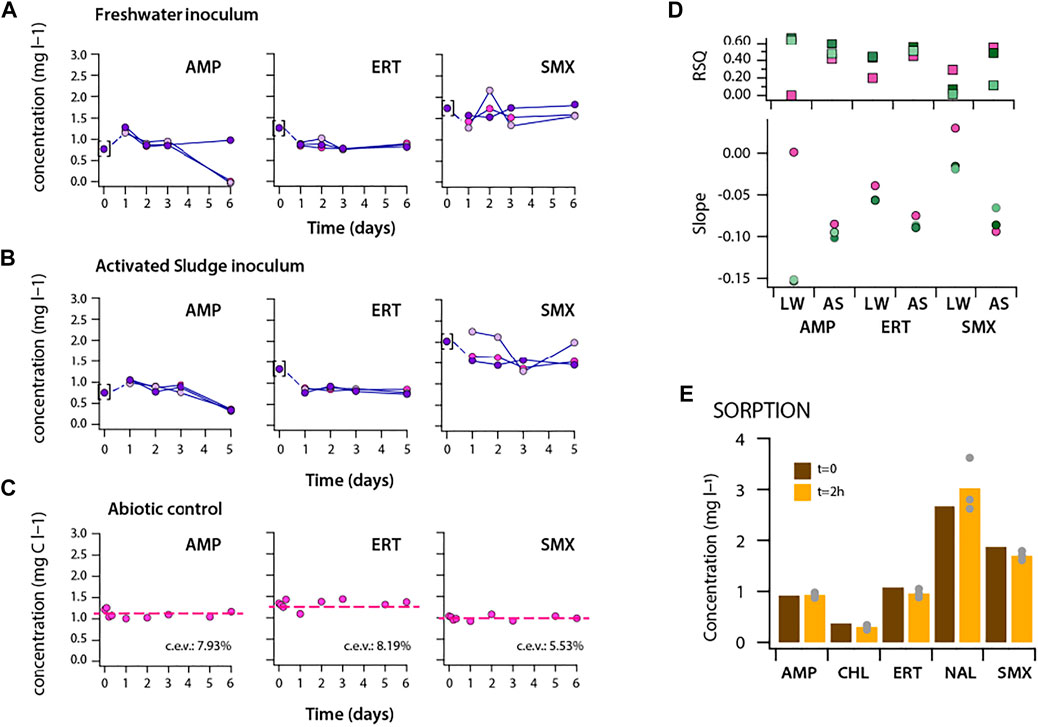
FIGURE 3. Antibiotic concentrations during incubation experiments with (A) freshwater, (B) activated sludge microbial communities in triplicate batches. Measurements at first sampling points (t:0) were shown in brackets as the sampling was done from the working stock solutions instead of individual closed batches for each condition (which may have caused the apparent concentration “increase” for AMP between start and day 1 sample). (C) Abiotic control experiment with the test compounds in ALW medium. Antibiotic concentrations of the target antibiotics in biotic or abiotic conditions are given in Supplementary Table S2. (D) r-squared values and slope of the trendlines of the target antibiotics (shown in (A–B)) during incubation experiments including all sampling points. (E) Sorption control experiment with antibiotics at initial biomass density of 100,000 cells per ml.
Antibiotics Cause Distinguishable Population Variations Within Communities
Community growth as a whole (e.g. AUC) may mask smaller magnitude enrichments among microbial subgroups within the communities. In order to further quantify such small-magnitude enrichments in the freshwater and activated sludge microbial communities during antibiotic incubation, we classified microbial cell types from the multidimensional flow cytometry data by similarity to a set of predefined 32 cell standards using a supervised machine-learning classifier (CellCognize) (Özel Duygan et al., 2020). Although CellCognize has no a priori knowledge on the taxa distribution in the used source communities, it calculates for each cell in the flow cytometry data the probability of similarity to one of the predefined 32 classes. As a first approximation, we used and report here the best class attribution for any cell. By plotting all class attributions for antibiotic incubations at all time points and replicates versus the corresponding no-carbon control, one can easily distinguish whether aberrations occur (i.e., enrichment or inhibition) in specific cell type populations during an incubation. For example, in the freshwater community incubations, addition of AMP or ERT led to an absolute increase of a variety of distinct cell type populations in comparison to the no-carbon control. Various cell type populations also became enriched in incubations with phenol, indicating that such enrichments truly represent growth of specific populations in the community (PHE, Figure 4A). In contrast, SMX did not cause major changes in cell type populations in the freshwater community, whereas gentamycin (GEN) inhibited growth of a variety of classes but not all (Figure 4A). Similarly, with activated sludge as inoculum, addition of SMX caused the most drastic increase of different cell type populations, but less so with AMP or ERT, and not visible for GEN (Figure 4A). These results are in agreement with the total community size data and the conducted antibiotic concentration measurements.
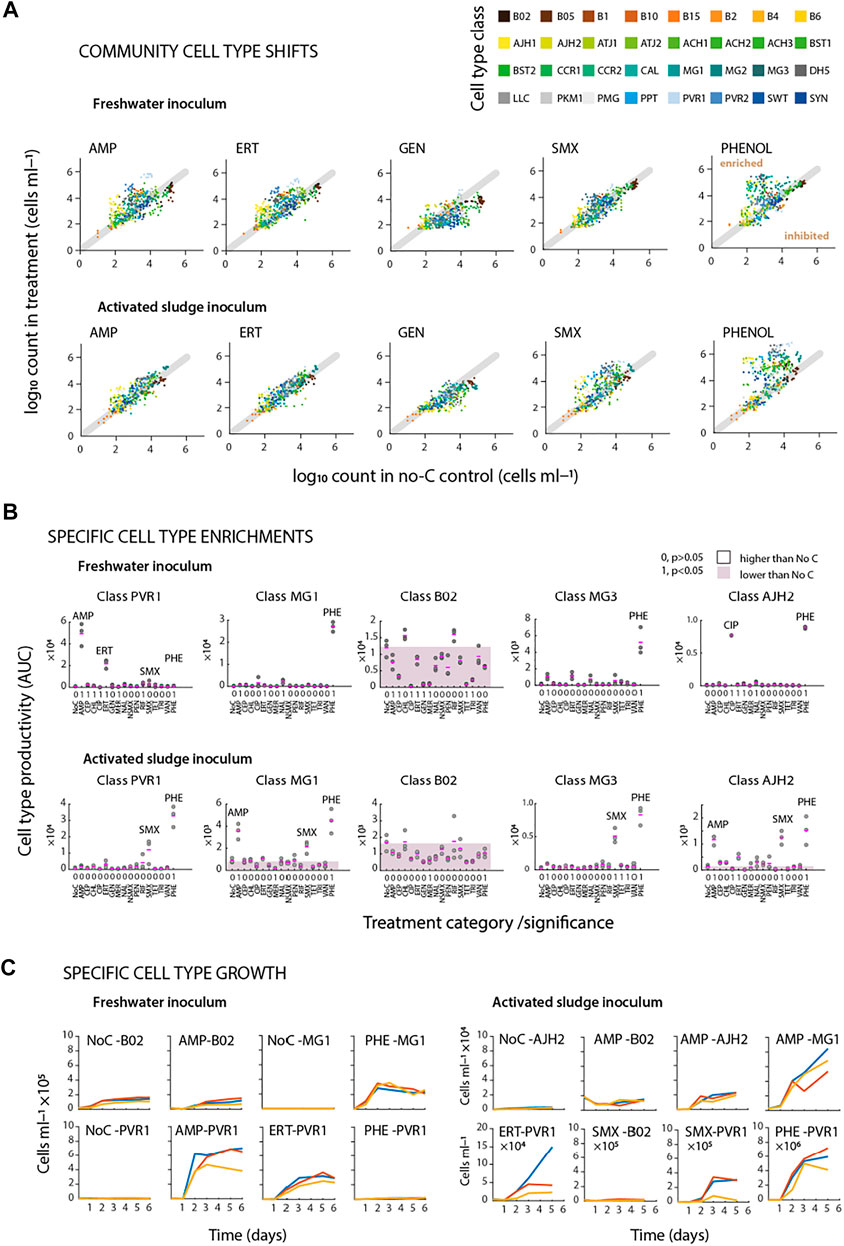
FIGURE 4. Identifying community variations from flow cytometric fingerprints. (A) Community cell type comparisons based on predefined 32 cell types. Dots (paired between treatments and no added carbon control series) represent absolute cell type abundances per replicate (nbatch = 3). Cell types shifting upwards of the diagonal line show enrichment as a function of added substrates. (B) Specific cell type productivity (Area Under Curve; AUC) during incubations of freshwater (t = 6 days) or activated sludge (t = 5 days) microbial communities. Pink dash lines show average of triplicate flasks. Shaded area shows mean productivity of No C series. Significance values are presented as 0 or 1 (true, false for p values <0.05). (C) Specific cell type growth during incubations of freshwater (left) or activated sludge (right) microbial communities in triplicate batches.
Considered as the growth of individual cell type populations (e.g., as their AUC in comparison to that in the no-carbon controls), the major enrichments for phenol (PHE) in the freshwater community occurred in the classes represented by the cell standards MG1, AJH2, and MG3 (Figure 4B, Supplementary Figure S4). Class enrichments were selective, because in the activated sludge source community on phenol other classes appeared (i.e., PVR1, Figure 4B), whereas, for example, the abundant class B02 did not react to phenol at all (Figure 4B, for a full representation of all classes, see Supplementary Figure S4). A single class enrichment (represented by the cell type population PVR1) stood out in freshwater community incubations with AMP or ERT (Figure 4B), with other minor ones detectable as well (Supplementary Figure S6), which was consistent with total community growth and antibiotic disappearance. Interestingly, other antibiotics such as ciprofloxacin (CIP) also led to significant increases of cell type populations (here AJH2, Figure 4B), but this was too small an effect to be observed at community size level. A different profile was observed for class enrichments with activated sludge inoculum, where AMP led to increases in cell type populations represented by the MG1 and AJH2 cell standards, and SMX enriching a variety of classes, suggesting implication of various different types of bacteria (Figure 4B, for a full representation of all classes, see Supplementary Figure S5).
Enrichment of the identified cell type populations was visible as specific subclass “growth” over time. For example, in comparison to freshwater community growth in the no-carbon controls, class B02 did not specifically enrich with AMP (Figure 4C, AMP-B02 versus NoC-B02), whereas class PVR1 increased rapidly (Figure 4C, AMP-PVR1, Supplementary Figure S6). Growth of the same cell type population also occurred with ERT but not with PHE, indicating selective response; despite the relatively coarse attribution of 32 cell type populations in our analysis (Figure 4C, ERT-PVR1 and PHE-PVR1). Freshwater community growth on phenol was again specific for class MG1 (Figure 4C, NoC-MG1 versus PHE-MG1). Growth of cell type populations within the activated sludge inoculum was different, with slower growth on AMP (e.g., cell type populations AJH2 and MG1), and variable growth for ERT and SMX (Figure 4C, note different abundance scales, Supplementary Figure S7). These examples thus indicate that the observed community growth in some cases (e.g., AMP and SMX) was due to distinguishable growth of a small number of cell type populations. In other cases (e.g., CIP), a single cell type population detectably and selectively grew but its size was insufficient to cause a significant effect on the total community size. In summary, the differentiation and quantification of cell type populations within the community strongly suggested selective responses to the antibiotics, potentially as a result of their biotransformation and usage as growth substrate.
Effects of Dead Cells
Addition of antibiotics to mixed communities could potentially lead to cell death, which then on its turn could provide sources of carbon and nutrients for growth of subpopulations of cells within the community. Therefore, we repeated incubations of freshwater community with ALW medium only or with ALW mixed with 25% of pasteurized dead cell community (assuming this would lead to nutrient release). Growth of the communities in these conditions was not significantly different, neither in selective enrichment or decrease of identifiable cell type populations (Figure 5A), nor in cell type productivities during 6 days of incubation (AUC, Figure 5B, p > 0.05). Therefore, we concluded that it is unlikely that released carbon from dead cells upon antibiotic dosing would cause the observed selective cell type population growth in antibiotic incubations.
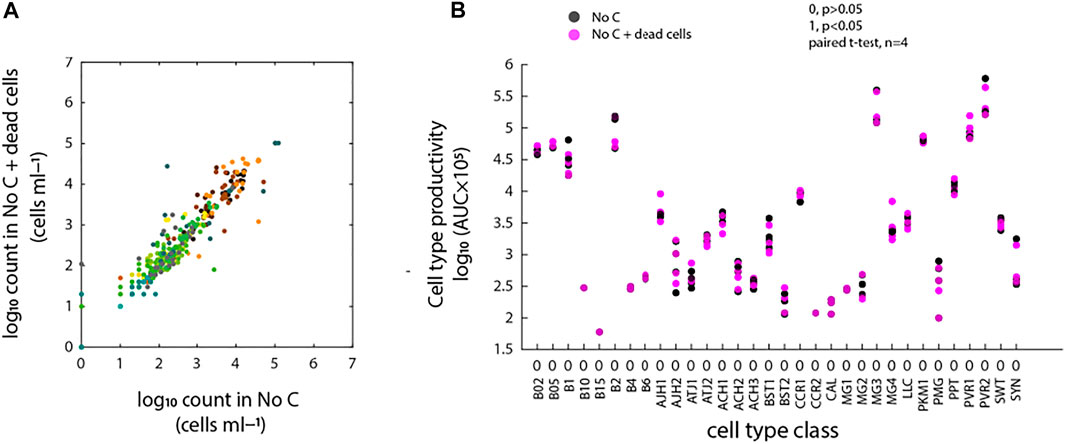
FIGURE 5. Effects of dead cells on background microbial community growth. (A) Community cell type comparison based on deconvoluted FCM fingerprints of freshwater microbial community into 32 CellCognize classes between the two conditions (i.e., no-carbon controls with or without addition of 25% of pasteurized dead cell community). Scattered dots represent absolute cell type abundances per replicate (nbatch = 4). (B) Cell type productivity (AUC) comparison between the two conditions for each CellCognize class. Significance level was calculated based on paired t-test (n = 4). 0 and 1 indicate significance level of p > 0.05 and p < 0.05, respectively.
Community Composition Changes Induced by Antibiotics
In order to better understand the effects of the dosed antibiotics on the communities as a whole (including potential inhibitory action), we further investigated community composition changes by CellCognize class attribution from flow cytometry data and 16S rRNA gene amplicon sequencing analysis on an independent activated sludge inoculum experiment.
Community compositions distinguished on multidimensional scaling (MDS) of CellCognize class attributions showed clear effects for most of the antibiotics in samples after 5–6 days, both for freshwater and activated sludge inoculum, explaining 57 and 74% of variance, respectively, in two dimensions (Figure 6A). Activated sludge inoculum contrasted to freshwater inoculum with apparent compositional MDS distances in incubations with SMX and RIF compared to their no-carbon and phenol controls (PHE). The MDS distance between CIP-incubated samples and the others was more striking for freshwater than activated sludge inoculum (Figure 6A). Addition of TET and AMP caused obvious community deviations for both inoculum sources, whereas the other antibiotics resulted in lesser variation compared to the no-carbon controls (Figure 6A). When shown on the same MDS plot, inoculum-dependent clustering of the antibiotics effects was significant (stress = 0.152664, rmse = 0.09952, p = 0.003 Supplementary Figure S8).
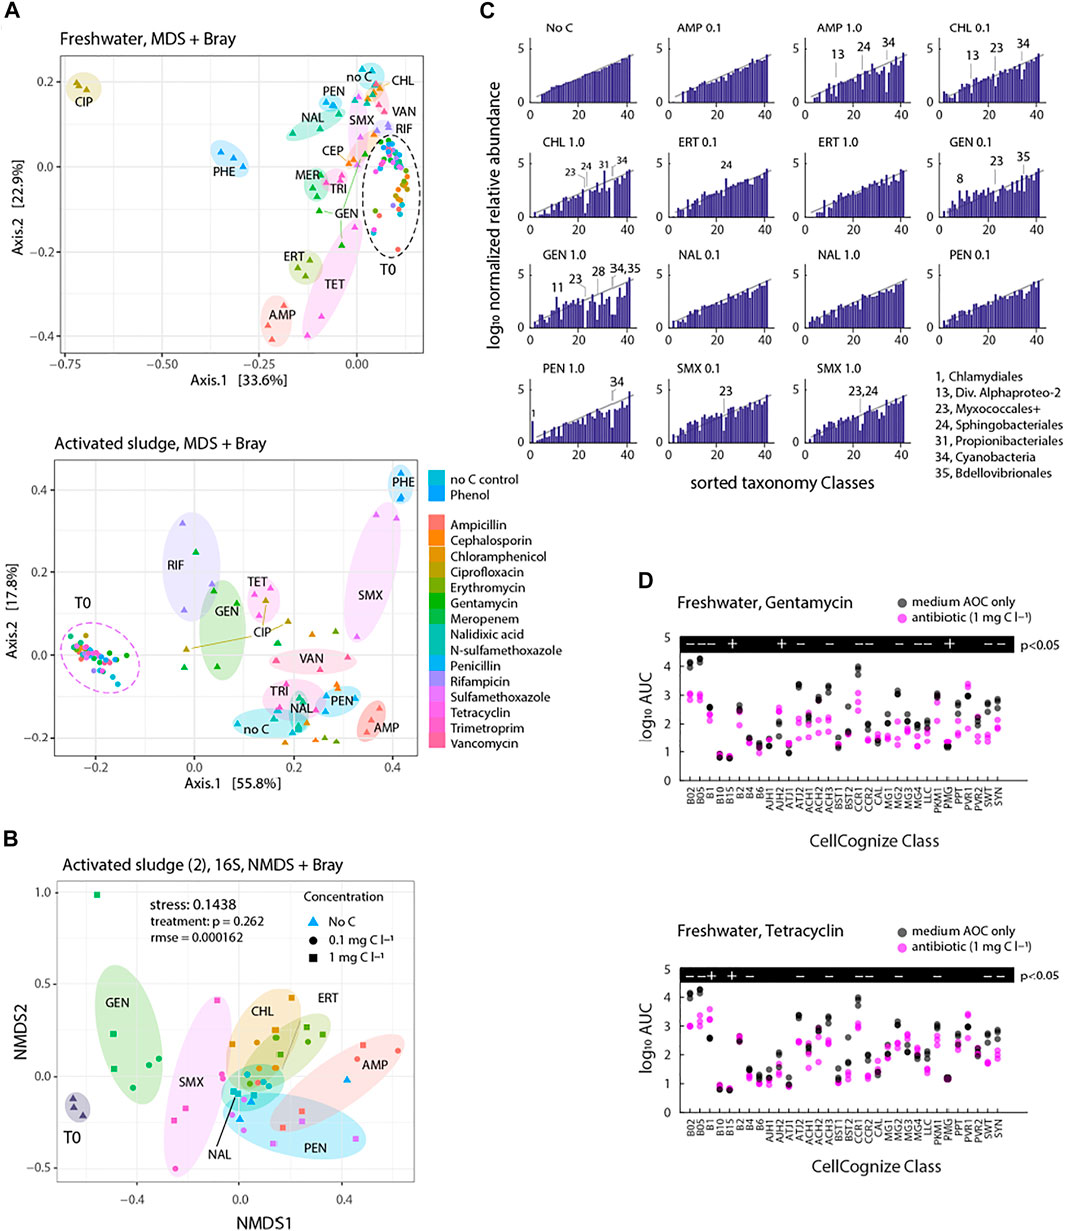
FIGURE 6. Freshwater or activated sludge community composition after incubation with antibiotics at nominal initial concentrations of 0.1 and 1 mg C L−1. (A) Community composition clustering based on Bray-Curtis dissimilarity distance (phyloseq package in R) of antibiotics or no added carbon control series (nbatch = 3) for 16S rRNA gene amplicon sequence SILVA-classified reads at taxonomy level 7 (stress 0.1438, rmse = 0.000162). Significance of treatment circumfered with transparently coloured ellipsoids is 0.262. (B) Community composition clustering based on Bray-Curtis dissimilarity distance (phyloseq package in R) of antibiotics or no added carbon control series for flow cytometric fingerprints deconvoluted into 32 cell types. Transparently coloured ellipsoids circumfere individual replicates per time points of incubations for treated activated sludge inoculum source. (C) Log10 normalized relative abundance of sorted Orders (taxonomy level 4) for each treatment condition compared to No C after 8 days incubation (the same activated sludge microbial community experiment as in (B). (D) Comparison of cell type productivity (AUC) of the incubation of freshwater community with gentamycin (top) or tetracycline (bottom) to no-carbon control (nbatch = 3). Significance of treatment effect was calculated with paired t-test (+is for p < 0.05 and—is for p > 0.05).
Based on 16S rRNA gene amplicon analysis of an independent activated sludge inoculum experiment, antibiotics amendment at two different concentrations (0.1 and 1 mg C l−1) led to significant community composition changes after 8 days of incubation (stress 0.1438, rmse = 0.000162, Figure 6B), but partly overlapping individual antibiotic- and concentration-effects (p = 0.262 for “treatment”). GEN, SMX and AMP deviated the most from the corresponding no-carbon controls, whereas CHL, ERT, PEN and NAL deviated less (Figure 6B).
16S rRNA gene amplicon analysis further suggested 7 out of 51 detected Classes to have a significantly changed relative abundance upon antibiotic addition, in comparison to the no-carbon control, after 8 days (Supplementary Figure S9; false discovery rate <0.05, q-value < 0.05). Depending on the dosed antibiotic, both decreases and increases compared to the no-carbon control (considered as inhibition and enrichment, respectively) were found within the same Class (see, for instance, the contrasting effects of AMP and CHL in the Actinobacteria and Bacteroida in Supplementary Figure S9). Gammaproteobacteria had the highest abundance in the initial community as well as after incubation with antibiotics and in the no-carbon control (Supplementary Figure S9).
Since the community size data had also suggested inhibitory responses by addition of antibiotics compared to no-carbon controls as mentioned above, we further compared log normalized relative abundances of sorted Orders (taxonomy level 4) based on the means of no-carbon controls for each antibiotic treatment condition after 8 days incubation. Members of the Myxococcales were frequently among the most inhibited, and in a concentration-dependent manner (CHL, GEN, SMX, Figure 6C). Also, members of the Sphingobacteriales, Cyanobacteria and Bdellovibriales were found specifically inhibited compared to no-carbon control (Figure 6C). In terms of the CellCognize differentiation, inhibition was frequently observed in the abundant B02, B05 and CCR1 classes (Figure 6D, examples GEN and TET for freshwater inoculum). These represent small cell sizes (e.g., B02 and B05) and curved bacteria (e.g., CCR1). These results thus showed that antibiotics cause selective inhibition on communities, which is inoculum source- and taxonomy level or cell type-dependent.
Discussion
Our study aimed to answer to what extent antibiotics with varying modes of action may be used as growth substrate at sub-MIC clinical levels (0.1 or 1 mg C L−1) (Obayiuwana et al., 2018) by diverse microbial community members. In conjunction, we studied how community composition is influenced by the exposure to the antibiotics, assuming both growth, neutral or inhibitory effects. We found some evidence for growth-linked biodegradation of antibiotics by regular environmental communities in fresh water, activated sludge or soil, even at low carbon concentrations. For ampicillin, erythromycin, chloramphenicol, and sulfomethoxazole, we found consistent community growth, which was accompanied by parent compound disappearance. Nalidixic acid also led to community growth but this was not verified by parent compound measurements. Our results were further supported by identification of specific cell type populations within communities for which we could demonstrate growth upon antibiotic amendment, suggesting these might consist of bacterial species that can profit from the antibiotics as carbon, nitrogen or energy substrates. For the remainder of the tested antibiotics, we found no evidence for community growth or specific increases of certain cell type populations, except for one case of distinct growth of a cell type similar to AJH2 with ciprofloxacin that was too small to lead to detectable community growth. Rather, most antibiotics led to inhibition of community growth on background AOC, and caused further clear changes in community composition.
Although biotransformation of selected antibiotics has been reported (Dantas et al., 2008) and individual strains using antibiotics as growth substrates have been isolated as recently summarized in (Reis et al., 2020a; b), there is still a lot of uncertainty about the fate of antibiotics in environmental microbial communities. Classical biodegradation studies and strain isolations are hampered and limited by the high toxicity of individual antibiotics, and have led to confusing and contradictory results (Walsh et al., 2013). Consequently, enrichment studies would have to be done at lower (0.1—1 mg C l−1) or even environmentally relevant antibiotic concentrations (<1 μg C l−1), but this leads to the difficulty of accurate detection of microbial growth. We tried to solve this conundrum here by quantifying microbial community cell numbers in closed batch system over time by means of flow cytometry coupled to a cell-type population recognition pipeline (i.e., CellCognize) (Özel Duygan et al., 2020). This allowed us to identify near real-time changes in absolute counts of cell-type populations within diverse microbial communities in comparison to no-carbon controls. Previously shown its usefulness for quantifying biodegradation of low concentrations of standard pollutants (e.g., phenol and 1-octanol) and fragrances in natural communities (Özel Duygan et al., 2021), this method was also valuable for assessing biodegradation of antibiotics. The observed specific community and subgroup increases, and corresponding chemical concentration measurements are strong indications that there is utilization of ampicillin, erythromycin, chloramphenicol, and sulfomethoxazole as growth substrates in the range of 0.1–1 mg C l−1 by members of natural environmental communities such as in freshwater or activated sludge.
Obviously, the difficulty with community growth studies at low substrate dosages is to provide a conclusive link between changes in cell population abundances and productive substrate utilization; in this case, the metabolism of the antibiotics. Instead of deducing cell population changes from relative abundances from typical 16S rRNA gene amplicon sequencing, the flow cytometry-based CellCognize pipeline used here gives absolute abundances of cell type populations. This makes it easier to discern growth of subpopulations within the community resulting from antibiotic addition compared to background growth in the no-carbon control. Comparison to no-carbon as “negative” and phenol as “positive” control showed unequivocally that there is selective enrichment of specific cell type populations in response to few select antibiotics (ampicillin, erythromycin, chloramphenicol or sulfomethoxazole) and inhibition in response to others, as one would intuitively expect. Antibiotics effects were also inoculum-dependent. For example, enrichment was observed with sulfamethoxazole in activated sludge but not in freshwater communities. The finding that multiple CellCognize-attributed cell types enriched simultaneously (e.g., ACH and PVR1 in ampicillin and erythromycin), suggested there may be multiple principal degraders or cooperating bacteria. In absence of a complete mass balance, we cannot completely ascertain that the antibiotics are indeed utilized for growth, but a rough calculation argues in favour of it. Chemical measurements suggested 30% (for erythromycin and sulfomethoxazole) to 100% (ampicillin, some freshwater replicates) parent compound disappearance, equivalent to a net community increase of 3–7 × 10⁵ cells ml−1, and equivalent in some cases to the community productivity on 1 mg C l−1 of added phenol. Previous measurements of phenol productivity in the same system showed mass carbon yields of 20% at 1 mg C l−1 dosage (Özel Duygan et al., 2021), which, when extrapolated, would indicate 6–20% yields for erythromycin or sulfomethoxazole and ampicillin, respectively. This would indicate at least partial utilization of the carbon structure of the parent compound for biomass formation. Consequently, although we did not focus on ciprofloxacin chemical measurements, the unique and selective enrichment of cell type AJH2 (and some others, Supp. Fig. 4) in freshwater incubations with ciprofloxacin up to 104 cells ml−1 would be indicative for 2% carbon utilization from the parent compound (assuming similar yields as for phenol). Future studies should confirm this by investigating stable transformation products of these antibiotics in order to further elucidate their biodegradation by natural microbial communities.
Is subsistence on antibiotics widespread? Our results clearly indicate that this is not the case, at least not at the concentrations used here, which is similar to conclusions reached in earlier studies with mixed wastewater inocula (Alexy et al., 2004; Gartiser et al., 2007; Yang et al., 2019) or soil (Walsh et al., 2013). Our inocula covered a wide range of taxa from soil (439 OTUs), freshwater (150 OTUs) and activated sludge (151 OTUs). Even though degrader bacteria might be present at very low initial numbers, we anticipated we would be able to detect their growth if there were any. The example of ciprofloxacin in freshwater inoculum suggests that we would have been able to detect enrichment of a subpopulation to 104 cells ml−1 in the community mixture. Even though there was quite a bit of variation among the target inocula and no “pre-enrichment” of exposure to antibiotics, this should mean that the fraction of viable specialist antibiotic degraders (except for the four or five positive cases detected here) was too low or non-existent.
Of the cases where we detected growth-linked antibiotics biodegradation, sulfomethoxazole was the most expected, since its biodegradation is now widely established (Reis et al., 2020a). However, growth-linked degradation of ampicillin, chloramphenicol and erythromycin is less well-described, except in a few studies (Lai et al., 1995; Gartiser et al., 2007; Pan and Chu, 2016), and suggests that such capacity may be present more widely. It would be interesting to follow up on this and attempt to obtain pure cultures of organisms that would grow on these compounds at low antibiotics concentrations only. Although we tried and deployed different experimental strategies (e.g. use of MicroDish® culture chips (Ingham et al., 2007)), we were unable to isolate pure cultures from the primary enrichments that continued to grow with the same antibiotics and at similar dose of 1 mg C l−1. Even subsequent dilutions of primary enrichment cultures into fresh ALW media did not lead to consistent further “enrichments”, which is likely due to the insufficient net growth advantage of potential antibiotic-degraders upon community dilution in the renewed media AOC background. We tried to resolve this by looking for and separating microcolonies on low carbon solid growth media in presence or absence of the antibiotic. However, even here opportunistic community members seemed to profit from background AOC and produce (micro-)colonies, despite the selective presence of the antibiotic as sole carbon and energy source. Such opportunistic growth might have also been possible with synergistic effects of resistant cells protecting those sensitive cells from antibiotics (Sharma and Wood, 2021). Potential avenues to enrich further for antibiotics degraders at low concentrations might be to deploy slow sand filter columns as in earlier selection studies with chlorinated compounds in the μg l−1 range (van der Meer et al., 1987) or adapt enrichment under flow to specifically designed microfluidics platforms e.g. (Mahler et al., 2018) where cells can be retained while being exposed to low antibiotics concentrations as sole carbon and energy sources. Eventually, 13C-labeled compound should be used to then confirm biomass incorporation and characterize transformation products.
Finally, most of the antibiotics caused selective inhibition of community growth and resulted in specific community composition changes, which were inoculum source- and cell type-dependent. This is not unexpected (Grenni et al., 2018; Cycon et al., 2019; Tong et al., 2020) but demonstrates anew the strong ecological effects exerted by the inhibitory action of the various antibiotics and thus the care society should be giving to avoid them entering into the various ecosystems in the first place.
Data Availability Statement
The datasets presented in this study can be found in online repositories. The names of the repository/repositories and accession number(s) can be found below: NCBI (accession: PRJNA744029). Raw flow cytometry data from all samples presented here are available from Flow Repository with experiment number FR-FCM-Z447 (https://flowrepository.org/id/ FR-FCM-Z447).
Author Contributions
BÖD and CG provided experimental data. BÖD, KF and JvdM analysed the data. BÖD and JvdM wrote the main text. All authors corrected and approved the final text.
Funding
This work was supported by grant 16800.1 PFIW-IW from the Swiss Commission for Technology and Innovation.
Conflict of Interest
The authors declare that the research was conducted in the absence of any commercial or financial relationships that could be construed as a potential conflict of interest.
Publisher’s Note
All claims expressed in this article are solely those of the authors and do not necessarily represent those of their affiliated organizations, or those of the publisher, the editors and the reviewers. Any product that may be evaluated in this article, or claim that may be made by its manufacturer, is not guaranteed or endorsed by the publisher.
Acknowledgments
We thank Bernadette Vogler and Daria Filatova for their help in antibiotics measurement and analysis and Lausanne-Vidy Wastewater Treatment Plant for providing us with activated sludge samples.
Supplementary Material
The Supplementary Material for this article can be found online at: https://www.frontiersin.org/articles/10.3389/fenvs.2021.737247/full#supplementary-material
References
Alexy, R., Kümpel, T., and Kümmerer, K. (2004). Assessment of degradation of 18 antibiotics in the Closed Bottle Test. Chemosphere 57 (6), 505–512. doi:10.1016/j.chemosphere.2004.06.024
Atashgahi, S., Sánchez-Andrea, I., Heipieper, H. J., van der Meer, J. R., Stams, A. J. M., and Smidt, H. (2018). Prospects for harnessing biocide resistance for bioremediation and detoxification. Science 360, 743–746. doi:10.1126/science.aar3778
Barnhill, A. E., Weeks, K. E., Xiong, N., Day, T. A., and Carlson, S. A. (2010). Identification of multiresistant Salmonella isolates capable of subsisting on antibiotics. Appl. Environ. Microbiol. 76 (8), 2678–2680. doi:10.1128/aem.02516-09
Bello González, Tde. J., Zuidema, T., Bor, G., Smidt, H., and van Passel, M. W. (2015). Study of the Aminoglycoside Subsistence Phenotype of Bacteria Residing in the Gut of Humans and Zoo Animals. Front. Microbiol. 6, 1550. doi:10.3389/fmicb.2015.01550
Bolyen, E., Rideout, J. R., Dillon, M. R., Bokulich, N. A., Abnet, C. C., Al-Ghalith, G. A., et al. (2019). Reproducible, interactive, scalable and extensible microbiome data science using QIIME 2. Nat. Biotechnol. 37 (8), 852–857. doi:10.1038/s41587-019-0209-9
Cairns, J., Ruokolainen, L., Hultman, J., Tamminen, M., Virta, M., and Hiltunen, T. (2018). Ecology determines how low antibiotic concentration impacts community composition and horizontal transfer of resistance genes. Commun. Biol. 1, 35. doi:10.1038/s42003-018-0041-7
Carvalho, I. T., and Santos, L. (2016). Antibiotics in the aquatic environments: A review of the European scenario. Environ. Int. 94, 736–757. doi:10.1016/j.envint.2016.06.025
Cycon, M., Mrozik, A., and Piotrowska-Seget, Z. (2019). Antibiotics in the Soil Environment-Degradation and Their Impact on Microbial Activity and Diversity. Front. Microbiol. 10, 338.
Dantas, G., Sommer, M. O., Oluwasegun, R. D., and Church, G. M. (2008). Bacteria Subsisting on Antibiotics. Science 320, 100–103. doi:10.1126/science.1155157
Gartiser, S., Urich, E., Alexy, R., and Kümmerer, K. (2007). Ultimate biodegradation and elimination of antibiotics in inherent tests. Chemosphere 67 (3), 604–613. doi:10.1016/j.chemosphere.2006.08.038
Grenni, P., Ancona, V., and Barra Caracciolo, A. (2018). Ecological effects of antibiotics on natural ecosystems: A review. Microchemical J. 136, 25–39. doi:10.1016/j.microc.2017.02.006
Hammes, F. A., and Egli, T. (2005). New Method for Assimilable Organic Carbon Determination Using Flow-Cytometric Enumeration and a Natural Microbial Consortium as Inoculum. Environ. Sci. Technol. 39, 3289–3294. doi:10.1021/es048277c
Ingham, C. J., Sprenkels, A., Bomer, J., Molenaar, D., van den Berg, A., van Hylckama Vlieg, J. E. T., et al. (2007). The micro-Petri dish, a million-well growth chip for the culture and high-throughput screening of microorganisms. Proc. Natl. Acad. Sci. 104, 18217–18222. doi:10.1073/pnas.0701693104
Johnson, D. R., Helbling, D. E., Lee, T. K., Park, J., Fenner, K., Kohler, H.-P. E., et al. (2015). Association of biodiversity with the rates of micropollutant biotransformations among full-scale wastewater treatment plant communities. Appl. Environ. Microbiol. 81 (2), 666–675. doi:10.1128/aem.03286-14
Kümmerer, K. (2009). Antibiotics in the aquatic environment - A review - Part I. Chemosphere 75 (4), 417–434. doi:10.1016/j.chemosphere.2008.11.086
Lai, H. T., Liu, S. M., and Chien, Y. H. (1995). Transformation of chloramphenicol and oxytetracycline in aquaculture pond sediments. J. Environ. Sci. Health . A: Environ. Sci. Eng. Toxicol. 30, 1897–1923. doi:10.1080/10934529509376311
Li, D., Yu, T., Zhang, Y., Yang, M., Li, Z., Liu, M., et al. (2010). Antibiotic resistance characteristics of environmental bacteria from an oxytetracycline production wastewater treatment plant and the receiving river. Appl. Environ. Microbiol. 76 (11), 3444–3451. doi:10.1128/aem.02964-09
Ma, J., Lin, H., Sun, W., Wang, Q., Yu, Q., Zhao, Y., et al. (2014). Soil microbial systems respond differentially to tetracycline, sulfamonomethoxine, and ciprofloxacin entering soil under pot experimental conditions alone and in combination. Environ. Sci. Pollut. Res. 21 (12), 7436–7448. doi:10.1007/s11356-014-2685-2
Mahler, L., Wink, K., Beulig, R. J., Scherlach, K., Tovar, M., Zang, E., et al. (2018). Detection of antibiotics synthetized in microfluidic picolitre-droplets by various actinobacteria. Sci. Rep. 8 (1), 13087. doi:10.1038/s41598-018-31263-2
Martin, T. J., Snape, J. R., Bartram, A., Robson, A., Acharya, K., and Davenport, R. J. (2017). Environmentally Relevant Inoculum Concentrations Improve the Reliability of Persistent Assessments in Biodegradation Screening Tests. Environ. Sci. Technol. 51 (5), 3065–3073. doi:10.1021/acs.est.6b05717
Meer, J. R., Roelofsen, W., Schraa, G., and Zehnder, A. J. B. (1987). Degradation of low concentrations of dichlorobenzenes and 1,2,4-trichlorobenzene byPseudomonassp. strain P51 in nonsterile soil columns. FEMS Microbiol. Ecol. 45, 333–341. doi:10.1111/j.1574-6968.1987.tb02410.x
Obayiuwana, A., Ogunjobi, A., Yang, M., and Ibekwe, M. (2018). Characterization of Bacterial Communities and Their Antibiotic Resistance Profiles in Wastewaters Obtained from Pharmaceutical Facilities in Lagos and Ogun States, Nigeria. Int. J. Environ. Res. Public Health 15 (7), 1365. doi:10.3390/ijerph15071365
Özel Duygan, B. D., Rey, S., Leocata, S., Baroux, L., Seyfried, M., and van der Meer, J. R. (2021). Assessing Biodegradability of Chemical Compounds from Microbial Community Growth Using Flow Cytometry. mSystems 6 (1), e01143–01120. doi:10.1128/mSystems.01143-20
Özel Duygan, B. D., Hadadi, N., Babu, A. F., Seyfried, M., and van der Meer, J. R. (2020). Rapid detection of microbiota cell type diversity using machine-learned classification of flow cytometry data. Commun. Biol. 3 (1), 379. doi:10.1038/s42003-020-1106-y
Pan, M., and Chu, L. (2016). Adsorption and degradation of five selected antibiotics in agricultural soil. Sci. Total Environ. 545, 48–56.
Paul, C., Bayrychenko, Z., Junier, T., Filippidou, S., Beck, K., Bueche, M., et al. (2018). Dissemination of antibiotic resistance genes associated with the sporobiota in sediments impacted by wastewater. PeerJ 6, e4989. doi:10.7717/peerj.4989
Pärnänen, K. M. M., Narciso-da-Rocha, C., Kneis, D., Berendonk, T. U., Cacace, D., Do, T. T., et al. (2019). Antibiotic resistance in European wastewater treatment plants mirrors the pattern of clinical antibiotic resistance prevalence. Sci. Adv. 5, eaau9124.
Piccardi, P., Vessman, B., and Mitri, S. (2019). Toxicity drives facilitation between 4 bacterial species. Proc. Natl. Acad. Sci. USA 116 (32), 15979–15984. doi:10.1073/pnas.1906172116
Raymann, K., Shaffer, Z., and Moran, N. A. (2017). Antibiotic exposure perturbs the gut microbiota and elevates mortality in honeybees. Plos Biol. 15, e2001861. doi:10.1371/journal.pbio.2001861
Reis, A. C., Kolvenbach, B. A., Nunes, O. C., and Corvini, P. F. X. (2020a). Biodegradation of antibiotics: The new resistance determinants - part I. New Biotechnol. 54, 34–51. doi:10.1016/j.nbt.2019.08.002
Reis, A. C., Kolvenbach, B. A., Nunes, O. C., and Corvini, P. F. X. (2020b). Biodegradation of antibiotics: The new resistance determinants - part II. New Biotechnol. 54, 13–27. doi:10.1016/j.nbt.2019.08.003
Sharma, A., and Wood, K. B. (2021). Spatial segregation and cooperation in radially expanding microbial colonies under antibiotic stress. ISME J. doi:10.1038/s41396-021-00982-2
Thouand, G., Durand, M.-J., Maul, A., Gancet, C., and Blok, H. (2011). New concepts in the evaluation of biodegradation/persistence of chemical substances using a microbial inoculum. Front. Microbio. 2, 164. doi:10.3389/fmicb.2011.00164
Tong, X.-n., Wang, X.-z., He, X.-j., Wang, Z., and Li, W.-x. (2020). Effects of antibiotics on microbial community structure and microbial functions in constructed wetlands treated with artificial root exudates. Environ. Sci. Process. Impacts 22 (1), 217–226. doi:10.1039/c9em00458k
Vital, M., Füchslin, H. P., Hammes, F., and Egli, T. (2007). Growth of Vibrio cholerae O1 Ogawa Eltor in freshwater. Microbiol. SGM 153, 1993–2001. doi:10.1099/mic.0.2006/005173-0
Vital, M., Hammes, F., and Egli, T. (2008). Escherichia coliO157 can grow in natural freshwater at low carbon concentrations. Environ. Sci. Technol. 10, 2387–2396. doi:10.1111/j.1462-2920.2008.01664.x
Walsh, F., Amyes, S. G. B., and Duffy, B. (2013). Challenging the concept of bacteria subsisting on antibiotics. Int. J. Antimicrob. Agents 41 (6), 558–563. doi:10.1016/j.ijantimicag.2013.01.021
Keywords: antibiotics, biodegradation, microbial communities, flow cytometry, machine learning
Citation: Özel Duygan BD, Gaille C, Fenner K and van der Meer JR (2021) Assessing Antibiotics Biodegradation and Effects at Sub-inhibitory Concentrations by Quantitative Microbial Community Deconvolution. Front. Environ. Sci. 9:737247. doi: 10.3389/fenvs.2021.737247
Received: 06 July 2021; Accepted: 03 September 2021;
Published: 16 September 2021.
Edited by:
Zhi Wang, Innovation Academy for Precision Measurement Science and Technology (CAS), ChinaReviewed by:
Maozhen Han, Anhui Medical University, ChinaHuub Rijnaarts, Wageningen University and Research, Netherlands
Copyright © 2021 Özel Duygan, Gaille, Fenner and van der Meer. This is an open-access article distributed under the terms of the Creative Commons Attribution License (CC BY). The use, distribution or reproduction in other forums is permitted, provided the original author(s) and the copyright owner(s) are credited and that the original publication in this journal is cited, in accordance with accepted academic practice. No use, distribution or reproduction is permitted which does not comply with these terms.
*Correspondence: Birge D. Özel Duygan, birgeozel@gmail.com; Jan R. van der Meer, janroelof.vandermeer@unil.ch
†Present address:Birge D. Özel Duygan, Institute of Microbiology, Centre Hospitalier Universitaire Vaudois (CHUV), Lausanne, Switzerland