Temporal and Spatial Variations in NDVI and Analysis of the Driving Factors in the Desertified Areas of Northern China From 1998 to 2015
 Xuyang Wang1,2
  Yuqiang Li
- 1Northwest Institute of Eco-Environment and Resources, Chinese Academy of Sciences, Lanzhou, China
- 2Naiman Desertification Research Station, Northwest Institute of Eco-Environment and Resources, Chinese Academy of Sciences, Tongliao, China
- 3University of Chinese Academy of Sciences, Beijing, China
- 4Gansu Institute of Forestry Survey and Planning, Lanzhou, China
- 5Ecological Environmental Supervision and Administration Bureau of Gansu Province, Lanzhou, China
China faces some of the most serious desertification in the world, leading to many problems. To solve them, large-scale ecological restoration projects were implemented. To assess their effectiveness, we analyzed normalized-difference vegetation index (NDVI) data derived from SPOT VEGETATION and gridded climate datasets from 1998 to 2015 to detect the degrees of desertification and the effects of human and climate drivers on vegetation dynamics. We found that NDVI of desertified areas generally decreased before 2000, then increased. The annual increase in NDVI was fixed dunes (0.0013) = semi-fixed dunes (0.0013) > semi-mobile dunes (0.0012) > gobi (gravel) desert (0.0011) > mobile dunes (0.0003) > saline–alkali land (0.0000). The proportions of the area of each desert type in which NDVI increased were fixed dunes (43.4%) > semi-mobile dunes (39.7%) > semi-fixed dunes (26.7%) > saline–alkali land (23.1%) > gobi desert (14.4%) > mobile dunes (12.5%). Thus, the vegetation response to the restoration efforts increased as the initial dune stability increased. The proportion of the area where desertification was dominated by temperature (1.8%) was far less than the area dominated by precipitation (14.1%). However, 67.6% of the change was driven by non-climatic factors. The effectiveness of the ecological restoration projects was significant in the Loess Plateau and in the Mu Us, Horqin, and Hulunbuir sandy lands. In contrast, there was little effect in the Badain Jaran, Ulan Buh, and Tengger deserts; in particular, vegetation cover has declined seriously in the Hunshandake Sandy Land and Alkin Desert Grassland. Thus, more or different ecological restoration must be implemented in these areas.
1 Introduction
According to the United Nations Convention to Combat Desertification (UNCCD), the desertification was defined as “land degradation in arid, semi-arid and dry sub-humid areas resulting from various factors, including climatic variations and human activities” (FAO (Food and Agriculture Organization of the United Nations), 1993). And this process can be considered as an important global issue, which is responsible for the change of the Earth’s surface (Tran and Campbell, 2015). Desertification has been threatening millions of people around the world. The 2001 report of the International Fund for Agricultural Development (IFAD), Geneva, Switzerland, showed that one-fourth of the Earth’s surface (except Antarctica) has been under threat of desertification, which covers more than 3.6 million hectares, and income losses from this process every year can be estimated to exceed $42 billion (IFAD, 2001). After the International Convention on Desertification of the United Nations has entered into force in 1996 (Jamal, 1997), the need to measure land degradation and desertification processes has substantially increased. While standard ground survey methods for undertaking such measurements are imperfect or expensive, it has been demonstrated that satellite-based and airborne remote sensing systems offer a considerable potential. Earth observation satellites provide significant contributions to desertification assessment and monitoring, particularly by providing the spatial information needed for regional-scale analyses of the relationships between climate change, land degradation and desertification processes. For example, many remotely sensed images of different types and spatial resolutions were adopted to study land cover in arid areas over a time period, such as the high and moderate resolution images like Landsat or SPOT (Wu and Ci, 2002; Alphan and Yilmaz, 2005; Arnous, et al., 2009), or coarse resolution data like MODIS, NOAA imagery (Hoang et al., 2005), or even radar images (Hoang et al., 2003; Del Valle et al., 2010). Such research showed that land degradation in the studied areas tended to increase due to impacts of drought and soil erosion associated with agriculture.
China is one of the countries most seriously affected by desertification due to a combination of increasing frequency and severity of drought caused by climate change and unsustainable human activities such as overgrazing, excessive deforestation, unreasonable reclamation for agriculture, firewood harvesting, and excessive groundwater withdrawal. To monitor desertification in China at frequent intervals, the State Forestry Administration of China organized a national desert survey that is conducted every 5 years. The first monitoring was from 1993–1996 and the fifth was conducted from 2013 to 2016 (Tu et al., 2016). The latter results indicated that the total area of desertified land in China was 2.61 × 10⁶ km2, accounting for 27.2% of the national land area. Desertification has affected 471 counties in 18 provinces, of which 99% are located in northern China. (We therefore focused on northern China in the present study.) For the desertified land, 1.17 × 10⁶ km2 are distributed in arid regions (with annual precipitation <200 mm), 0.94 × 10⁶ are in semi-arid regions (350–500 mm), and 0.50 × 10⁶ km2 are in sub-humid regions (400–800 mm). The area of aeolian desertification (where deserts are created by wind erosion) covers 1.83 × 10⁶ km2, accounting for 69.9% of the total area of desertified land. Compared with the results from the previous survey, in 2009, the desert area decreased by 12.12 × 10³ km2 over 5 years, with an annual reduction of 2.42 × 10³ km2 (National Desertification Monitoring Data, 2015).
Desertification has many negative effects. First, it damages the ecological environment, thereby threatening human survival, and can even create “ecological refugees”. Second, it decreases the productivity of land, thereby decreasing crop and animal production or even totally preventing agriculture and animal husbandry. In addition, desertification degrades ecosystem quality and reduces species diversity and abundance, thereby threatening biodiversity (NEPAPR, 1998). Facing these problems, China’s government implemented a range of restoration projects to control desertification. In 1958, the Chinese Communist Party’s Central Committee proposed a policy of “marching to the desert”, which focused on planting trees and grasses in desert areas. Since 1978, the government has implemented a series of large-scale ecological restoration projects, including the Three-Norths Shelter Forest Construction Program, which constructed large-scale artificial forests in northwestern, northern, and northeastern China. In addition, the 15th National Congress of the Communist Party of China in 1997 proposed a policy of “preventing desertification and improving the ecological environment”. Most notably, Vice-Premier Jiang Chunyun proposed a 50 years “building a cross-century ecological project” (Dong et al., 1999) that was divided into an initial stage (1998–2010), a middle stage (2011–2030), and a late stage (2031–2050). The initial stage is now complete, but the effectiveness of the ecological restoration projects implemented during this stage is not yet known. Given the long period covered by this project and the vast sums of money being invested, it’s necessary to assess the responses of vegetation cover (a primary indicator of the degree of desertification) to the project.
Vegetation is the main biological component of terrestrial ecosystems and plays an essential role in conserving soil and water, regulating the atmospheric composition, and mitigating the rise of greenhouse gas concentrations (Sun et al., 2015). Changes in vegetation cover will therefore have a huge impact on the environment. Studying changes in the vegetation cover of a site can provide a scientific basis for formulating rational land use patterns (Zhang et al., 2008b). However, surveying vegetation status over an area as large as China is expensive and time-consuming, making it necessary to find less expensive and faster methods, such as satellite remote sensing. The normalized-difference vegetation index (NDVI), which is derived from satellite remote-sensing data in the near-infrared and red bands (Piao et al., 2006), can meet this need. It is a good indicator for evaluating vegetation cover and an effective indicator for monitoring changes in vegetation and the ecological environment over large areas and with sufficient frequency to support monitoring of ecological restoration projects (Paruelo et al., 1997). NDVI datasets have therefore been widely used in ecological research (Fung and Siu, 2000; Pettorelli et al., 2005), studies of vegetation cover (Piao et al., 2003; Lin et al., 2012; Liu et al., 2016), studies of phenology (Clerici et al., 2012; Feng et al., 2017), and in agriculture (Wardlow and Egbert, 2008; Magney et al., 2016).
Climate change, human activities, and CO2 fertilization effects (increased vegetation growth in response to increasing CO2 levels) will affect the change in vegetation cover (Piao et al., 2006). Of the abiotic factors that affect plant growth, the effects of temperature and precipitation are the most direct and important (Nemani et al., 2003; Wang et al., 2015). The feedbacks between climate factors and NDVI change have become a key research focus around the world, and researchers have shown that temperature, precipitation, and vegetation NDVI are closely related (Nemani et al., 2003; Nie et al., 2012; Nie and Xu, 2015; Nash et al., 2017).
Based on this literature review, we designed the present study to evaluate the effectiveness of China’s ecological restoration projects since 1998 for land with different degrees of desertification using NDVI, and examined climate data to identify the driving factors responsible for the vegetation response. The rest of this review is organized as follows. The data and methods are described in Materials and Methods. The temporal and spatial variations of NDVI and its response to changes in temperature and precipitation are presented in Results. Discussion on the impact of climatic factors and ecological restoration on vegetation changes in desertified areas are provided in Discussion, followed by conclusions in Conclusions and Outlook. Our study provides guidance for policy makers to improve the success of their future ecological restoration work.
Materials and Methods
Study Area
Figure 1 shows that China’s area of desert is mainly distributed in the country’s arid and semi-arid northern temperate and warm-temperate zones, between 35°N and 50°N, and between 75°E and 125°E. The elevation of the study area is between −160 to 5,668, and the highest elevation is mainly located in the Qaidam Basin and its surrounding areas (Supplementary Figure S1). The region’s climate is dry, with annual precipitation less than 250 mm in most parts of the region, and there is a large temperature difference between day and night during the warm season. The maximum summer temperature ranges from 50 to 60°C, and the winter temperature ranges from −20°C to −30°C. According to China’s desert classification (Appendix Table 1), the desertified land in China can be divided into six different types: mobile dunes (29.3% of the total area in 2000), semi-mobile dunes (17.1%), semi-fixed dunes (14.4%), fixed dunes (9.8%), saline–alkali land (7.4%), and gobi (gravel) desert (22.0%).
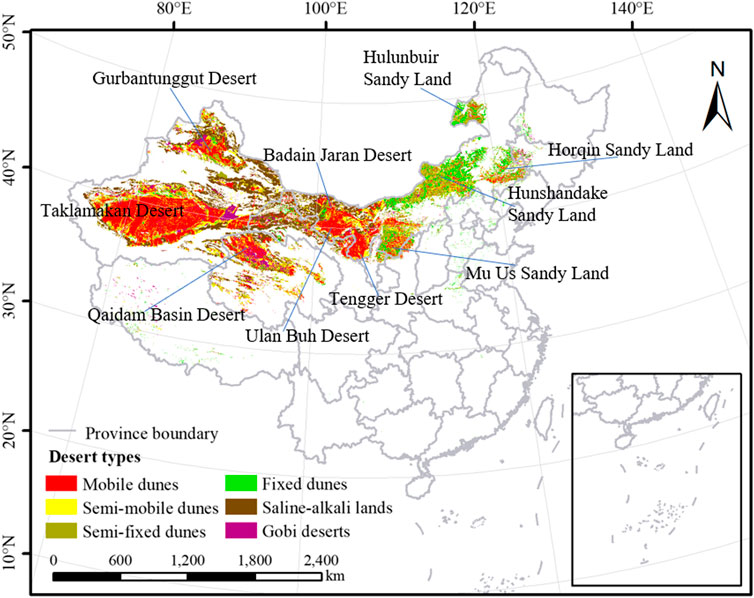
FIGURE 1. Location of the study area, and the spatial distribution of the desert types in 2000 based on a 1:100,000 scale desert-distribution map of China created from Landsat TM images. The desert types are defined in Table 1. Source: Environmental & Ecological Science Data Center for West China, National Natural Science Foundation of China (http://westdc.westgis.ac.cn).
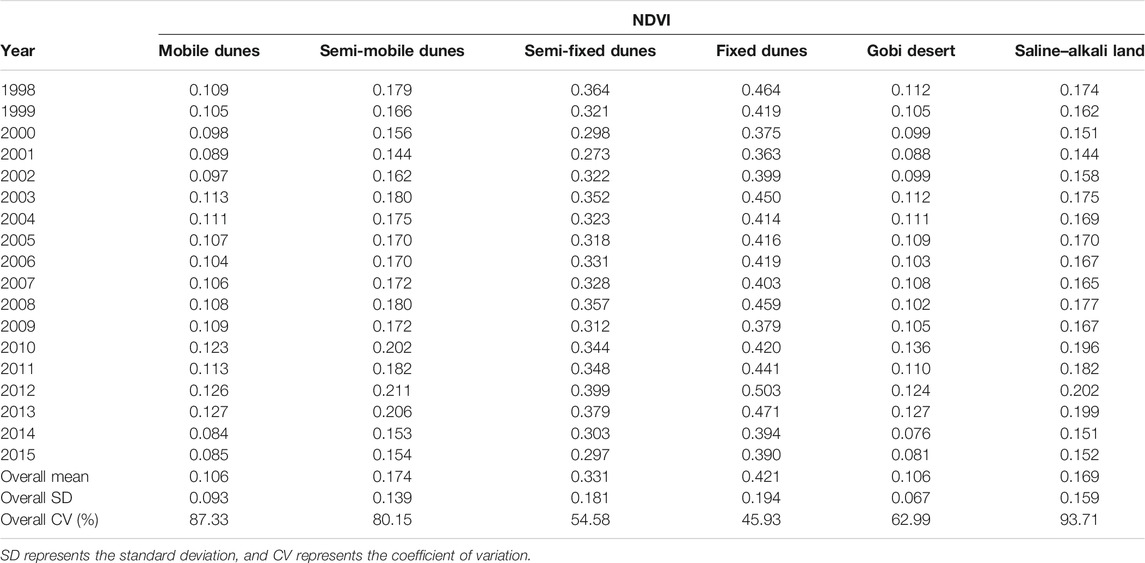
TABLE 1. Changes in the annual mean normalized-difference vegetation index (NDVI) for different desert types from 1998 to 2015 in China, and statistical measures of their variation.
There are many deserts and four major sandy lands in the study area: In the west, the Taklamakan Desert covers 337 600 km2; it is the largest desert in China and the second-largest area of mobile dunes in the world. Northeast of this desert, the Gurbantunggut Desert covers 48 800 km2, and to the southeast lies the Qaidam Basin, which covers 34,900 km2; both deserts are dominated by mobile dunes. In the center of the study area, the Badain Jaran Desert covers 44 300 km2. South of this desert, the Ulan Buh Desert covers 9,900 km2, and is dominated by mobile dunes, and the Tengger Desert contains the mobile dunes with the fastest migration rate in China, covering an area of 42,700 km2.In addition, the eastern part of the study area contains four major sandy lands: The Mu Us Sandy land covers 32,100 km2 and is dominated by fixed and semi-fixed dunes. The Hunshandake Sandy Land covers 21,400 km2, but because it has more water than most of the study area, it is covered by lush grassland. The Horqin Sandy Land covers 42,300 km2, and was once covered by lush vegetation dominated by palatable grasses; however, starting in the 1950s, the region’s landscape began to undergo severe desertification and it is now dominated by fixed dunes. The Hulunbuir Sandy Land covers 7,200 km2, and is dominated by fixed and semi-fixed dunes.
Data Sources
NDVI Data
We used NDVI as an indicator of vegetation cover. NDVI is calculated as follows:
Where Red and NIR represent the spectral reflectance measurements acquired in the red (visible) and near-infrared regions, respectively (Purevdorj et al., 1998). We used a NDVI dataset for the period from 1998 to 2015 derived from the VEGETATION sensor onboard the SPOT-4 satellite. This data is collected by the Kiruna (Sweden) ground station, and the image quality is controlled by a monitoring center in Toulouse (France), which provides relevant parameters (such as calibration coefficients). The VEGETATION Processing Center of the Flemish Institute for Technological Research is responsible for preprocessing of the global vegetation data at a spatial resolution of 1 km and a temporal resolution of 10 days (Duchemin, 2004). To ensure the data quality, the institute implements simplified methods for atmospheric corrections, radiation corrections, and geometric corrections (Rahman and Dedieu, 1994). We further processed the data using the maximum-value compositing (MVC) algorithm (Holben, 1986) to minimize non-vegetation effects caused by cloud cover, atmospheric interference, and large solar zenith angles (Stow et al., 2007). The SPOT VEGETATION dataset has been widely used by scholars in many countries to study vegetation and the ecological environment (Fraser and Li, 2002; Delbart et al., 2006; Stibig et al., 2007; Zhou et al., 2009; Song et al., 2010).
We obtained monthly NDVI (MNDVI) data using the MVC algorithm, as follows:
where NDVI1, NDVI2, and NDVI3 represent the maximum NDVI during the first 10 days, second 10 days, and third 10 days in each month, respectively. We then used the same method (i.e., the MVC algorithm) to process the MNDVI values and calculate the annual NDVI values.
Desert Map of China
The desert area in 2000 was classified into the six major types in Appendix Table 1 using the 1:100 000 scale desert distribution map of China (http://westdc.westgis.ac.cn), which was created by interpreting Landsat TM data.
Climate Data
We obtained annual average temperature and total precipitation data from 1998 to 2015 from the Data Center for Resources and Environmental Sciences, Chinese Academy of Sciences (http://www.resdc.cn). These gridded datasets (1 km × 1 km) were interpolated using the ANUSPLIN software (Hutchinson, 1998) based on daily observations from more than 2,400 meteorological stations distributed throughout China. We extracted the gridded datasets for the study area using the Extract by Mask tool provided by version 10.3 of ArcMap (https://desktop.arcgis.com/en/arcmap/).
Analyses
Trend Analysis
We used linear regression analysis to analyze the NDVI trends over time. We calculated the trend for each pixel (the slope) using the Raster Calculator tool provided by version 10.3 of ArcMap using the following formula:
Where i represents the number of the year (i.e., 1998 = 1), and Yi represents the NDVI value in year i. The vegetation cover increased when slope >0, decreased when slope <0, and was stable when slope ≈0.
Correlation Analysis
The partial correlation coefficient measures the degree of association between two random variables after removing the effects of the set of controlling random variables (Baba et al., 2015). In the present research, we calculated the pixel-based partial correlation between the effects of the two climatic variables (temperature and precipitation) on the NDVI change (i.e., the slope of the trend for each pixel). First, we calculated the linear correlation coefficient using the following formula:
Where Rxy is the linear correlation coefficient for the variables x and y, xi and yi are the values of these variables in year i,
Where Rxy,z is the partial correlation coefficient between the dependent variable x and the independent variable y after the independent variable z is fixed. We tested the significance of the partial correlation coefficient using the t test:
Where n is the number of samples (for the time series from 1998 to 2015, n = 18), and m is the number of independent variables.
In fact, the change of one factor is often affected by the combined effects of multiple factors, and the factors are interrelated. Thus, we calculated the multiple-correlation coefficient based on the correlation and partial correlation coefficients, as follows:
Where Rx,yz is the multiple-correlation coefficient for the dependent variable x and the independent variables y and z. We used the F-test to identify significant multiple-correlation coefficients, as follows:
Where n is the number of samples (for the time series from 1998 to 2015, n = 18), and k is the number of independent variables. The specific processing steps of this study are presented in Supplementary Figure S2.
Results
The Multi-Year Mean NDVI in the Study Area
Spatial Distribution of the Multi-Year Mean NDVI
The overall regional vegetation cover characteristics can be indicated by the multi-year mean NDVI from 1998 to 2015 (Figure 2). Overall, the NDVI values increased from west to east, and ranged from 0 to 0.88. The areas with the highest NDVI were mainly located in the Horqin Sandy Land and the Hulunbuir Sandy Land. The NDVI of the Mu Us Sandy Land and the Hunshandake Sandy Land were mainly between 0.14 and 0.40. Areas with poor vegetation cover, with NDVI <0.13, were common in most parts of the western desert area. However, the values ranged between 0.14 and 0.24 in the Gurbantunggut Desert, which is in the center of the Junggar Basin, in the Xinjiang Uygur Autonomous Region.
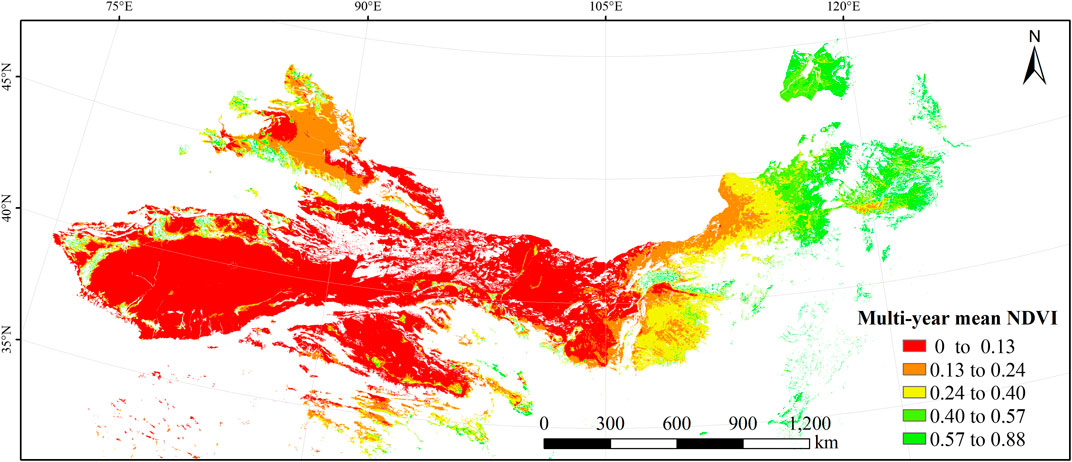
FIGURE 2. Spatial distribution of the multi-year mean normalized-difference vegetation index (NDVI) of the desertified area of China from 1998 to 2015. The NDVI intervals were calculated using the natural-breaks method provided by ArcMap.
The Vegetation Cover of Different Desert Types
The vegetation cover varied greatly for the six desert types during the study period (Table 1). For the multi-year mean NDVI, the value decreased in the following order: fixed dunes (0.421) > semi-fixed dunes (0.331) > semi-mobile dunes (0.174) > saline–alkali land (0.169) > mobile dunes (0.106) = gobi desert (0.106). Due to the effects of gradual restoration of desertified land, the coefficient of variation (CV) for each desert type exhibited the following trend: saline–alkaline land (93.7%) > mobile dunes (87.3%) > semi-mobile dunes (80.2%) > gobi desert (63.0%) > semi-fixed dunes (54.6%) > fixed dunes (45.9%). This indicated that the vegetation cover tended to be more variable during the initial stages of vegetation restoration. The CV values of saline-alkali land were higher than those of the other desert types, suggesting that vegetation restoration was most unstable in the saline–alkali land.
Temporal and Spatial Variation of Vegetation Cover for the Different Desert Types
Temporal Variations of NDVI Changes in the Desertified Area of China
Figure 3 shows the temporal variations of NDVI for the six desert types from 1998 to 2015. The annual variation had similar trends for the six desert types, with decreases until 2000 followed by increases from 2001 to 2003. There was little change from 2004 to 2006, followed by fluctuations after 2007 and a peak in 2012/2013, followed by a decrease until 2015. Fixed and semi-fixed dunes had the highest NDVI values, both of which were much higher than in the other desert types throughout the study period, with a lower NDVI for semi-fixed dunes than for fixed sand dunes. Similarly, mobile and semi-mobile dunes showed very similar NDVI values throughout the study period, as did Gobi desert and saline–alkali land, though NDVI was always lowest for the two latter types.
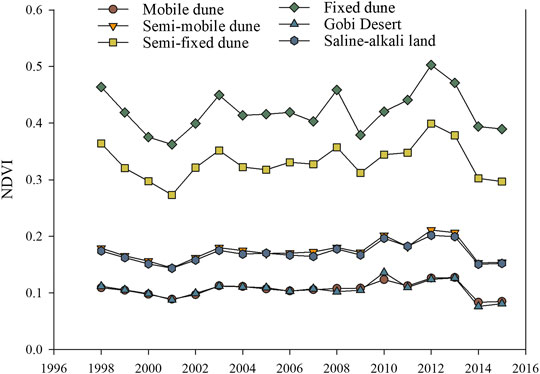
FIGURE 3. The inter-annual variations of the normalized-difference vegetation index (NDVI) for the six desert types.
Spatial Pattern of NDVI Changes in the Desertified Area of China
The NDVI values showed little change in the Badain Jaran, Ulan Buh, and Tengger deserts in the central part of the study area and in many deserts in the western part (Figure 4), suggesting that desertification has slowed or stopped in these areas rather than continuing to develop. A large area of light degradation took place in the Gurbantunggut Desert in the northwestern part of the study area. In contrast, areas with increasing vegetation cover were mainly located in the Mu Us, Horqin, and Hulunbuir sandy lands in the eastern part of the study area, as well as around the northern margins of the Taklamakan Desert and southern margins of the Gurbantunggut Desert. The vegetation cover improved particularly greatly in the Mu Us Sandy Land and at the edges of the Horqin Sandy Land. However, not all of these changes were statistically significant (Figure 5). Nonetheless, there have been serious decreases of vegetation cover in the Hunshandake Sandy Land and parts of the Horqin Sandy Land.
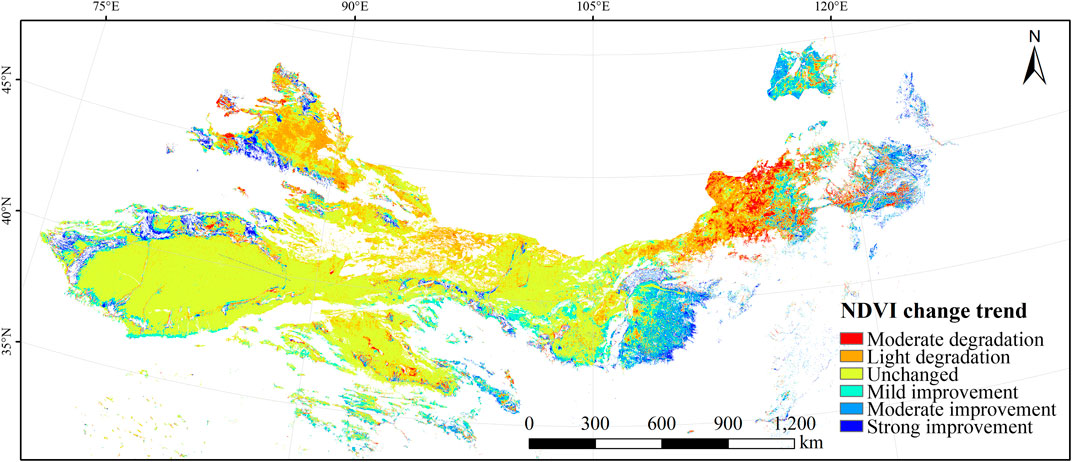
FIGURE 4. Spatial distribution of the changes in the normalized-difference vegetation index (NDVI) for the six desert types in northern China from 1998 to 2015.
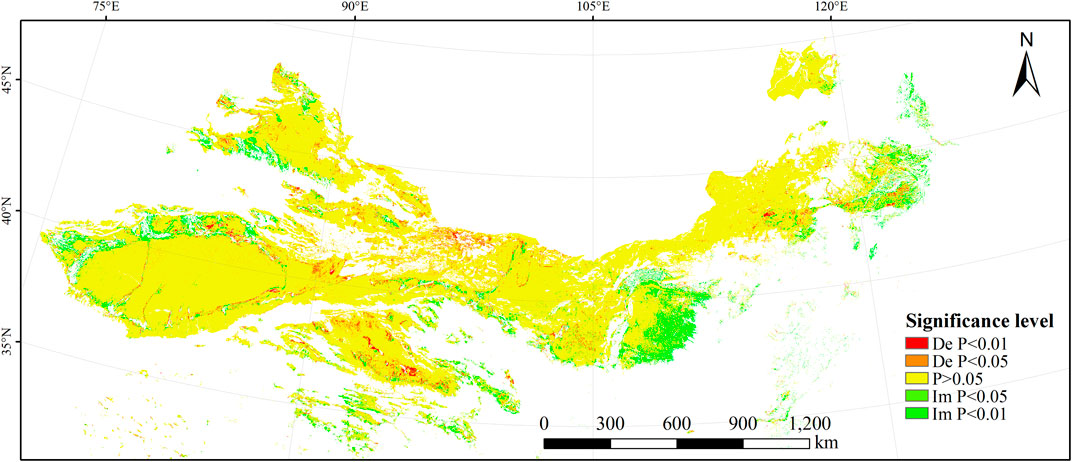
FIGURE 5. Spatial distribution of statistically significant changes in the annual average normalized-difference vegetation index (NDVI) for the six desert types in northern China from 1998 to 2015. De and Im represent significantly decreasing and increasing NDVI, respectively, and P represents the significance level.
NDVI Changes for the Six Desert Types
Figure 6 shows the distribution of NDVI changes for the six desert types in the study area from 1998 to 2015. We used these percentages to calculate the proportion of the area of each desert type that changed in different directions. The area where vegetation cover did not change accounted for the largest proportion of the total area, especially for mobile dunes (78.9%), gobi desert (64.0%), semi-mobile dunes (54.4%), and saline–alkali land (54.2%). With increasing or decreasing vegetation cover, the proportion of areas with no NDVI change gradually decreased, so the proportion of the area with changed vegetation cover (including both degradation and restoration) increased. Restoration of vegetation mainly achieved mild to moderate improvement of NDVI. The proportions of the area that showed improved vegetation cover were in the following order: fixed dunes (43.4%) > semi-mobile dunes (39.7%) > semi-fixed dunes (26.7%) > saline–alkali land (23.1%) > gobi desert (14.4%) > mobile dunes (12.5%). The proportions of the area that showed decreased vegetation cover were in the following order: fixed dunes (35.1%) > semi-mobile dunes (33.9%) > saline–alkali land (22.7%) > gobi desert (21.6%) > semi-fixed dunes (18.9%) > mobile dunes (8.6%). Only gobi desert showed a greater area of degradation than improvement; this indicated that overall vegetation cover improved in most desert types.
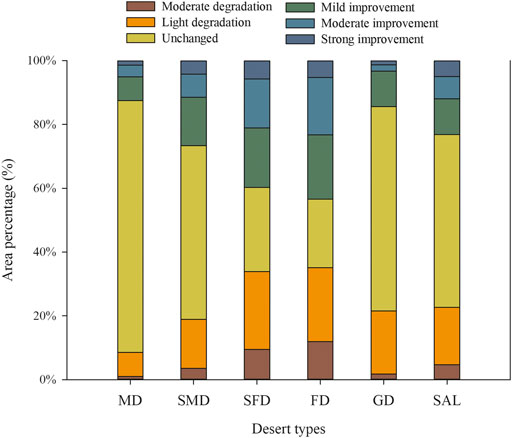
FIGURE 6. Proportions of the area of each of the six desert types that showed changes in the normalized-difference vegetation index (NDVI) from 1998 to 2015. Desert types: MD, mobile dunes; SMD, semi-mobile dunes; SFD, semi-fixed dunes; FD, fixed dunes; GD, gobi desert; SAL, saline–alkali land.
More than half of the total area (56.9%) showed no change in vegetation cover (Table 2). For mobile dunes and gobi desert, 24.0 and 14.0% of the area, respectively, showed no NDVI change. The area of light degradation (270.71 × 10³ km2) was larger than that of moderate degradation (68.47 × 10³ km2). The proportion of the area in which vegetation restoration occurred was in the following order: mild improvement (12.6%) > moderate improvement (7.2%) > strong improvement (3.1%). For the total area of desert in China, the proportions of the area that showed improved vegetation cover were in the following order: semi-fixed dunes (5.7%) > semi-mobile dunes (4.4%) > fixed dunes (4.1%) > mobile dunes (3.8%) > gobi desert (3.2%) > saline–alkali land (1.7%). The proportions of the area that showed vegetation degradation were in the following order: semi-fixed dunes (4.9%) > gobi desert (4.7%) > fixed dunes (3.2%) > semi-mobile dunes (3.2%) > mobile dunes (2.6%) > saline–alkali land (1.7%). Of the total desert area in China, 22.8% showed increasing vegetation cover, whereas 20.3% showed decreasing vegetation cover. The areas of vegetation improvement and degradation were both largest for semi-fixed dunes.
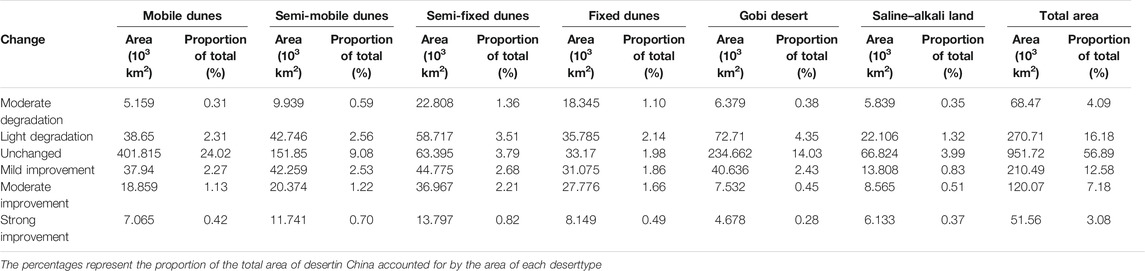
TABLE 2. Changes in the area in which the normalized-difference vegetation index (NDVI) changed from 1998 to 2015 for the six deserttypes.
Correlations of NDVI With Temperature and Precipitation
Partial Correlations of NDVI With Temperature and Precipitation
Figure 7 shows the spatial distribution of the partial correlations between the multi-year mean NDVI from 1998 to 2015 and the mean annual temperature for the same period. The partial correlation ranged from −0.96 to 0.95. The areas with positive and negative correlations accounted for 66.3 and 33.7% of the study area, respectively. Areas with a positive correlation were mainly distributed in the central and western parts of the study area, whereas negative correlations were mainly located in the four major sandy lands in the eastern part of the study area.
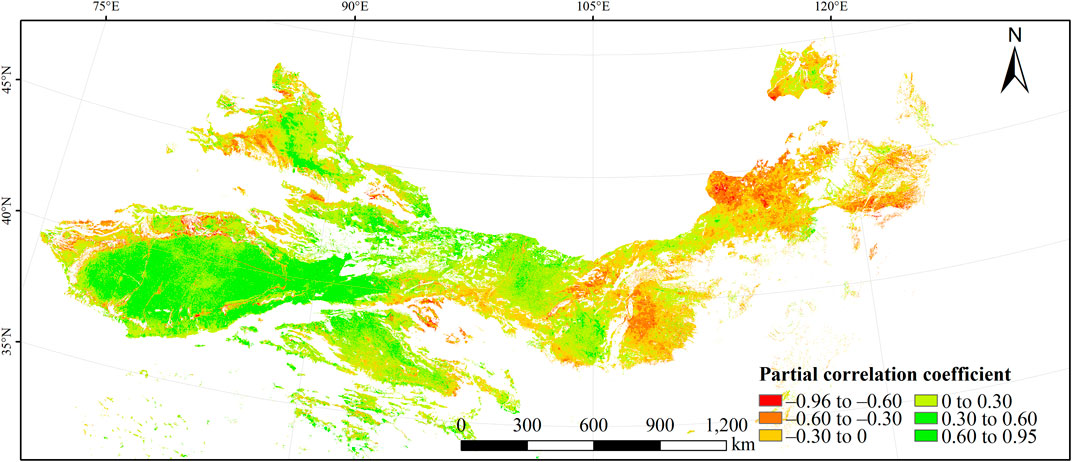
FIGURE 7. Spatial distribution of partial correlations between the multi-year mean normalized-difference vegetation index (NDVI) from 1998 to 2015 and the mean annual temperature for the same period in the desert area of northern China.
Figure 8 shows the spatial distribution of the partial correlations between the multi-year mean NDVI from 1998 to 2015 and the mean total annual precipitation for the same period. The maximum and minimum values of the correlation coefficient between NDVI and precipitation were 0.95 and −0.90, respectively. The areas with a positive correlation accounted for 81.8% of the total area, and areas with a negative correlation accounted for 18.2% of the study area. The areas with positive correlations were mainly distributed at the western and southern edges of the Taklamakan Desert and in the Gurbantunggut Desert, as well as in the sandy lands in the eastern part of the study area. The negative correlations were mainly located in the Badain Jaran, Ulan Buh, and Tengger deserts in the center of the study area and parts of other deserts in the western part of the study area.
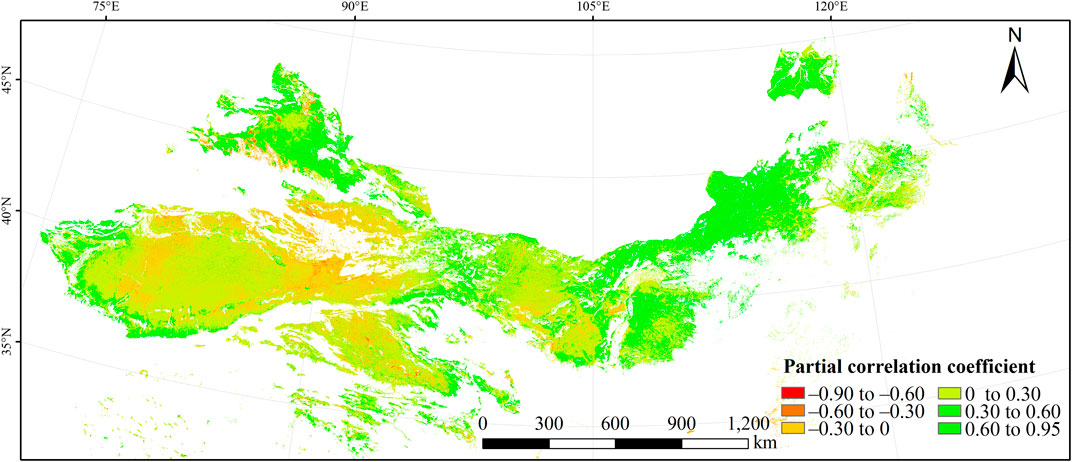
FIGURE 8. Spatial distribution of partial correlations between the multi-year mean normalized-difference vegetation index (NDVI) from 1998 to 2015 and the mean total annual precipitation for the same period in the desert area of northern China.
Multiple-Correlation Analysis of NDVI and the Climate Drivers
Figure 9 shows the spatial distribution of the multiple-correlation coefficient between the multi-year mean NDVI from 1998 to 2015 and the climate drivers. The multiple-correlation coefficient ranged from 0 to 0.96. Overall, the areas with a high multiple-correlation coefficient were mainly distributed in the Hunshandake Sandy Land, Hulunbuir Sandy Land, and parts of the Gurbantunggut Desert. The areas with a weak correlation were mainly located in the central area and in the region between the Taklamakan Desert and Gurbantunggut Desert.
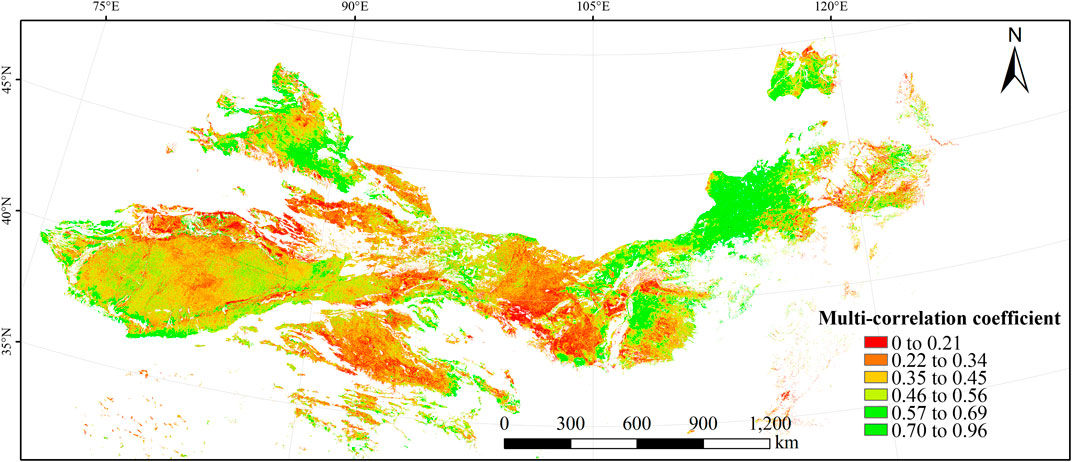
FIGURE 9. Spatial distribution of the multiple-correlation coefficient between the multi-year mean normalized-difference vegetation index (NDVI) from 1998 to 2015 and the two climate drivers (temperature and precipitation) for the same period in the desert area of northern China.
Classification of the Driving Factors for NDVI Changes
To further analyze the effects of the driving factors on the dynamic change in NDVI, we defined classification criteria for the dominant driving factors (Appendix Table 2) based on previous research on these factors (Mohamed et al., 2004; Liu and Gao, 2009; Wang et al., 2017).
Figure 10 shows the spatial distribution of the driving factors for changes in NDVI in the study area based on the criteria in Appendix Table 2. The area where NDVI changes were driven strongly by both precipitation and temperature was very small, accounting for only 0.4% of the total area (Table 3); this proportion was <1% for all desert types. In contrast, the area weakly driven by both precipitation and temperature was larger (16.1%) but scattered. The area driven strongly by precipitation (14.1%) was far greater than the area dominated by temperature (1.8%). The areas where precipitation was the major driver were mainly located in the Hunshandake and Hulunbuir sandy lands. NDVI change in rest of the study area was driven primarily by non-climatic factors, which accounted for 67.6% of the study area.
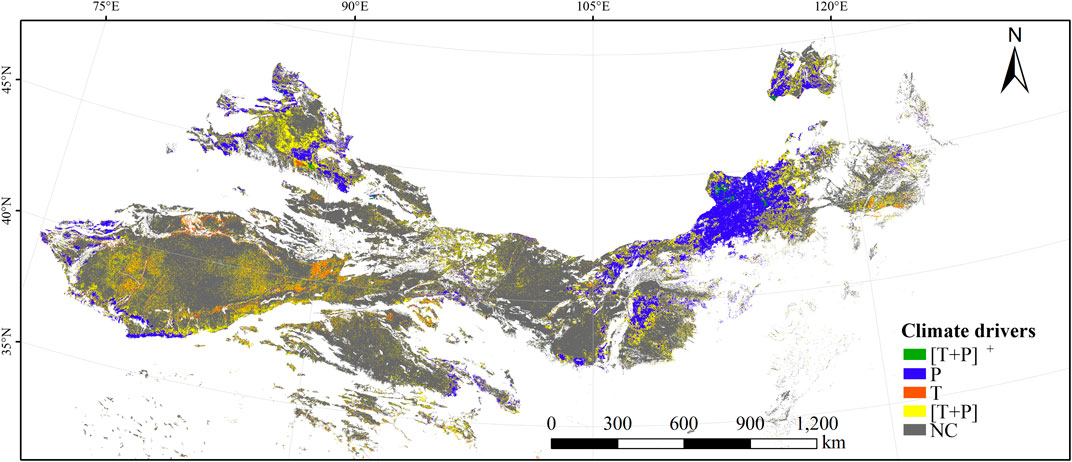
FIGURE 10. Spatial distribution of the effects of the driving factors on changes in the multi-year normalized-difference vegetation index (NDVI) in the desert area of China from 1998 to 2015. [T + P]+ represents changes driven strongly by temperature and precipitation, P represents changes driven mainly by precipitation, T represents changes driven mainly by temperature, [T + P] represents changes driven weakly by temperature and precipitation, and NC represents changes driven by non-climate factors.
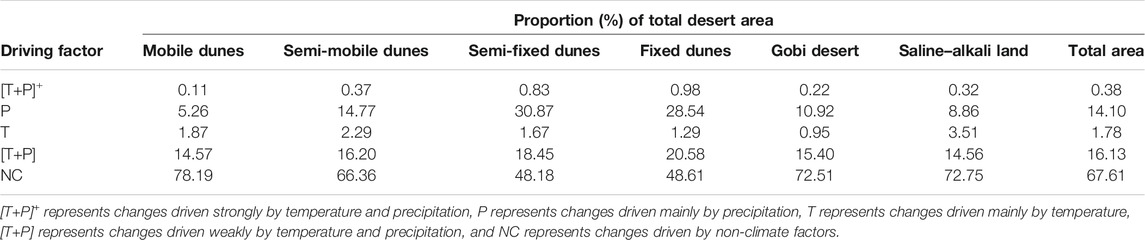
TABLE 3. The proportion of the study area in which NDVI changes from 1998 to 2015 were dominated by different driving factors for the six desert types.
Table 3 shows that the proportion of the area in which the NDVI change was driven primarily by precipitation was in the following order: semi-fixed dunes (30.9%) > fixed dunes (28.5%) > semi-mobile dunes (14.8%) > gobi desert (10.9%) > saline–alkali land (8.9%) > mobile dunes (5.3%). The proportion of the area where NDVI change was driven by non-climate factors was >70% for mobile dunes, gobi desert, and saline–alkali land, and >65% for semi-mobile dunes; this indicates that the effects of the climate drivers on vegetation cover were weak in these areas. Therefore, more vegetation restoration projects are needed in these desert types.
Discussion
NDVI Changes for the Six Desert Types
Overall, NDVI in the desert areas of northern China decreased before 2000, and there was a clear increasing trend after 2000 (Figure 3). This result, combined with the strong importance of non-climate factors (Table 3), demonstrated that the improvement of vegetation cover occurred as a result of the initial stage (1998–2010) of the ecological restoration projects implemented by the Chinese government, although precipitation also had a significant effect in some areas. However, the NDVI change differed among the six desert types. Of the total area of fixed dunes, 43.4% showed increased vegetation cover (Figure 6); this was the highest percentage for the six desert types, and suggested that fixed dunes responded best to vegetation restoration. In contrast, the effects of restoration were worst for mobile dunes, with only 12.5% of the area of this type showing improved vegetation cover. Similarly, the most and least degradation appeared in areas of fixed dunes and mobile dunes, respectively. This contradicts a previous study in which the restoration was most effective in mobile dunes (Zhang et al., 2012). The difference may be mainly due to the differences in the study areas, since Zhang et al. only studied the Horqin Sandy Land. There are 0.43 × 10⁶ km2 of mobile sand dunes in the Horqin Sandy Land, accounting for 15.8% of its area, and soil degradation has been greatly reduced by planting sand scrubs on mobile dunes. This would reduce wind speeds (thus, wind erosion) and improve the microclimate around the plants, creating conditions more conducive to vegetation growth (Gagnaire-Renou et al., 2001; Zhao et al., 2007). Unfortunately, mobile dunes accounted for more than half of the total area of desert in our study area (Table 1). Such a large proportion would increase the difficulty of vegetation restoration. However, both Zhang et al.’s study and the present study showed that fixed dunes responded strongly to restoration, with greatly increased vegetation cover.
The mean NDVI increased at a rate of 0.013 per year for semi-fixed dunes and fixed dunes, vs. only 0.0003 for mobile dunes (Table 4). The vegetation therefore showed an increased response to restoration as dune stability increased. Thus, future vegetation restoration should pay more attention to desert types with low vegetation cover, such as mobile dunes, saline–alkali land, and gobi desert, with the goal of restoring them to a condition that will let them respond more strongly to subsequent restoration efforts.

TABLE 4. The annual mean rate of increase of the normalized-difference vegetation index (NDVI) from 1998 to 2015 for the six desert types.
Spatial Pattern of NDVI Changes in the Desert Area
A large area of light degradation took place at the edges of the Gurbantunggut Desert and Taklamakan Desert. This may be because both deserts are located in an arid zone, and desertification control measures in such arid areas mainly included establishing belts of sand-fixing grasses at the edge of oases and planting sand-fixing plants in mobile sand dunes near these oases. In contrast, vegetation cover decreased seriously in the Hunshandake Sandy Land, a region with strong winds that is an important source of blowing sand in Beijing and Tianjin. Here, desert expanded greatly from 1960 to 1987, with the area of desertified land reaching its maximum by 2000. The Beijing–Tianjin Sandstorm Source Project, implemented between 2000 and 2005, caused initial restoration of the severely desertified land, but only about 65 km2 of desertified land was restored in the Hunshandake Sandy Land; given the large size of this area, restoration of its desertified land will be a long-term process (Liu and Wang, 2007). The areas with improved vegetation cover were mainly located in the Mu Us Sandy Land, Horqin Sandy Land, and Hulunbuir Sandy Land, which is consistent with previous results (Li et al., 2007; Wang et al., 2010; Yan and Bo, 2013). These three sandy lands, which are located in moister parts of our study area, were located in an area where NDVI changes were strongly driven by precipitation (Figure 10). Thus, the effectiveness of ecological restoration projects was greater in areas where changes were driven by precipitation.
The Effects of Climate Factors on NDVI Change
On a global scale, Schultz and Halpert (1995) reported that the time variation of NDVI is not highly correlated with climate variation. Whereas Ichii et al. (2002) found that NDVI trends are mainly controlled by temperature rise in the northern mid- and high latitudes and precipitation decrease in the semiarid regions of the Southern Hemisphere. On a regional scale, Djebou et al. (2015) found that the long-term trends in vegetation dynamics may not be a direct consequence of precipitation in the southwestern United States. However, the factors sustaining trends in NDVI are complex (Barbosa et al., 2006). For instance, in northern Patagonia's arid and semi-arid ecosystems, Fabricante et al. (2009) highlighted that precipitation may not be the main driver of NDVI fluctuations during certain periods of the year. Piao et al. (2006) found a relationship between the NDVI trend and air temperature. Furthermore, the relationship between vegetation change and climate variables in the dry climate region was notable. It was reported that there is a strong relationship between the magnitude of vegetation response to precipitation and the aridity gradient in several dry climate regions of the globe, such as Inner Mongolia (Chuai et al., 2013), the Tibetan Plateau (Ding et al., 2007), the African Sahel (Schmidt et al., 2014; Fensholt et al., 2013), northern Patagonia (Fabricante et al., 2009), and the northeast region of Brazil (Barbosa et al., 2006). In 66.3% of the study area, we found a positive correlation between temperature and NDVI, primarily in the central and western parts (Figure 7). This may be mainly due to increased photosynthesis at higher temperatures, which promotes vegetation growth so long as the rainfall is relatively stable and does not become a limiting factor (Diao and Xia, 2016). Similarly, 81.8% of the study area showed a positive correlation between NDVI and precipitation (Figure 8), mainly distributed in the semi-arid areas. This result was consistent with previous research in the Horqin Sandy Land, where precipitation was positively correlated with increased vegetation cover, and where this correlation was stronger than that for temperature (Huang et al., 2016).
The area in which NDVI changes were driven primarily by temperature (1.8%) was far less than the area dominated by precipitation (14.1%), largely because the areas driven by temperature were mainly located in the arid parts of our study area, and higher temperatures would increase evapotranspiration, thereby increasing stress on the vegetation and restricting the vegetation cover (Cao et al., 2011). This would also reduce the correlation between NDVI and temperature (Zhang et al., 2008a). In contrast, the areas driven by precipitation were mainly in the moister Hunshandake, Horqin, and Hulunbuir sandy lands. In recent years, the amount of precipitation has decreased continuously in this region, and sandy grassland is highly sensitive to changes in precipitation; thus, precipitation is a dominant factor influencing the growth of vegetation in these sandy lands (Mao et al., 2012).
Effectiveness of Ecological Restoration Projects in Desert Areas
The natural and socioeconomic conditions in desertified areas in China are complex and diverse, and the resource advantages or disadvantages and the direction of regional economic development differ among these regions. Therefore, the measures that have been adopted for desertification control also differed. To control the expansion of desert as soon as possible, Ecological Function Reserves have been established in areas with serious desertification (Figure 11). These reserves are areas in which activities such as agriculture and livestock grazing have been prohibited or greatly reduced to mitigate the pressure on the ecosystem, and in which intensive vegetation restoration has been conducted. The ecological functions and restoration measures for these protected areas are summarized in Appendix Table 3.
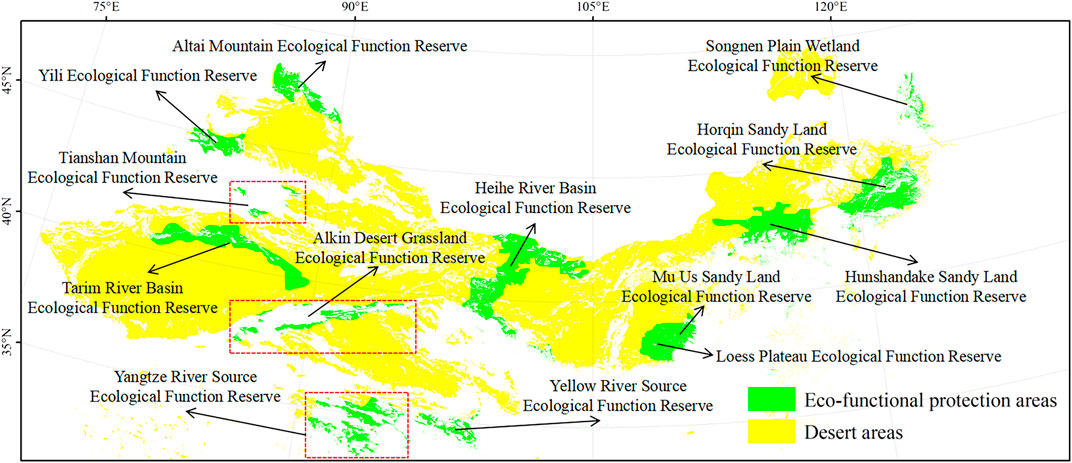
FIGURE 11. The Ecological Function Reserves that have been established in northern China’s desert areas.
We estimated the annual change rate of the NDVI from 1998 to 2015 for the Ecological Function Reserves in Appendix Table 3. The mean NDVI increased in most ecological protection zones, but decreased in the Alkin Desert Grassland Ecological Function Reserve and the Hunshandake Sandy Land Ecological Function Reserve (Appendix Table 3). Outside of these reserves, the mean NDVI increased at a rate of 0.0005 per year. In contrast, annual NDVI in some Ecological Function Reserves was far larger than this value: Eight times this rate in the Yili Ecological Function Reserve, more than 15 times this rate in the Songnen Plain Wetland Ecological Function Reserve, more than five times this rate in the Horqin Sandy Land Ecological Function Reserve, three times this rate in the Yangtze River Source Ecological Function Reserve, more than five times this rate in the Yellow River Source Ecological Function Reserve, more than 10 times this rate in the Mu Us Sandy Land Ecological Function Reserve, and 20 times this rate in the Loess Plateau Ecological Function Reserve. These results strongly suggest that desertification has been mitigated by the ecological restoration measures that were implemented in these areas.
However, NDVI did not increase much faster than the rate for the overall study region in several of the reserves: the Tianshan Mountain Ecological Function Reserve, Tarim River Basin Ecological Function Reserve, Heihe River Basin Ecological Function Reserve, and Altai Mountain Ecological Function Reserve. This indicates that the ecological restoration effects were weak in these western desert areas, possibly because precipitation is a greater constraint in this region. In addition, the sensitivity of the Alkin Desert Grassland to desertification was very high due to the extremely arid climate and the scarcity of vegetation. To promote NDVI growth, it will be necessary to stop all development activities in this region, and especially any human activities that damage the reserve’s ecological functions; for example, it will be necessary to establish more sustainable levels for the grassland’s livestock carrying capacity, return grazing areas to protected grassland, ban grazing during periods when the grassland is most vulnerable, establish grazing exclosures and implement rotation grazing, and implement ecological migration (i.e., relocation of farmers and herders to more suitable areas where their activities can be sustained) in severely degraded areas. In the Hunshandake Sandy Land, degradation of the grassland ecosystem by unsustainable development and utilization of the grassland resources has been occurring for a long time, leading to the development of a large area of degraded grassland, serious desertification, decreasing soil fertility in cultivated land, loss of forests caused by firewood production, and drought and water shortages, which together threaten the region’s ecological security. To mitigate these problems, the government should take aggressive measures to stop the land-use practices that are responsible for degradation, restore the native ecosystems, and promote changes to the traditional energy structure in rural areas by encouraging the adoption of alternative energy sources such as natural gas that would reduce the need to harvest trees to provide firewood. In addition, efforts must be made to adopt agricultural methods to use water more efficiently, such as the implementation of mulches to reduce evaporation of water from the soil surface and the use of drip irrigation rather than flooding for agricultural irrigation.
Conclusions and Outlook
Based on satellite NDVI data and gridded climate datasets from 1998 to 2015, we assessed the effectiveness of the large-scale ecological restoration projects that have been implemented in northern China, and analyzed the effect of the two main climate drivers (precipitation and temperature) on the region’s vegetation dynamics and the spatial distribution of NDVI and changes in NDVI. We found that vegetation covers generally increased as a result of the restoration projects, but that the change in NDVI differed among the six desert types. The most and least improvement in vegetation cover appeared in fixed and mobile dunes, respectively. The vegetation covers also increased more as dune stability increased. Thus, more efforts should be paid to restoration of desert types with low vegetation cover and unstable dunes in future vegetation restoration projects; by increasing their stability, this will also increase their ability to respond to future restoration efforts.
The effectiveness of ecological restoration projects was strongest in areas where NDVI change was driven by precipitation, such as the Loess Plateau and the Mu Us, Horqin, and Hulunbuir sandy lands. In contrast, ecological restoration projects in the Badain Jaran, Ulan Buh, and Tengger deserts were ineffective, and there has been a serious decrease in vegetation cover in the Hunshandake Sandy Land and the Alkin Desert Grassland. Thus, more or different ecological restoration efforts must be implemented in these areas.
This study aimed to employ remote sensing and geographic information system (GIS) to examine the relationship between NDVI and climate drivers. The following recommendations are made to upgrade the methodology described in this study as an effective tool desertification monitoring.
(1) NDVI on its own is a crude mean of vegetation changes. It must therefore be related and integrated to biophysical data (such as soil type, evapotranspiration etc.) in order to determine areas at risk, and other socio-economic information, in order to determine groups at risk of desertification. GIS is an essential tool for integration of such diverse data sets, in order to facilitate timely decision making.
(2) The NDVI was used to reflect vegetation dynamics of desert areas in the present study, to achieve the assessment goal of desertification in future research, it is necessary to compare the sensitivity of various indices to desertification, e.g. Modified Soil-adjusted vegetation index (MSAVI), Normalized Difference Water Index (NDWI), Soil brightness Index (SBI), Wetness vegetation index (WVI) etc.
(3) NDVI time-series data sets have been widely used in vegetation dynamic change monitoring. However, the significant residual effects and noise levels impede the application of NDVI time-series data in environmental change research. Although the maximum-value compositing (MVC) technique (Holben, 1986) has been widely used to eliminate the effect of cloud contamination and the residual atmosphere, it is necessary to reconstruct high-quality NDVI time series by novel and robust filter method, e.g., the moving weighted harmonic analysis (MWHA) method (Yang et al., 2015), the iterative interpolation for data reconstruction (IDR) method (Julien and Sobrino, 2010), the mean value iteration filter (MVI) method (Ma and Veroustraete, 2006), changing weight filter (CWF) method (Zhu et al., 2012), etc.
(4) Assessment of wind (direction and speed) in the study area.
(5) Changes in the non-climate environment, such as changes in the groundwater level and soil matrix, will affect the NDVI-climate relationship (Lv et al., 2013; Liang and Yang, 2016). Therefore, to improve the prediction of NDVI response to future climate change, we should consider all kinds of uncertainty factors when analyzing the NDVI-climate relationship.
Data Availability Statement
The raw data supporting the conclusions of this article will be made available by the authors, without undue reservation.
Author Contributions
XuW organized and wrote the paper. XiW, XG and JL assisted in processing the data. XuW did this paper under the guidance of QYL and LYL. All authors reviewed the manuscript.
Funding
This research was supported by the National Key R & D Program of China (2017YFA0604803), the National Natural Science Foundation of China (31971466 and 32001214), the National Natural Science Foundation of Gansu Province (20JR5RA089), and the Strategic Priority Research Program of the Chinese Academy of Sciences (XDA23060404).
Conflict of Interest
The authors declare that the research was conducted in the absence of any commercial or financial relationships that could be construed as a potential conflict of interest.
Supplementary Material
The Supplementary Material for this article can be found online at: https://www.frontiersin.org/articles/10.3389/fenvs.2021.633020/full#supplementary-material.
References
Alphan, H., and Yilmaz, K. T. (2005). Monitoring environmental changes in the Mediterranean coastal landscape: the case of Cukurova, Turkey. Environ. Manage. 35 (5), 607–619. doi:10.1007/s00267-004-0222-7
Arnous, M. O., Cheikh, M. A. S., Mongi, B. Z., Aliout, R., and Muntoni, F. (2009). “Remote sensing technology application for desertification mapping a case study, Oudia, Tunisia,” in Desertification and risk analysis using high and medium resolution satellite data. Editors Marini, A., and Talbi, M., Dordrecht: Springer, 183–197.
Baba, K., Shibata, R., and Sibuya, M. (2015). Partial correlation and conditional correlation as measures of conditional independence. Aust. N. Z. J. Stat. 46, 657–664. doi:10.1111/j.1467-842X.2004.00360.x
Barbosa, H. A., Huete, A. R., and Baethgen, W. E. (2006). A 20-year study of NDVI variability over the Northeast Region of Brazil. J. Arid Environ. 67 (2), 288–307. doi:10.1016/j.jaridenv.2006.02.022
Cao, X. M., Chen, X., Bao, A. M., and Wang, Q. (2011). Response of vegetation to temperature and precipitation in xinjiang during the period of 1998-2009. J. Arid Land. 3 (2), 94–103. doi:10.3724/SP.J.1227.2011.00094
Chuai, X. W., Huang, X. J., Wang, W. J., and Bao, G. (2013). NDVI, temperature and precipitation changes and their relationships with different vegetation types during 1998–2007 in Inner Mongolia, China. Int. J. Climatol. 33 (7), 1696–1706. doi:10.1002/joc.3543
Clerici, N., Weissteiner, C. J., and Gerard, F. (2012). Exploring the use of MODIS NDVI-based phenology indicators for classifying forest general habitat categories. Remote Sens. 4, 1781–1803. doi:10.3390/rs4061781
Del Valle, H. F., Blanco, P. D., Metternicht, G. I., and Zinck, J. A. (2010). Radar remote sensing of wind-driven land degradation processes in northeastern Patagonia. J. Environ. Qual. 39 (1), 62–75. doi:10.2134/jeq2009.0071
Delbart, N., Toan, T. L., Kergoat, L., and Fedotova, V. (2006). Remote sensing of spring phenology in boreal regions: a free of snow-effect method using NOAA-AVHRR and SPOT-VGT data (1982–2004). Remote Sens. Environ. 101, 52–62. doi:10.1016/j.rse.2005.11.012
Diao, M., and Xia, C. (2016). Analysis on the change of vegetation growth in Junggar Basin during 1982-2013. For. Resour. Manage. 5, 39–46. doi:10.13466/j.cnki.lyzygl.2016.05.008
Ding, M. J., Zhang, Y. L., Liu, L. S., Zhang, W., Wang, Z. F., and Bai, W. Q. (2007). The relationship between NDVI and precipitation on the Tibetan Plateau. J. Geogr. Sci. 17 (3), 259–268. doi:10.1007/s11442-007-0259-7
Djebou, D. C. S., Singh, V. P., and Frauenfeld, O. W. (2015). Vegetation response to precipitation across the aridity gradient of the southwestern United States. J. Arid Environ. 115, 35–43. doi:10.1016/j.jaridenv.2015.01.005
Dong, G. R., Wu, B., Ci, L. J., Zhou, H. S., Lu, Q., and Luo, B. (1999). Present situation, cause and control way of desertification in China. J. Desert Res. 4, 22–36.
Duchemin, B. (2004). VEGETATION/SPOT: an operational mission for the Earth monitoring; presentation of new standard products. Int. J. Remote Sens. 25, 9–14. doi:10.1080/0143116031000115265
Fabricante, I., Oesterheld, M., and Paruelo, J. M. (2009). Annual and seasonal variation of NDVI explained by current and previous precipitation across Northern Patagonia. J. Arid Environ. 73 (8), 745–753. doi:10.1016/j.jaridenv.2009.02.006
FAO (Food and Agriculture Organization of the United Nations) (1993). Sustainable development of dry lands and combating desertification: Definition and general approach to the problem. Available at: http://www.fao.org/3/V0265E/V0265E01.htm#How%20to%20define%20desertification (Accessed January 8, 2021).
Feng, L., Guo, S., Zhu, L., Zhou, Y., and Lu, D. (2017). Urban vegetation phenology analysis using high spatio-temporal NDVI time series. Urban For. Urban Greening. 25, 43–57. doi:10.1016/j.ufug.2017.05.001
Fraser, R. H., and Li, Z. (2002). Estimating fire-related parameters in boreal forest using SPOT VEGETATION. Remote Sens. Environ. 82, 95–110. doi:10.1016/S0034-4257(02)00027-5
Fung, T., and Siu, W. (2000). Environmental quality and its changes, an analysis using NDVI. Int. J. Remote Sens. 21, 1011–1024. doi:10.1080/014311600210407
Gagnaire-Renou, E., Benoit, M., and Forget, P. (2001). Degradation of sandy arid shrubland environments: observations, process modelling, and management implications. J. Arid Environ. 47, 123–144. doi:10.1006/jare.2000.0711
Hoang, V. A., Meredith, W., and David, M. (2005). Remote Sensing for desertification mapping: case study in the coastal area of Vietnam. 11. Available at: http://www.mekonginfo.org/assets/midocs/0002592-environment-remote-sensing-for-desertification-mapping-case-study-of-vietnam.pdf (Accessed January 6, 2021).
Hoang, V. A., Meredith, W., and David, M. (2003). A Multi-sensor approach for desertification monitoring in the coastal of Vietnam, Tyne: School of Civil Engineering and Geosciences University of Newcastle upon Tyne, 16.
Holben, B. N. (1986). Characteristics of maximum-value composite images from temporal AVHRR data. Int. J. Remote Sens. 7, 1417–1434. doi:10.1080/01431168608948945
Huang, H. T., Chang, X. L., Yue, X. Y., and Lv, D. Y. (2016). Responses of NDVI changes to air temperature and precipitation of different sandy landscape areas in the Horqin Sandy Land. J. Desert Res. 1, 40–49. doi:10.7522/j.issn.1000-694X.2015.00087
Hutchinson, M. F. (1998). Interpolation of rainfall data with thin plate smoothing splines - part i: two dimensional smoothing of data with short range correlation. J. Geogr. Inf. Decis. Anal. 2, 153–167.
Ichii, K., Kawbata, A., and Yamaguchi, Y. (2002). Global correlation analysis for NDVI and climatic variables and NDVI trends: 1982–1990. Int. J. Remote Sens. 23 (18), 3873–3878. doi:10.1080/01431160110119416
IFAD (2001). Desertification as a global problem. Geneva, Switzerland: Conference of the parties, COP-V, UNCCD: 2.
Jamal, A. (1997). United Nations convention to Combat desertification in those countries experiencing serious drought and/or desertification. particularly Africa. 6 (1), 1–6.
Julien, Y., and Sobrino, J. A. (2010). Comparison of cloud-reconstruction methods for time series of composite NDVI data. Remote Sens. Environ. 114 (3), 618–625. doi:10.1016/j.rse.2009.11.001
Li, A. M., Han, Z. W., Huang, C. H., and Tan, Z. H. (2007). Remote sensing monitoring on dynamic of sandy desert degree in Horqin Sandy land at the beginning of 21st century. J. Desert Res. 4, 546–551. doi:10.3321/j.issn:1000-694X.2007.04.004
Liang, P., and Yang, X. P. (2016). Landscape spatial patterns in the Maowusu (Mu Us) Sandy Land, northern China and their impact factors. Catena. 145, 321–333. doi:10.1016/j.catena.2016.06.023
Lin, L., Ma, A. Q., and Ma, Q. M. (2012). Spatial and temporal variations of vegetation coverage in coastal peri-urban area: a case study of Laoshan District, Qingdao. Environ. Sci. Technol. 35, 178–185. doi:10.3969/j.issn.1003-6504.2012.01.037
Liu, J. H., and Gao, J. X. (2009). Effects of climate and land use change on the changes of NPP in the farming-pastoral ecotone of Northern China. Resour. Sci. 31 (3), 493–500. doi:10.3321/j.issn:1007-7588.2009.03.021
Liu, S. L., and Wang, T. (2007). Study on land desert process in Hunshandake sandy land. J. Desert Res. 27 (5), 719–724. CNKI:SUN:ZGSS.0.2007-05-001
Liu, X., Zhou, W., and Bai, Z. (2016). Vegetation coverage change and stability in large open-pit coal mine dumps in China during 1990–2015. Ecol. Eng. 95, 447–451. doi:10.1016/j.ecoleng.2016.06.051
Lv, J. J., Wang, X. S., Zhou, Y. X., Qian, K. Z., Wan, L., Eamus, D., et al. (2013). Groundwater-dependent distribution of vegetation in Hailiutu River catchment, a semi-arid region in China. Ecohydrology. 6, 142–149. doi:10.1002/eco.1254
Ma, M., and Veroustraete, F. (2006). Reconstructing Pathfinder AVHRR land NDVI time-series data for the Northwest of China. Adv. Space Res. 37 (4), 835–840. doi:10.1016/j.asr.2005.08.037
Magney, T. S., Eitel, J. U. H., Huggins, D. R., and Vierling, L. A. (2016). Proximal NDVI derived phenology improves in-season predictions of wheat quantity and quality. Agr. Forest Meteorol. 217, 46–60. doi:10.1016/j.agrformet.2015.11.009
Mao, D., Wang, Z., Luo, L., and Yang, G. (2012). Correlation analysis between NDVI and climate in northeast China based on AVHRR and GIMMS data sources. Remote Sens. Technol. Appli. 27, 81–89. doi:10.11873/j.issn.1004-0323.2012.1.77
Mohamed, M. A., Babiker, I. S., Chen, Z. M., Ikeda, K., Ohta, K., and Kato, K. (2004). The role of climate variability in the inter-annual variation of terrestrial net primary production (NPP). Sci. Total Environ. 332, 123. doi:10.1016/j.scitotenv.2004.03.009
Nash, M., Wickham, J., Christensen, J., and Wade, T. (2017). Changes in landscape greenness and climatic factors over 25 years (1989-2013) in the USA. Remote Sens. 9, 295. doi:10.3390/rs9030295
National Desertification Monitoring Data, (2015). The desert and Sandification State of China. Available at: http://124.205.185.8/lysjk/indexJump.do?url=view/moudle/searchData/showDetail&keyid=1003491&search= (Accessed 8 April, 2019)
Nemani, R. R., Keeling, C. D., Hashimoto, H., Jolly, W. M., Piper, S. C., Tucker, C. J., et al. (2003). Climate-driven increases in global terrestrial net primary production from 1982 to 1999. Sci. 300, 1560–1563. doi:10.1126/science.1082750
NEPAPR (1998). China National Biodiversity Research Report. Beijing: China Environmental Science Press.
Nie, Q., Xu, J., Ji, M., Cao, L., Yang, Y., and Hong, Y. (2012). The vegetation coverage dynamic coupling with climatic factors in Northeast China transect. Environ. Manage. 50, 405–417. doi:10.1007/s00267-012-9885-7
Nie, Q., and Xu, J. (2015). The relationship between vegetation coverage and climate elements in Yellow River Basin, China. doi:10.7287/peerj.preprints.153v1
Paruelo, J. M., Epstein, H. E., Lauenroth, W. K., and Burke, I. C. (1997). ANPP estimates from NDVI for the central grassland region of the United States. Ecol. 78, 953–958. doi:10.1890/0012-9658(1997)078[0953:AEFNFT]2.0.CO;2
Pettorelli, N., Vik, J. O., Mysterud, A., Gaillard, J. M., Tucker, C. J., and Stenseth, N. C. (2005). Using the satellite-derived NDVI to assess ecological responses to environmental change. Trends Ecol. Evolution. 20, 503–510. doi:10.1016/j.tree.2005.05.011
Piao, S., Fang, J., Zhou, L., Guo, Q., Henderson, M., Ji, W., et al. (2003). Interannual variations of monthly and seasonal normalized difference vegetation index (NDVI) in China from 1982 to 1999. J. Geophys. Res. 108 (D14), 4401. doi:10.1029/2002JD002848
Piao, S. L., Mohammat, A., Fang, J. Y., Cai, Q., and Feng, J. M. (2006). NDVI-based increase in growth of temperate grasslands and its responses to climate changes in China. Glob. Environ. Change Human Policy Dimens. 16 (4), 340–348. doi:10.1016/j.gloenvcha.2006.02.002
Purevdorj, T., Tateishi, R., Ishiyama, T., and Honda, Y. (1998). Relationships between percent vegetation cover and vegetation indices. Int. J. Remote Sens. 19, 3519–3535. doi:10.1080/014311698213795
Rahman, H., and Dedieu, G. (1994). SMAC: a simplified method for the atmospheric correction of satellite measurements in the solar spectrum. Int. J. Remote Sens. 15, 123–143.
Schmidt, M., Klein, D., Conrad, C., Dech, S., and Paeth, H. (2014). On the relationship between vegetation and climate in tropical and northern Africa. Theor. Appl. Climatol. 115 (1e2), 341–353. doi:10.1007/s00704-013-0900-6
Schultz, P. A., and Halpert, M. S. (1995). Global analysis of the relationships among a vegetation index, precipitation, and land surface temperature. Int. J. Remote Sens. 16, 2755–2777. doi:10.1080/01431169508954590
Song, Y., Ma, M. G., and Veroustraete, F. (2010). Comparison and conversion of AVHRR GIMMS and SPOT VEGETATION NDVI data in China. Int. J. Remote Sens. 31, 2377–2392. doi:10.1080/01431160903002409
Stibig, H. J., Belward, A. S., Roy, P. S., Rosalina-Wasrin, U., Agrawal, S., Joshi, P. K., et al. (2007). A land cover map for south and southeast Asia derived from SPOT-4 VEGETATION data. J. Biogeogr. 34 (4), 625–637. doi:10.111/j.1365-2699.2006.01637.x
Stow, D., Petersen, A., Hope, A., Engstrom, R., and Coulter, L. (2007). Greenness trends of Arctic tundra vegetation in the 1990s: comparison of two NDVI data sets from NOAA AVHRR systems. Int. J. Remote Sens. 28, 4807–4822. doi:10.1080/01431160701264284
Sun, W., Song, X., Mu, X., Gao, P., and Zhao, G. (2015). Spatiotemporal vegetation cover variations associated with climate change and ecological restoration in the Loess Plateau. Agr. Forest Meteorol. 209 (1), 87–99. doi:10.1016/j.agrformet.2015.05.002
Tran, H., and Campbell, J. B. (2015). Detecting sand movement: a NDVI time series analysis (Binh Thuan case study). Conference on Scientific Research Cooperation between Vietnam and Poland in Earth Sciences. Vietnam: Hanoi university of Mining and Geology.
Tu, Z. F., Li, M. X., and Sun, T. (2016). The status and trend analysis of desert and sandification. For. Resour. Manage. 1, 1–5. doi:10.13466/j.cnki.lyzygl.2016.01.001
Wang, A. H., Li, L. I., Chi, Y. B., Wang, Z. Y., and Zhou, H. Z. (2010). Study on monitoring of desert and sandy desert land in China using images of Beijing-1 small satellite. Sci. Geogr. Sin. 30, 409–414. doi:10.13249/j.cnki.sgs.2010.03.006
Wang, H. S., Liu, D. S., Lin, H., Montenegro, A., and Zhu, X. L. (2015). NDVI and vegetation phenology dynamics under the influence of sunshine duration on the Tibetan Plateau. Int. J. Climatol. 35, 687–698. doi:10.1002/joc.4013
Wang, Q. W., Zhang, T. B., Yi, G. H, Chen, T. T., Bie, X. J., and He, Y. H. (2017). Tempo-spatial variations and driving factors analysis of net primary productivity in the Hengduan mountain area from 2004 to 2014. Acta Ecol. Sin. 37 (9), 3084–3095. doi:10.5846/stxb201602030248
Wardlow, B. D., and Egbert, S. L. (2008). Large-area crop mapping using time-series MODIS 250m NDVI data: an assessment for the U.S. Central Great Plains. Remote Sens. Environ. 112, 1096–1116. doi:10.1016/j.rse.2007.07.019
Wu, B., and Ci, L. J. (2002). Landscape change and desertification development in the Mu Us Sandland, Northern China. J. Arid Environ. 50 (3), 429–444. doi:10.1006/jare.2001.0847
Yan, F., and Bo, W. U. (2013). Desert progress in Mu Us sandy land over the past 40 years. Arid. Land Geogr. 36 (6), 987–996.
Yang, G., Shen, H., Zhang, L., He, Z., and Li, X. (2015). A moving weighted harmonic analysis method for reconstructing high-quality SPOT VEGETATION NDVI time-series data. IEEE T. Geosci. Remote. 53 (11), 6008–6021. doi:10.1109/TGRS.2015.2431315
Zhang, G., Dong, J., Xiao, X., Hu, Z., and Sheldon, S. (2012). Effectiveness of ecological restoration projects in Horqin Sandy Land, China based on SPOT-VGT NDVI data. Ecol. Eng. 38, 20–29. doi:10.1016/j.ecoleng.2011.09.005
Zhang, K., Si, J. H., Wang, R. Y., Wang, X. P., Han, H. T., and Guo, N. (2008a). Impact of climate change on Desert vegetation in alxa region. J. Desert Res. 5, 879–885. doi:10.1098/rstb.2012.0074
Zhang, Y., Zhao, Z., Li, S., and Meng, X. (2008b). Indicating variation of surface vegetation cover using SPOT NDVI in the northern part of North China. Geogr. Res. 27, 745–477. doi:10.3321/j.issn:1000-0585.2008.04.003
Zhao, H. L., Su, Y. Z., Zhang, H., Zhao, L. Y., and Zhou, R. L. (2007). Multiple effects of shrub on soil properties and understory vegetation in Horqin Sand Land, Inner Mongolia. J. Desert Res. 27, 385–390. doi:10.3321/j.issn:1000-694X.2007.03.007
Zhou, H. J., Rompaey, A. V., and Wang, J. A. (2009). Detecting the impact of the "Grain for Green" program on the mean annual vegetation cover in the Shaanxi Province, China using SPOT-VGT NDVI data. Land Use Pol. 26, 954–960. doi:10.1016/j.landusepol.2008.11.006
Keywords: desert, ecological restoration, desertification, NDVI, climate factors
Citation: Wang X, Li Y, Wang X, Li Y, Lian J and Gong X (2021) Temporal and Spatial Variations in NDVI and Analysis of the Driving Factors in the Desertified Areas of Northern China From 1998 to 2015. Front. Environ. Sci. 9:633020. doi: 10.3389/fenvs.2021.633020
Received: 24 November 2020; Accepted: 12 January 2021;
Published: 22 February 2021.
Edited by:
Atsushi Tsunekawa, Tottori University, JapanReviewed by:
Saumitra Mukherjee, Jawaharlal Nehru University, IndiaXinghua Li, Wuhan University, China
Copyright © 2021 Wang, Li, Wang, Li, Lian and Gong. This is an open-access article distributed under the terms of the Creative Commons Attribution License (CC BY). The use, distribution or reproduction in other forums is permitted, provided the original author(s) and the copyright owner(s) are credited and that the original publication in this journal is cited, in accordance with accepted academic practice. No use, distribution or reproduction is permitted which does not comply with these terms.
*Correspondence: Yuqiang Li, liyq@lzb.ac.cn