Distribution and Modeled Transport of Plastic Pollution in the Great Lakes, the World's Largest Freshwater Resource
 Rachel N. Cable1
  Dmitry Beletsky2
  Raisa Beletsky2
  Krista Wigginton3
  Brendan W. Locke1
  Melissa B. Duhaime1*
- 1Department of Ecology and Evolutionary Biology, University of Michigan, Ann Arbor, MI, United States
- 2School of Natural Resources and the Environment, Cooperative Institute for Great Lakes Research, University of Michigan, Ann Arbor, MI, United States
- 3Department of Civil and Environmental Engineering, University of Michigan, Ann Arbor, MI, United States
Most plastic pollution originates on land. As such, freshwater bodies serve as conduits for the transport of plastic litter to the ocean. Understanding the concentrations and fluxes of plastic litter in freshwater ecosystems is critical to our understanding of the global plastic litter budget and underpins the success of future management strategies. We conducted a replicated field survey of surface plastic concentrations in four lakes in the North American Great Lakes system, the largest contiguous freshwater system on the planet. We then modeled plastic transport to resolve spatial and temporal variability of plastic distribution in one of the Great Lakes, Lake Erie. Triplicate surface samples were collected at 38 stations in mid-summer of 2014. Plastic particles >106 μm in size were quantified. Concentrations were highest near populated urban areas and their water infrastructure. In the highest concentration trawl, nearly 2 million fragments km−2 were found in the Detroit River—dwarfing previous reports of Great Lakes plastic abundances by over 4-fold. Yet, the accuracy of single trawl counts was challenged: within-station plastic abundances varied 0- to 3-fold between replicate trawls. In the smallest size class (106–1,000 μm), false positive rates of 12–24% were determined analytically for plastic vs. non-plastic, while false negative rates averaged ~18%. Though predicted to form in summer by the existing Lake Erie circulation model, our transport model did not predict a permanent surface “Lake Erie Garbage Patch” in its central basin—a trend supported by field survey data. Rather, general eastward transport with recirculation in the major basins was predicted. Further, modeled plastic residence times were drastically influenced by plastic buoyancy. Neutrally buoyant plastics—those with the same density as the ambient water—were flushed several times slower than plastics floating at the water's surface and exceeded the hydraulic residence time of the lake. It is likely that the ecosystem impacts of plastic litter persist in the Great Lakes longer than assumed based on lake flushing rates. This study furthers our understanding of plastic pollution in the Great Lakes, a model freshwater system to study the movement of plastic from anthropogenic sources to environmental sinks.
Introduction
In recent years, anthropogenic litter in the form of plastic debris has been documented in widespread and diverse marine (Law et al., 2010, 2014; Cózar et al., 2014; Fischer et al., 2015; van Sebille et al., 2015; Law, 2016), freshwater (Eriksen et al., 2013; Free et al., 2014; Mani et al., 2015; Baldwin et al., 2016; Mason et al., 2016), and even aeolian (Dris et al., 2015) biomes. It is estimated that 4.8–12.7 million tons of plastic enters the ocean in a single year (Jambeck et al., 2015), with a quarter of a million tons currently floating in the world's oceans (Eriksen et al., 2014). It is estimated that 70–80% of marine litter (most of which is plastic) originates from inland sources via rivers (GESAMP, 2010). In the absence of mechanisms to incentivize improved waste management and behavior change, this number will continue to rise, reflecting the exponentially increasing global production of plastic goods (PlasticsEurope: Association of Plastics Manufacturers, 2015). Studies have shown that aquatic organisms ingest plastic pollutants (Boerger et al., 2010; Foekema et al., 2013). Consumption results in energetic and fitness costs (Besseling et al., 2012; Wright et al., 2013) and other morbid impacts (Rochman et al., 2013). There is a high likelihood that humans are consuming plastic derived from fish and shellfish (Van Cauwenberghe and Janssen, 2014; Rochman et al., 2015b), with as of yet unknown health consequences. In the wake of these discoveries, the United Nations has declared plastic pollution among the most critical emerging environmental issues of our time (UNEP, 2016). The scientific consensus is that plastic pollution must be reduced to avoid the risk of irreversible ecosystem harm (Rochman et al., 2016). Yet, an incomplete understanding of the global plastic litter budget hinders the strategic development of mitigation and prevention policy. To effectively target major sources and pathways, the question remains: what drives the concentration and flux of plastic debris across environmental reservoirs?
Plastic pollution first was reported in the ocean over 40 years ago (Carpenter and Smith, 1972; Colton et al., 1974; Wong et al., 1974) and has continued to be a focus of extensive research efforts (Moore et al., 2001; Thompson et al., 2004; Law et al., 2010, 2014; Cózar et al., 2014). Recently, there has been a call to bring similar focus to freshwater (Wagner et al., 2014; Dris et al., 2015; Eerkes-Medrano et al., 2015). Concentrations of microplastics—plastics <5 mm in the largest dimension—in lakes and rivers have been reported as high, or higher, than in central oceans gyres (Eriksen et al., 2013; Castañeda et al., 2014; Free et al., 2014; Lechner et al., 2014; Yonkos et al., 2014; Corcoran et al., 2015; Mani et al., 2015; Baldwin et al., 2016; Mason et al., 2016). Freshwater ecosystems play a critical role in the global water cycle and human health. They connect the inland watersheds that provide drinking water for most of the global population. It is essential to understand the nature and impacts of emergent contaminants, such as, plastic litter, their associated persistent organic toxins (Koelmans et al., 2016; O'Connor et al., 2016), and properties of plastic-toxin interactions (Hankett et al., 2016) to effectively preserve this resource.
The North American Great Lakes system contains one-fifth of the world's freshwater and is arguably one of the continent's most valuable natural resources. Field surveys have confirmed the presence of microplastics in Great Lakes surface water (Eriksen et al., 2013; Mason et al., 2016), sediment (Corcoran et al., 2015; Ballent et al., 2016), and beaches (Zbyszewski and Corcoran, 2011; Hoellein et al., 2014; Zbyszewski et al., 2014; Driedger et al., 2015), as well as the rivers (Baldwin et al., 2016) and wastewater treatment plant (WWTP) effluents (Michielssen et al., 2016) that directly feed into the Great Lakes. Yet, these data are sparse. There is currently insufficient knowledge of spatial and temporal resolution of plastic debris in the Great Lakes to efficiently focus strategic mitigation and management.
The study of plastic in the environment is a rapidly growing field of research. Studies from many sectors have employed diverse analytical methods for the isolation, identification, and quantification of plastic particles in environmental samples. While studies continue to resolve the limits of the myriad new methods used, it remains difficult to obtain, with meaningful throughput and accuracy, a seemingly simple data type: plastic counts. For instance, in the absence of replicate sampling, we do not know how representative single samples are of the environments from which they are collected. Further, most studies rely on visual inspection of samples to identify and count plastic particles. Yet, visual identification can incur error rates from 20 (Eriksen et al., 2013) to 70% (Hidalgo Ruz et al., 2012), with nearly 99% misidentification for sediment samples (Löder and Gerdts, 2015). These challenges hinder future research efforts, as well as our ability to leverage existing data describing environmental plastic.
In this study, we addressed five objectives and sought to answer: (i) What is the spatial distribution of plastic litter across three of the Great Lakes (Lakes Superior, Huron, and Erie) and one connecting lake (Lake St. Clair) down to the smallest particle size yet explored (106 μm)? We hypothesized that plastic concentrations would correlate with proximity to urban areas and that the concentrations observed would dwarf those reported using a larger size cut-off (333 μm; Eriksen et al., 2013). (ii) How is the distribution and the residence time of plastic litter influenced by physical properties of the plastic particles (e.g., buoyancy)? We hypothesized that neutrally buoyant particles, which move three dimensionally through the water column, would have a longer residence time than floating particles that experience surface drift only. (iii) Do permanent features of high plastic pollution exist (e.g., a “Lake Erie Garbage Patch”) where mitigation could be focused? Based on existing hydrodynamic models of Lake Erie that predict summer convergence (Beletsky et al., 2013), we hypothesized that permanent features of high plastic pollution would exist in surface drift models and field survey data in anticyclonic anomalies. To inform method development and data interpretation in this study and across the field, we sought to answer (iv) how variable are plastic concentrations among triplicate trawls sampled consecutively at the same location? We hypothesized that within-station variability in count data would not be even across sites, but rather could depend on weather and sampling conditions. Finally, we asked (v) what is the false-positive rate for discerning plastic from non-plastic particles based on visual inspection? As dozens of previous studies have relied on visual inspection alone, we hypothesized that false-positive rates would be <50%, implying that this method was not prohibitively error-prone. Collectively, these efforts lead to a better understanding of the drivers of freshwater plastic pollution in the Great Lakes and around the globe.
Materials and Methods
Lake Sampling
To assess the spatial distribution of plastics across three Great Lakes and Lake St. Clair (objective i) surface water samples were collected at 38 stations (Figure 1) throughout the summer (May–August) of 2014 using a rectangular manta trawl 16 cm high by 61 cm wide towing a 100 μm Nitex mesh net 3 m long (Wildco) with a 100 μm Nitex mesh cod-end 28 cm long by 15.5 cm in diameter and a flowmeter (General Oceanics Model 2030R Mechanical Standard Rotor). The net was towed outside the wake of the boat at ~2 knots for 20 min. For precision comparison at each station (objective iv), consecutive triplicate trawls were performed over the same transect. The difference in flow meter readings was multiplied by the manufacturer rotor constant and the width of the net mouth to calculate the area of water sampled. In order to standardize and compare plastics concentrations with previous studies (Eriksen et al., 2013; Mason et al., 2016), counts were divided by respective trawl area to achieve concentrations of plastics km−2.
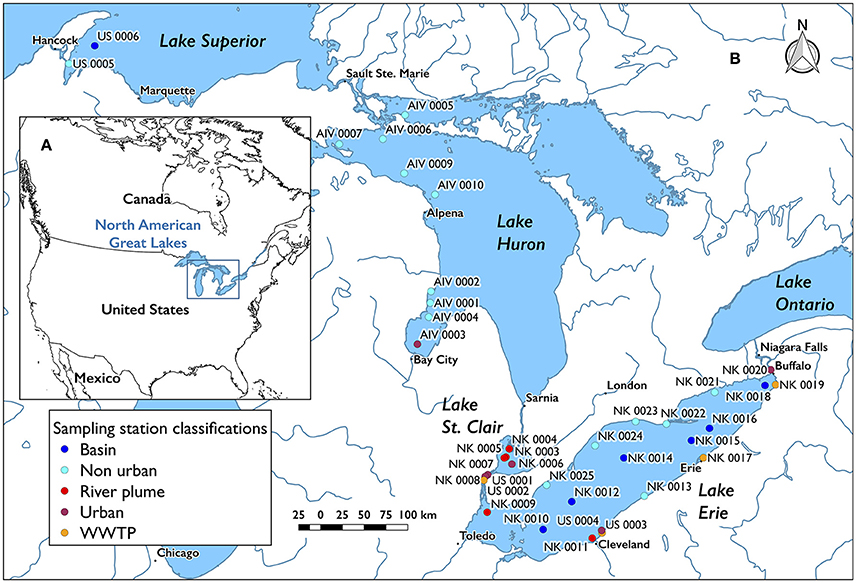
Figure 1. Maps of all stations sampled. Each station contained replicate trawls. (A) Overview and location of the North American Great Lakes on the North American continent. (B) Station locations and classifications in Lake Superior, Lake Huron, Lake St. Clair, and Lake Erie.
Stations were categorized as basin (>12 km from coast, n = 7), non-urban (<12 km from coast with <5,000 inhabitants km−2, n = 15), urban (<12 km from coast with >5,000 inhabitants km−2, n = 6), river plume (n = 5), and WWTP (sampled from environment near where final effluent is released, n = 5; Figure 1). Environmental data describing conditions at the start of each trawl, including wind speed, cloud cover, water temperature, air temperature, wave height, eastward surface water velocity, northward surface water velocity, wave direction, and wave period, were collected from the Great Lakes Observing System Point Query Tool of the Great Lakes Coastal Forecasting System1. Hourly data (or 3-h data, in the case of water temperature) for before and after the start time of each trawl were pulled, and the average was weighted by the number of minutes between data points. Descriptors of all trawls are available (Supplementary Data Sheet 1) where data interpolation was possible (e.g., no data existed for stations in Lake St. Clair or rivers).
Samples were recovered by rinsing the contents of the cod-end into a series of brass-framed sieves (Humboldt Mfg. Co.; Elgin, IL, USA) with stainless steel mesh sizes 4.75 mm, 212 μm, and 45 μm (Figure 2A; Humboldt Mfg. Co.). Each fraction was rinsed into a plastic bottle (HDPE bottle, PP screw top, Fisher Scientific 03-313-6C, 03-313-6B) with 70% ethanol for preservation. Sampled items that were too large to fit in a bottle were stored in Ziploc XL bags for later examination. All liquids used directly on the samples were filtered through 100 or 20 μm Nitex mesh in the field.
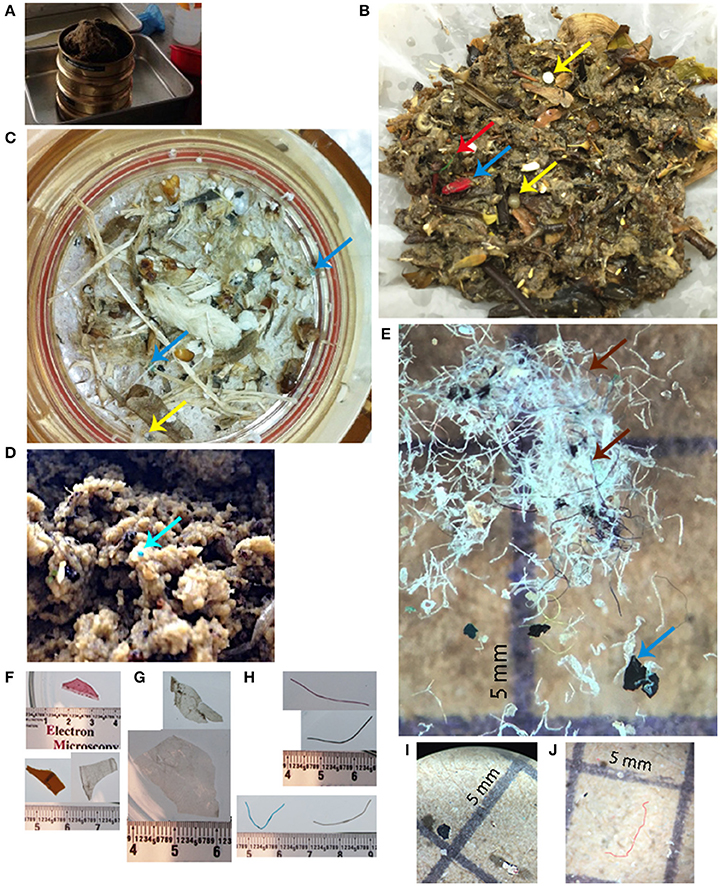
Figure 2. Photographs of samples at various stages of processing, as well as examples of different shape classes. Arrows indicate plastic amidst co-sampled nonplastic organic matter; blue: fragment, dark red: line, yellow: nurdles, cyan: sphere/bead, brown: fiber. (A) Bulk sample directly upon retrieval from Manta on a stack of a series of sieves. This sample contained an abundance of algal biomass. (B) Bulk sample drying on a 53 μm mesh net. (C) Sample after enzymatic processing, which included an incubation in hydrogen peroxide that bleached much of the non-plastic organic matter. This bleaching aided in differentiating plastic (tended to retain color) from non-plastic (prone to bleaching) particles. (D) Examples of plastic of sphere class; zoomed in subset of sample in (B). (E) Smallest size fraction (106–1,000 μm) after WPO. Note colored plastic fibers (brown arrows) enmeshed in mass of natural fibers bleached white from hydrogen peroxide treatment. (F–H) Examples of plastic of fragment, film and line shape classes, respectively; ruler markings are in cm units. (J,I) Examples of plastic of paint chip and fiber shape classes, respectively; grid squares are in 5 mm units.
Sample Processing and Counting
Field-collected samples were spread over 53 μm Nitex mesh (Figure 2B), weighed for wet mass, dried at 60°C, and subsequently weighed for dry mass. Large pieces of organic material (e.g., sticks, leaves, etc.) were removed manually. The sample was mixed at a 1:1 ratio with 10% sodium dodecyl sulfate (Acros Organics 226140025) and incubated at 50°C, rotating at 80 rpm for least 24 h. Samples were then size-fractionated through a series of brass and stainless steel sieves (Humboldt Mfg. Co.; Elgin, IL, USA) with mesh sizes 4.75 mm, 1,000 μm, and 106 μm.
The 106–1,000 μm fraction of each sample was digested to remove non-plastic labile organic matter. The first digestion method used consecutive incubations with proteinase, cellulase, and chitinase, followed by incubation in 30% H2O2 for 24 h [sensu (Lorenz, 2014); Figure 2C: sample images]. Following the release of a NOAA Marine Debris Technical Memorandum providing guidelines on the analysis of microplastics in the marine environment (Masura et al., 2015), all previously processed samples were re-processed, and all subsequent samples were processed using only the wet peroxide oxidation (WPO) protocol recommended therein (2015). After oxidation, the remaining material was filtered over 104 μm stainless steel filters (TWP Inc., 150 Mesh T304 Stainless 0.0026; Berkeley, CA), and transferred to a glass petri-dish with 70% ethanol and dried.
Plastic pieces were manually pulled from the <4.75 mm fraction. The raw 1.00–4.75 mm and digested 106–1,000 μm fractions were visually sorted with the aid of a stereo dissecting microscope (10–80x; Zeiss SteREO Discovery.V8; Oberkochen, Germany). Each plastic piece in the two larger size classes was categorized by shape (Figures 2E–I): fragment (secondary plastic broken down from larger debris), film (e.g., thin plastic from bags and wrappers), fiber (e.g., individual filaments of textile threads, very thin and frequently curled), line (e.g., fishing line, straighter, and thicker than fiber), nurdle (preproduction plastic pellet), sphere, foam, or paint (consistent with multiple studies that consider paint a plastic or confirm it is composed of, e.g., alkyds and (poly)acrylate/styrene; Lima et al., 2014; Kang et al., 2015; Neves et al., 2015; Song et al., 2015; Imhof et al., 2016; Nizzetto et al., 2016). Such detailed categorization was not possible for the smallest size class (106–1,000 μm), so the smallest particles were classified as either fragment or fiber.
Substantial effort was invested in gaining experience and establishing confidence in visually and tactilely distinguishing plastic from non-plastic particles, especially in the smallest (106–1,000 μm) size class. A collection of characteristics was established to distinguish plastic from non-plastic and to categorize plastics into morphological types. Physical features (color, hardness, fragility, shape) were considered. Features that frequently indicated plastic fragments included: malleability (not brittle), defined jagged shape, shiny surface, and presence of artificial dyes. Dye-free plastic particles were identified by their opaque and white nature. Features that often indicated an inorganic particle included: brittleness or unresponsiveness to force applied by tweezers, audible scratching noise when scraped, transparency, and well-defined crystalline structures and right-angle fractures.
Precaution was taken to minimize risk of sample contamination from handling and the laboratory environment. All liquid that came in contact with the samples (water for sieving, ethanol for storing) was filtered to remove particles >10 μm, glassware for storage was blasted with high-pressure air before use. Thin Teflon sheets (0.005 “Natural Virgin PTFE Roll Stock 12” Wide, Ridout Plastics Co. Inc.) were inserted between storage glassware and their plastic screw tops, as Teflon is rare among environmental plastics and its diagnostic fluoride ion could be detected analytically downstream if contamination did occur. Samples were processed in a laminar-flow or fume hood and remained covered otherwise. Cotton laboratory coats were worn by all individuals. Blank samples consisting of one 1,500 ml and two 500 ml aliquots of 10 μm-filtered MilliQ were processed and counted alongside field samples to account for environmental plastics incorporated during the sampling process that would lead to false positive plastic counts.
All data treatment and statistics were performed using the R statistical environment (version R-3.3.1; Team, 2014). All R code generated to create figures and perform calculations is freely available23 Maps of trawl locations and counts were generated with Quantum GIS (v. 2.18; QGIS Development Team, 2016).
Scanning Electron Microscopy Energy-Dispersive X-Ray Spectroscopy (SEM-EDS)
To assess human error and determine our false positive vs. false negative rates in the assignment of the smallest particles as plastic (objective v), a subset of particles from the smallest size class were randomly chosen from each of the suspected plastic (n = 10) and suspected non-plastic particle (n = 10) pools across 10 trawls. These particles were characterized analytically (described below). In addition, we prepared a library of 35 known standards to inform our ability to differentiate plastic, mineral, and non-synthetic organic matter and identify potential contamination of our samples from plastic in the processing environment. Standard items included virgin polymers, plasticware, and instruments used for sample collection, processing, and storage, paint from a sampling vessel (R/V Nancy K), fibers from lab coats, hair from sample processors, phytoplankton carcasses, and mineral particles.
SEM-EDS was performed to acquire an atomic signature for the 260 particles and standards assessed. Particles were mounted on an SEM peg (0.5 in. diameter; Electron Microscopy Sciences, Cat. 75160; PA, USA) with a piece of double-sided carbon tape (Electron Microscopy Sciences, Cat. 77816; PA, USA). A thin layer (~40 nm) of gold was applied to the sample using a gold sputter coating machine (120 s, Denton Vacuum Inc., Desk II, Cherry Hill, N.J.). Each particle was imaged using a JEOL JSM-7800F SEM at an accelerating voltage of 15 keV and an acquisition time of 20 s. A rectangular well-focused central area on each particle was excited via EDS. The resulting spectra were analyzed with Oxford AZtec 3.1 EDS software. The auto-ID function using default parameters verified the presence of elements on the surface of each particle. Following data acquisition, particles were assigned to each of three classes based on peak elements and surface texture: inorganic/mineral (IO), non-plastic (NP) organic matter, and plastic (P). Some gradation was allowed between discrete classes resulting in 5 different categories: P, P-NP, NP, NP-IO, IO.
Lake Erie Plastic Transport Model
It is not feasible to perform the high-resolution spatial and temporal sampling required to understand the lake-wide distribution and movements of plastic pieces. Thus, a Lagrangian particle transport model previously used in Lake Erie (Michalak et al., 2013; Fraker et al., 2015; Beletsky et al., 2017) was applied to simulate transport of microplastics over a variety of timescales and plastic properties (e.g., its buoyancy; objectives ii and iii). In this model, particle trajectories were calculated with the hydrodynamic model velocity recorded at regular time intervals (e.g., hourly). For each particle, the gridded velocities were interpolated to its location and the particle was moved to a new location based on the interpolated velocity and the time step of the particle transport model (Lynch et al., 2014). The three-dimensional particle trajectory code is based on the second order accurate horizontal trajectory code, as described in Bennett and Clites (1987), with the addition of vertical position tracking. Plastic “particles” in the model are neutrally buoyant (i.e., have the same density as the ambient water), passive (i.e., they follow local three-dimensional currents), and biochemically inert. If collision with model boundaries occurs, particles remain in the nearshore zone. The model includes horizontal and vertical diffusion, as introduced by Smagorinsky (i.e., with a non-dimensional coefficient of 0.005 in the horizontal diffusion parameterization; Smagorinsky, 1963) and random-walk approaches, respectively. Vertical diffusion was set at 5 × 10⁻⁴ m2 s−1. Because the size of most particles in this study is <1 mm, they are considered fully submerged and therefore windage is zero. In experiments that examine the effect of plastic buoyancy on residence time and transport, floating particles were driven by surface currents only, which were obtained from the top layer of the 3D hydrodynamic model.
Advection fields used by the particle model were produced by the three-dimensional finite-difference hydrodynamic model based on the Princeton Ocean Model (Blumberg and Mellor, 1987), driven by the wind, heat flux, and tributary flow from 22 major rivers and two outflows (listed in Schwab et al., 2009). The hydrodynamic model used a uniform 2 km horizontal grid with 21 vertical levels. Six years of hourly current data (2004–2005, 2007, and 2009–2011) obtained from previous applications (Beletsky et al., 2013) were used to model microplastic transport in summer months (including the month of June, the month of Lake Erie field sampling). In addition, year-long simulations were conducted when particles were continuously released throughout each year. To calculate residence times, the sequence of years was looped because longer time periods were required to flush the vast majority of particles from the lake.
In each model simulation, virtual particles were released daily to Lake Erie surface water at 29 tributaries (Supplementary Table 2) and two WWTPs in the Cleveland area. Particles left the lake through Niagara River and Welland Canal (easternmost edge of Lake Erie). For residence time calculations, particles were released during the first year (2004) and then tracked until the percentage of particles remaining in the lake dropped to 1% (eight years for neutrally buoyant particles).
Results and Discussion
This dataset represents the largest single-season effort of plastic quantification in the Great Lakes to date. Plastic was counted in 108 surface trawl samples, which spanned 38 stations across Lakes Superior, Huron, St. Clair, and Erie. Plastic was found at every station sampled (Figure 3). The trawl with the highest total concentration of plastic contained 4-fold higher plastic than yet reported in the surface of the Great Lakes (Eriksen et al., 2013; Mason et al., 2016). The vast majority of plastic counted was <1 mm in size (Figure 4A).
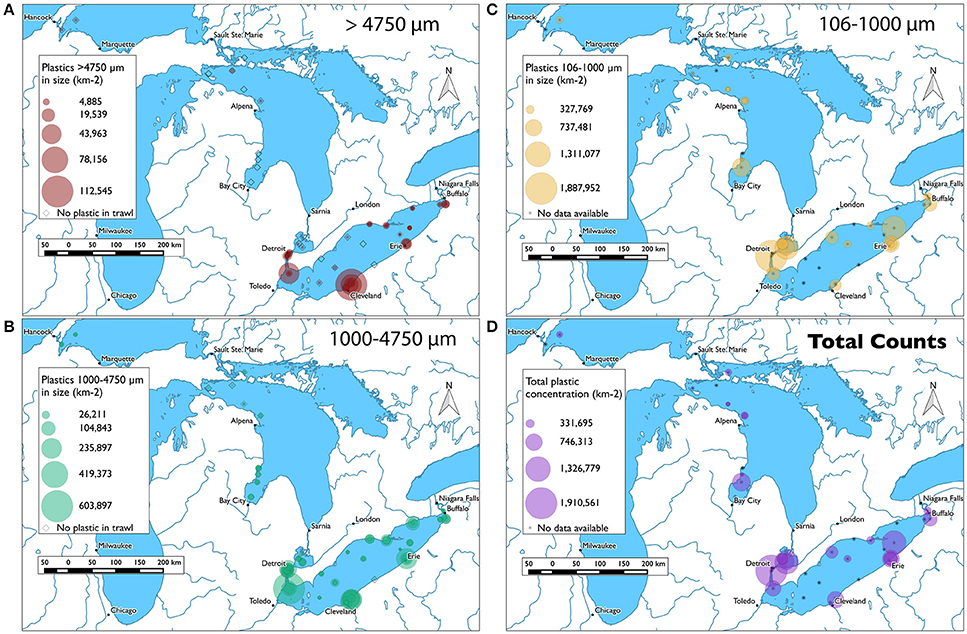
Figure 3. Maps of plastic concentrations across the lakes sampled, where magnitude of concentration is depicted by size of circle around trawl location. Note, fiber counts are not included in these figures, as discussed below. (A) Mapped counts of plastic litter >4,750 μm. (B) Mapped counts of plastic litter 1,000–4,750 μm. (C) Mapped counts of plastic litter 106–1,000 μm. (D) Total mapped counts for the stations where all three size classes were quantified.
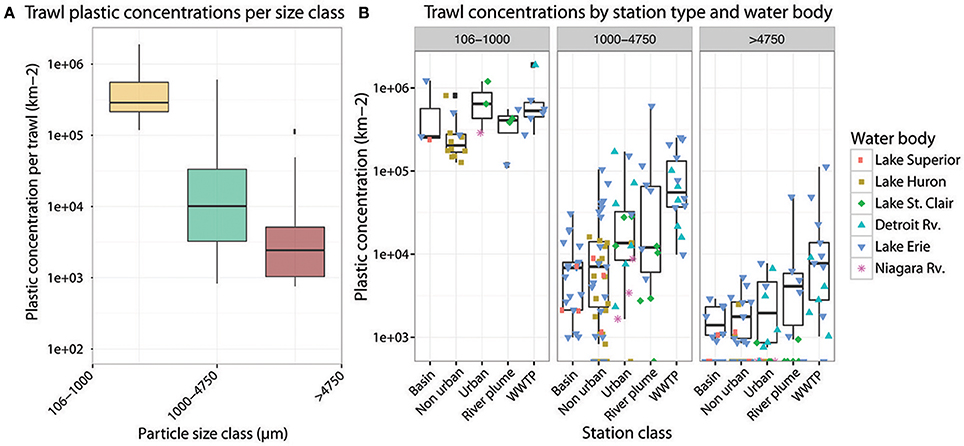
Figure 4. (A) Boxplots depicting the means and spreads of all individual trawl counts by particle size fraction. (B) Boxplots depicting the means and spreads of individual trawl counts by size class, station type, and water body: Lake Superior (pink square), Lake Huron (brown square), Lake St. Clair (green diamond), the Detroit Rv. (blue upright triangle), Lake Erie (dark blue upside-down triangle), and the Niagara Rv. (purple star).
Concentrations and Distributions of Great Lakes Plastic
Plastic Concentrations Were Highest at Urban Centers
Total plastic abundances per surface trawl spanned an order of magnitude. They ranged from 1,910,562 particles km−2 in the Detroit River plume (NK0008-3) to 126,933 particles km−2 in the Straits of Mackinac in Lake Huron (NK 0007-1; Figure 3D; Supplementary Data Sheet 1). Notably, these total concentrations and all that follow do not include counts of fibers, as during sample processing it became evident that fibers could not be quantified with equally high confidence across size fractions, an issue which is discussed at length below. Fiber concentrations were analyzed separately to explore patterns in the data.
The highest concentrations of plastic were found in samples collected within 12 km of the coast of populated urban cities, in river plumes, or directly at the effluent of WWTPs (Figures 3, 4B). All of the most concentrated samples but one were collected in Lake Erie or the urban river and estuary-like lake directly feeding it (Detroit River and Lake St Clair; Figure 2). Our empirical data support recent model predictions that the loads of Lake Erie plastic inputs are 4- and 80-fold higher than Lakes Huron and Superior, respectively (Hoffman and Hittinger, 2017). Notably, the plastic input loads for this model were scaled to census-derived population density of the coastlines (Hoffman and Hittinger, 2017)—an underlying presumed correlation our field data support. The lowest counts were collected at non-urban coastal stations and offshore basin stations, with the exception of the deepest point of the Eastern Basin of Lake Erie (Figures 3, 4B). These findings support previous reports of a correlation between plastic concentrations and proximity to urban centers in the Great Lakes (Baldwin et al., 2016), as well as other enclosed and semi-enclosed aquatic environments across the world, such as, tributaries to the Chesapeake Bay, USA (Yonkos et al., 2014), the Bay of Brest in France (Frère et al., 2017), the Xiangzi Bay upstream of the three Gorges Dam (Zhang et al., 2017), inland lakes around Wuhan, China (Wang et al., 2017), and estuaries in and around Durban, South Africa (Naidoo et al., 2015). Attributes that are likely to contribute to elevated plastic concentrations in urban vs. non-urban locales include higher population densities (Jambeck et al., 2015), increased particulate aeolian inputs (including plastic; Dris et al., 2015), and increased areas of impervious substrate. The percent of a watershed comprised of impervious substrate is positively correlated with higher plastic concentrations in the Great Lakes watershed (Baldwin et al., 2016), likely due to greater volume and higher velocity runoff during storm and snow melt events. The higher concentrations in river plumes and near WWTP effluents than in coastal areas (Figure 4B) suggest these inputs to be sources (McCormick et al., 2014) and that plastic debris enters this system from inland waterways and human activity. Increasing the degree of pervious substrate in watersheds, such as, the implementation of green infrastructure catchments, should be explored as an effective measure to capture plastic debris in runoff and reduce loads ultimately reaching waterways. As the number of storm events is expected to increase with a changing climate (IPCC, 2012), such innovations are timely to preventatively buffer our freshwater systems from being inundated with stormwater-delivered debris.
Single Trawls Are Imprecise: Within-Station Variability Can Vary 3-Fold
This is the first survey of freshwater plastic litter to address variability in counts by conducting replicate trawls at each of 38 stations. The distributions of all trawl concentrations, total concentrations, and station concentrations deviated significantly from normal distribution (Shapiro Wilks test, p < < 0.01) with high skewness (1.9–6.62) and kurtosis (3.5–49.25; Supplementary Figure 1). As a result, non-parametric tests were used (e.g., Spearman's rank correlation) and metrics that do not represent strongly skewed data (e.g., standard deviation) were not used to describe and interpret the results. Rather, to assess factors that influence within-station variability, we calculated a metric we termed the mean-normalized range (MNR) by dividing the count range (max–min) of each station by the mean of the station.
The vast majority of trawl concentrations from the same station varied more than 100%, as depicted by a mean normalized range (MNR) >1 (Figure 5; Supplementary Data Sheet 3). In other words, the accuracy of a single trawl at one station is quite low and repeated trawls at the same location can vary in precision by up to 3-fold. We suspect that the magnitude of MNR at certain stations is due to undersampling. Precision increases as the plastic concentration sampled increases, as MNR is significantly negatively correlated with total trawl concentration (Spearman's rho = −0.629, p = 0.000; Figure 5). MNR is <1 for all counts in the smallest size class, which have the largest concentrations (M = 0.09) and most frequently >1 in the largest size class (M = 1.94; Figure 5, Supplementary Figure 2), which have relatively lower concentrations. While dependent on plastic concentration, the MNR was not significantly influenced by air velocity (rho = −0.093, p = 0.245), east-west surface current velocity (rho = −0.072, p = 0.364), wave period (rho = −0.078, p = 0.330), or wave height (rho = −0.093, p = 0.242)—all local conditions that could influence the distribution of plastics at the water surface between trawls. However, longitudinal surface current velocity positively varied with MNR (rho = 0.166, p = 0.037); an increase in north-south current velocity was correlated with a decrease in precision between trawls. As currents in the lake are mostly wind-driven and winds on Lake Erie predominantly blow west to east, increases in north-south current velocity may indicate a local weather anomaly, such as, a squall or storm. These features are known to build up and die down quickly; it was not uncommon to experience a short burst in weather change over the course of the 1–2 h spent sampling at a single station. Such dynamic local conditions could increase the variability between trawl counts within a single station and decrease the accuracy of a trawl. To maximize reliability of surface plastic counts, we suggest samples not be taken around wind-related weather anomalies.
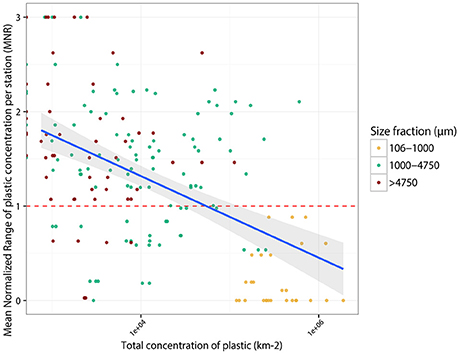
Figure 5. Plot of trawl mean normalized ranges (MNR) across stations vs. the log of plastic concentration in each individual trawl. Regression line of the linear model used to predict MNR from plastic concentration is shown (R2 = 0.442, slope = −0.357, intercept = 2.737, p < 2.2e-16). The gray band depicts the 95% confidence level interval for predictions from the linear model.
A similar survey of marine plastic debris assessed variability with replicate sample quantification in the North Pacific Gyre (Goldstein et al., 2013). This study found a mean within-station coefficient of variation (CoV; calculated as the station standard deviation divided by the station mean) of 51.4% for net-collected samples. CoV depends on the station standard deviation, which we deemed an inappropriate representation of data as heavily positively skewed as ours (Supplementary Figure 1). Yet, for purposes of comparison, we determined the CoV across the stations in this study and found they ranged from 1.5 to 173% (Supplementary Figure 3). The CoV of the smallest size class was less than that of the North Pacific study, whereas the CoV of larger size classes was greater (Supplementary Data Sheet 3). In the power analysis performed by Goldstein et al. (2013), statistical power increased when number of samples increased. In the case of our data, within-station variability appeared more influenced by the plastic count in each sample than the number of samples counted (as n = 28 for the smallest size class, and n = 108 for the two larger size classes). In order to reduce the within-station variability of the larger two size classes at stations with low overall plastic concentrations, greater counts are needed per trawl, thus sampling should occur over a larger area. We suggest a minimum MNR of <1 and ideally lower. As field survey data is time consuming and costly, recognition of this count-dependent variability and the importance of replication is critical for maximizing the value of such datasets, especially as future field survey studies are designed and implemented.
Plastic Less than 1 mm Dominated the Dataset
The mean concentration of plastic in the smallest size class (106–1,000 μm) was 15-fold higher than the middle size class (1,000–4,750 μm) and 130-fold higher than the largest size class (>4,750 μm; Figure 4A, Table 1). A similar pattern was maintained in all trawls, regardless of water body or types of stations sampled (Figure 4B). These findings are consistent with surveys of other lakes, such as, lakes near Wuhan, China where more than 80% of the plastics found were 2 mm and smaller (Wang et al., 2017). However, plastics 1–5 mm in size were most abundant in sections of the Xiangxi River, perhaps due to a shorter residence time and less weathering while in the river (Zhang et al., 2017). Previous surveys of Great Lakes plastic have found a 40- and 6-fold difference between the smallest and largest size classes (Eriksen et al., 2013; Mason et al., 2016). It is likely that the order of magnitude increase in the relative abundance of the smallest size class between previous Great Lakes surveys and the overall maximum abundance in our study can be attributed to our use of a 106 μm size mesh collection net, as opposed to the 333 μm mesh used previously in the Great Lakes and their tributaries (Eriksen et al., 2013; Baldwin et al., 2016; Mason et al., 2016) and in most aquatic plastic debris surveys to date (Hidalgo Ruz et al., 2012; Law, 2016). As a result, our data more comprehensively capture the “micro” plastic range in the Great Lakes, knowledge of which is critical to our assessments of environmental risk. Smaller plastic particles stay at the water surface longer than larger particles of the same composition and shape (Khatmullina and Isachenko, 2016; Kowalski et al., 2016) and are more readily consumed by smaller organisms in aquatic food webs, increasing the chances of biomagnified effects due to predation (Wagner et al., 2014). Further, the larger surface area to volume ratios of these small particles increases their potential as vectors of adsorbing contaminants (Barnes et al., 2009; Teuten et al., 2009). Future studies should continue to probe this small size class, as well as develop innovative high-throughput solutions to capture and quantify particles below 106 μm and into the nanoscale, where risk may be highest due to subcellular effects (Syberg et al., 2015).
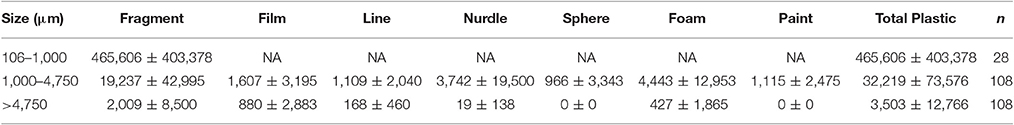
Table 1. Mean and standard deviations of plastic type concentrations (km−2) across all trawls and size classes quantified.
Secondary Plastics (Fragments) Were the Most Common Plastic Type
Fragments were the most abundant plastic shape class across the dataset (Figure 6). This finding is consistent with other recent studies that used comparable analytical methods, including a survey of 59 stations in Lake Michigan (79% fragments, 14% fibers; Mason et al., 2016), and even a study in remote Lake Hovsgol, Mongolia (40% fragments, 20% fibers and lines; Free et al., 2014). Rivers and urban effluent (e.g., WWTP) are thought to be major contributors of plastic to freshwater water systems. Notably, studies of sources of plastic to the Great Lakes have documented fibers to dominate, not fragments. An analysis of 29 Great Lakes tributaries (Baldwin et al., 2016) found total debris comprised of 71% fibers and 17% fragments. Similarly, anthropogenic litter in the effluent of a high capacity wastewater treatment plant that discharges directly to the Great Lakes was found to be 61% fibers and 33% fragments (Michielssen et al., 2016).
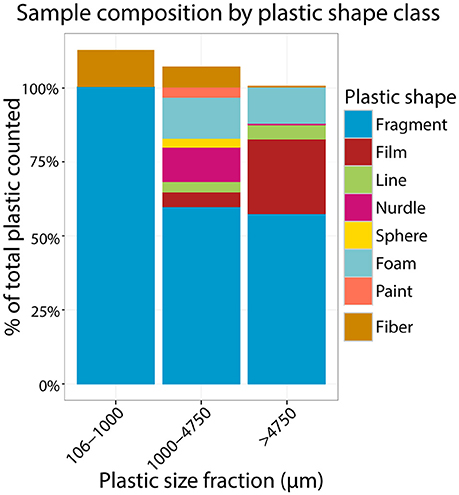
Figure 6. Stacked barplot depicting the relative abundance of different shape classes amongst plastic from each size fraction. The bar to 100% for each size class represent the relative abundance of different shape classes when fibers were not included in the total counts and the portion above 100% represents the relative abundance of fibers in the total counts.
This difference may be due to the fact that typically fibers are comprised of polymers that are denser than water, e.g., nylon, polyester, acrylic. As such, in a stable water body (e.g., large lakes, ocean gyres) they are expected to sink, while in the flow of turbulent mixing systems (e.g., streams, rivers, WWTP effluent, tidal inlets) these fibers may remain mixed and in the seston (Baldwin et al., 2016). Fragments are primarily secondary plastic debris and are likely to be composed of more positively buoyant polymers (e.g., polyethylene and polypropylene, as demonstrated in a study in Lake Michigan; Mason et al., 2016) that float at the lake surface. Alternatively, fibers may be drastically underestimated in surface aquatic environments owing to difficulties collecting fiber data, as discussed below.
When station type was considered, the relative abundances of fragments, foam, and (for the largest size class) film were high in urban and river plume samples—the latter of which were all coincidentally urban, as well (Supplementary Figure 2). Similarly, this trend was observed in river samples, where “litter-related plastic” (the collective class of fragments, foam, and film) was significantly more highly represented in Great Lakes tributaries of watersheds with urban attributes (Baldwin et al., 2016). This may be attributed to proximity to land-based plastic sources, such as, recreation on populated beaches and litter in urban areas and suggests that curbing mismanaged waste in urban centers could reduce the load of plastic in waterways.
Assessing Confidence in Plastic Count Data
Though recommendations (Ryan et al., 2009) and protocols (Masura et al., 2015) have been put forth for sample collection, processing, and quantification, standardized sampling methodology, and reporting are critically lacking (Hidalgo Ruz et al., 2012; Law, 2016). The reasons for these inconsistencies are multifaceted. This is a relatively young field of research with many newly recruited researchers from broad disciplines, e.g., environmental science, biology, chemistry, engineering, physics, oceanography, ecology, bringing diverse backgrounds to a common problem. Each study contributes new insights, but also highlights the Achilles' heel of their given approach. This process is necessary to arrive ultimately at a unified approach. In the present study, the greatest uncertainty arose in the treatment of fiber count data, as well as our ability to visually and chemically discern plastic particles from non-plastic in the smallest size class.
Confidence in fiber count data depends on size class and sorting effort
Fibers were identified in all size classes, yet the degree of certainty in the fiber count data depended on the size class, oxidative treatment of sample, and effort of the sample sorter. First, it is likely that fiber counts from field samples were underestimated because the sampled material was so heterogeneous causing fibers to be missed and unaccounted for. This was especially likely in the larger two size classes (1,000–4,750 μm and >4,750 μm), where WPO treatment was impractical at the volumes needed to be effective and thus could not be used to eliminate bulk non-plastic organic matter. In these fractions, the fibers, which are much less rigid than other plastic morphologies and more prone to “stick” to other objects when wet, were deeply enmeshed in the crevices of or entwined in natural fibers of non-plastic items (e.g., leaves, sticks, bark, feather, etc.) during sieving and sorting. As a result, fibers were difficult to separate from the non-plastic organic matter co-sampled from the lake surfaces, much of which was naturally fibrous (Figures 2B–E). This increased difficulty in acquiring fiber counts also required greater effort and vigilance by the person visually sorting, given the enmeshed fibers would be much thinner than other items the sorter was looking for. These issues were much less apparent in the smallest size class, where most non-plastic organic matter was removed chemically and fibers were more obvious with little surrounding or overlapping material. Thus, it is difficult to compare fiber abundance across size classes, as the “sorting effort” required varied widely. Second, owing to their small width and surface area, we could not use the same sensory data that we relied upon to discern plastic fragments from non-plastic particles under the microscope (e.g., squeezing, pinching, scratching, etc.). The small size of fibers also prohibited the controlled physical manipulation needed to perform chemical analysis via SEM-EDS—though we cannot predict whether this led to an over- or underestimate of fiber counts. Notably, these issues did not influence our ability to detect and report concentrations of plastic line. Lines were more discernible and behaved very differently when manipulated owing to their greater length, thickness, and consequent rigidity (Figures 2A,H,J).
Finally, fibers were the plastic type most likely to contaminate a sample during processing in this study. All but one of the 126 particles introduced to the blank controls were fibers (Supplementary Table 3). For instance, the 1,000–4,750 μm fraction of a single blank control contained 33 fibers, whereas the maximum raw number of fibers counted in the same size class was 33 and the average across all trawls was 24 (Supplementary Table 3). Further contributing to the underestimate of fibers in field samples relative to sample counts was that blank samples were pristine and easy to see, whereas fibers in field samples were often complex conglomerations of suspected natural and plastic fibers (Figure 2E). Though anecdotal evidence derived from observations during processing suggest that the environmental samples contained more fibers than the blanks, the possibility of contamination of samples by fibers could not be ruled out. Fiber contamination during sample processing has been reported previously (Foekema et al., 2013; Dekiff et al., 2014; McCormick et al., 2014; Woodall et al., 2015). A comparison of numbers of fibers introduced using different protocols suggested fiber contamination was introduced primarily as a result of sample sieving and moving from one holding vessel to another (unpublished data; BW Locke, RN Cable). We recommend taking precautions to reduce the number of times a sample is transferred, sieved, or filtered from the beginning of sample collection, in addition to reducing the amount of time a sample is exposed to open air outside of a fume or laminar hood.
It is paramount that the field overcomes the limitations and uncertainties related to the quantification of plastic fibers. Evidence is mounting that fibers are a dominant form of plastic pollution in many aquatic ecosystems—especially fluvial (McCormick et al., 2014; Zhao et al., 2014; Dris et al., 2015; Baldwin et al., 2016), but also in marine beaches and sediment (Browne et al., 2011; Claessens et al., 2011; Woodall et al., 2014; Fischer et al., 2015; Naidoo et al., 2015; Van Cauwenberghe et al., 2015). The ecological implications of these fibers remain to be shown, but plastic fibers are increasingly found in the stomachs and tissues of aquatic wildlife, many of which are consumed by larger animals, including humans (Neves et al., 2015; Rochman et al., 2015a; Vandermeersch et al., 2015; Li et al., 2016). Direct human health impacts have been reported, as well: when inhaled, microplastic fibers are retained the lung tissues and can become associated with malignant tumors (Pauly et al., 1998). We must develop an accurate assessment of the sources, abundances, and impacts of synthetic fibers in our environment so that informed mitigation practices can be put into place, if deemed necessary.
Visual discrimination of plastics is confirmed by analytical methods
While most studies rely on visual inspection alone (reviewed in Hidalgo Ruz et al., 2012; Law, 2016), such human sensory-based observations can be error-prone. First, misidentification can occur due to the similarities in appearances of plastic and non-plastic particles (Filella, 2015). Second, the reliability of visual identification decreases with decreasing particle size. In the smallest size class, we used SEM-EDS analysis to test and reduce our rate of incorrectly differentiating plastic from non-plastic via visual and tactile inspection alone. EDS spectra and SEM images representative of plastic, inorganic, and non-plastic organic particles were highlighted (Figure 7). EDS spectra are summarized in Supplementary Data Sheet 2; EDS spectra and SEM microscopic data files are included in Supplementary Image 1.
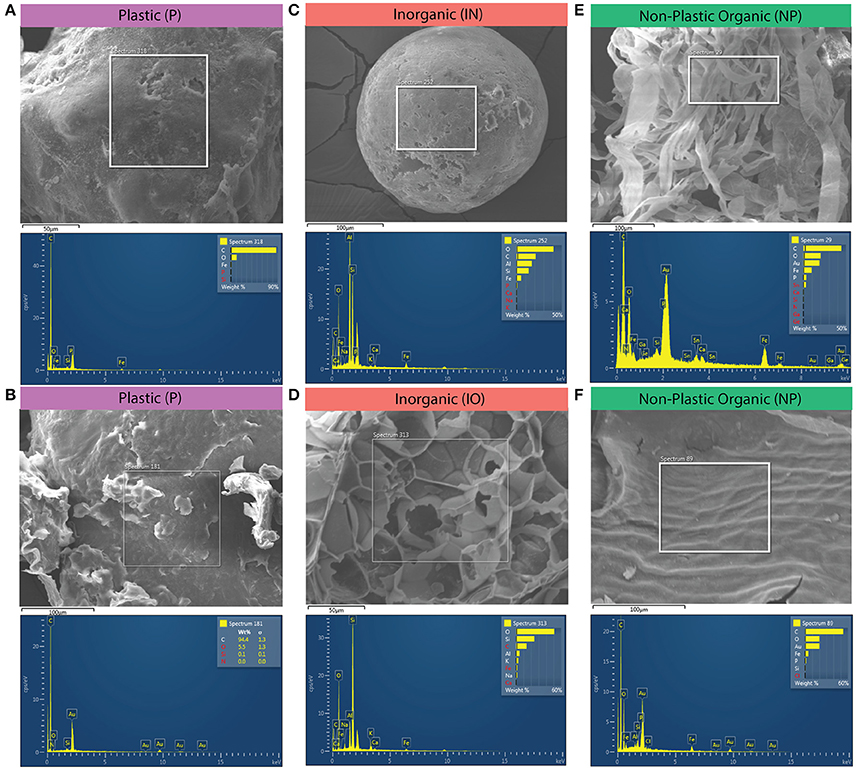
Figure 7. Examples of SEM-EDS spectra and microscopic images representative of the three compositional classes: plastic (P), inorganic (IO), and non-plastic organic (O). (A) plastic fragment. (B) Flaking, jagged, “crumbly” bead from a personal care product that served as a positive control. (C) Coal fly ash from a Lake Erie sample. (D) Piece of silica foam from Lake Erie sample. (E) Stringy, fibrous organic matter particle from Lake Erie sample. (F) Non-plastic organic matter control depicting diagnostic shallow surface veining; likely a leaf or other vegetation.
To address erroneous counts caused by misidentification while sorting, we built a diverse library of standards (described in Supplementary Data Sheet 2). This library was used to train our classification efforts prior to analyzing sample spectra. Among the qualitative anecdotes resulting from the analysis of this library, we learned that microbeads from personal care products all contained the elements C (primary peak), N, Si, and, all but one, O (Supplementary Data Sheet 2). One personal care product (PCP) bead standard had a large Si peak relative to the other elements. We attributed this composition to the particle being mica or previously having been in close association with mica. Indeed, sparkling “beads” from PCPs that crumbled upon touch were found often, which we presumed were mica particles, after finding it listed as an inactive ingredient in PCP. Further, all organic matter standards contained Fe (in the presence of O), as did the nylon mesh net that had been used to filter organic material, whereas no Fe was found in pristine virgin polymers. This pattern held until environmental samples were analyzed. As opposed to pristine standards, Fe was detected in nearly all particle types (plastic, non-plastic organic, and mineral) that had been exposed to the environment.
Physical features of the particle surface further informed our classification decisions between plastic and non-plastic organic. Plastic tended to have deep and clean fractures, and smooth surfaces with shallow flakes (e.g., Figures 7A,B); though this could be obscured as particles oxidized with age and appeared brittle. Particles with relatively simple elemental spectra consisting of a large primary C peak, frequently with a smaller O peak, were classified as plastic (P; Figures 7A,B). Inorganic (IO) particles were best characterized by the presence of a large primary peak of the element Si (Figures 7C,D; Supplementary Data Sheet 2). One IO particle (of 47 total) that lacked Si instead contained Ti (Supplementary Data Sheet 2). Many of the IO particles were round spheres suspected to be coal fly ash (Figure 7C), a positively buoyant byproduct of coal combustion that has been reported previously in Great Lakes surface waters (Eriksen et al., 2013). Some IO particles physically resembled styrofoam balls but were confirmed to be puffed silica foam, having contained prominent mineral elements (e.g., Figure 7D). Non-plastic organic matter (NP) was physically characterized by stringy fibers of irregular width or shallow-relief surface patterns typical of leaf veining (Figures 7C,F, respectively) and chemically characterized by more complex elemental signatures with several smaller peaks rather than a single dominant C peak.
To assess our tendency to accurately classify plastic from non-plastic, we compared our initial visual classifications with those based on EDS-SEM analysis (Figure 8; Supplementary Data Sheet 2; Supplementary Image 1; Supplementary Table 1). Of all pieces visually identified as plastic, 76% were confirmed as P, 2% were NP, 12% could not be identified as P or NP, and 10% were IO. Of all pieces visually identified as non-plastic, 46% were confirmed as NP, 35% were IO, 11% couldn't be identified as P or NP, and 7% were plastic (Figure 8). A chi-squared test of independence confirms that the EDS-SEM-based plastic (P) calls occur most often in the visually-determined plastic category, followed by the P-NP class, and the EDS-SEM-based non-plastic (NP) calls occur most often in the visually-determined non-plastic category, followed by the inorganic (IO), and NP-IO (χ2 = 112.63, p = 2.003e-23, Table 2). These findings provided confidence in the visual discrimination between plastic and non-plastic particles in the smallest size class, and that rates of false-positives in both categories are similar enough that there was no need for adjustments to plastic abundances.
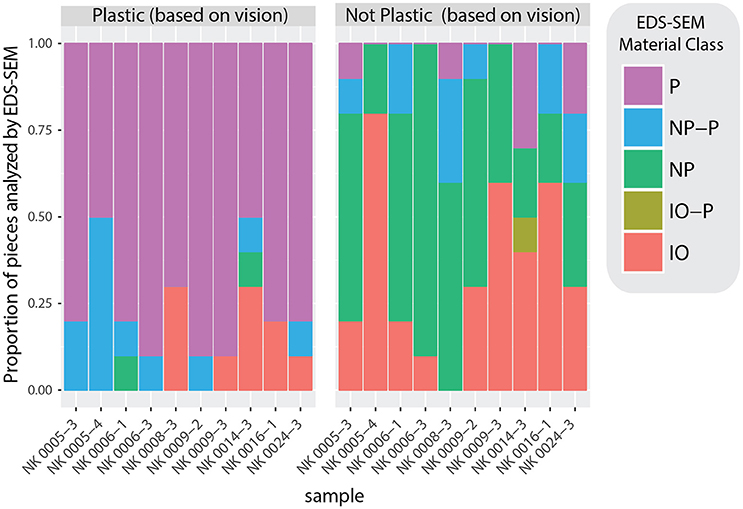
Figure 8. Barplots representing the agreement between visually categorized fragments (plastic vs. non-plastic) and SEM-EDS analytically categorized fragments. SEM-EDS-based classifications fall along a spectrum of three discrete categories: plastic (P), inorganic (IO), and non-plastic organic (NP). This is a visual representation of the contingency table used in the chi-square test of independence (Supplementary Table 1).
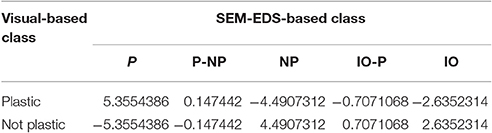
Table 2. Residuals of chi-squared test of independence performed on the contingency table (Supplementary Table 3) that related the number of samples visually deemed as plastic and not plastic vs. their SEM-EDS-based classification into plastic (P), non-plastic organic (NP), and inorganic (IO) particles.
Lake Erie Plastic Transport Model
To develop a more holistic view of plastic transport dynamics than is possible based on discrete field collections and assess the possibility of predicting plastic distributions, we modeled the transport of plastic and tested the effect of plastic buoyancy on the resident times in Lake Erie. Lake Erie is the smallest and shallowest of the Great Lakes, but is disproportionately surrounded by highly populated areas and used heavily for shipping and fishery industries.
No Lake Erie “Garbage Patch,” but Prominent Longshore Transport Highlights at-Risk Coastal Areas
For decades, studies have described the presence of an oceanic “garbage patch” (coined in Moore et al., 2001), an amalgam of human-generated trash caught-up in the North Pacific Central Gyre that results from the convergence of floating debris in the anticyclonic eddy of the gyre's high pressure cell (Day and Shaw, 1987; Law et al., 2014). Similar anticyclonic currents form in Lake Erie in summer months (Beletsky et al., 2012) and the high concentrations of plastic in Lake Erie's eastern basin have been attributed to this feature (Eriksen et al., 2013; Driedger et al., 2015). Yet, our plastic transport model did not predict a permanent plastic “garbage patch” in Lake Erie (Figures 9, 10A). This lack of a “garbage patch” may be explained by less intense convergence of surface lake currents or by the less persistent lake currents that last on the order of only weeks to months. Comparatively, stable anticyclonic circulation persists in the oceans for much longer time periods.
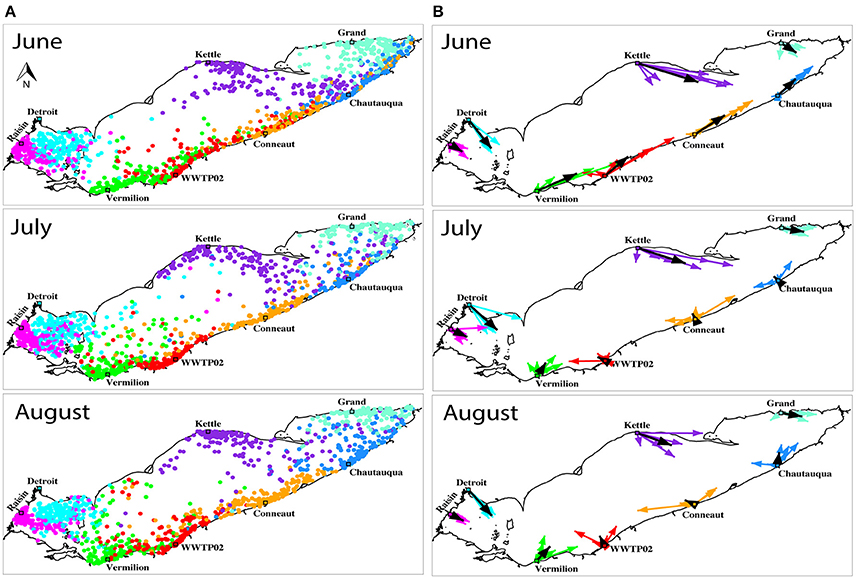
Figure 9. (A) The distribution of neutrally buoyant particles at the end of month-long transport in June, July, and August for 6 years. For visual simplicity, 8 of the 29 sources (influents) are depicted: the Raisin Rv. (magenta), Detroit Rv. (cyan), Kettle Rv. (purple), Grand Rv. (turquoise), Chautauqua Rv. (blue), Conneaut Rv. (orange), Cleveland WWTP (red), and Vermillion Rv. (green). (B) Mean transport vectors summarizing the positions of all particles at the end of month at each of the same eight representative sources (similarly colored coded). The six vectors per source represent mean transport for each of the 6 years. The 6-year mean vector is shown in black at each input.
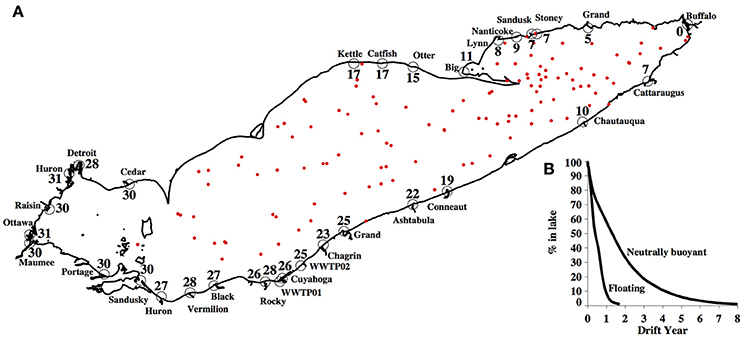
Figure 10. (A) Mean residence time (months) for each source of neutrally buoyant particles. Particles were released daily for 1 year and tracked for 8 years (time for 99% of particles to leave the lake). Red dots represent the particles that remain in the lake after 8 years of drift. (B) Percent of particles remaining as a function of time for the neutrally buoyant (right curve) and floating (left curve) models; based on same run conditions as (A).
Results of monthly drift in summer (June, July, and August, each run over 6 years) illustrated the variability of spread due to changing current patterns (Figure 9). In early summer, the model generally predicted the eastward drift of neutrally buoyant particles. This was especially pronounced along both the northern and southern coasts in June, the month the majority of our field survey took place. Later in the season, the large-scale anticyclonic circulation that typically develops in mid and late summer (Beletsky et al., 2012) influenced the movement of plastics. Due to that circulation feature, particles released along the southern coast east of Cleveland were often transported westward (Figure 9). During that time, temporary patches (lasting for a few days) formed in the floating particles model. In this case, particle aggregation due to current convergence is expected. For example, in mid-August 2010, floating particles aggregated in a large anticyclonic gyre developed in the central basin and two smaller anticyclonic gyres in the eastern basin (Supplementary Figure 4). Overall, particles in both neutrally buoyant and floating cases exhibited general eastward drift and flushed quickly from the western basin by the Detroit River flow (Figure 10A). Recirculation in the central and eastern basins was especially pronounced in the summer. Neutrally buoyant particles drifted more slowly than floating particles because of reduction of current speed with depth.
Our model did not predict elevated concentrations of plastic in Lake Erie's eastern basin relative to the central basin, as seen in both our field survey (Figure 3D) and that of a prior study in this lake (Eriksen et al., 2013). Notably, this pattern was absent in a recent Great Lakes particle model, as well (Hoffman and Hittinger, 2017). This is despite the fact that the forcing used in the particle model presented here has superior temporal resolution (e.g., hourly vs. three-hourly) and more accurately predicts observed Lake Erie circulation patterns (Beletsky et al., 2013). For example, the winds used in the Hoffman and Hittinger particle model (NOAAs Great Lakes Coastal Forecast System model output) typically produce cyclonic circulation patterns in summer, rather than the anticyclonic patterns observed in summer (Beletsky et al., 2013). We hypothesize that model discrepancy can be either due to a temporary patch in both observational surveys or due to an elevated input near or in the eastern basin that was not accounted for in our model (e.g., Baldwin et al., 2016 documented a peak in microplastic concentration at Ashtabula, OH).
According to the neutrally buoyant particle model predictions, habitats along the southern coast of Lake Erie were predicted to be most affected by plastic pollution (Figure 9). The higher concentration of rivers along the southern coast led to more particles released in that area in model runs. The eastward drift of particles from upstream sources (e.g., the Detroit River and other rivers in the western basin) led to higher concentration of particles (Figure 9; particle release points identified by open circles and are listed in Supplementary Table 2). This interpretation is consistent with the recognition that rivers are major sources of plastics to inland water bodies (Wagner et al., 2014), including the Great Lakes (Baldwin et al., 2016). In most months, rather than moving offshore, the model predicted longshore transport from coastal sources. This model indicates that future plastic pollution mitigation and management efforts in Lake Erie should focus on its southern shore and downstream of urbanized areas. Extending this plastic transport model to the other four Great Lakes will similarly inform future efforts across this critical watershed.
Plastic Density Drastically Impacts Residence Time in the Lake
The buoyancy of modeled particles had a strong effect on residence time in the lake; floating particles flush from the lake in 1.7 years—nearly 5 times faster than neutrally buoyant particles (8.1 years; Figure 10B). In fact, the modeled flushing time for neutrally buoyant particles in Lake Erie substantially exceeds hydraulic residence time estimates (2.7 years; Bolsenga and Herdendorf, 1993). However, the residence time is not uniform across the lake. Average residence times of neutrally buoyant particles released at different sources show a west-east gradient (Figure 10A), with the shortest residence times for the particles released at the Buffalo River (less than a month) and longest for those released at the Ottawa and Huron Rivers in the western basin (over 30 months, Figure 10A).
Most surveys of environmental plastic pollution tend to collect samples at the water surface, capturing floating plastic only. According to this model, most of the floating plastics sampled in the western and central basin would have been in Lake Erie for <2 years. However, while most virgin plastic used in consumer products—especially one-time use plastic (PlasticsEurope: Association of Plastics Manufacturers, 2015)—is predicted to be positively buoyant, plastic litter is readily found in sediment (Corcoran et al., 2015; Van Cauwenberghe et al., 2015; Ballent et al., 2016). This can be attributed to denser polymer types sinking, but there are other dynamic changes in the buoyant density that plastics are likely to undergo once in the environment, e.g., oxidation or biofouling. These changes are poorly described, but our results indicate the need to resolve these phenomena to effectively model the loads and fluxes of environmental plastic pollution in freshwater and marine systems alike.
Conclusion
This study has improved our understanding of the distribution, transport, and fate of plastics in four lakes of the Great Lakes system. As the largest freshwater system on the planet, these critical lakes hold 20% of the world's fresh water. Plastic pollution was documented down to the smallest size class yet reported, shedding light on the magnitude of plastics in a small size class (106–333 μm) that is missing from most existing reports (Hidalgo Ruz et al., 2012; Law, 2016). This led to load estimates of nearly 2 million particles km−2, the highest reported levels in the Great Lakes and possibly any surface water ecosystem. These high numbers can be attributed to the high nearshore population density, a feature unique to inland waterways that does not similarly influence remote ocean basins, and the long hydraulic residence time of some of the Great Lakes (3–100s of years, depending on the lake). Given this time and the recalcitrance of plastic to degradation, fragments of some of the first plastic ever produced for the consumer market are certainly present in the Great Lakes still today. This scenario is likely representative of lakes worldwide, which account for 87% of the planet's freshwater and have an average residence time of 50–100 years4—indeed spanning the introduction of plastics to the consumer market.
Data describing the abundance of plastic pollution in the Great Lakes are sparse and will continue to be. Field-based quantification surveys are time-consuming, expensive, and low-throughput. As a result, there is insufficient spatial and temporal resolution of plastic debris in the Great Lakes and other aquatic ecosystems. In addition, detailed data on plastic loads (e.g., from rivers and WWTPs) are needed to determine the plastic budget and to inform future models. Integrating the modeling approach developed here will guide targeted research surveys, experiments, and technological innovation for improved understanding of the ecosystem and public health risks plastic pollution pose to freshwater systems. These are the steps needed to develop a global plastic mass balance transport model to effectively inform the policy, mitigation, and prevention initiatives needed to protect our vital freshwater resources.
Research was conducted in the absence of any commercial or financial relationships that could be construed as a potential conflict of interest.
Author Contributions
MD, DB, and KW: conceived the study. MD, RC, and BL: performed field sampling, sample processing, and plastic count data collection and analyzed data. DB and RB: developed and ran the transport model and analyzed data. MD, RC, DB, and KW: wrote the manuscript.
Funding
This work was supported by the University of Michigan Water Center, a center of the Graham Sustainability Institute. The Water Center is supported by funds from the Fred A. and Barbara M. Erb Family Foundation and the University of Michigan. Additional funding for DB and RB was provided by NOAA GLERL. Funding was awarded to Cooperative Institute for Limnology and Ecosystems Research (CILER) through the NOAA Cooperative Agreement with the University of Michigan (NA12OAR4320071). Additional funding was provided by the NSF grant 1039043.
Conflict of Interest Statement
The authors declare that the research was conducted in the absence of any commercial or financial relationships that could be construed as a potential conflict of interest.
Acknowledgments
We wish to acknowledge David Brooks for providing and operating the research vessel, Nancy K, for funding its operation, and for providing additional engineering and logistical support during the 2014 campaign. We thank Steve Ruberg (NOAA GLERL) and the captain and crew of R5501 for sampling in the Detroit River and the Cleveland area. Gregory Boehm, Sarah Halpern, Kat Wiles, Kaitie Benedeck, Scott Koenigbauer, Naomi Huntley, Shibhum Sidhar, Payton Watt, Andrew Wong, Emma Borjigin-Wang, Marlies Michielssen, and Elien Michielssen assisted in the massive effort of sample collection in the field and processing in the lab. Larissa Sano, Allen Burton, Jeanne Hankett, Zhan Chen, and Lorena Rios Mendoza supported project thematic development. We thank Will Bender for technical assistance with SEM-EDS. This is CIGLR 1113 and NOAA GLERL contribution 1858.
Supplementary Material
The Supplementary Material for this article can be found online at: https://www.frontiersin.org/article/10.3389/fenvs.2017.00045/full#supplementary-material
Footnotes
1. ^http://data.glos.us/glcfs/
2. ^https://github.com/DuhaimeLab/Frontiers_2017_GreatLakesPlasticDistrib
3. ^http://www-personal.umich.edu/~duhaimem/Rpubs_code/GreatLakes_Plastic_Pollution_Study_Cable_etal_2017.html
References
Baldwin, A. K., Corsi, S. R., and Mason, S. A. (2016). Plastic debris in 29 great lakes tributaries: relations to watershed attributes and hydrology. Environ. Sci. Technol. 50, 10377–10385. doi: 10.1021/acs.est.6b02917
Ballent, A., Corcoran, P. L., Madden, O., Helm, P. A., and Longstaffe, F. J. (2016). Sources and sinks of microplastics in Canadian Lake Ontario nearshore, tributary and beach sediments. Mar. Pollut. Bull. 110, 383–395. doi: 10.1016/j.marpolbul.2016.06.037
Barnes, D. K., Galgani, F., Thompson, R. C., and Barlaz, M. (2009). Accumulation and fragmentation of plastic debris in global environments. Philos. Trans. R. Soc. Lond. B. Biol. Sci. 364, 1985–1998. doi: 10.1098/rstb.2008.0205
Beletsky, D., Beletsky, R., Rutherford, E. S., Sieracki, J. L., Bossenbroek, J. M., Chadderton, W. L., et al. (2017). Predicting spread of aquatic invasive species by lake currents. J. Great Lakes Res. 43, 14–32. doi: 10.1016/j.jglr.2017.02.001
Beletsky, D., Hawley, N., and Rao, Y. R. (2013). Modeling summer circulation and thermal structure of Lake Erie. J. Geophys. Res. Oceans 118, 6238–6252. doi: 10.1002/2013JC008854
Beletsky, D., Hawley, N., Rao, Y. R., Vanderploeg, H. A., Beletsky, R., Schwab, D. J., et al. (2012). Summer thermal structure and anticyclonic circulation of Lake Erie. Geophys. Res. Lett. 39:L06605. doi: 10.1029/2012GL051002
Bennett, J. R., and Clites, A. H. (1987). Accuracy of trajectory calculation in a finite-difference circulation model. J. Comput. Phys. 68, 272–282. doi: 10.1016/0021-9991(87)90058-1
Besseling, E., Wegner, A., Foekema, E. M., Van Den Heuvel-Greve, M. J., and Koelmans, A. A. (2012). Effects of microplastic on fitness and PCB bioaccumulation by the lugworm Arenicola marina (L.). Environ. Sci. Technol. 47, 593–600. doi: 10.1021/es302763x
Blumberg, A. F., and Mellor, G. L. (1987). “A description of a three-dimensional coastal ocean circulation model,” in Three-Dimensional Coastal Ocean Models, ed N. S. Heaps (Washington, DC: American Geophysical Union; Wiley Online Library), 1–16. doi: 10.1029/CO004p0001
Boerger, C. M., Lattin, G. L., Moore, S. L., and Moore, C. J. (2010). Plastic ingestion by planktivorous fishes in the North Pacific central gyre. Mar. Pollut. Bull. 60, 2275–2278. doi: 10.1016/j.marpolbul.2010.08.007
Bolsenga, S. J., and Herdendorf, C. E. (1993). Lake Erie and Lake St. Clair Handbook. Detroit, MI: Wayne State University Press.
Browne, M. A., Crump, P., Niven, S. J., Teuten, E., Tonkin, A., Galloway, T., et al. (2011). Accumulation of microplastic on shorelines woldwide: sources and sinks. Environ. Sci. Technol. 45, 9175–9179. doi: 10.1021/es201811s
Carpenter, E. J., and Smith, K. L. (1972). Plastics on the Sargasso sea surface. Science 175, 1240–1241. doi: 10.1126/science.175.4027.1240
Castañeda, R. A., Avlijas, S., Simard, M. A., and Ricciardi, A. (2014). Microplastic pollution in st. Lawrence river sediments. Can. J. Fish. Aquat. Sci. 71, 1767–1771. doi: 10.1139/cjfas-2014-0281
Claessens, M., De Meester, S., Van Landuyt, L., De Clerck, K., and Janssen, C. R. (2011). Occurrence and distribution of microplastics in marine sediments along the Belgian coast. Mar. Pollut. Bull. 62, 2199–2204. doi: 10.1016/j.marpolbul.2011.06.030
Colton, J. B., Knapp, F. D., and Burns, B. R. (1974). Plastic particles in surface waters of the northwestern Atlantic. Science 185, 491–497. doi: 10.1126/science.185.4150.491
Corcoran, P. L., Norris, T., Ceccanese, T., Walzak, M. J., Helm, P. A., and Marvin, C. H. (2015). Hidden plastics of Lake Ontario, Canada and their potential preservation in the sediment record. Environ. Pollut. 204, 17–25. doi: 10.1016/j.envpol.2015.04.009
Cózar, A., Echevarría, F., González-Gordillo, J. I., Irigoien, X., Ubeda, B., Hernández-León, S., et al. (2014). Plastic debris in the open ocean. Proc. Natl. Acad. Sci. U.S.A. 111, 10239–10244. doi: 10.1073/pnas.1314705111
Day, R. H., and Shaw, D. G. (1987). Patterns in the abundance of pelagic plastic and tar in the North Pacific ocean, 1976–1985. Mar. Pollut. Bull. 18, 311–316. doi: 10.1016/S0025-326X(87)80017-6
Dekiff, J. H., Remy, D., Klasmeier, J., and Fries, E. (2014). Occurrence and spatial distribution of microplastics in sediments from Norderney. Environ. Pollut. 186, 248–256. doi: 10.1016/j.envpol.2013.11.019
Driedger, A. G., Dürr, H. H., Mitchell, K., and Van Cappellen, P. (2015). Plastic debris in the Laurentian great lakes: a review. J. Great Lakes Res. 41, 9–19. doi: 10.1016/j.jglr.2014.12.020
Dris, R., Imhof, H., Sanchez, W., Gasperi, J., Galgani, F., Tassin, B., et al. (2015). Beyond the ocean: contamination of freshwater ecosystems with (micro-) plastic particles. Environ. Chem. 12, 539–550. doi: 10.1071/EN14172
Eerkes-Medrano, D., Thompson, R. C., and Aldridge, D. C. (2015). Microplastics in freshwater systems: a review of the emerging threats, identification of knowledge gaps and prioritisation of research needs. Water Res. 75, 63–82. doi: 10.1016/j.watres.2015.02.012
Eriksen, M., Lebreton, L. C., Carson, H. S., Thiel, M., Moore, C. J., Borerro, J. C., et al. (2014). Plastic pollution in the world's oceans: more than 5 trillion plastic pieces weighing over 250,000 tons afloat at sea. PLoS ONE 9:e111913. doi: 10.1371/journal.pone.0111913
Eriksen, M., Mason, S., Wilson, S., Box, C., Zellers, A., Edwards, W., et al. (2013). Microplastic pollution in the surface waters of the laurentian great lakes. Mar. Pollut. Bull. 77, 177–182. doi: 10.1016/j.marpolbul.2013.10.007
Filella, M. (2015). Questions of size and numbers in environmental research on microplastics: methodological and conceptual aspects. Environ. Chem. 12, 527–538. doi: 10.1071/EN15012
Fischer, V., Elsner, N. O., Brenke, N., Schwabe, E., and Brandt, A. (2015). Plastic pollution of the Kuril–Kamchatka trench area (NW pacific). Deep Sea Res. II Top. Stud. Oceanogr. 111, 399–405. doi: 10.1016/j.dsr2.2014.08.012
Foekema, E. M., De Gruijter, C., Mergia, M. T., van Franeker, J. A., Murk, A. J., and Koelmans, A. A. (2013). Plastic in North Sea fish. Environ. Sci. Technol. 47, 8818–8824. doi: 10.1021/es400931b
Fraker, M. E., Anderson, E. J., May, C. J., Chen, K.-Y., Davis, J. J., DeVanna, K. M., et al. (2015). Stock-specific advection of larval walleye (Sander vitreus) in western Lake Erie: implications for larval growth, mixing, and stock discrimination. J. Great Lakes Res. 41, 830–845. doi: 10.1016/j.jglr.2015.04.008
Free, C. M., Jensen, O. P., Mason, S. A., Eriksen, M., Williamson, N. J., and Boldgiv, B. (2014). High-levels of microplastic pollution in a large, remote, mountain lake. Mar. Pollut. Bull. 85, 156–163. doi: 10.1016/j.marpolbul.2014.06.001
Frère, L., Paul-Pont, I., Rinnert, E., Petton, S., Jaffré, J., Bihannic, I., et al. (2017). Influence of environmental and anthropogenic factors on the composition, concentration and spatial distribution of microplastics: a case study of the Bay of Brest (Brittany, France). Environ. Pollut. 225, 211–222. doi: 10.1016/j.envpol.2017.03.023
GESAMP: IMO/FAO/UNESCO-IOC/UNIDO/WMO/IAEA/UN/UNEP Joint Group of Experts on the Scientific Aspects of Marine Environmental Protection (2010). “GESAMP reports and studies,” in Proceedings of the GESAMP International Workshop on Microplastic Particles as a Vector in Transporting Persistent, bio-Accumulating and Toxic Sub-Stances in the Ocean, Vol. 82 (Paris), 1–68.
Goldstein, M. C., Titmus, A. J., and Ford, M. (2013). Scales of spatial heterogeneity of plastic marine debris in the northeast Pacific Ocean. PLoS ONE 8:e80020. doi: 10.1371/journal.pone.0080020
Hankett, J. M., Collin, W. R., Yang, P., Chen, Z., and Duhaime, M. B. (2016). Low-volatility model demonstrates humidity affects environmental toxin deposition on plastics at a molecular level. Environ. Sci. Technol. 50, 1304–1305. doi: 10.1021/acs.est.5b05598
Hidalgo Ruz, V., Gutow, L., Thompson, R. C., and Thiel, M. (2012). Microplastics in the marine environment: a review of the methods used for identification and quantification. Environ. Sci. Technol. 46, 3060–3075. doi: 10.1021/es2031505
Hoellein, T., Rojas, M., Pink, A., Gasior, J., and Kelly, J. (2014). Anthropogenic litter in urban freshwater ecosystems: distribution and microbial interactions. PLoS ONE 9:e98485. doi: 10.1371/journal.pone.0098485
Hoffman, M., and Hittinger, E. (2017). Inventory and transport of plastic debris in the Laurentian Great Lakes. Mar. Pollut. Bull. 115, 273–281. doi: 10.1016/j.marpolbul.2016.11.061
Imhof, H. K., Laforsch, C., Wiesheu, A. C., Schmid, J., Anger, P. M., Niessner, R., et al. (2016). Pigments and plastic in limnetic ecosystems: a qualitative and quantitative study on microparticles of different size classes. Water Res. 98, 64–74. doi: 10.1016/j.watres.2016.03.015
IPCC (2012). Managing the Risks of Extreme Events and Disasters to Advance Climate Change Adaptation. A Special Report of Working Groups I and II of the Intergovernmental Panel on Climate Change, Edited by C. B. Field, V. Barros, T. F. Stocker, D. Qin, D. J. Dokken, K. L. Ebi, M. D. Mastrandrea, K. J. Mach, G.-K. Plattner, S. K. Allen, M. Tignor, and P. M. Midgley. Cambridge University Press.
Jambeck, J. R., Geyer, R., Wilcox, C., Siegler, T. R., Perryman, M., Andrady, A., et al. (2015). Marine pollution. Plastic waste inputs from land into the ocean. Science 347, 768–771. doi: 10.1126/science.1260352
Kang, J. H., Kwon, O. Y., Lee, K. W., Song, Y. K., and Shim, W. J. (2015). Marine neustonic microplastics around the southeastern coast of Korea. Mar. Pollut. Bull. 96, 304–312. doi: 10.1016/j.marpolbul.2015.04.054
Khatmullina, L., and Isachenko, I. (2016). Settling velocity of microplastic particles of regular shapes. Mar. Poll. Bull. 114, 871–880. doi: 10.1016/j.marpolbul.2016.11.024
Koelmans, A. A., Bakir, A., Burton, G. A., and Janssen, C. R. (2016). Microplastic as a vector for chemicals in the aquatic environment: critical review and model-supported reinterpretation of empirical studies. Environ. Sci. Technol. 50, 3315–3326. doi: 10.1021/acs.est.5b06069
Kowalski, N., Reichardt, A. M., and Waniek, J. J. (2016). Sinking rates of microplastics and potential implications of their alteration by physical, biological, and chemical factors. Mar. Pollut. Bull. 109, 310–319. doi: 10.1016/j.marpolbul.2016.05.064
Law, K. L. (2016). Plastics in the marine environment. Ann. Rev. Mar. Sci. 9, 205–229. doi: 10.1146/annurev-marine-010816-060409
Law, K. L., More t-Ferguson, S. E., Goodwin, D. S., Zettler, E. R., DeForce, E., Kukulka, T., et al. (2014). Distribution of surface plastic debris in the Eastern pacific ocean from an 11-year data set. Environ. Sci. Technol. 48, 4732–4738. doi: 10.1021/es4053076
Law, K. L., Morét-Ferguson, S., Maximenko, N. A., Proskurowski, G., Peacock, E. E., Hafner, J., et al. (2010). Plastic accumulation in the North Atlantic subtropical gyre. Science 329, 1185–1188. doi: 10.1126/science.1192321
Lechner, A., Keckeis, H., Lumesberger-Loisl, F., Zens, B., Krusch, R., Tritthart, M., et al. (2014). The Danube so colourful: a potpourri of plastic litter outnumbers fish larvae in Europe's second largest river. Environ. Pollut. 188, 177–181. doi: 10.1016/j.envpol.2014.02.006
Li, J., Qu, X., Su, L., Zhang, W., Yang, D., Kolandhasamy, P., et al. (2016). Microplastics in mussels along the coastal waters of China. Environ. Pollut. 214, 177–184. doi: 10.1016/j.envpol.2016.04.012
Lima, A. R., Costa, M. F., and Barletta, M. (2014). Distribution patterns of microplastics within the plankton of a tropical estuary. Environ. Res. 132, 146–155. doi: 10.1016/j.envres.2014.03.031
Löder, M. G., and Gerdts, G. (2015). “Methodology used for the detection and identification of microplastics-A critical appraisal,” in Marine Anthropogenic Litter, eds M. Bergmann, L. Gutow, and M. Klages (Cham; Heidelberg; New York, NY; Dordrecht; London: Springer), 201–227. doi: 10.1007/978-3-319-16510-3_8
Lorenz, C. (2014). Detection of Microplastics in Marine Sediments of the German Coast via FT-IR Spectroscopy. Master's thesis, University of Rostock, Rostock.
Lynch, D. R., Greenberg, D. A., Bilgili, A., McGillicuddy, D. J. Jr., Manning, J. P., and Aretxabaleta, A. L. (2014). Particles in the Coastal Ocean: Theory and Applications. New York, NY: Cambridge University Press.
Mani, T., Hauk, A., Walter, U., and Burkhardt-Holm, P. (2015). Microplastics profile along the Rhine River. Sci. Rep. 5:17988. doi: 10.1038/srep17988
Mason, S. A., Kammin, L., Eriksen, M., Aleid, G., Wilson, S., Box, C., et al. (2016). Pelagic plastic pollution within the surface waters of Lake Michigan, USA. J. Great Lakes Res. 42, 753–759. doi: 10.1016/j.jglr.2016.05.009
Masura, J., Baker, J. E., Foster, G., Arthur, C., and Herring, C. (2015). Laboratory Methods for the Analysis of Microplastics in the Marine Environment: Recommendations for Quantifying Synthetic Particles in Waters and Sediments. NOAA Technical Memorandum NOS-OR and R-48, 1–31.
McCormick, A., Hoellein, T. J., Mason, S. A., Schluep, J., and Kelly, J. J. (2014). Microplastic is an abundant and distinct microbial habitat in an urban river. Environ. Sci. Technol. 48, 11863–11871. doi: 10.1021/es503610r
Michalak, A. M., Anderson, E. J., Beletsky, D., Boland, S., Bosch, N. S., Bridgeman, T. B., et al. (2013). Record-setting algal bloom in Lake Erie caused by agricultural and meteorological trends consistent with expected future conditions. Proc. Natl. Acad. Sci. U.S.A. 110, 6448–6452. doi: 10.1073/pnas.1216006110
Michielssen, M., Michielssen, E., Ni, J., and Duhaime, M. (2016). Fate of microplastics and other small anthropogenic litter (SAL) in wastewater treatment plants depends on unit processes employed. Environ. Sci Water Res. Technol. 2, 1064–1073. doi: 10.1039/C6EW00207B
Moore, C. J., Moore, S. L., Leecaster, M. K., and Weisberg, S. B. (2001). A comparison of plastic and plankton in the North Pacific central gyre. Mar. Pollut. Bull. 42, 1297–1300. doi: 10.1016/S0025-326X(01)00114-X
Naidoo, T., Glassom, D., and Smit, A. J. (2015). Plastic pollution in five urban estuaries of KwaZulu-Natal, South Africa. Mar. Pollut. Bull. 101, 473–480. doi: 10.1016/j.marpolbul.2015.09.044
Neves, D., Sobral, P., Ferreira, J. L., and Pereira, T. (2015). Ingestion of microplastics by commercial fish off the Portuguese coast. Mar. Pollut. Bull. 101, 119–126. doi: 10.1016/j.marpolbul.2015.11.008
Nizzetto, L., Bussi, G., Futter, M. N., Butterfield, D., and Whitehead, P. G. (2016). A theoretical assessment of microplastic transport in river catchments and their retention by soils and river sediments. Environ. Sci. Process Impacts 18, 1050–1059. doi: 10.1039/C6EM00206D
O'Connor, I. A., Golsteijn, L., and Hendriks, A. J. (2016). Review of the partitioning of chemicals into different plastics: consequences for the risk assessment of marine plastic debris. Mar. Pollut. Bull. 113, 17–24. doi: 10.1016/j.marpolbul.2016.07.021
Pauly, J. L., Stegmeier, S. J., Allaart, H. A., Cheney, R. T., Zhang, P. J., Mayer, A. G., et al. (1998). Inhaled cellulosic and plastic fibers found in human lung tissue. Cancer Epidemiol. Biomarkers Prev. 7, 419–428.
QGIS Development Team (2016). QGIS Geographic Information system. Open source geospatial foundation project. Available online at: http://www.qgis.org/
Rochman, C. M., Browne, M. A., Underwood, A. J., van Franeker, J. A., Thompson, R. C., and Amaral-Zettler, L. A. (2016). The ecological impacts of marine debris: Unraveling the demonstrated evidence from what is perceived. Ecology 97, 302–312. doi: 10.1890/14-2070.1
Rochman, C. M., Hoh, E., Kurobe, T., and Teh, S. J. (2013). Ingested plastic transfers hazardous chemicals to fish and induces hepatic stress. Sci. Rep. 3:3263. doi: 10.1038/srep03263
Rochman, C. M., Kross, S. M., Armstrong, J. B., Bogan, M. T., Darling, E. S., Green, S. J., et al. (2015a). Scientific evidence supports a ban on microbeads. Environ. Sci. Technol. 49, 10759–10761. doi: 10.1021/acs.est.5b03909
Rochman, C. M., Tahir, A., Williams, S. L., Baxa, D. V., Lam, R., Miller, J. T., et al. (2015b). Anthropogenic debris in seafood: plastic debris and fibers from textiles in fish and bivalves sold for human consumption. Sci. Rep. 5:14340. doi: 10.1038/srep14340
Ryan, P. G., Moore, C. J., van Franeker, J. A., and Moloney, C. L. (2009). Monitoring the abundance of plastic debris in the marine environment. Philos. Trans. R. Soc. Lond. B Biol. Sci. 364, 1999–2012. doi: 10.1098/rstb.2008.0207
Schwab, D. J., Beletsky, D., DePinto, J., and Dolan, D. M. (2009). A hydrodynamic approach to modeling phosphorus distribution in Lake Erie. J. Great Lakes Res. 35, 50–60. doi: 10.1016/j.jglr.2008.09.003
Smagorinsky, J. (1963). General circulation experiments with the primitive equations: I. The basic experiment. Mon. Weather Rev. 91, 99–164. doi: 10.1175/1520-0493(1963)091<0099:GCEWTP>2.3.CO;2
Song, Y. K., Hong, S. H., Jang, M., Han, G. M., Rani, M., Lee, J., et al. (2015). A comparison of microscopic and spectroscopic identification methods for analysis of microplastics in environmental samples. Mar. Pollut. Bull. 93, 202–209. doi: 10.1016/j.marpolbul.2015.01.015
Syberg, K., Khan, F. R., Selck, H., Palmqvist, A., Banta, G. T., Daley, J., et al. (2015). Microplastics: addressing ecological risk through lessons learned. Environ. Toxicol. Chem. 34, 945–953. doi: 10.1002/etc.2914
Team, R. C. (2014). R: A Language and Environment for Statistical Computing. Vienna: R Foundation for Statistical Computing. Available online at: http://www.R-project.org/
Teuten, E. L., Saquing, J. M., Knappe, D. R., Barlaz, M. A., Jonsson, S., Björn, A., et al. (2009). Transport and release of chemicals from plastics to the environment and to wildlife. Philos. Trans. R. Soc. Lond. B Biol. Sci. 364, 2027–2045. doi: 10.1098/rstb.2008.0284
Thompson, R. C., Olsen, Y., Mitchell, R. P., Davis, A., Rowland, S. J., John, A. W. G., et al. (2004). Lost at sea: where is all the plastic? Science 304, 838–838. doi: 10.1126/science.1094559
UNEP (2016). Marine Plastic Debris and Microplastics – Global Lessons and Research to Inspire action and Guide Policy Change. Nairobi: United Nations Environment Programme.
Van Cauwenberghe, L., Devriese, L., Galgani, F., Robbens, J., and Janssen, C. R. (2015). Microplastics in sediments: a review of techniques, occurrence and effects. Mar. Environ. Res. 111, 5–17. doi: 10.1016/j.marenvres.2015.06.007
Van Cauwenberghe, L., and Janssen, C. R. (2014). Microplastics in bivalves cultured for human consumption. Environ. Pollut. 193, 65–70. doi: 10.1016/j.envpol.2014.06.010
Vandermeersch, G., Van Cauwenberghe, L., Janssen, C. R., Marques, A., Granby, K., Fait, G., et al. (2015). A critical view on microplastic quantification in aquatic organisms. Environ. Res. 143, 46–55. doi: 10.1016/j.envres.2015.07.016
van Sebille, E., Wilcox, C., Lebreton, L., Maximenko, N., Hardesty, B. D., van Franeker, J. A., et al. (2015). A global inventory of small floating plastic debris. Environ. Res. Lett. 10:124006. doi: 10.1088/1748-9326/10/12/124006
Wagner, M., Scherer, C., Alvarez-Mu-oz, D., Brennholt, N., Bourrain, X., Buchinger, S., et al. (2014). Microplastics in freshwater ecosystems: what we know and what we need to know. Environ. Sci. Eur. 26, 1–9. doi: 10.1186/s12302-014-0012-7
Wang, W., Wairimu Ndungu, A., Li, Z., and Wang, J. (2017). Microplastics pollution in inland freshwaters of China: a case study in urban surface waters of Wuhan, China. Sci. Tot. Environ. 1369–1374. doi: 10.1016/j.scitotenv.2016.09.213
Wong, C. S., Green, D. R., and Cretney, W. J. (1974). Quantitative tar and plastic waste distributions in the Pacific Ocean. Nature 247, 30–32. doi: 10.1038/247030a0
Woodall, L. C., Gwinnett, C., Packer, M., Thompson, R. C., Robinson, L. F., and Paterson, G. L. (2015). Using a forensic science approach to minimize environmental contamination and to identify microfibres in marine sediments. Mar. Pollut. Bull. 95, 40–46. doi: 10.1016/j.marpolbul.2015.04.044
Woodall, L. C., Sanchez-Vidal, A., Canals, M., Paterson, G. L., Coppock, R., Sleight, V., et al. (2014). The deep sea is a major sink for microplastic debris. R. Soc. Open Sci. 1:140317. doi: 10.1098/rsos.140317
Wright, S. L., Thompson, R. C., and Galloway, T. S. (2013). The physical impacts of microplastics on marine organisms: a review. Environ. Pollut. 178, 483–492. doi: 10.1016/j.envpol.2013.02.031
Yonkos, L. T., Friedel, E. A., Perez-Reyes, A. C., Ghosal, S., and Arthur, C. D. (2014). Microplastics in four estuarine rivers in the Chesapeake Bay, U.S.A. Environ. Sci. Technol. 48, 14195–14202. doi: 10.1021/es5036317
Zbyszewski, M., and Corcoran, P. L. (2011). Distribution and degradation of fresh water plastic particles along the beaches of Lake Huron, Canada. Water Air Soil Pollut. 220, 365–372. doi: 10.1007/s11270-011-0760-6
Zbyszewski, M., Corcoran, P. L., and Hockin, A. (2014). Comparison of the distribution and degradation of plastic debris along shorelines of the Great Lakes, North America. J. Great Lakes Res. 40, 288–299. doi: 10.1016/j.jglr.2014.02.012
Zhang, K., Xiong, X., Hu, H., Wu, C., Bi, Y., Wu, Y., et al. (2017). Occurrence and characteristics of microplastic pollution in Xiangxi bay of three Gorges Reservoir, China. Environ. Sci. Technol. 51, 3794–3801. doi: 10.1021/acs.est.7b00369
Keywords: plastic debris, Great Lakes, freshwater pollution, transport model
Citation: Cable RN, Beletsky D, Beletsky R, Wigginton K, Locke BW and Duhaime MB (2017) Distribution and Modeled Transport of Plastic Pollution in the Great Lakes, the World's Largest Freshwater Resource. Front. Environ. Sci. 5:45. doi: 10.3389/fenvs.2017.00045
Received: 05 December 2016; Accepted: 03 July 2017;
Published: 19 July 2017.
Edited by:
Julia Reisser, The Ocean Cleanup, NetherlandsReviewed by:
Mario Barletta, Federal University of Pernambuco, BrazilFrancisco José A. Cysneiros, Federal University of Pernambuco, Brazil
Dick Vethaak, Deltares, Netherlands
Copyright © 2017 Cable, Beletsky, Beletsky, Wigginton, Locke and Duhaime. This is an open-access article distributed under the terms of the Creative Commons Attribution License (CC BY). The use, distribution or reproduction in other forums is permitted, provided the original author(s) or licensor are credited and that the original publication in this journal is cited, in accordance with accepted academic practice. No use, distribution or reproduction is permitted which does not comply with these terms.
*Correspondence: Melissa B. Duhaime, duhaimem@umich.edu