On the influence of multidirectional irregular waves on the PeWEC device
 Giulia Cervelli
 Beatrice Battisti
 Giuliana Mattiazzo
- Marine Offshore Renewable Energy Lab (MOREnergy Lab), Department of Mechanical and Aerospace Engineering (DIMEAS), Politecnico di Torino, Turin, Italy
Wave energy is a promising renewable resource for its reliability and power density, and many technological milestones have been achieved. Significant efforts are made to design and optimize Wave Energy Converters (WECs); however, analyses are often limited to simplified conditions. Among such restrictive assumptions, waves are frequently described utilizing monodirectional spectra, thus leading to approximate evaluations, also in terms of absorbed power. In real sea conditions, the waves are multidirectional, and the analysis as a 2D superposition of multiple wave components should be investigated. In particular, linear waves can be analyzed as a sum of sine waves characterized by different amplitudes, frequencies, phases and directions. The case study device analyzed in this paper is PeWEC (Pendulum Wave Energy Converter), a rotating mass device that converts energy based on pitch motion, moored through a spread catenary mooring system. The sea states investigated are those of the island of Cyprus. The spectrum is defined as the combination between the JONSWAP frequency spectrum and the cos-2s directional spectrum. To compute the sea elevation components the Deterministic Amplitude Scheme (DAS) method is used. The forcing acting on the device, the mooring loads and the device motions are examined and compared to quantify the error produced by the monodirectional approximations. The time domain solver OrcaFlex is employed to investigate the interaction of the waves with the moored hull. Compared with the multidirectional analysis, the monodirectional approximation generates an overestimation of the pitch by 5% and of the surge by 3%, highlighting the importance of taking spreading into account if the device is directional.
1 Introduction
Nowadays, the world is taking on several complex challenges, such as population growth and climate change. The challenges concern both the socio-economic and environmental spheres and are described in the United Nations 2030 Agenda (United Nations, 2015). The energy transition is one of the key tools to achieve Sustainable Development Goals, coping with the growing demand for electricity, minimizing the environmental impact and ensuring the security of energy supply (Kaygusuz, 2012). In this complex scene, wave energy can play a fundamental role, thanks to its predictability, persistence and spatial concentration, which make it advantageous with respect to wind and solar energies (Bozzi et al., 2013). Nevertheless, wave energy is still immature compared to the other, more established, renewable sources and, despite its enormous potential, the current world installed capacity is negligible, and most of it is in the pre-commercial phase.
Wave energy converters (WECs) are devices that use the wave dynamics to produce electric power. The energy extraction methods are disparate, as well as their design and installation (Drew et al., 2009). A first classification can be done considering the depth and distance from the coast of the installation site. Shoreline devices are positioned on harbour or fixed structures near the coast, while nearshore devices are installed in areas where the bathymetry is in the 10 − 25 m range. The offshore devices are installed on sites with a depth greater than 40 m and away from the shore. From energetic, social and environmental points of view, offshore devices represent the best category at the expense of a harsher marine environment, especially external loads. WECs can also be subdivided by their size and working direction according to the dominant direction of the wave, in attenuators, point absorbers, and terminators. During operation, attenuators are aligned with the dominant wave direction whereas WECs with small dimensions relative to the wavelength are called point absorbers; their properties make them particularly suitable for the implementation of wave farms. An example of point absorber is Carnegie’s fully submerged CETO buoy (Mann, 2011). Lastly, terminators are WECs that produce energy when oriented perpendicular to the direction of the wave propagation. Examples for this category are Wave Dragon (Kofoed et al., 2000), Oyster (Koley and Trivedi, 2020) and PeWEC (Pendulum Wave Energy Converter) (Pozzi et al., 2018). Both terminators and attenuators are also called directional WECs because they produce maximum energy if the wave direction impacts them perpendicularly and parallel, respectively. Conversely, point absorbers generate energy regardless of the direction of the incoming waves.
The device selected for the present study is the PeWEC, a terminator explicitly designed for the offshore conditions of the Mediterranean Sea. In closed seas, the waves generally have a lower wave height and a shorter period than in the ocean, but the extractable wave energy is still relevant (Bastianoni et al., 2020). Being a directional device, PeWEC must be designed considering the different directions of wave incidence and directional spreading. In particular, each wave is characterized by a mean direction, which corresponds to the wavefront incoming direction. However, the mean direction is only one of the parameters that describe the waves. Directional spreading is an additional parameter that quantifies how much the energy of a single wave is distributed over a multitude of different directions, with the average direction as the dominant direction.
In this study, a multidirectional analysis is proposed to highlight the different responses of PeWEC with respect to real sea conditions. Since a monodirectional spectrum gives a limited description of the real sea state, a multidirectional wave analysis is necessary to correctly evaluate the sea conditions. The introduction of directionality, and in particular of the distribution of the wave energy over different directions, is essential since a swell and a wind wave can be described by equal values of significant wave height, energy period and mean direction, but they may differ in detail, thus affecting the wave and force fields around the WEC. Some studies have already been carried out considering the interaction between WECs and waves characterized by directional spreading (Gilloteaux et al., 2007). highlights the effect of a multidirectional spectrum on the SEAREV (Système Electrique Autonome de Récupération de l’Energie des Vagues) device, and assesses its negative impact on the capture width of the uncontrolled WEC by 3% with respect to a monodirectional sea (Sun et al., 2014). compares the relative pitch motions of the Pelamis attenuator in monodirectional and multidirectional waves, and points out that a reduction of up to 27% for low spreading values can be reached. Although these studies provide significant results, they consider only a few sea states and a few directional spreading values. In addition, investigations concerning the multidirectional waves effect on the forcings acting on the hull and mooring are not provided. Concerning the numerical methods, there are examples of a multidirectional analysis using CFD models (Wang et al., 2019), (Zou and Abdelkhalik, 2021), but for the present study, the potential theory method is preferred to a high-fidelity model for computational cost reasons: the sea conditions studied are within the linear range and the sea state dataset analyzed is wide. The time series of the free surface, the forces acting on the hull, the hull motions, and also the forcing acting on the mooring are obtained for monodirectional and multidirectional sea states. This study uses a spread catenary mooring system (Niosi et al., 2021): it is a passive system with the only purpose of station keeping and the device efficiency is minimally influenced (Martinelli et al., 2012).
The paper is organized as follows: in Section 2 the cases study of the site and the device are presented; Section 3 illustrates the methodology employed in the numerical simulations. The different analyses are specified in Section 4. Finally, Section 5 discusses the results and concludes the paper.
2 Case study
2.1 The site
Significant wave height, period, direction and directional spreading are the minimum characteristics needed to design WECs. Structural safety analysis and energy production calculations are based on these statistical parameters.
In this article, the wave climate of the Mediterranean Sea is initially investigated to identify a specific suitable case study for the analysis. To this end, the wave information are acquired by ERA5 (Hersbach et al., 2020) database of ECMWF (European Center for Medium-Range Weather Forecasts). ERA5 products combines model data with observations from around the world, offering hourly time series that spans diverse environmental data; those concerning the wave are provided with a spatial resolution of 0.5° × 0.5°. Since the aim of the paper is to quantify and compare the results produced between monodirectional and multidirectional analyses, the coarse-scale used is considered adequate.
The parameter used to evaluate the energy dispersion over the directions is the wave directional width parameter s, also called directional spreading. (Forristall and Ewans, 1998). proposes several procedures for calculating this parameter. Low values of directional spreading indicate a marked distribution of the energy over the directions, while higher values are related to conditions tending towards monodirectionality. In particular, the minimum values of directional spreading is usually equal to five and corresponds to swell waves; the maximum value, generally characterized by a spreading parameter equal to 75, describes fully developed sea states corresponding to wind waves (Goda, 2010). Figure 1 represents the mean values of the directional spreading in the Mediterranean Sea: the average value occurring is about 37, which is an intermediate case between swell and wind waves. The result is in accordance with forecasts since the Mediterranean Sea is a closed basin where the waves do not develop completely. The calculation was based on the hourly time series of the directional spreading with respect to the 2017–2021 period.

FIGURE 1. Average directional spreading in the Mediterranean Sea in the period from 2017 to 2021.
To identify the specific case study, the variability of the directional spreading for the entire Mediterranean Sea is investigated, evaluating the standard deviation of the directional spreading (Figure 2).
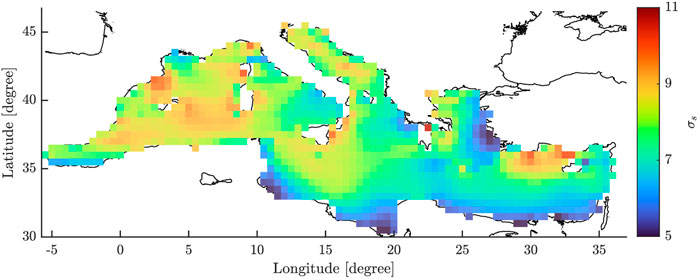
FIGURE 2. Standard deviation of directional spreading in the Mediterranean Sea in the period from 2017 to 2021.
The most significant variability is obtained along the North-West coasts of the basin and the Southern Turkish coast. Among these various suitable areas, the North-West coasts of Cyprus island is the best choice, characterized by a marked variability of directional spreading. Once the analysis site is chosen, a longer time series is acquired to analyze the sea states occurring on the island of Cyprus. Hence, the significant wave height, energy period and directional spreading are obtained from the ERA5 database with reference to the period from 2012 to 2021. Using a 10-years time series, it is possible to conduct a robust analysis based on long-term statistics (Holthuijsen, 2007).
2.2 The device
The wave energy converter chosen for this study is PeWEC (Pozzi et al., 2017, 2018): a rotating mass device, characterized by a floating hull, moored to the seabed and containing a pendulum connected to the shaft of an electrical generator (Figure 3). PeWEC is a directional device, and this characteristic makes it particularly suitable for highlighting the impact of spreading on the main motion related to power generation, in this case, pitch. The energy conversion from the sea waves to electrical energy is achieved because of the relative rotation of the pendulum (Pozzi et al., 2017, 2018). The damping of the pendulum oscillations around the rotational axis allows energy extraction from the system and is controlled by a Power Take-Off (PTO).
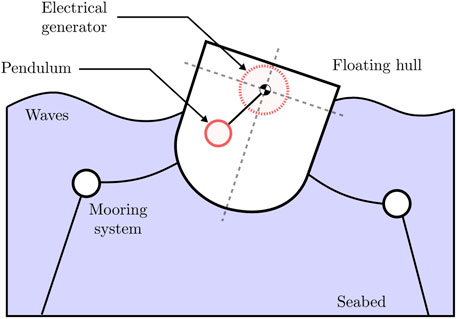
FIGURE 3. Schematic outline of the PeWEC device.
PeWEC hull is designed as a sealed steel structure with a curved keel, two side walls and a flat top. Three internal sand ballasts (on the keel, stern and bow) ensure distribution of the masses necessary to guarantee the required inertial properties. The frame of reference of the body and the definition of the degrees of freedom are displayed in Figure 4.

FIGURE 4. Definition of the frame of reference and the degrees of freedom of PeWEC.
The main characteristics of PeWEC are summarized in Table 1, as well as the mooring characteristics.
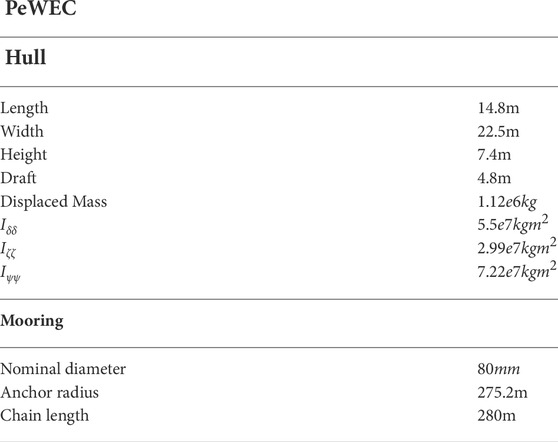
TABLE 1. PeWEC’s hull and mooring main characteristics.
The mooring system is necessary for station-keeping and is designed to withstand the environmental loads and to have a limited influence on the WEC movement. Moreover, the anchored hull can orient with the incident wave direction. The pendulum, instead, is made up of a cylindrical steel oscillating mass and a shaft connected to the PTO system, and it affects the device performance. The coupling between the pendulum oscillation speed and the nominal speed of the PTO drives the response of PeWEC and influences its dynamics, as described in (Gioia et al., 2022), (Carapellese et al., 2022) for monodirectional seas. For an accurate investigation, the control system should be designed for multidirectional seas. However, in this study, the control system is neglected as a first approximation, and the analysis is concentrated on the effect of directional spreading on the WEC’s external dynamics. The proposed methodology, indeed, describes the techniques used to define and describe the sea states of interest and the procedure to evaluate the different device responses in terms of motions and forces acting on the hull and mooring. The device performance is not investigated, but it will be the object of future works.
3 Methodology
3.1 Sea states calculation
This paper evaluates PeWEC dynamics based on monodirectional sea states and with various directional spreading. Although real waves are indisputably directional, monodirectional waves are traditionally modelled and used in literature due to their simplicity of application. In this study, the error produced by an excessively simplistic representation of the sea states is quantified and analyzed.
Firstly, the irregular sea conditions are described with both monodirectional and multidirectional spectra. Subsequently, the free surface elevation representation is described, and the numerical model used is introduced. In particular, the device motions are investigated in response to the waves characteristics at Cyprus island: the sea states of interest are defined considering the triplets constituted by the significant wave height Hs, the energy period Te and the directional spreading s, according to their occurrences. Then, the multidirectional spectra are defined as the combination between the JONSWAP frequency spectrum (Hasselmann et al., 1973) and the cos − 2s directional spectrum (Krogstad and Barstow, 1999). The Deterministic Amplitude Scheme (DAS) method is used to compute the directional sea elevation components (Mérigaud and Ringwood, 2017) and the interaction of the waves with the moored hull is investigated with OrcaFlex, a validated software for the static and dynamic analysis of floating structures (Johanning and Smith, 2008; Massana Hugas et al., 2014; Harnois et al., 2015; Paduano et al., 2020).
3.1.1 Multi—directional wave spectra
The spectral technique is the basis of the concept of energy density spectrum, which provides a complete statistical description of the waves. Indeed, all the wave parameters can be expressed in terms of the spectrum. The two-dimensional frequency-direction spectrum, S (ω, θ), shows how the energy is distributed over the angular frequency ω and directions θ and can be computed as a product between a frequency spectrum S(ω) with a directional spectrum D (ω; θ), according to the following equation:
A descriptive representation of a multidirectional spectrum is provided in Figure 5.
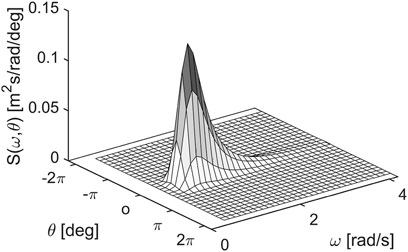
FIGURE 5. Two-dimensional frequency-direction spectrum S (ω, θ).
The directional distribution is a normalized spectrum such that its integral over the directions is equal to unity; thus, it provides a weight to the directions in percentage. It can be formulated according to one of the idealized representations, considering the dependence or independence from wave frequency. Since the independence option is sufficiently accurate and widely used in practice, it is used in this analysis. Among the different idealized directional distributions (Goda, 1999), the most common is cos − 2s (Holthuijsen, 2007) and is employed here in the form:
where s represents the power parameter which controls the directional spreading, θm(ω) corresponds to the mean direction according to each angular frequency ω and N(s) is a normalization factor allowing the integral to be equal to unity, defined as:
Different frequency spectra are proposed to describe irregular waves in the open sea. Considering the Cyprus island case study, the JONSWAP (Hasselmann et al., 1973) spectrum is considered the best option since it describes a not-fully-developed sea. Indeed, it is often used to study the growing waves and it is suitable to describe Mediterranean conditions because of its fetch-limited conditions: the width of the fetch is not enough to produce a fully developed sea (Kovacs, 1993). JONSWAP formulation can be obtained as a Pierson-Moskowitz one multiplied by an extra peak enhancement factor γ:
with
where the parameter σ is the spectral width over the frequency, γ is the non-dimensional parameter describing the peak shape, Aγ is a normalizing factor, and ωp corresponds to the angular spectral peak frequency.
Finally, SPM(ω) correspond to the Pierson-Moskowitz spectrum:
Since the significant wave height and the peak period are required to compute the JONSWAP spectrum, Tp is computed from the energy period according to the empirical relation suggested by the International Towing Tank Conference (ITTC) (The Specialist Committee on Stationary Floating Systems, 2002), as:
3.1.2 Irregular wave surface
Although real waves are not strictly sinusoidal, the elevation of the free surface may be well approximated as a superposition of periodic wave components, characterized by different amplitudes, phases, angular frequencies, and directions (Ochi, 2005). Therefore, considering the wave elevation at a given point (x, y), the time history of the free surface can be described by a simple sinusoidal function:
where a is the wave amplitude, and k the wave number, defined as
Specifically, each frequency must correspond to one of the discrete directions, which must be randomly assigned the same number of times. Indeed, to guarantee a correct energy distribution over the different directions, everyone of them should be repeated equitably. In particular, assuming Nω as the number of frequency discretization and Nθ as the number of directional discretization, the number of times with which each direction is used is equal to Nω/Nθ. Therefore, it has to be ensured that the ratio between Nω and Nθ is an integer value; in this case, it is taken equal to 200.
Figure 6 represents the discretization of the directional spectrum D(θ) with respect to the directions θ. The number of Nθ used in this paper is 31 and, as can be observed, the Δθ is smaller in the more energetic areas since a higher resolution is needed.
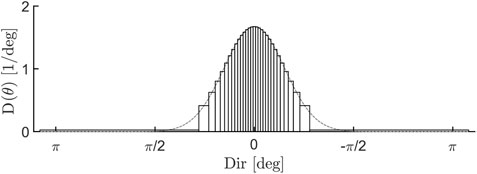
FIGURE 6. Discretised directional distribution according to the equal energy method.
Finally, the elevation of the sea surface at a given point (x, y) and at a given instant t, can be described simply as the superposition of the Nω wave components. According to the described method, the summation is done only on frequencies:
where am is the amplitude of the wave component, km is the wave number and x, y, and t describing the specific location and time. Eq. 10 shows that the sea surface elevation η depends on the frequency discretization, so the number of components must be large enough for a correct representation.
To calculate the value of the sea elevation, at a given time t and at a given point (x, y), it is necessary to determine the values of amplitude am and phase φm. In the present report, the DAS method is used to compute the random phases and deterministic amplitudes derived from the target wave spectrum. According to this method, the phase is uniformly distributed in [0, 2π[, and it is obtained as a random value. The amplitude is calculated as:
where Δω is the density spectrum frequency resolution. Finally, to statistically represent the interaction between the waves and the device, the simulation time must be sufficiently long (Ricci, 2016). Alternatively, several shorter simulations can be carried out, and the final result can be calculated as the average value of the different realizations.
3.2 Numerical model
A range of different numerical models are available for the simulation of a WEC dynamics: CFD, potential flow theory, time-domain or frequency-domain models, among others. The choice of the most suitable method comes from a trade-off between degree of accuracy and computational cost, according to the objective of the study. In this case, the presence of the mooring system introduces non-linearities in the problem, which, therefore, cannot be solved with a simple frequency-domain model. A time-domain method allows, instead, the direct numerical integration of the system and provides time histories of the analyzed degrees of freedom. However, as mentioned in Section 3.1, waves are random processes and, for a correct representation of the statistical properties of a sea state, several realizations must be simulated. CFD is discarded as a possible numerical model, as the computational cost would be too high. Furthermore, the linear potential theory is sufficient to provide reliable results for the slope of small waves and small body movements. Indeed, CFD models are the most suitable tool for extreme wave loads when strong non-linearities are present, while, in this study, the dynamics of PeWEC under normal operating conditions are analyzed. Therefore, the OrcaFlex marine dynamics software, developed by Orcina Ltd. and implementing potential theory, is selected for the numerical simulations. OrcaFlex is used extensively for modeling WECs, and its validation is confirmed by multiple comparisons between experimental results and numerical simulations (Johanning and Smith, 2008; Massana Hugas et al., 2014; Harnois et al., 2015; Paduano et al., 2020).
The linear time-domain equations of motion read as:
with
4 Analyses
4.1 Occurrences and energetic sea states
The hourly time series of significant wave height Hs, energy period Te and directional spreading s, from 2012 to 2021, are used to identify the sea states occurrences at Cyprus island: the values of these triplets are fundamental to define the waves characteristics to simulate. Once the parameters values are defined, they are used as input in the spectra calculation and then the sea surface elevations are evaluated. Compared with the usual monodirectional approach, this study considers directional spreading and allows quantification of the error generally obtained with a simplified analysis. To assess the characteristics of the energy resource at Cyprus, occurrences and energy scatters are produced (Figure 7).
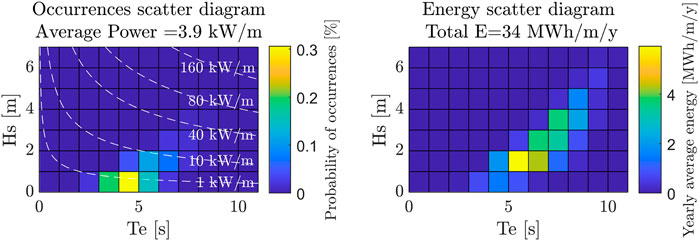
FIGURE 7. Occurrences and energy scatter diagrams concerning Cyprus island.
The scatters are bivariate diagrams, generated by grouping different cells significant wave heights and energy periods. The significant wave height is grouped via 1 m bins, 0.5–6.5 m, while the bins for the energy period measure 0.5–10.5 s, with a bin size of 1s. In the case of occurences scatter, each cell corresponds to the percentage of frequency with which the Hs − Te pair occurs. For the multidirectional analysis, the spreading values are discretized with a bin equal to 5.
The sea states characterized by a significant wave height around 0.5 m and energy period between 4 and 5 s are the most frequently occurring. The energy scatter is obtained by multiplying the scatter of occurrences by the average power per meter of a wavefront. Considering the occurrences and the waves power, the sea state that provides the greatest amount of energy in the year is characterized by Hs = 1.5 m and Te = 5.5 s: the preliminary analysis and investigation concerning the temporal evolution of the forces and motions of the device are carried out considering those values. Detailed analyses regarding pitch, heave, and surge motions, on the other hand, are conducted considering all Hs − Te pairs of the scatters.
4.2 Preliminary analysis
As previously mentioned, for the correct simulation of a wave spectrum, many realizations should be run to accurately reflect the statistical properties of the sea state. A preliminary analysis is necessary to find a trade-off between the number of simulations and their duration, in the perspective of reducing the computational cost as much as possible. In this context, 100 different realizations of the same monodirectional JONSWAP spectrum, characterized by Hs = 1.5 m and Te = 5.5 s, are simulated, for Tsim = 900 s, Tsim = 1800 s and Tsim = 3600 s. The simulation time directly controls the frequency discretization, by means of the relation
4.3 Device dynamics analysis
4.3.1 Time series comparison
A comparison of the time series of the six degrees of freedom of the device, of the mooring forces and of the forces acting on the hull is carried out to quantify the influence of the spreading and identify the approximations induced by monodirectional studies. Each time series has the duration of Tsim = 1800 s, obtained, as in Section 4.2, as the simulation time suitable for obtaining representative realizations. However, the figures representing the results refer to the first 150 s of simulation, in order to clearly show the differences between the monodirectional and multidirectional case. In this way, the comparison of the time series shows how the two signals evolve in time, starting from the same condition. For a detailed study of the device response under multidirectional conditions, a 4-D scatter of the occurrences is used instead of the usual 3-D scatter, adding directional spreading. Therefore, the directional spreading parameter is added to the triplet consisting of significant wave height, energy period, and occurrence. Using this configuration, 165 sea states are simulated, which correspond to the number of sea states that occurred according to the discretizations used.
For convenience, only one time series comparison representation of the monodirectional and multidirectional cases is represented: in particular, the most energetic sea state, characterized by the pair Hs = 1.5 m and Te = 5.5 s, is chosen. For the multidirectional analysis, reference is made to the average directional spread equal to s = 32.5, obtained as the average value referred to the Hs − Te analysis pair. The time evolution of multidirectional sea height is obtained as a superposition of many wave components (Eq. 10) characterized by different amplitude, phase, frequency and direction values. In the monodirectional case, however, all components are assigned the same direction, perpendicular to the device’s hull.
Superimposing the monodirectional and multidirectional time series of the sea surface elevation, the variation in terms of phases is evident (Figure 8): although the trends overlap in the first temporal instants, the elevation of sea level of the multidirectional case slows down the motion speed. This behavior can be explained by the fact that the wave components with a direction different from the one normal to the device, have to cover a longer path than the others. Viceversa, in the monodirectional case, all components travel in the same direction, and so they cover the same distance. This result is possible only because the random phases assigned to each component coincide in the monodirectional and multidirectional cases. In particular, the combination of amplitude, phases and frequencies is assumed to be the same; the only difference is the use of the same direction in the monodirectional case and the assignment of different directions in the multidirectional case.
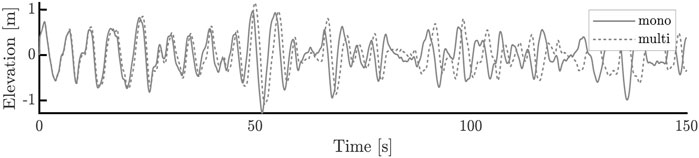
FIGURE 8. Comparison between monodirectional and multidirectional sea wave elevation.
The evidence of phase shift on frequencies plays an essential role in optimal control since the maximization of energy extraction depends on the PTO, which must be in phase with the excitation. This result highlights how monodirectional analysis would produce a design error. Moreover, the observed behavior has a clear impact on both the forces acting on the device (Figure 9), the induced device motions (Figure 10), and the forces acting on the mooring centre of gravity (Figure 11). Indeed, the forces and displacements are closely related to the characteristics of the marine elevation impacting the hull.
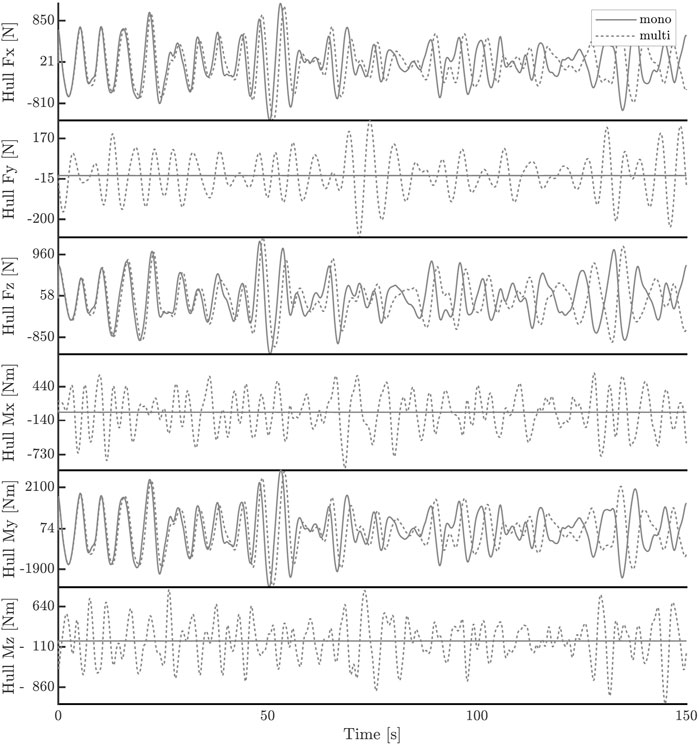
FIGURE 9. Comparison of forces acting on the hull caused by monodirectional and multidirectional sea states.
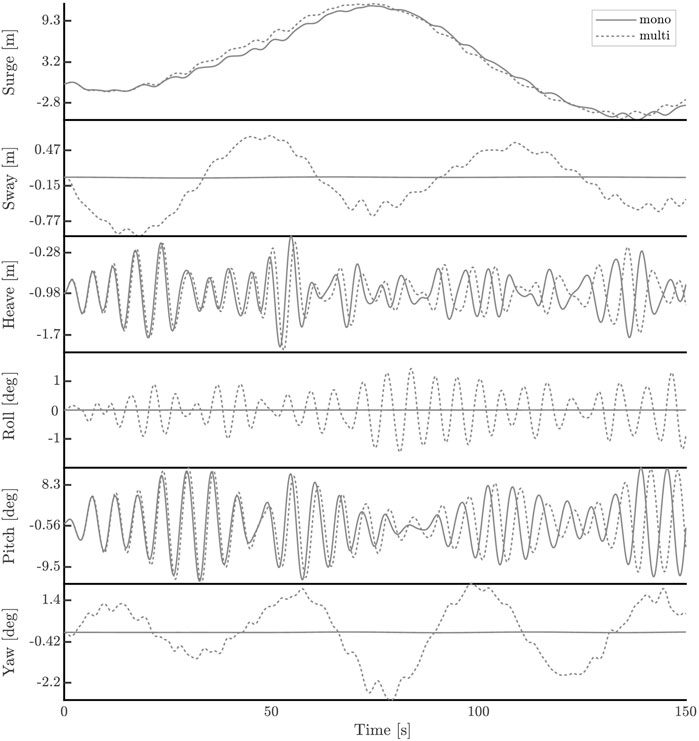
FIGURE 10. Comparison of hull motions caused by monodirectional and multidirectional sea states.
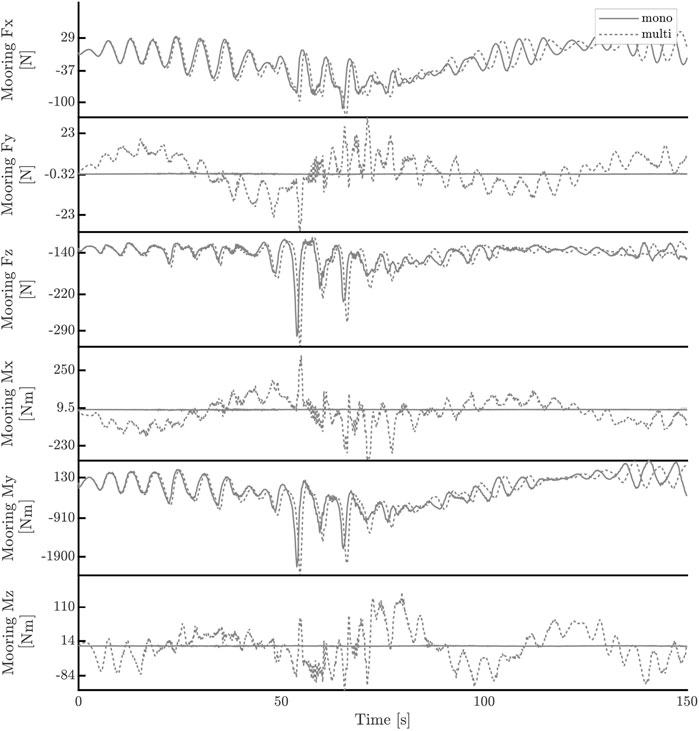
FIGURE 11. Comparison of forces acting on the hull mooring caused by monodirectional and multidirectional sea states.
Regarding the comparison of the excitation forces on the hull (Figure 9), relevant conclusions can be drawn: the force Fy, in the multidirectional case, is not zero and should be considered. In fact, the force acting along the y-axis is about one-fifth of the forces acting along the x-axis and the z-axis. As a consequence, Fy is not negligible, and the monodirectional analysis would have led to this error. As for the moments, the same conclusion applies, since Mx and Mz are about a third of the moment My. Furthermore, since the forces on the hull cause the device to move and, consequently, mooring forces to develop, similar behaviors are expected in the other comparisons.
Regarding the motions (Figure 10), a slight decrease in amplitude for surge, heave, and the pitch is found but generally negligible. A critical element concerns the phase variation between the monodirectional and multidirectional cases. As the time series progresses, the motions induced in the multidirectional case occur with a progressively increasing phase shift in time, similar to the marine elevation comparison. Roll and yaw are not negligible compared to pitch, despite being almost one order of magnitude smaller. These rotations are small but not negligible and thus affect the system’s mooring forces and the 6-DoF dynamics. In fact, the force Fy, and the moments Mx and Mz, which act on the mooring centre of gravity, are not negligible and must be considered in the development and design of the mooring layout.
4.3.2 Device motions investigation
The device dynamics are analyzed for the entire range of occurring sea states: for each sea state, in addition to the multidirectional spectrum, the corresponding monodirectional one is also simulated. This analysis is carried out to compare the different PeWEC responses in terms of pitch, heave and surge.
Results demonstrate which types of errors are associated with monodirectional analyses. In order to numerically quantify the error produced, the following values are calculated:
where RMSδ, RMSx and RMSz are the root mean square of the pitch, surge and heave, respectively: these values are computed considering both monodirectional and multidirectional analysis.
with
where the probability of occurrence Occ (sl) of l − th value of directional spreading s, is obtained as the ratio of the number of times the Hs − Te − s triplet occurred, that is
Figure 12 refers to the probability distribution of the directional spreading of the most energetic sea state. As an illustration, Figure 13 shows the RMS variation of pitch, surge and heave between the monodirectional and multidirectional cases characterized by Hs = 1.5 m and Te = 5.5 s, according to different values of directional spreading s. In addition, the relative error is reported for each directional spreading value.
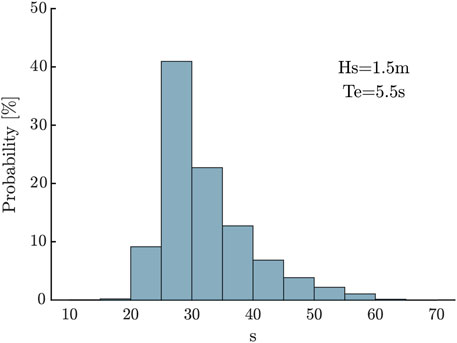
FIGURE 12. Probability of occurrence of directional spreading, for the sea state Hs = 1.5 m and Te = 5.5 s.
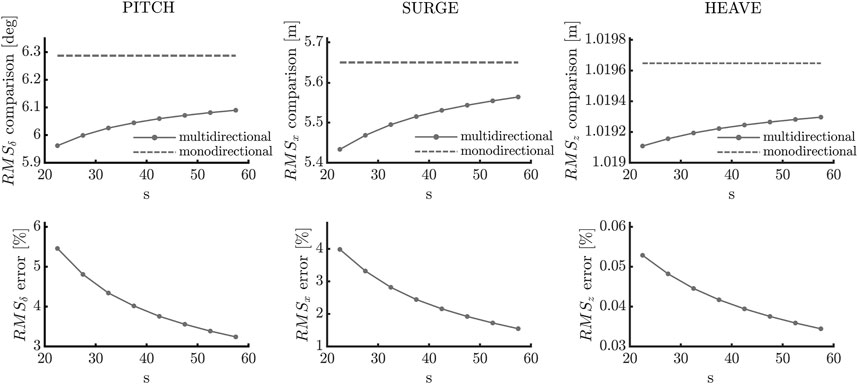
FIGURE 13. Comparison and error of RMS of the pitch, surge and heave, for the sea state Hs = 1.5 m and Te = 5.5 s.
Finally, to obtain a cumulative estimate of the relative error, these values are weighted against the specific energy values Ei,j:
Figure 14 shows the relative error concerning the investigated motions. The most consistent error is related to the pitch motion: the energy-weighted RMS of this motion is overestimated by 5% in the monodirectional case. For the surge, the error is about 3%, while in the heave case, the error is negligible. Since the energy produced by PeWEC is directly related to the pitch motion, less energy conversion is expected in analogy with the analyzed motions. These results provide only an indicative estimate concerning the overestimation of the monodirectional case. However, they can be used to evaluate the level of approximation obtained from time to time.
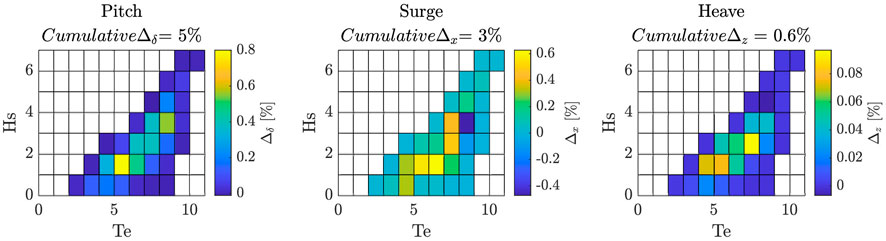
FIGURE 14. Cumulative relative error according to RMS of pitch, surge and heave motions.
5 Discussion and conclusion
Wave energy is a promising renewable energy source and could have a major impact on decarbonizing, especially in littoral areas and coastal communities. To support the development of WECs, numerical simulations are mandatory and should represent real sea conditions as much as possible. Nevertheless, for simplicity reasons, waves are often study as monodirectional by neglecting their directional spreading, which, however, is always present. This generalization is useful to reduce the difficulty and cost of the numerical simulations, but it is important to evaluate its impact on the results. In this study, a comparison of the dynamics of a moored Wave Energy Converter is performed in the case of monodirectional and multidirectional seas. In particular, the device analyzed is the PeWEC, a pitch terminator with a preferred direction for energy conversion and specifically designed for closed seas like the Mediterranean Bacin. The specific site for the case study is the island of Cyprus, selected due to its variability in the directional spreading.
The results shown in Section 4 highlight the types of errors obtained with a monodirectional approximation. They can be quantified to assess whether they are admissible or not, depending on the development phase of the device. In particular, the device analyzed in this paper bases the energy production on pitch: this motion can be studied by employing the monodirectional analysis, obtaining slightly more optimistic results. In fact, the results show that a multidirectional sea affects the dynamics of the WEC and induces a smaller pitching motion than the same monodirectional sea. Quantitatively, for a device such as PeWEC, when mooring is taken into account and the control system is neglected, directionality affects the dynamic response by up to 5% for the pitching motion, 3% for the surging motion, and less than 1% the heaving motion, the other three motions affecting negligibly this type of WEC. The pitch degree of freedom is the predominant motion of a device such as PeWEC, and its reduction is intuitively related to the fact that the wave energy is spread on a larger spectrum and not concentrated on one direction, and this is unfavorable for a directional device.
Comparing such results with a similar device, such as the SEAREV (Gilloteaux et al., 2007), one notices that the influence of the directional spectrum is evident, but the behavior of the WEC changes by only a few percentage. For the case of the Pelamis device (Sun et al., 2014), multidirectionality highly influences the relative pitch motion, but such result is difficult to compare to the PeWEC device of this study, because the shape and functioning principle are quite different. However, in both (Gilloteaux et al., 2007) and (Sun et al., 2014), the highest difference occurs for very low values of spreading (s = 5), whereas in this study, the variation is already visible for intermediate values of the spreading factor, that are also the most often occurring values at the chosen site. These numerical results show that the multidirectional spectrum must be considered if the energy conversion of a WEC is investigated. Mainly, they show that the closer the sea state is to the monodirectional case, the more the directional devices work at design condition. A similar result is obtained from the analyses performed in this paper, as shown in Figure 13. As the value of directional spreading increases, the energy is distributed in fewer directions, and the error related to pitch and surge decreases between monodirectional and multidirectional analysis. As for heave, the variation is always negligible, and this evidence shows that this motion is not conditioned by directional spreading.
Those first results are important to highlight the importance of taking into consideration the multidirectional character of a real sea site, because the influence on the force Fy and moments Mx and Mz cannot be neglected for PeWEC hull and mooring design, as well as in a device power analysis. In the case of a power evaluation, the influence of multidirectionality on PeWEC performance is expected to be slightly different from the results of this study. As mentioned above, the pitch is directly related to the power delivered by the device and, therefore, its behaviour is influenced and modified by the PTO system. However, although it is not possible to quantitatively estimate the power output difference between the monodirectional and multidirectional analysis, a performance reduction in the multidirectional case is expected. The control law must be included in the model and calibrated to the sea state for a complete and thorough study.
Moreover, the influence of wave directionality depends on the chosen device: for a point absorber, based on the heave degree of freedom, a monodirectional wave is perceived approximately the same way as a multidirectional one. This assumption is supported by the results of this study, in which heave motion remains essentially unchanged in the comparison. For this type of device, an analysis of the scattering impact would still be significant in the case of WEC arrays since the disturbing wavefield changes markedly with different wave directions. Such an investigation, however, essential for directional devices such as the one presented in this study.
Data availability statement
The raw data supporting the conclusion of this article will be made available by the authors, upon reasonable request.
Author contributions
Conceptualisation, GC, BB, and GM; methodology, GC and BB; software, GC and BB; validation, GC and BB; formal analysis, GC and BB; investigation, GC and BB; resources, GC, BB, and GM; data curation, GC and BB; writing—original draft preparation, GC and BB; visualisation, GC; supervision, GM; project administration, GM; funding acquisition, GM. All authors have read and agreed to the published version of the manuscript.
Conflict of interest
The authors declare that the research was conducted in the absence of any commercial or financial relationships that could be construed as a potential conflict of interest.
Publisher’s note
All claims expressed in this article are solely those of the authors and do not necessarily represent those of their affiliated organizations, or those of the publisher, the editors and the reviewers. Any product that may be evaluated in this article, or claim that may be made by its manufacturer, is not guaranteed or endorsed by the publisher.
References
Bastianoni, S., Praticò, C., Damasiotis, M., and Pulselli, R. M. (2020). Editorial: Perspectives for marine energy in the mediterranean area. Front. Energy Res. 8. doi:10.3389/fenrg.2020.00209
Bozzi, S., Miquel, A. M., Antonini, A., Passoni, G., and Archetti, R. (2013). Modeling of a point absorber for energy conversion in italian seas. Energies 6, 3033–3051. doi:10.3390/en6063033
Carapellese, F., Pasta, E., Paduano, B., Faedo, N., and Mattiazzo, G. (2022). Intuitive lti energy-maximising control for multi-degree of freedom wave energy converters: The pewec case. Ocean. Eng. 256, 111444. doi:10.1016/j.oceaneng.2022.111444
Drew, B., Plummer, A. R., and Sahinkaya, M. N. (2009). A review of wave energy converter technology. Proc. Institution Mech. Eng. Part A J. Power Energy 223, 887–902. doi:10.1243/09576509JPE782
Duarte, T., Gueydon, S., Jonkman, J., and Sarmento, A. (2014). “Computation of wave loads under multidirectional sea states for floating offshore wind turbines,” in International conference on offshore mechanics and arctic engineering (American Society of Mechanical Engineers (ASME)), 45547, V09BT09A023.
Forristall, G. Z., and Ewans, K. C. (1998). Worldwide measurements of directional wave spreading. J. Atmos. Ocean. Technol. 15, 440–469. doi:10.1175/1520-0426(1998)015<0440:wmodws>2.0.co;2
Gilloteaux, J.-C., Babarit, A., and Clément, A. (2007). Influence of wave spectrum spreading on the production of the searev wave energy converter. Seventeenth Int. Offshore Polar Eng. Conf. 168, 415–420.
Gioia, D. G., Pasta, E., Brandimarte, P., and Mattiazzo, G. (2022). Data-driven control of a pendulum wave energy converter: A gaussian process regression approach. Ocean. Eng. 253, 111191. doi:10.1016/j.oceaneng.2022.111191
Goda, Y. (1999). A comparative review on the functional forms of directional wave spectrum. Coast. Eng. J. 41, 1–20. doi:10.1142/s0578563499000024
Goda, Y. (2010). Random seas and design of maritime structures, 33. World Scientific Publishing Company.
Harnois, V., Weller, S., Johanning, L., Thies, P., Le Boulluec, M., Le Roux, D., et al. (2015). Numerical model validation for mooring systems: Method and application for wave energy converters. Renew. Energy 75, 869–887. doi:10.1016/j.renene.2014.10.063
Hasselmann, K., Barnett, T., Bouws, E., Carlson, H., Cartwright, D., Enke, K., et al. (1973). Measurements of wind-wave growth and swell decay during the joint North sea wave project (JONSWAP). Deut. Hydrogr. Z. 8, 1–95.
Hersbach, H., Bell, B., Berrisford, P., Hirahara, S., Horányi, A., Muñoz-Sabater, J., et al. (2020). The era5 global reanalysis. Q. J. R. Meteorol. Soc. 146, 1999–2049. doi:10.1002/qj.3803
Holthuijsen, L. H. (2007). Waves in oceanic and coastal waters. Cambridge University Press. doi:10.1017/CBO9780511618536
Johanning, L., and Smith, G. (2008). Improved measurement technologies for floating wave energy converter (wec) mooring arrangements. uw. tech:. Int. J. Soc. uw. tech. 27, 175–184. doi:10.3723/ut.27.175
Kaygusuz, K. (2012). Energy for sustainable development: A case of developing countries. Renew. Sustain. Energy Rev. 16, 1116–1126. doi:10.1016/j.rser.2011.11.013
Kofoed, J. P., Frigaard, P., Sorenson, H. C., and Friis-Madsen, E. (2000). “Development of the wave energy converter-wave dragon,” in The tenth international offshore and polar engineering conference (Cupertino, Calif: OnePetro), 405–412.
Koley, S., and Trivedi, K. (2020). “Mathematical modeling of oyster wave energy converter device,” in AIP conference proceedings (Melville, NY: AIP Publishing LLC), 2277, 130014.
Kovacs, G. (1993). “Environmental conditions and environmental testing,” in Proceedings of intelec 93: 15th international telecommunications energy conference, 2, 92–99. doi:10.1109/INTLEC.1993.388591
Krogstad, H. E., and Barstow, S. F. (1999). “Directional distributions in ocean wave spectra,” in The ninth international offshore and polar engineering conference (Golden, Colorado: OnePetro).
Mann, L. D. (2011). “Application of ocean observations & analysis: The ceto wave energy project,” in Operational oceanography in the 21st century (Springer), 721–729.
Martinelli, L., Ruol, P., and Cortellazzo, G. (2012). On mooring design of wave energy converters: The seabreath application. Int. Conf. Coast. Eng. 1, 3. doi:10.9753/icce.v33.structures.3
Massana Hugas, I., Río Fernandez, J. d., and Prat Farran, J. d. (2014). “Validation of a orcaflex obsea’s platform model,” in Instrumentation viewpoint, 49–50.
Merigaud, A. (2018). A harmonic balance framework for the numerical simulation of non-linear wave energy converter models in random seas. Maynooth (Ireland): Ph.D. thesis, National University of Ireland.
Mérigaud, A., and Ringwood, J. V. (2017). Free-surface time-series generation for wave energy applications. IEEE J. Ocean. Eng. 43, 19–35. doi:10.1109/joe.2017.2691199
Morison, J., Johnson, J., and Schaaf, S. (1950). The force exerted by surface waves on piles. J. Petroleum Technol. 2, 149–154. doi:10.2118/950149-G
Niosi, F., Parrinello, L., Paduano, B., Pasta, E., Carapellese, F., and Bracco, G. (2021). “On the influence of mooring in wave energy converters productivity: the pewec case,” in 2021 international conference on electrical, computer, communications and mechatronics engineering (ICECCME), 1–6. doi:10.1109/ICECCME52200.2021.9590867
Paduano, B., Giorgi, G., Gomes, R. P. F., Pasta, E., Henriques, J. C. C., Gato, L. M. C., et al. (2020). Experimental validation and comparison of numerical models for the mooring system of a floating wave energy converter. J. Mar. Sci. Eng. 8, 565. doi:10.3390/jmse8080565
Pozzi, N., Bracco, G., Passione, B., Sirigu, S. A., and Mattiazzo, G. (2018). Pewec: Experimental validation of wave to pto numerical model. Ocean. Eng. 167, 114–129. doi:10.1016/j.oceaneng.2018.08.028
Pozzi, N., Bracco, G., Passione, B., Sirigu, S., Vissio, G., Mattiazzo, G., et al. (2017). Wave tank testing of a pendulum wave energy converter 1:12 scale model. Int. J. Appl. Mech. 9, 1750024. doi:10.1142/S1758825117500247
Ricci, P. (2016). “Time-domain models,” in Numerical modelling of wave energy converters (Elsevier), 31–66.
Sun, L., Zang, J., Taylor, R., and Taylor, P. (2014). The 29th international workshop on water waves and floating bodies conference.Effects of wave spreading on performance of a wave energy converter
The Specialist Committee on Stationary Floating Systems (2002). “Final report and recommendations to the 23rd ittc,” in Proceedings of the 23rd ITTC (international towing Tank conference), 2, 553–738.
United Nations (2015). United Nations sustainable development website. Available at: https://www.un.org/sustainabledevelopment/(accessed: 07 25, 2022).
Wang, W., Bihs, H., Kamath, A., and Arntsen, Ø. A. (2019). “Multi-directional irregular wave modelling with cfd,” in Proceedings of the fourth international conference in ocean engineering (ICOE2018) (Springer), 521–529.
Keywords: wave energy, numerical simulations, multidirectional waves, directional spreading, wave energy converter, wave spectrum, PeWEC
Citation: Cervelli G, Battisti B and Mattiazzo G (2022) On the influence of multidirectional irregular waves on the PeWEC device. Front. Energy Res. 10:908529. doi: 10.3389/fenrg.2022.908529
Received: 30 March 2022; Accepted: 17 August 2022;
Published: 15 September 2022.
Edited by:
Greeshma Gadikota, Cornell University, United StatesReviewed by:
Shan Wang, Universidade de Lisboa, PortugalMingsheng Chen, Wuhan University of Technology, China
Adi Kurniawan, University of Western Australia, Australia
Hasan Imani, Sharif University of Technology, Iran, Mohamed Abbas Kotb, Alexandria University, Egypt
Copyright © 2022 Cervelli, Battisti and Mattiazzo. This is an open-access article distributed under the terms of the Creative Commons Attribution License (CC BY). The use, distribution or reproduction in other forums is permitted, provided the original author(s) and the copyright owner(s) are credited and that the original publication in this journal is cited, in accordance with accepted academic practice. No use, distribution or reproduction is permitted which does not comply with these terms.
*Correspondence: Beatrice Battisti, beatrice.battisti@polito.it