Synthesis of Sustainable Carbon Negative Eco-Industrial Parks
 Elizabeth J. Abraham
  Dhabia M. Al-Mohannadi
- Department of Chemical Engineering, Texas A&M University at Qatar, Doha, Qatar
Growing climate change concerns in recent years have led to an increased need for carbon dioxide emission reduction. This can be achieved by implementing the concept of circular economy, which promotes the practice of resource conservation, emission minimization, and the maintenance of sustainable revenue streams. A considerable amount of carbon dioxide emissions is a consequence of stationary sources from industrial processes. These emissions can be reduced using carbon capture utilization and storage (CCUS) or reduced at source by using emission free renewable resources. The method developed within this work uses mixed integer linear programming (MILP) to design sustainable clusters that convert seawater (including waste brine), air, and waste carbon dioxide emissions to value-added products with sunlight as the main energy source. In this way, circular economy is employed to minimize fresh resource consumption and maximize material reuse. The potential of this work is demonstrated through a case study, which shows that an industrial park may be profitable while adhering to strict emission and material constraints.
Introduction
Greenhouse gases associated with industrial processes originate from the use of emission generating resources such as fossil fuels in utilities or hydrocarbons as raw materials or by-products from chemical reactions. Emissions, specifically carbon dioxide, can be reduced through energy efficiency, captured and used to produce value-added products through carbon capture utilization and storage (CCUS) or eliminated with renewable energy (Lameh et al., 2020). Nonetheless, replacing emission generating resources with clean renewable resources can help reduce emissions at source. Renewable resources include sunlight, air and seawater. Air primarily contains nitrogen and oxygen, while seawater can be treated to fresh water and can generate a wealth of minerals such as sodium, chloride, magnesium and calcium among others. Sunlight can generate the energy required to deliver reactions and power processes. These resources in addition to the problematic carbon dioxide can be utilized to generate value-added products. Often this combination of resources have been explored at a process level through electrochemical processes, as in the review by Nguyen and Wu (2018), but not at a macro industrial park level. The work presented here demonstrates the applicability of seawater, air, and carbon dioxide conversion powered by sunlight through process integration in eco-industrial parks (EIPs).
Eco-industrial parks present a modern solution to the challenge of reducing emissions through process integration. These parks involve the operation of multiple plants or industrial units at the same time while incorporating sustainable practices (Peddle, 1993). Côté and Hall (1995) defined an eco-industrial park as an industrial system that exchanges resources to conserve them while optimizing production, costs and liabilities by improving operating efficiency, quality and providing opportunities for income generation through the use and sale of wasted resources. The principle on which eco-industrial parks operate is called industrial ecology, whereby these parks mimic natural systems through resource conservation and reuse (Valenzuela-Venegas et al., 2016) while ensuring greater economic, social and environmental benefits when operating as a whole (Boix et al., 2012). EIPs can help achieve circular economy, which is defined by Avraamidou et al. (2020) as an economic system in production, distribution and consumption processes that aims to replace the end-of-life concept with reducing, reusing, recycling and recovering the materials involved.
Methods of process systems engineering can be implemented to generate EIPs. In terms of energy, works such as Klemeš et al. (1997) presented an industrial procedure to reduce emissions and energy costs through heat management. In terms of water reuse in EIPs, Lovelady and El-Halwagi (2009) reduced wastewater through a source-sink technique. While Alnouri et al. (2018) developed a water integration approach for brine management and assessed zero liquid discharge (ZLD) options, Al-Mohannadi et al. (2016), focused on carbon dioxide conversion networks. Most of the published work focuses on single resources, typically water, heat, or carbon integration, while a few describe the exchange of more than one resource (Kastner et al., 2015). There has recently been a shift to integrate multiple resources simultaneously, which has led to the introduction of many novel optimization approaches. One proposed solution to this was a higher-level integration approach to C-H-O symbiosis (Noureldin and El-Halwagi, 2015), and this was expanded to design networks with minimized carbon dioxide emissions (Panu et al., 2019). Al-Mohannadi et al. (2020) developed a method that integrates natural gas, energy and carbon dioxide. However, the method was limited by the named materials and/or molecules. To address this Shehab et al. (2019) outlined a systematic resource integration approach that uses both material and energy to integrate an unlimited number of resources. This work was detailed in Ahmed et al. (2020) by defining a unique representation that allows both energy and material integration through a robust mixed-integer linear program (MILP). However, there is a clear lack of research in industrial symbiosis networks that integrate renewable energy, which was observed by Butturi et al. (2019). In addition, there is a need to combine emission reduction technologies with improving energy and resource use efficiency in chemical industries (Vooradi et al., 2019). Therefore, this work aims to address these gaps, utilizing the model developed by Ahmed et al. (2020) with the goal of designing a carbon neutral industrial park to produce value-added products from free or waste resources (seawater, air, sunlight, and carbon dioxide). The goal is to understand what is required to enable profitable solutions that minimize carbon dioxide emissions, motivating the hydrocarbon industry to reduce its carbon footprint.
Problem Statement
The problem addressed in this work can be stated as: when given only free or waste resource inputs, design a profitable carbon-negative industrial park while adhering to emission constraints. The inputs allowed into the park are limited to seawater, air, and sunlight (free natural resources), as well as carbon dioxide (a waste resource obtained from external emissions), which are utilized to produce value-added products. Mass and energy integration are used to ensure that the carbon dioxide leaving the industrial park does not exceed the amount entering it. The approach will identify a configuration of processes that will produce value-added products to maximize profit while adhering to emission limits. The problem statement is illustrated graphically in Figure 1.

FIGURE 1. Problem statement visual representation.
Methodology
A three-stage approach was developed in order to achieve the objective of this work. The three stages needed are candidate process identification, data collection and resource network optimization. This three-stage approach is applicable for creating new EIPs while existing facilities can be transformed into EIPs by slight variations in the different stages of the approach.
Process Selection
An EIP is comprised of various processes producing a number or products. Selecting candidate plants for consideration in designing the EIP depends on the objective that the project hopes to achieve, which in turn will decide the resources involved in the cluster. In this work, the objective is to design a profitable carbon neutral park. This means that the park should not release more carbon dioxide than it consumes. By definition, an EIP shows improved environmental and economic performance compared to a traditional industrial park through resource management. While some processes may produce carbon dioxide, these emissions may be utilized as starting materials in other processes. Had the processes been decoupled, this integration would not have been possible. Thus, identifying the processes to be included as candidate plants is critical. The criteria used to determine the best suited process are resource identification, interlinkage potential, profitability, and location. Figure 2 illustrates the criteria as a stage-gate process and clarifies how each criterion will be used to identify candidate processes for the design.
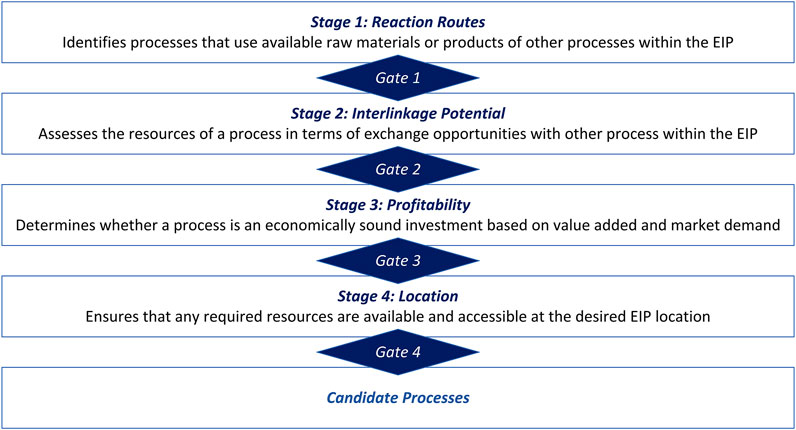
FIGURE 2. Stage-gate process for identification of candidate processes.
First, a list of processes that use or produce carbon dioxide is compiled. The first gate is the resource identification, and this gate determines the resources, products, and waste materials involved in each process to identify possible interlinkages in the second gate. The objective of the second gate is to eliminate processes that do not have any single exchangeable resources, after which other processes can be identified and considered based on their production or use of exchangeable resources involved. After various reaction routes are explored, processes are disqualified if they require raw materials that are not already available or produced. The interlinkages are analyzed to determine processes that have the potential to interact with other processes, based on which the second gate eliminates low potential processes. The third gate eliminates processes that are not profitable by assessing the value-added and market demand of the product, by exploring market sizes by value and volume. The last gate disqualifies processes that would not be practical to implement at a certain geographical location. For example, solar energy is an attractive energy generation route in the equatorial regions (since they receive lots of sunlight) while wind energy is typically not. The final set of plants shall include processes that satisfy all four of the aforementioned criteria. For transforming existing facilities into an EIP, the stage-gate process can be used to identify new plants that can create greater benefits when coupled with existing facilities.
Process Data Collection
The next step in the approach is to develop a database containing information pertaining to each process including mass and energy balances and capital costs. Most of this information can be obtained through literature reviews or through process simulation. The basis used to determine the interlinkages is the process parameters. A process parameter is defined as the quantity of a resource over the quantity of the reference product (Rf), which is the desired or most important product in a process. Process parameters enable mass and energy requirements to be quantified for a certain production capacity or vice versa (estimating the production capacity from the value of a resource). Note that the process parameter of the Rf is always taken to be 1. To transform existing facilities into an EIP, input information about existing facilities and collect data about additional facilities if any.
Resource Network Optimization
The optimization model developed by Ahmed et al. (2020) is used to establish the optimal connections and capacities of the processes that will achieve the objective of the EIP (seawater, sunlight, air inputs, carbon neutrality and profitability). The data collected in the previous stage is fed into the model, which generates a resource integration network. The model by Ahmed et al. (2020) can integrate resources including raw materials, intermediates, products, waste, emissions and energy across processes using pre-defined resource lines or “headers”. Each header has a fixed composition, temperature and pressure. Material and energy conversions are quantified through the use of input-output modules which interact with these resource lines. This allows for the exchange of resources amongst various plants. Processes interact with the resource lines through the production or consumption of the resource. Thus, it is possible to identify and explore any possible interaction within the EIP. The method is flexible as it can be applied to problems involving configurations of a number of different processes. The model is able to offer quick solutions to complex optimization problems with the objective of maximizing profitability while adhering to the specified constraints (Ahmed et al., 2020). Below is a summary of the adopted equations, which are applicable for creating new EIPs or transforming existing facilities into EIPs.
For an EIP that has
The resource feed to the cluster,
The resource flows and operational capacities are linked to each other using the respective process resource parameters,
The equations above for the resource flows can be modified to control the flow of specific components within them using their compositions in the resource along with suitable constraints.
The overall profit of the cluster is
The revenue and operating costs are defined as the product of resource flow and its respective prices, while capital costs are the product of the CAPEX parameter and the operational capacity of the respective unit. With these economic parameters of the cluster defined, the objective function of the design is presented as follows:
The equations and constraints specific to the application in this work are defined in this section. The objective function here is to maximize profits generated from a cluster whose only inputs are air, seawater, sunlight, and carbon dioxide. The restrictions imposed on the input and output flows of these input resources are as follows:
All other resources are set in a manner inverse to the above where they will not be allowed into the cluster but will only be permitted to be produced within it and leave as its product:
The main characteristic of the EIP designed in this work is its carbon negativity and restrictions on inputs resources. To ensure that more carbon dioxide is entering the cluster,
where
Case Study
The methodology developed is applied to a case study to obtain a carbon negative EIP. The only inputs allowed to the cluster are the free natural resources comprising air, seawater, and sunlight, along with carbon dioxide captured from external emission sources. The cluster is designed to be carbon negative; therefore, it must utilize more carbon dioxide than it produces. The inputs to the EIP are, therefore, firstly processed whereby air is separated into oxygen and nitrogen in an air separation process, while seawater is desalinated in a reverse osmosis unit to produce water and brine. Sunlight powers the cluster through the photovoltaic (PV) and concentrated solar power (CSP) electricity systems. The carbon dioxide feed to the cluster is assumed to be pure, as it is captured and processed to meet purity requirements. The purification cost is covered either by the external emitters or the EIP itself. Both instances analyzed in the first case of the sensitivity analysis.
Process Selection
The determination of the processes that will be considered in the EIP is discussed in this section. The first step of this process is to determine based on reaction routes the different products obtained from the processed inputs, namely, oxygen, nitrogen, water and brine, and carbon dioxide. Figure 3 outlines the possible products, where orange indicates the inputs to the cluster, while the blue, red, green, and purple represent first-, second-, third- and fourth-level products or processes.
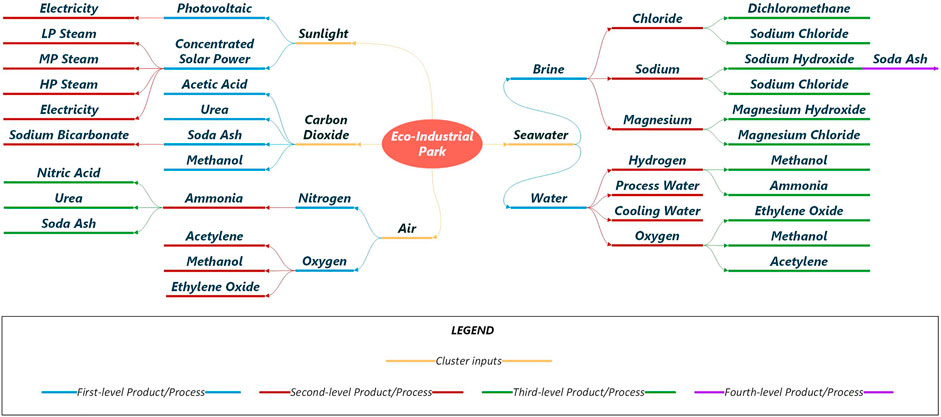
FIGURE 3. Reaction pathways for EIP inputs.
From a total of 26 processes, eight were eliminated using the stage-gate process based on the selection criteria. Table 1 highlights the decision process and causes for elimination. The market demand of the remaining processes are analyzed in Supplementary Table S1 of the Supplementary Material.
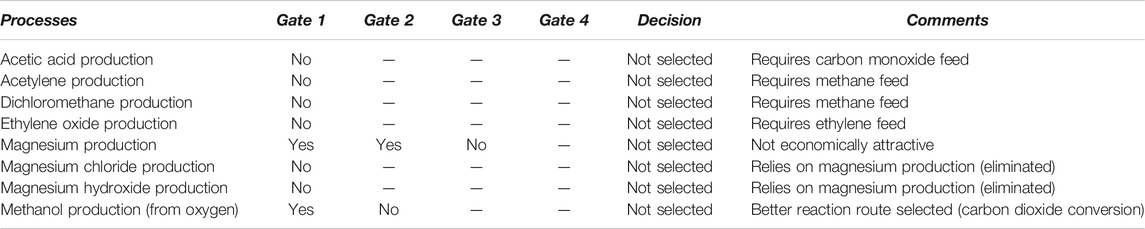
TABLE 1. Stage-gate elimination process of the potential processes.
The process selection stage was able to determine 18 processes as candidates for the carbon negative EIP to be designed. The processing units of the cluster are the air separation (AS) and reverse osmosis (RO) units. The analysis of various reaction routes that use different combinations of the processed air, seawater, sunlight, and emissions inputs, resulted in identifying ten commodity processes for the EIP. The identified options include a formalin (FM) production process from the dehydrogenation of methanol, an ammonia (AM) production process that uses nitrogen and hydrogen, a hydrogen (HY) production process through water splitting, a methanol (ME) production process from the hydrogenation of carbon dioxide. In addition, other options included a nitric acid (NA) production process via the Ostwald process, a soda ash (SA) production process via the Solvay process, a sodium bicarbonate (SB) production process that utilizes soda ash and carbon dioxide. Furthermore, the case analyzed considers sodium chloride (SC) production process based on electrodialysis and crystallization of seawater brine, a sodium hydroxide (SH) production process from the electrolysis of seawater brine, and a urea (UR) production process that utilizes ammonia and carbon dioxide.
Two supplementary processes, namely, a sequestration process (SQ) that will compress carbon dioxide and inject it into geological formations, and absorption-based carbon capture units for the methanol, sodium bicarbonate, and urea production process which emit carbon dioxide are also considered for the EIP. The sequestration will prevent carbon dioxide from being released into the atmosphere through geological storage. On the other hand, the capture units will utilize the captured carbon dioxide within the EIP instead of being released into the atmosphere.
The required utilities and their respective production processes include steam conversion (STM), cooling water, and process water units, in addition to the PV and CSP units. The steam conversion process converts the high pressure (HP) steam from the CSP unit to medium pressure (MP) and low pressure (LP) steam using turbines. Cooling water is produced by cooling towers that cool seawater, while process water is produced from seawater that undergoes desalination via reverse osmosis.
The superstructure for all the candidate processes are represented in Figure 4. The processes are shown at the top and bottom, while horizontal resource lines represent the resources involved in the processes. A resource line incorporates all the connections made by different processes for a said specific resource. The connections can be in the form of a process’s inputs, output, by-products, wastes, or emissions. Therefore, the dots on the vertical lines extending from a process indicate the resources involved in Figure 4. The emissions and capture units for the processes are not included in this figure for the sake of simplicity.
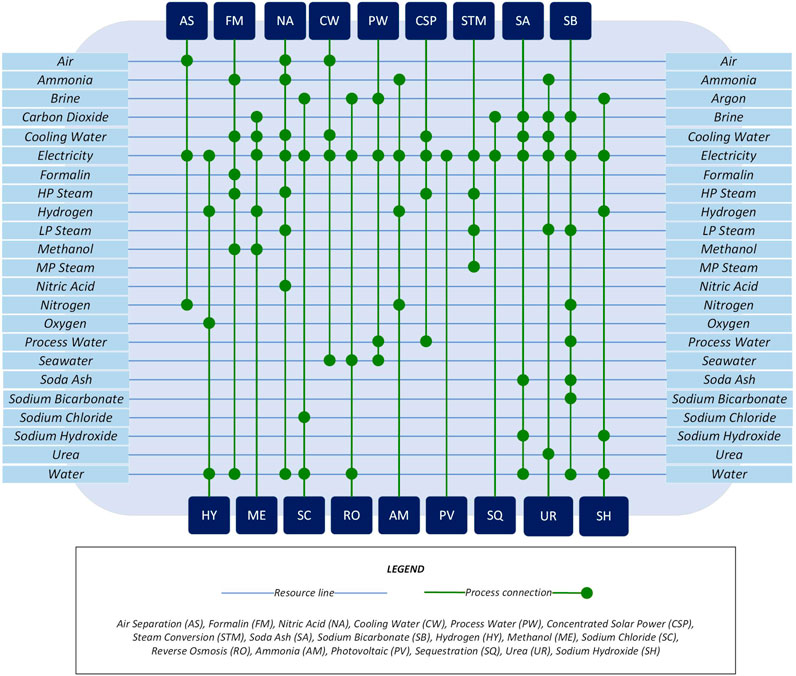
FIGURE 4. Superstructure of the candidate processes selected.
Process Data Collection
The following sections provide the data collected for each candidate process and includes resource parameters, operational capacities, capital investments, and resource prices.
Resource Parameters
The reference products for each of the processing units, commodity processes, and utility processes are summarized in Table 2, while the resource parameters and line conditions can be found in Tables 3–5, respectively.
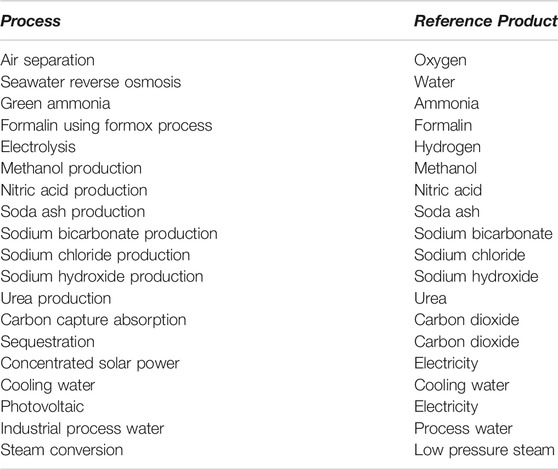
TABLE 2. Reference products of the candidate processes.
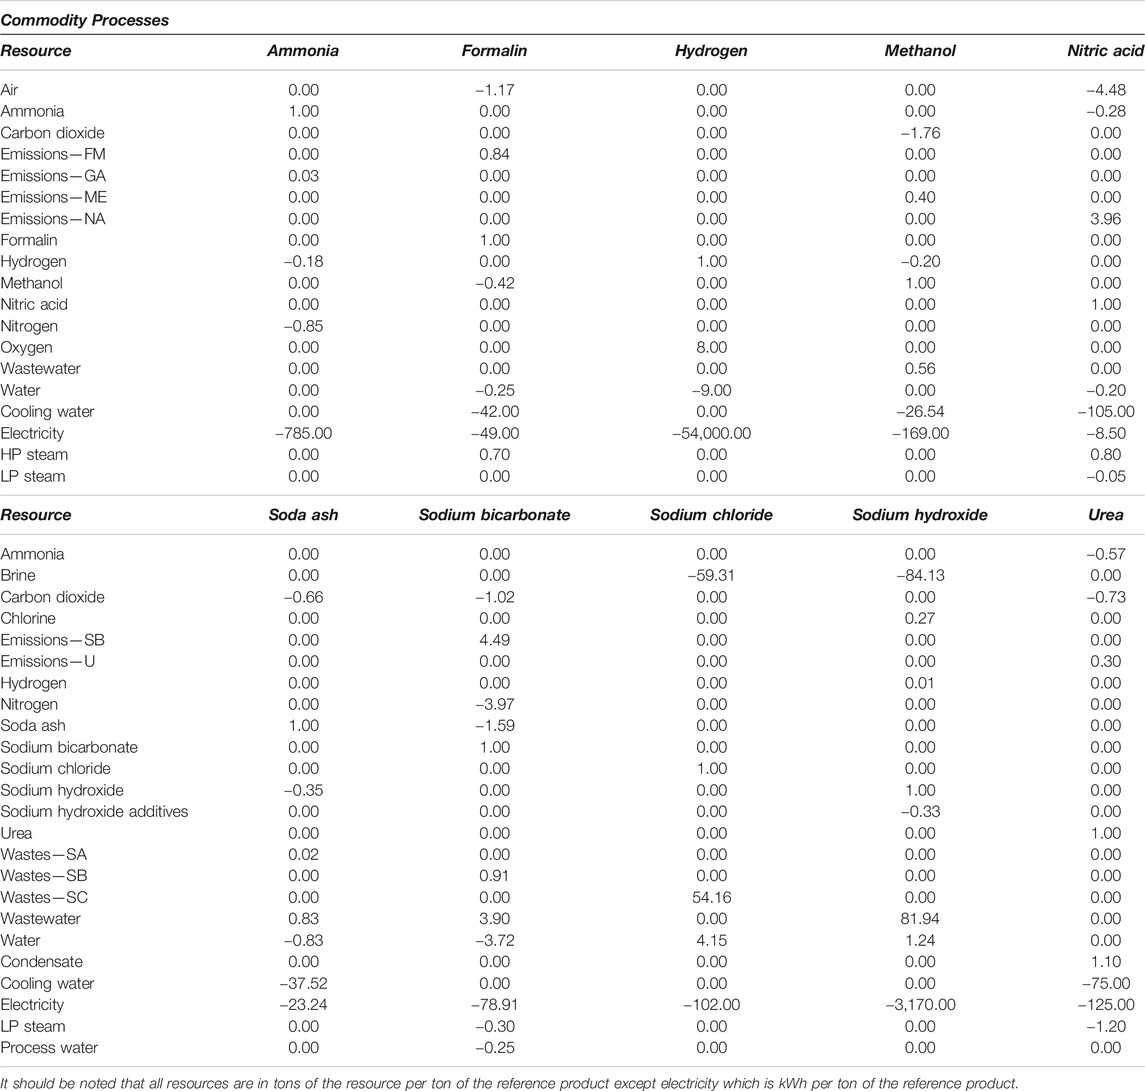
TABLE 3. Resource parameters of the candidate production processes.
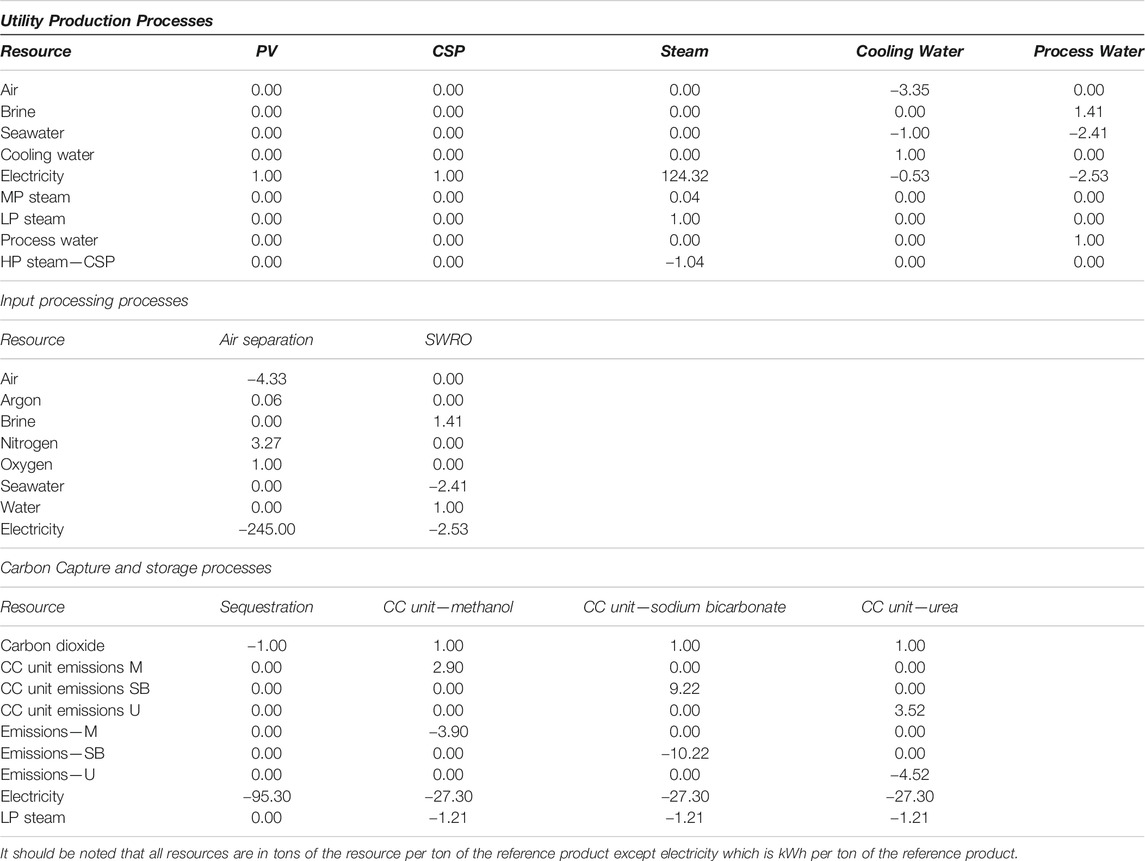
TABLE 4. Resource parameters of the other processing units.
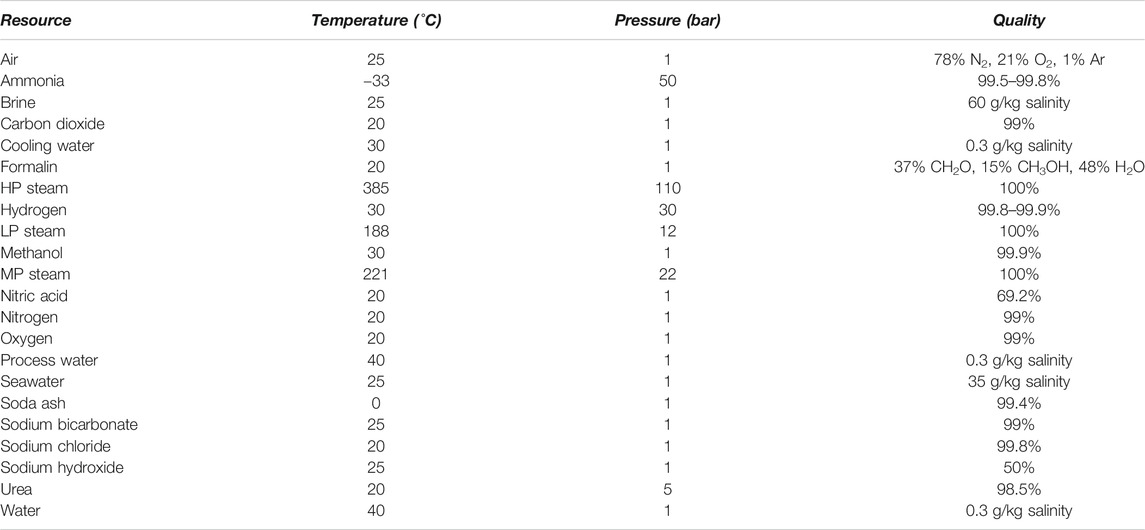
TABLE 5. Resource line specifications.
The temperature and pressure of ammonia, carbon dioxide, cooling water, hydrogen, methanol, oxygen, process water, urea, and water were retrieved from Ahmed et al. (2020). The conditions and quality of brine and seawater as well as the salinity of process water, cooling water, and water and purity of sodium chloride were obtained from Nayar et al. (2019). The temperature and pressure of formalin, nitric acid, and sodium chloride were retrieved from Carl Roth (2020a), Carl Roth (2020b), Carl Roth (2020c). The specifications of high pressure steam were obtained from State of Green (n.d.), while the specifications of low and medium pressure steam were computed through ASPEN simulation. The specifications of air, conditions of nitrogen, and quality of oxygen were specified as indicated in Table 5. The conditions of soda ash, sodium bicarbonate, and sodium hydroxide were retrieved from Sigma-Aldrich, Solvay, and Eccles, respectively (Sigma-Aldrich, n.d.; Solvay, 2019; Eccles, n.d.). The qualities of ammonia, carbon dioxide, formalin, hydrogen, methanol, nitric acid, nitrogen, soda ash, sodium bicarbonate, sodium hydroxide, and urea were obtained from CF Industries (2013), Afrox (2021), Ted Pella Inc. (1994), Grundt and Christiansen (1982), Millar and Collins (2017), Wiesenberger (2001), Jones et al. (2011), Yusuf et al. (2019), Lee et al. (2019), Du et al. (2018), and Stamicarbon (2018) respectively.
Operational Capacities
The candidate processes are all set to specific maximum operational capacities. For the commodity processes, these capacities depend on their respective market sizes. The capacities of the commodity processes then determine the capacities for the processing units and utility processes based on their cumulative requirements. The capacities of the capture units are set according to the requirements of the processes that utilize them. The formalin, ammonia, methanol, nitric acid, soda ash, sodium chloride, sodium hydroxide, and urea production processes have a maximum capacity of 200,000 tpy. The hydrogen and sodium bicarbonate production processes are 100,000 and 10,000 tpy, respectively. The air separation and reverse osmosis units have capacities of 800,000 and 1,000,000 tpy, respectively. The sequestration unit has a capacity of 500,000 tpy, since the cluster utilizes between 50,000 tpy to 500,000 tpy of carbon dioxide. All other inputs are constrained only to consume the corresponding amounts that meet the maximum operational capacities of all the units considered.
CAPEX Parameters
The capital cost parameter for each process is the annualized cost of the capital requirement in terms of their reference products. The parameters are available in Table 6 and have been calculated using the steps highlighted in Figure 5. Firstly, capital investments for a process are determined from literature, and is then updated to its 2019 value using cost indices e.g., Chemical Engineering Plant Cost Index (CEPCI). The updated cost and capacity are then scaled to the maximum operational capacity for the respective process, determined by market analysis, after which the scaled investment is then annualized for 20 years. If a specific process has more than one investment-capacity data set, the final annualized costs for each are then averaged to obtain the CAPEX parameter for the process.
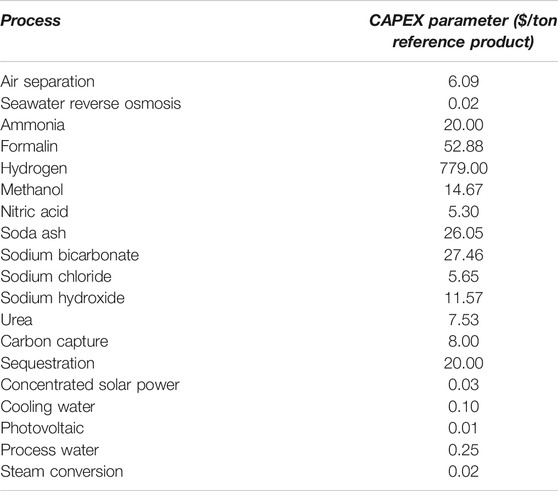
TABLE 6. CAPEX parameters defined for the maximum operational capacity of the candidate processes.
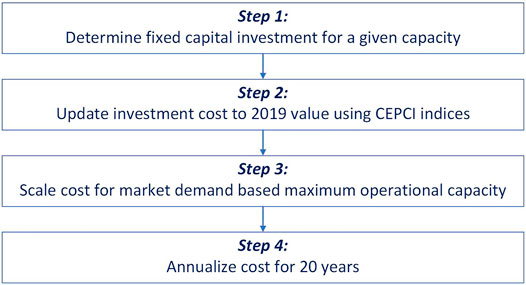
FIGURE 5. CAPEX Parameter calculation procedure.
Resource Pricing
Prices for the resources used were primarily obtained from Intratec (Intratec.Us, 2020), a market and technology intelligence provider for process industries, for the year 2019. If prices were not available on Intratec, they were either taken from literature or assumed as indicated in Table 7. Prices for all other resources were assumed to be zero.
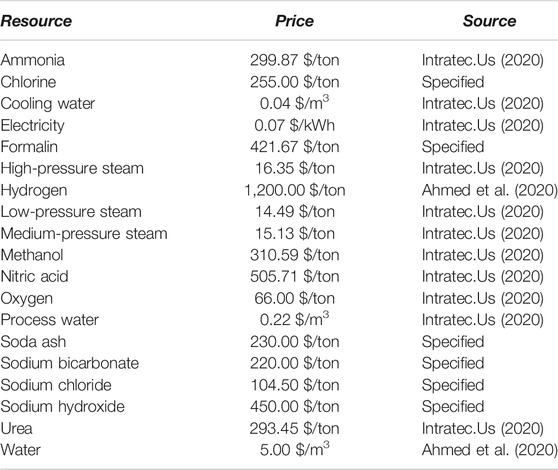
TABLE 7. Resource prices.
Results and Discussion
The carbon negative EIP synthesized for obtaining maximum profit was optimized using the What’sBest LINDO solver on the Microsoft Excel interface (LINDO, 2021). The EIP, with its input and output resource flows, is shown in Figure 6 for the 18 processes and 41 resources considered. Of these, 13 processes were activated, while the sequestration and production processes for sodium chloride, sodium bicarbonate, sodium hydroxide, and urea were inactive. The design is optimized to obtain maximum profit without placing any restrictions on the amount of emissions that can be released. The cluster achieves an annual profit of $236 million with an ROI of 7.12% and a capital cost of $3,319 million. It consumes and emits 352,000 tpy and 20,513 tpy of carbon dioxide respectively, proving that the design is indeed carbon negative. The primary products obtained here are ammonia, formalin, hydrogen, methanol, nitric acid, oxygen, sodium chloride, and water. As described previously, air provides nitrogen and oxygen to the system, while seawater provides water, brine, cooling, and process water. Sunlight provides electricity through the PV and CSP systems to power the entire cluster. The water from the osmosis unit is electrolyzed to produce the hydrogen needed for ammonia and methanol production, while the oxygen from the air separation and hydrogen units are sold. The ammonia produced is utilized to produce nitric acid, and the methanol produced by utilizing hydrogen activates the production of formalin. The brine produced from the reverse osmosis and process water units is used to produce sodium chloride. The methanol unit is the sink and source for all the carbon dioxide consumed and emitted from this cluster.
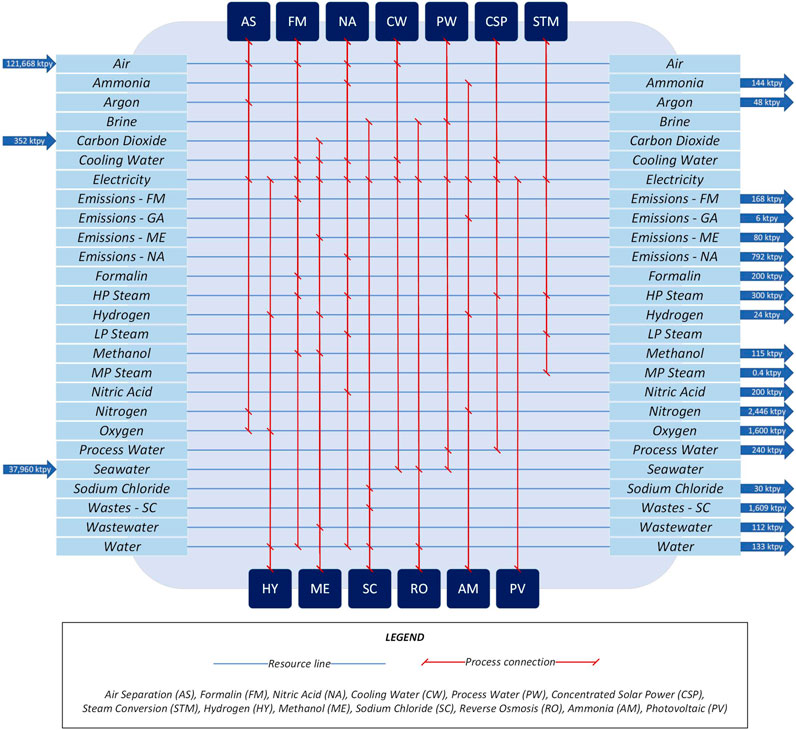
FIGURE 6. EIP design with no emission constraints.
The carbon negative EIP synthesized is further analyzed by optimizing it to reduce emissions while maximizing profit. The reduction is achieved by restricting the cluster from emitting any direct carbon dioxide and fugitive emissions from processes that have a capture unit. The units activated in this case, shown in Figure 7, are similar to those in the EIP without any restrictions, with the exception of the methanol carbon capture unit. It was established that all the emissions emitted from the previous EIP were from the methanol unit; as such, the carbon capture unit for methanol is activated here as illustrated in the figure. The cluster consumes 331,487 tpy and emits 3,569 tpy of carbon dioxide, ensuring that the design is still carbon negative. The EIP achieves an annual profit of $232 million with an ROI of 6.80%. The primary products are the same as in the previous case, with the same production rates. The minor changes in the amounts of air and seawater consumed by the cluster, and the process water and MP steam released from the cluster are due to the utility requirements of the methanol capture unit. Methanol remains the only consumer and emitter of carbon dioxide in this case as well. The carbon dioxide consumed by the cluster is lower in this case where restrictions are in place; however, the cluster produces the same amount of methanol as the case with no restrictions. The additional carbon dioxide needed to maintain methanol production is obtained from the methanol capture unit. The operational capacities of the carbon negative EIP with and without a constraint on the emissions are shown in Table 8.
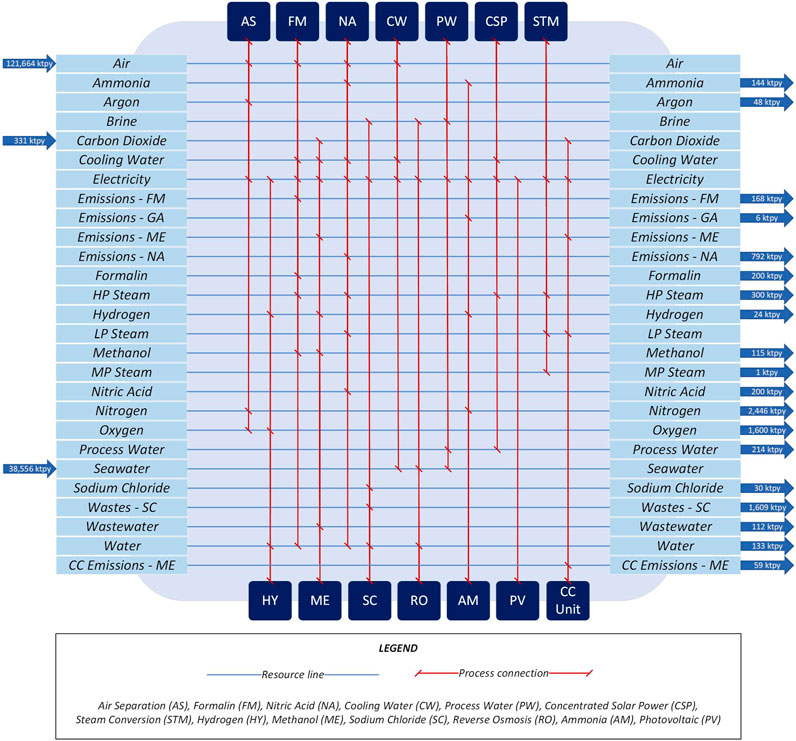
FIGURE 7. EIP design with emission constraints.
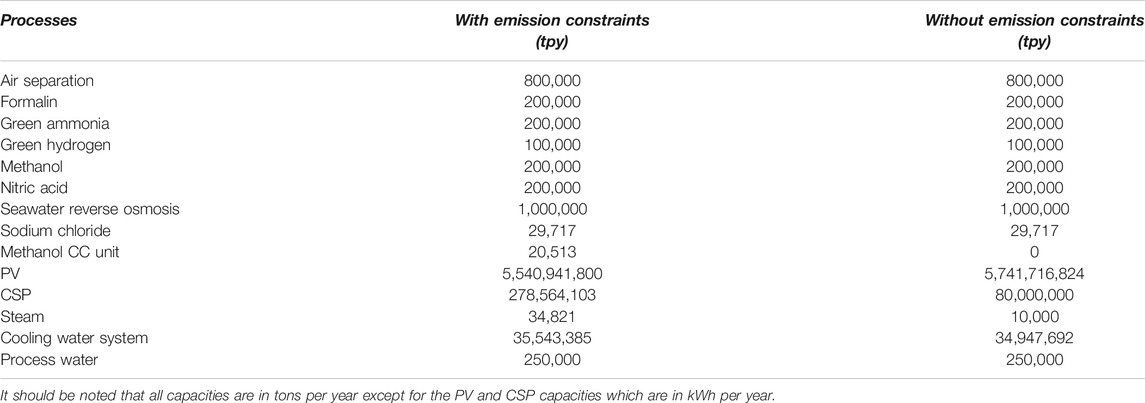
TABLE 8. Operational capacities of the activated processes.
Sensitivity Analysis
In order to determine the effect of changes in different process cluster parameters on the EIP, a sensitivity analysis is performed. The sensitivity analysis varies the prices of resources that are greatly involved within the EIP, since such parameters significantly impact profits. The aim of the sensitivity analysis is to assess how the plant configuration or operational capacities will change if some parameters are varied. The sensitivity analysis is performed on the EIP designed with restrictions placed on the emissions, which is therefore taken as the base case for the following sections. The operational capacities obtained from the optimization of the two cases that will be described are shown in Table 9.
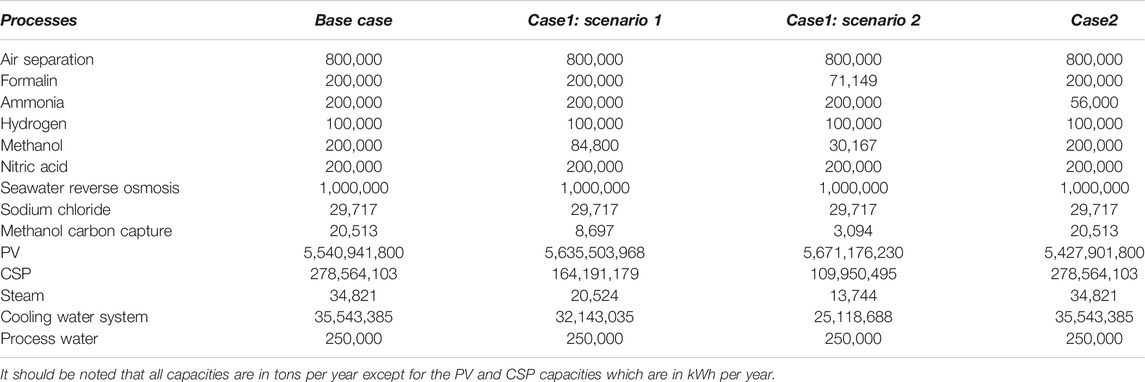
TABLE 9. Operational capacities of the activated units for the sensitivity analysis.
Case 1: Taxed Carbon Dioxide Emissions
The carbon dioxide captured from external emission sources and supplied as a pure feed to the clusters above are assumed to be free of charge since the emitters cover them. However, it is practical for the EIP to either bear the charges for this capture or purchase pure carbon dioxide from the suppliers. Therefore, the impact of pricing carbon dioxide at $50/ton is assessed. Optimization of this scenario produces the same design as the base case with the same units being operational, with the only difference being in their production capacities. The carbon dioxide consumed in this case is nearly half of that consumed in the base case. There is no methanol being sold in this case, however, enough methanol is produced to facilitate formalin production. The cluster is carbon negative since it consumes 140,551 tpy and emits 1,513 tpy of carbon dioxide while achieving an annual profit of $221 million with an ROI of 6.68%. The capital investment required for this EIP is $3,313 million. All other primary products from the base case, on the other hand, are sold. Since all the methanol produced was utilized for formalin production, the impact of formalin price coupled with a price on imported carbon dioxide was assessed next. The price of formalin was halved for this case, and the optimization revealed that while the cluster was still profitable and carbon negative, the amount of carbon dioxide dropped to the lower limit of the consumption constraint. Furthermore, the production of formalin and methanol reduced by more than half of the first scenario analyzed in the sensitivity analysis. The annual profit made also dropped to $180 million with an ROI of 5.76% and a capital investment of $3,118 million.
Case 2: Varying the Price of Ammonia
The sensitivity analysis here will deal with the price of ammonia applied on the base case where there are no costs associated with the import of carbon dioxide, and the price of formalin is not halved. Ammonia was chosen in this case because, on observing all previous clusters designed, the nitric acid facility, which depends on ammonia, operates at full capacity. Similarly, urea production, which also depends on ammonia, was never activated in any of the prior clusters. Thus, ammonia was established to have a significant impact on the cluster. The optimization of this scenario, when the price of ammonia is halved, shows that no ammonia is being sold since all of it is utilized to produce nitric acid. At the same time, the other primary products from the base case remain the same. The cluster maintains the same design as the base case with the only changes being in the capacities of the units. Carbon dioxide consumed by the cluster, 331,487 tpy, is significantly higher than the amount it emits, 3,569 tpy, thereby making it carbon negative. The cluster achieves an annual profit of $224 million with an ROI of 6.74% and a capital investment of $3,329 million. The price of nitric acid was halved to further analyze this case since all of the ammonia produced here is used in the production of nitric acid. The design generated for this scenario yields the same design and operational capacities as the previous scenario, where only the price of ammonia is halved. The only exception is that the annual profit has dropped to $174 million with an ROI of 5.22%, while there is no change in the capital investment, proving that ammonia impacts the cluster.
Conclusion
An approach to synthesize sustainable carbon negative eco-industrial parks from renewable resources, comprising of three stages, has been introduced and validated through an illustrative example. The first stage involves identifying processes that can be incorporated into the design. The second stage deals with collecting all relevant information related to the selected processes. The third stage entails the synthesis of a park design through the optimization for set objectives through resource integration. The MILP mathematical model described was able to identify profitable networks. The ability of the model to consider all resources and processing options will allow these designs to become advocates of circular economies. The case study illustrates using the proposed approach to utilize renewable and waste resources to generate profitable carbon negative networks. The pathways taken to reduce these emissions include the incorporation of renewable energy and carbon capture utilization and storage. The configurations were optimized for different objectives and constraints. It further highlights that hydrogen production is essential for carbon dioxide conversion as it enabled the production of methanol, ammonia, and nitric acid, which helps offset costs. All conversions were made possible relying on solar energy with best available or innovative technologies. Geographical variance and detailed operation are to be explored in following work. The potential of these carbon negative EIPs serves as an encouragement to continue developing and implementing carbon dioxide utilization processes powered by renewable energy.
Data Availability Statement
The original contributions presented in the study are included in the article/Supplementary Material, further inquiries can be directed to the corresponding author.
Author Contributions
EA: Software, Validation, Formal analysis, Literature Review, Data Collection, Writing—original draft. FR: Literature Review, Data Collection, Validation, Writing—original draft. DA-M: Conceptualization, Methodology, Validation, Writing—review and editing, Supervision, Project administration.
Funding
The work described was made possible by the support received from the Undergraduate Research Experience Program (UREP) UREP25-109-2-040, of Qatar National Research Fund (QNRF).
Conflict of Interest
The authors declare that the research was conducted in the absence of any commercial or financial relationships that could be construed as a potential conflict of interest.
Acknowledgments
The authors would like to express our sincere gratitude Prof. Patrick Linke for his support, Texas A&M University at Qatar and QNRF for providing us with the opportunity to undertake this work.
Supplementary Material
The Supplementary Material for this article can be found online at: https://www.frontiersin.org/articles/10.3389/fenrg.2021.689474/full#supplementary-material
References
Afrox, (2021). Industrial Gases. Available at: https://www.afrox.co.za/en/images/Section 3 - Industrial Gases WEB_tcm266-508298.pdf. (Accessed May 30, 2021).
Ahmed, R., Shehab, S., Al-Mohannadi, D. M., Linke, P., and Linke, P. (2020). Synthesis of Integrated Processing Clusters. Chem. Eng. Sci. 227, 115922. doi:10.1016/j.ces.2020.115922
Al-Mohannadi, D. M., and Linke, P. (2020). Optimal Utilization of Natural Gas in Processing Clusters with Reduced CO2 Emissions through Material and Energy Integration. Energ. Technology 8 (8), 1–19. doi:10.1002/ente.202070081
Al-Mohannadi, D. M., Linke, P., and Patrick, L. (2016). On the Systematic Carbon Integration of Industrial Parks for Climate Footprint Reduction. J. Clean. Prod. 112, 4053–4064. doi:10.1016/j.jclepro.2015.05.094
Alnouri, S. Y., Linke, P., and El-Halwagi, M. M. (2018). Accounting for Central and Distributed Zero Liquid Discharge Options in Interplant Water Network Design. J. Clean. Prod. 171, 644–661. doi:10.1016/j.jclepro.2017.09.236
Avraamidou, S., Baratsas, S. G., Tian, Y., and Pistikopoulos, E. N. (2020). Circular Economy - A Challenge and an Opportunity for Process Systems Engineering. Comput. Chem. Eng. 133, 106629. doi:10.1016/j.compchemeng.2019.106629
Boix, M., Montastruc, L., Pibouleau, L., Azzaro-Pantel, C., and Domenech, S. (2012). Industrial Water Management by Multiobjective Optimization: From Individual to Collective Solution through Eco-Industrial Parks. J. Clean. Prod. 22, 85–97. doi:10.1016/j.jclepro.2011.09.011
Butturi, M. A., Lolli, F., Sellitto, M. A., Balugani, E., Gamberini, R., and Rimini, B. (2019). Renewable Energy in Eco-Industrial Parks and Urban-Industrial Symbiosis: A Literature Review and a Conceptual Synthesis. Appl. Energ. 255 (December). doi:10.1016/j.apenergy.2019.113825
Carl Roth (2020a). Safety Data Sheet - Formaldehyde Solution ROTIPURAN® 37 %, p.a., ACS. Available at: https://www.carlroth.com/medias/SDB-4979-AU-EN.pdf?context=bWFzdGVyfHNlY3VyaXR5RGF0YXNoZWV0c3wzMzM5MjB8YXBwbGljYXRpb24vcGRmfHNlY3VyaXR5RGF0YXNoZWV0cy9oMDYvaGQ1Lzg5NzMwMTc5Mzk5OTgucGRmfDZlY2Y1YzViYzE4MmM5ZjA1NDI0ZTExMzQ3ZjMzZjc3NTlmZDE5ODJjNjMyYTNhOGYzMGFk. (Accessed May 30, 2021).
Carl Roth (2020b). Safety Data Sheet - Nitric Acid ROTIPURAN® Supra 69%. Available at: https://www.carlroth.com/medias/SDB-HN50-GB-EN.pdf?context=bWFzdGVyfHNlY3VyaXR5RGF0YXNoZWV0c3wzMTc2NTB8YXBwbGljYXRpb24vcGRmfHNlY3VyaXR5RGF0YXNoZWV0cy9oM2YvaGUzLzg5ODk2MjIwNDI2NTQucGRmfDg5ZGU3NGViZjgzZGEwNmNhZWJjZGRlMmQzMmQyMDllMWUxNGM1OTVlYmZlNzFkZjNlMjk2. (Accessed May 30, 2021).
Carl Roth (2020c). Voluntary Safety Information Following the Safety Data Sheet Format According to Regulation (EC) No. 1907/2006 (REACH) - Sodium Chloride ROTI®METIC 99,999 % (5N). Available at: https://www.carlroth.com/medias/SDB-5741-GB-EN.pdf?context=bWFzdGVyfHNlY3VyaXR5RGF0YXNoZWV0c3wyMzU5NjZ8YXBwbGljYXRpb24vcGRmfHNlY3VyaXR5RGF0YXNoZWV0cy9oNGIvaGIwLzg5NzI2MDgwNDUwODYucGRmfDFkMDc2ZWFmZGRlMGZiNjUyYWQ3ZmQ0NTAyZWRkYmJlODdiODFkOGIyZDE3N2I4YWQwNDUx. (Accessed May 30, 2021).
CF Industries (2013). Product Specification Sheet - Anhydrous Ammonia. Available at: https://www.cfindustries.com/globalassets/cf-industries/media/documents/product-specification-sheets/ammonia---na/anhydrous-ammonia-c-grade-pss.pdf. (Accessed May 30, 2021).
Côté, R., and Hall, J. (1995). Industrial Parks as Ecosystems. J. Clean. Prod. 12, 41–46. doi:10.1016/0959-6526(95)00041-C
Du, F., Warsinger, D. M., Urmi, T. I., Thiel, G. P., Kumar, A., and Lienhard V, J. H. (2018). Sodium Hydroxide Production from Seawater Desalination Brine: Process Design and Energy Efficiency. Environ. Sci. Technol. 52, 5949–5958. doi:10.1021/acs.est.8b01195
Eccles, Alek. (n.d). Sodium Hydroxide Storage Tanks and Specifications.” Protank. Available at: https://www.protank.com/sodium-hydroxide. (Accessed May 30, 2021).
Grundt, T., and Christiansen, K. (1982). Hydrogen by Water Electrolysis as Basis for Small Scale Ammonia Production. A Comparison with Hydrocarbon Based Technologies. Int. J. Hydrogen Energ. doi:10.1016/0360-3199(82)90088-X
Jones, D., Bhattacharyya, D., Turton, R., Zitney, S. E., and Zitney, (2011). Optimal Design and Integration of an Air Separation Unit (ASU) for an Integrated Gasification Combined Cycle (IGCC) Power Plant with CO2 Capture. Fuel Process. Technology 92, 1685–1695. doi:10.1016/j.fuproc.2011.04.018
Kastner, C. A., Lau, R., and Kraft., M. (2015). Quantitative Tools for Cultivating Symbiosis in Industrial Parks; a Literature Review. Appl. Energ. 155, 599–612. doi:10.1016/j.apenergy.2015.05.037
Klemeš, J., Dhole, V. R., Raissi, K., Perry, S. J., and Puigjaner, L. (1997). Targeting and Design Methodology for Reduction of Fuel, Power and CO2 on Total Sites. Appl. Therm. Eng. 17 (8–10), 993–1003. doi:10.1016/s1359-4311(96)00087-7
Lameh, M., Al-Mohannadi, D. M., Linke, P., and Linke, P. (2020). Graphical Analysis of CO2 Emissions Reduction Strategies. Clean. Eng. Technology. 1, 100023. doi:10.1016/j.clet.2020.100023
Lee, J. H., Lee, D. W., Kwak, C., Kang, K., and Lee, J. H. (2019). Technoeconomic and Environmental Evaluation of Sodium Bicarbonate Production Using Co2 from Flue Gas of a Coal-Fired Power Plant. Ind. Eng. Chem. Res. 58, 15533–15541. doi:10.1021/acs.iecr.9b02253
LINDO (2021). “What’sBest! and Excel Optimization.” n.D. Available at: https://www.lindo.com/index.php/products/what-sbest-and-excel-optimization. (Accessed March 31, 2021).
Lovelady, E. M., and El-Halwagi, M. M. (2009). Design and Integration of Eco-Industrial Parks for Managing Water Resources. Environ. Prog. Sustainable Energ. 28, 265–272. doi:10.1002/ep.10326
Millar, G. J., and Collins., M. (2017). Industrial Production of Formaldehyde Using Polycrystalline Silver Catalyst. Ind. Eng. Chem. Res. 56, 9247–9265. doi:10.1021/acs.iecr.7b02388
Nayar, K. G., Fernandes, J., McGovern, R. K., Al-Anzi, B. S., and Lienhard, J. H. (2019). Cost and Energy Needs of RO-ED-Crystallizer Systems for Zero Brine Discharge Seawater Desalination. Desalination. 457, 115–132. doi:10.1016/j.desal.2019.01.015
Nguyen, V.-H., and Wu, J. C. S. (2018). Recent Developments in the Design of Photoreactors for Solar Energy Conversion from Water Splitting and CO2 Reduction. Appl. Catal. A: Gen. 550 (January), 122–141. doi:10.1016/j.apcata.2017.11.002
Noureldin, M. M. B., and El-Halwagi, M. M. (2015). Synthesis of C-H-O Symbiosis Networks. Aiche J. 61, 1242–1262. doi:10.1002/aic.14714
Panu, M., Topolski, K., Abrash, S., and El-Halwagi, M. M. (2019). CO2 Footprint Reduction via the Optimal Design of Carbon-Hydrogen-Oxygen SYmbiosis Networks (CHOSYNs). Chem. Eng. Sci. 203, 1–11. doi:10.1016/j.ces.2019.03.066
Peddle, M. T. (1993). Planned Industrial and Commercial Developments in the United States: A Review of the History, Literature, and Empirical Evidence Regarding Industrial Parks and Research Parks. Econ. Development Q. 7, 107–124. doi:10.1177/089124249300700110
Shehab, S. I., Ahmad, R. O., Al-Mohannadi, D. M., and Linke, P. (2019). Resource Integration and CO2 Conversion in Industrial Clusters. Chem. Eng. Trans. doi:10.3303/CET1976201
Sigma-Aldrich, (n.d.). Product Information - Sodium Carbonate. Available at: https://www.sigmaaldrich.com/content/dam/sigma-aldrich/docs/Sigma-Aldrich/Product_Information_Sheet/223530pis.pdf. (Accessed May 30, 2021).
Solvay, (2019). Sodium Bicarbonate (S300) Batch Numbering and Shelf Life. Available at: https://www.solvay.com/sites/g/files/srpend221/files/2019-06/SOLVAIR® S300 BICAR Batch Numbering and Shelf Life Statement - Green River - US.pdf. (Accessed May 30, 2021).
Stamicarbon, (2018). Launch - Stami Urea. Sittard. Available at: https://www.stamicarbon.com/what-we-do/urea/launch. (Accessed May 30, 2021).
State of Green, (n.d.). Steam Generation System for CSP Plants, UAE. Available at: https://stateofgreen.com/en/partners/aalborg-csp-make-renewable-technologies/solutions/3x200mwe-sgs3-steam-generation-system-for-csp-plants-uae/. (Accessed May 30, 2021).
Ted Pella Inc (1994). Material Safety Data Sheet - Prod. No. 18508 Formaldehyde, 37% Solution. Available at: https://www.tedpella.com/msds_html/18508msd.htm. (Accessed May 30, 2021).
Valenzuela-Venegas, G., Salgado, J. C., and Díaz-Alvarado, F. A. (2016). Sustainability Indicators for the Assessment of Eco-Industrial Parks: Classification and Criteria for Selection. J. Clean. Prod. 133, 99–116. doi:10.1016/j.jclepro.2016.05.113
Vooradi, R., Anne, S. B., Tula, A. K., Eden, M. R., and Gani, R. (2019). Energy and CO2 Management for Chemical and Related Industries: Issues, Opportunities and Challenges. BMC Chem. Eng. 1 (1). doi:10.1186/s42480-019-0008-6
Wiesenberger, H. (2001). State-of-the-Art for the Production of Nitric Acid with Regard to the IPPC Directive. Editor U GmbH (Vienna: Riegelnik). Available at: https://www.umweltbundesamt.at/fileadmin/site/publikationen/M150.pdf.
Yusuf, A., Giwa, A., Mohammed, E. O., Mohammed, O., Al Hajaj, A., and Abu-Zahra, M. (2019). CO2 Utilization from Power Plant: A Comparative Techno-Economic Assessment of Soda Ash Production and Scrubbing by Monoethanolamine. J. Clean. Prod. 237, 117760. doi:10.1016/j.jclepro.2019.117760
“Intratec.Us.” (2020). Available at: www.intratec.us. (Accessed May 30, 2021).
Keywords: carbon neutral, renewable energy, eco-industrial park, carbon capture and utilization, sustainable design, brine reuse, carbon negative
Citation: Abraham EJ, Ramadan F and Al-Mohannadi DM (2021) Synthesis of Sustainable Carbon Negative Eco-Industrial Parks. Front. Energy Res. 9:689474. doi: 10.3389/fenrg.2021.689474
Received: 31 March 2021; Accepted: 17 June 2021;
Published: 28 June 2021.
Edited by:
Grazia Leonzio, Imperial College London, United KingdomReviewed by:
Ludo Diels, Flemish Institute for Technological Research (VITO), BelgiumBahman Zohuri, Golden Gate University, United States
Copyright © 2021 Abraham, Ramadan and Al-Mohannadi. This is an open-access article distributed under the terms of the Creative Commons Attribution License (CC BY). The use, distribution or reproduction in other forums is permitted, provided the original author(s) and the copyright owner(s) are credited and that the original publication in this journal is cited, in accordance with accepted academic practice. No use, distribution or reproduction is permitted which does not comply with these terms.
*Correspondence: Dhabia M. Al-Mohannadi, dhabia.al-mohannadi@qatar.tamu.edu