Investigating the Predictability of Photovoltaic Power Using Approximate Entropy
 Mao Yang1
  Chenglian Ma
- 1Key Laboratory of Modern Power System Simulation and Control & Renewable Energy Technology, Ministry of Education, Northeast Electric Power University, Jilin, China
- 2School of Science, Northeast Electric Power University, Jilin, China
The predictability concept of Photovoltaic (PV) power on the time series was presented and the approximate entropy algorithm and predictable coefficient were used to quantificationally analyze the predictability of PV power on time series, then the approximate entropy and predictable coefficient variation at different spatial scale were analyzed. Finally, the measured data of a PV plant in western Ningxia were used for testing and confirming the result. The results of several typical prediction methods show that the proposed method can effectively characterize the predictability of PV power on time series.
Introduction
Photovoltaic (PV) power is generally characterized by randomness, intermittence, and fluctuations due to diurnal alternation and weather uncertainty (Gielen et al., 2019). Therefore, large-scale grid-connected PV power plants will inevitably affect the safe and stable operation of the power grid. An accurate prediction of PV power can ensure the stability of the power grid and help the grid to deal with increased integration of PV power, thereby reducing economic loss related to PV generation curtailment and improving the efficiency of the operation and management of PV plants (Benhammane et al., 2021; Ni et al., 2020).
The forecast accuracy of PV power can be increased by improving data quality (Yang et al., 2020; Lei et al., 2021) and prediction methods (Yang and Huang, 2018; Durrani et al., 2018; Rafati et al., 2021; Wang et al., 2021). Besides, the conversion efficiency of PV power generation can be improved by adopting new PV materials (Manokar et al., 2018; Kabeel et al., 2019; Karthick et al., 2020; Manokar et al., 2020). To assess abnormal data in PV power, an improved data cleaning method was proposed in (Zhang et al., 2017), where abnormal data for PV power were divided into three types of outliers based on periodic time series, and the data were cleaned considering the rated capacity of the PV power plant and the periodicity of the PV power time series. The clear sky model (Yang et al., 2021) generally uses instantaneous solar radiation intensity combined with the atmospheric transparency coefficient on cross-section to predict surface radiation which is then converted into the PV power by the radiant energy conversion model. Chen et al. (Lopes et al., 2018) considered the cloud information in the PV power model and proposed an ultra-short-term PV power prediction model based on a ground cloud map combined with a radial basis function neural network. Literature (Sasikumar et al., 2020) analyzed the influence of different degrees of water flow on the power generation efficiency of PV panels. Literature (Manokar, 2020) analyzed the performance of solar panels in the Chennai climate by using phase change materials.
The above methods can predict PV powers within a certain time range. They avoid the problem of a high proportion of abnormal data in PV power that are caused by equipment failure, artificial power limitation, communication failure, and power reduction in PV modules. Though some combination models (Chepp and Krenzinger, 2021) effectively increase prediction performance, they cannot ensure an accurate prediction at any given time. The above method can predict the future wind power value well within a certain time range, and some combined models can effectively increase the prediction performance of the model, but it still cannot guarantee the absolute accuracy of the prediction effect in any period. The prediction accuracy of wind power is not only related to the prediction method adopted, but also related to the fluctuation characteristics of wind power itself, one of which is predictability. The approximate entropy is an important method of analyzing the complexity of time series. It measures the probability of generating new patterns in the signal and describes the degree of self-similarity of the time series in the patterns. The complexity of the time series can be quantitatively tested through approximate entropy, and the degree of self-similarity in the internal structure of the time series can be revealed. The lower the complexity, the stronger the self-similarity of internal structure.
The paper is structured as follows: Predictability Analyses of PV Power Series describes the predictability of PV power series; Approximate Entropy and Its Quantitative Characterization Index introduces an approximate entropy based evaluation model; the application of approximate entropy in PV power prediction is analyzed in Application of Approximate Entropy in PV Power Forecasting; Clustering Effect of PV Power Stations presents the convergence model of PV power stations; the predictability of PV time series in different modes is analyzed in Case Study; Conclusion presents conclusions and recommendations for future work.
Predictability Analyses of Photovoltaic Power Series
PV power forecasts at a given sampling scale are generally calculated for several time steps ahead using statistical, learning, or physical methods based on historical power data or numerical weather predictions. The methods of PV power prediction can be divided into two groups according to their objects: irradiance-based prediction (indirect methods) and power-based prediction (direct methods) (Hashemi et al., 2021). Indirect prediction first forecasts the solar irradiance received by the Earth's surface or by PV panels which are then converted into PV power. This may need to establish multiple prediction models with greater complexity. Direct prediction does not consider the changes of solar irradiance but uses historic PV power data to train statistical or intelligent methods based forecasting models which are then applied to real-time data for prediction. The following studies focus on direct prediction which is generally suitable for ultra-short-term PV power forecasting.
The predictability of PV power is the degree to which the regularities contained in the output of PV power stations can be effectively grasped (Liu et al., 2017). Predictability indicates the extent to which PV power can be accurately predicted. Figure 1 shows fluctuation curves of PV powers under different meteorological conditions. If the historical data are all zero (shown in red in Figure 1), according to the law of PV output, the predicted value is also zero, indicating that the time series has the highest predictability. When historical data exhibits random fluctuations (shown in blue Figure 1) which have no obvious regularity, the predicted value will change randomly and has reduced predictability. The value of the research on the predictability of photovoltaic power lies in improving the scale of photovoltaic grid-connection of the existing power system and promoting the large-scale development and utilization of solar energy. Combined with historical meteorological data and numerical weather prediction (NWP) data, weather types were divided according to partial daily pattern prediction framework in Fei et al. (2020), which were divided into sunny weather, cloudy weather, and rainy weather.
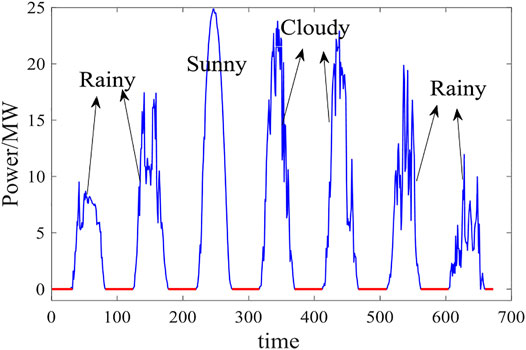
FIGURE 1. PV power fluctuation curves under different weather conditions.
The value of research on PV power predictability lies in that it goes beyond an objective evaluation of advantages and disadvantages of different prediction methods on the same platform, and provides the basis for different PV power stations to determine a practical indicator of prediction accuracy. It can facilitate an increased scale of the connection of the PV grid to the existing power system and promote the large-scale development and utilization of solar energy.
Approximate Entropy and Its Quantitative Characterization Index
Approximate entropy is a dynamic nonlinear parameter used to describe the complexity of an event sequence (Ryan et al., 2019). It does not require a large number of data to obtain a stable value, which enables its use in engineering applications. Furthermore, a sequence with a higher entropy value has greater complexity and a higher probability of generating a new pattern in the signal.
Construction of Approximate Entropy
Given a set of PV power time series si (i = 1, 2, …, n), the approximate entropy is estimated using the idea of image space reconstruction (Zhang et al., 2021) as follows:
1) For a time series si (i = 1, 2, …, n) with a sampling interval of Δt, select a suitable embedding dimension m and delay time τ to reconstruct the phase space of the time series:
2) Calculate the distance between the ith point xi and the jth point xj in the reconstructed phase space:
3) For a given xi, find the number N(i) that satisfies dij ≤ εi. εi is generally taking 15–20% of the standard deviation of the original time series. At the same time, calculate the ratio Rm(r,i) of N(i) to the total number of points in the phase space.
where r is the similarity tolerance threshold.
4) Take the natural logarithm of each Rm(r,i) and find its average:
5) Increase the dimension to m + 1 and repeat steps 1) to 4), producing Rm+1(i) and AVm+1(r). Then the theoretical approximate entropy is defined as:
C-C Method for Embedding Dimension
The C-C method can estimate delay time τ and time window length Γ simultaneously by applying the correlation integra. Let the time series be si(i = 1, 2, …, n) after phase space reconstruction:
where M = n − (m − 1) τ.
The specific description of the C-C method is as follows.
1) The correlation integral of the embedded time series is defined as the following formula:
where N is the length of the time series after reconstruction; R is the radius of the phase point, R > 0; k is the number of sub time series; and θ(*) is the Heaviside function.
The slope of a linear region is used to approximate this correlation dimension. The time series is divided into k sub-time series of length N/k. Each sub-sequence is defined as D(m, k). The maximum and minimum radii R are selected. The difference is defined as follows:
△D(m, k) measures the maximum deviation of the radius R. Finally, the proper estimates of N, m, and R can be obtained by using BDS statistics (Su et al., 2021). The optimal embedding dimension obtained by the C-C method is 2 or 3. To facilitate the analyses, this paper assigns m = 2 and τ = 1.
Physical Meaning of Approximate Entropy
The core of the approximate entropy algorithm is calculating the distances between feature vectors of different dimensions and statistics that meet the distance requirements specified by a certain tolerance range. The distance calculation is described here by Figure 2 using m = 2. In the two-dimensional mode, the feature vector Xi is the connection between the two adjacent sampling points x(i) and x(i + 1) in the sequence line; given a similar tolerance threshold of r, two intervals A and B in Figure 2 represent the tolerance range of x(i) and x(i + 1) respectively. If the two endpoints x(j) and x(j + 1) of the eigenvector Xj fall into intervals A and B respectively, it is considered that the distance between the eigenvector Xi and Xj is less than the tolerance threshold r. The modes representing the two-dimensional eigenvectors Xi and Xj are similar about tolerance r. Similarly, in the three-dimension (i.e. m = 3), if the distance between the eigenvectors Xi and Xj is less than the tolerance threshold r, the connecting line (Xi) of adjacent sampling points x(i), x(i + 1) and x(i +2) is similar to the connecting line (Xj) of x(j), x(j + 1), and x(j + 2) under tolerance r.

FIGURE 2. Basic principles of approximate entropy.
The physical significance of approximate entropy is to measure the mean value of the logarithmic conditional probability of new patterns appearing in signal sequence when the dimension changes. Therefore, the approximate entropy has certain significance in characterizing the predictability of signal sequence theoretically.
Application of Approximate Entropy in Photovoltaic Power Forecasting
Predictability Coefficient Based on Approximate Entropy
The sequence of a higher approximate entropy has greater complexity and contains more uncertainty information, meaning lower predictability of the sequence. Therefore, the coefficient of predictability kpred can be obtained by taking the reciprocal of approximate entropy.
The application of the approximate entropy algorithm in the predictability analyses of PV power generation includes the following four points (Xu et al., 2020):
1) The approximate entropy algorithm has good anti-noize and anti-interference capabilities, especially withstanding occasionally strong transient interference, such as the PV power time series usually contains, in the form of high-frequency noise interference. Thus, the anti-noize ability of the approximate entropy algorithm is very important.
2) The approximate entropy algorithm measures the complexity of a time series. It is only related to the complexity of the time series and has nothing to do with the amplitude (Wu et al., 2010). It reflects the degree of self-similarity of the sequence in the pattern and has only a relative meaning. Due to different numbers of clusters and weather types, the magnitude of the output sequence of PV power plants varies greatly. Therefore, the use of approximate entropy that is independent of amplitude can effectively compare the predictability of different sequences.
3) The stochastic and deterministic processes of the approximate entropy algorithm have universal applicability, especially for PV power time series which often contains both deterministic and random components of complex chaotic signal components.
4) The approximate entropy algorithm describes the predictability of the sequence in its structural distribution from a statistical perspective. It can extract characteristic information hidden in the time series within a short period, making it suitable for real-time demands for the high predictability of PV power.
In summary, the approximate entropy algorithm applies to the predictability analysis of modeling domain sequences in power prediction and provides a new means of support for more accurate power predictability research. The specific flow of its algorithm is shown in Figure 3.
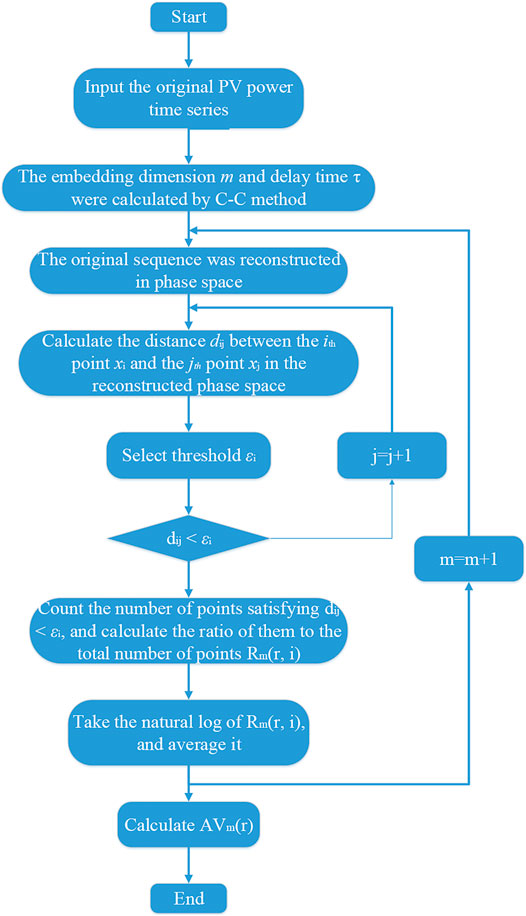
FIGURE 3. Algorithm flow chart.
Clustering Effect of Photovoltaic Power Stations
Information on Photovoltaic Power Stations
This article examines the locations of several PV power stations in Ningxia, China as shown in Figure 4 to complete the preliminary division from a single site to multiple sites based on their latitudes and longitudes. Because of the high latitudes of this set, the angle of solar altitude is relatively small, which means that obliquity must be accounted for, and the solar radiation obtained per unit area of the ground is small. In areas with low latitudes, the Sun’s altitude angle is relatively large, which means it is closer to or even reaches the point-blank phenomenon, and more solar radiation is obtained per unit area of the ground than in high-latitude regions (Fedorov et al., 2020). This article chooses a PV power station around a latitude of 37.5°N.

FIGURE 4. Geographical distribution of PV power stations.
Initially, the PV power plants 47, 51, 52, 54, 63, 66, 67, 94, 96, 100, 102, 112, 130, 198, and 205 were selected, totalling 16 plants. Their information is listed in Table 1.
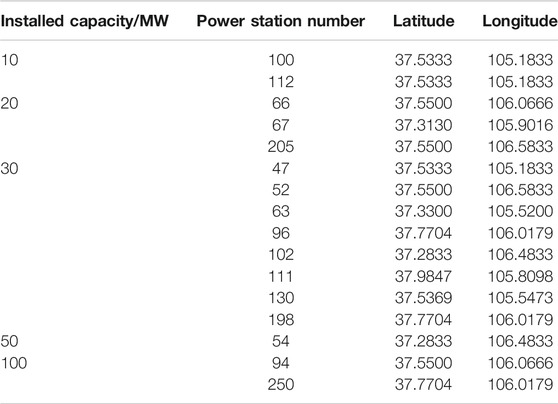
TABLE 1. Information on PV power stations.
Convergence of Photovoltaic Power Stations
In each region, there are different light resources, and the volatility generated by this variance in one area can offset that of another. In the region, complementary effects can be formed to meet the needs of the operation of the PV system. A normalized polyline comparison chart is given in Figure 5 for one, four, and eight 30 MW PV power plants respectively. The polyline graph in the black rectangular frame shows that the power of a single plant has large fluctuations; as the number of aggregated PV power plants increases, the fluctuation of their aggregated output power decreases, meaning that the complexity of the power sequence decreases and the PV power curve is smoother (Yang et al., 2020). The above is an intuitive expression of the clustering effect on PV power. The approximate entropy is used here to quantitatively describe the expression of this clustering effect, reflecting its specific impact on predictability.
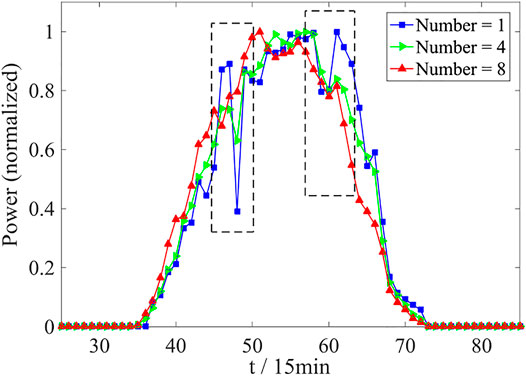
FIGURE 5. Normalized PV power fluctuation curves.
There are different methods of the combination of PV power stations. The mutual information value of each pair of PV power stations is calculated to indicate the correlations between the two stations, as shown in Table 2.
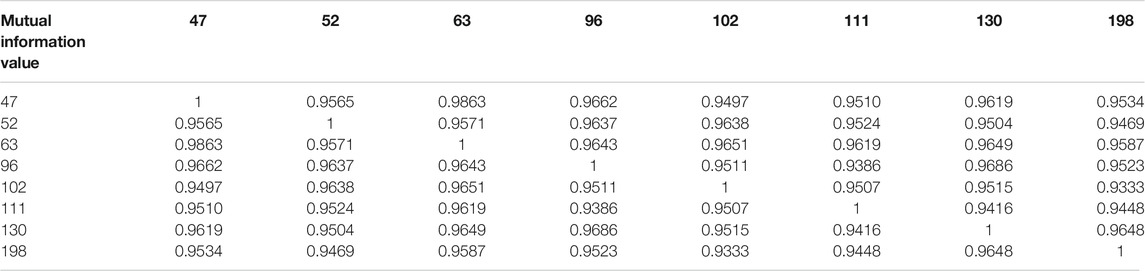
TABLE 2. Mutual information value of each PV power stastions.
This thesis does not simply aggregate the power of each PV power station but uses the obtained mutual information value table to hierarchically cluster eight different stations. The clustering results are shown in Figure 5. If the power of the 47th PV power station is taken as the benchmark, the aggregated power of PV stations 63, 96, 130, 198, 52, 102, and 111 can be assessed in terms of correlation according to the results of the hierarchical division shown in Figure 6.
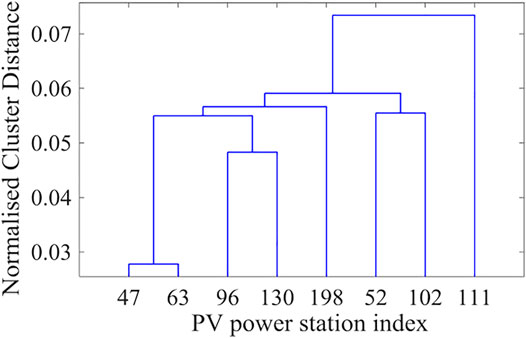
FIGURE 6. Hierarchical clustering results for each PV power station.
Case Study
Predictability Analyses Under the Clustering Effect
The data collected from 16 PV power plants in Ningxia, China, are used as experimental data. These data represent output power between 00:00 and 23:45 from July 01, 2017 to September 30, 2017, with a time resolution of 15 min. For each day, 96 sets of data were obtained, including independent time data and the output power of 16 single-farm power plants. The installed capacity of the power plant is between 10 and 100 MW. A PV power plant is selected with an installed capacity of 30 MW, the approximate entropy and recurrence rate accumulated from one PV power plant to eight PV power plants is calculated. The original sequence was a 14-days PV power sequence from July 10, 2017 to July 23, 2017. The predictability of PV power under the clustering effect was investigated.
The average approximate entropy and recurrence rate of the power generated by a certain number of PV power plants at different similar tolerance thresholds (r) is given in Table 3.
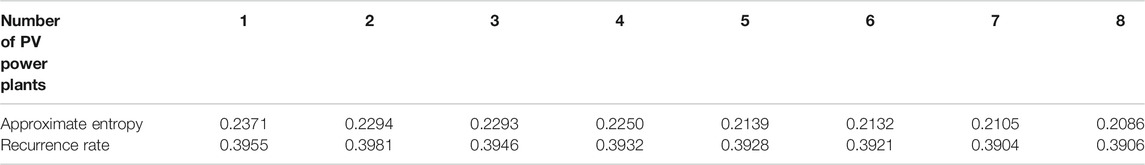
TABLE 3. Average approximate entropy and recurrence rate for the convergence of different numbers of PV power plants.
It can be observed from Table 3 that the increase in the number of PV power stations decreases the approximate entropy value of the time series, meaning that the predictability coefficient of the PV power time series gradually increases and the ultra-short-term prediction error decreases. The average approximate entropy of a single PV power series is 0.2371, and the predictability coefficient is 4.22. When the number of PV power stations increases to eight, the approximate entropy value of the power series reaches 0.2086, and the predictability coefficient is 4.79. The recursive graph is an effective tool to analyze the fluctuation of PV power time series, and its corresponding index is the recursive rate (Shen et al., 2018). It can be seen from Table 3 and Figures 5, 7 that with the continuous increase of stations, the convergence effect in Figure 5 is obvious, but the blank points in the sequence point 40–60 in Figure 7 gradually increase (the more blank points, the more fluctuation points). After analysis, it is found that the PV power fluctuation is not obvious when the number of stations in Figure 5 is 8 and the numerical change is not obvious when the recursive rate index is used to measure the convergence effect. The power time series of a single PV power station is more complex than that of eight PV power stations and has smaller predictability. As the PV power stations converge one by one, the power curve gradually becomes smooth, leading to increased predictability.
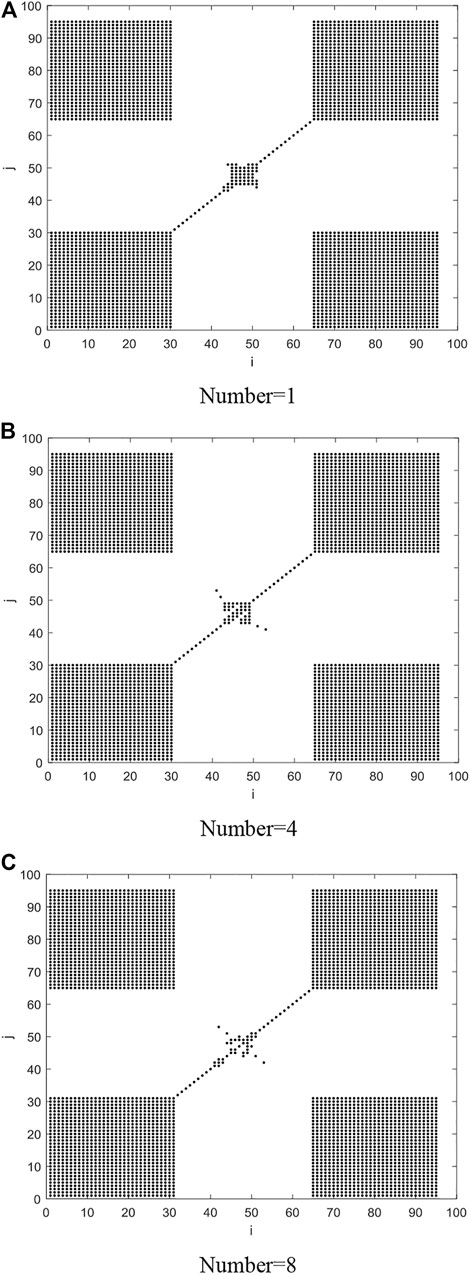
FIGURE 7. Recursive diagram of PV power on a certain day after the convergence of different stations. (A) Number=1. (B) Number=4. (C) Number=8.
Based on the eight PV power stations selected above, additional six PV power stations of no. 100, 112, 66, 67, 54, and 94 are added successively. The average approximate entropy of the corresponding power sequence is calculated as shown in Figure 8 in order to verify the limitation of the clustering effect. As the number of converged PV power stations continues to increase, the approximate entropy is stable between 0.15 and 0.2 and will not decrease with the increase of the number of converged PV power stations. However, the recurrence rate remains unchanged, so it is impossible to analyze the convergence effect of data. Therefore, the cluster power cannot be predicted and improved according to the recurrence rate. This reveals that the predictability will not increase infinitely even under the clustering effect.
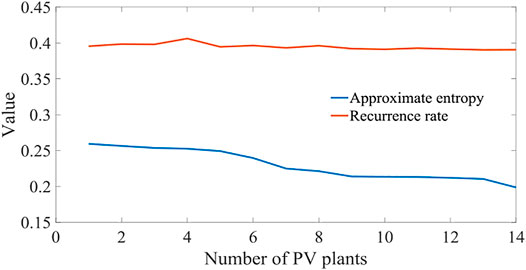
FIGURE 8. Variation of approximate entropy with the number of converged PV power stations.
To further illustrate these conclusions, PV power stations with different installed capacities were selected, in combination with the conclusions obtained in Figures 7, 8, the recurrence rate is not analyzed, but only the calculation results of approximate entropy are analyzed. Stations 100 (10 MW), 47 (30 MW), and 94 (MW) were taken as an example to calculate the approximate entropy under different similar tolerance thresholds based on the power sequences over the 14 days, as shown in Figure 9.
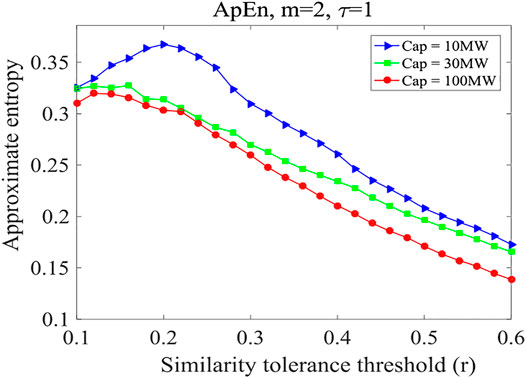
FIGURE 9. Approximate entropy values under different installed capacities.
Figure 9 shows that when the similarity tolerance threshold increases, the approximate entropy first increases and then decreases gradually, and finally tends to be stable. The is mainly due to the diurnal trend of PV power, i.e. the PV power rising until noon and then declining to zero until the sunset given no the influence of cloud disturbance or other disturbance. The difference between Xi and Xj after the reconstruction of the phase space is found to be small. In the case of a small similarity tolerance threshold (e.g. r < 0.1), the number of dij ≤ εi is very small, and the corresponding results of the model are not stable. When the threshold value for similarity tolerance exceeds 0.1, approximate entropy tends to be stable with an increased threshold value, and the result is more convincing. Furthermore, the installed capacity of a PV power station shows is shown to affect power predictability. The approximate entropy calculated for a PV power station with a higher installed capacity is generally lower than that calculated for a smaller installed capacity under different similarity-tolerance thresholds, revealing that the former has greater predictability. This is confirmed by the clustering effect.
Approximate Entropy in Different Time Series
To validate the universality of the experiment, we first adopt the power series of three PV power plants with different installed capacities as an example, gradually increasing the length of the time series (from 1 to 14 days), and count the average value of approximate entropy under different similarity-tolerance thresholds to determine the influence of the length of time series on predictability.
It can be seen from Figure 10 that when the time series grows gradually, the approximate entropy of PV power under each installed capacity shows almost no obvious change trend. The approximate entropy is between 0.2 and 0.225, and the predictability coefficient is between 4 and 4.44. These results indicate that the effects of time series length on the value of approximate entropy are not obvious. Thus, in future research, shorter PV power time series can be used to analyze the predictability of the whole series. Reducing the sample size can improve research efficiency.
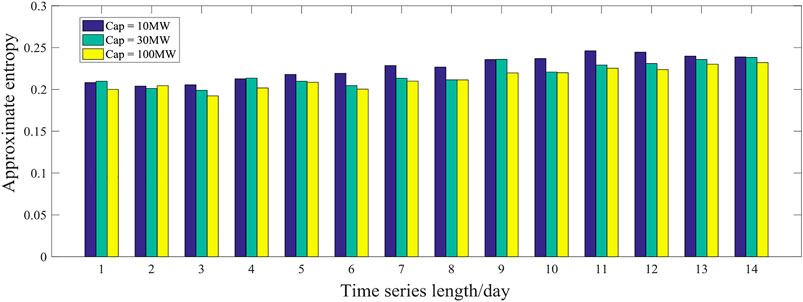
FIGURE 10. Approximate entropy at different time series lengths.
Influence of Weather Types on Predictability of Photovoltaic
Different types of weather cause different PV power curves and thus produce different accuracies in PV power prediction. Therefore, unlike the case of wind power, the weather is an important consideration in PV power prediction. The following calculations also relate to the type of weather.
Taking PV power station 47 with its installed capacity of 30 MW as an example, weather occurrences are divided into three types: sunny, cloudy, and rainy. The PV power series for each weather type is studied separately at a time series length of 6 days. To study the influence of weather type on PV predictability, approximate entropy values are calculated. The approximate entropy values for different weather types are shown in Figure 11.
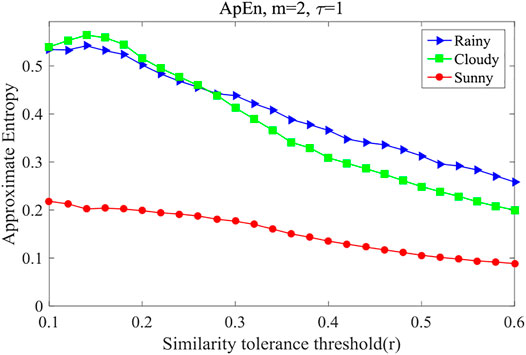
FIGURE 11. Approximate entropy under different weather types.
In Figure 11, the approximate entropy curves are shown under different similarity-tolerance thresholds for rainy, cloudy, and sunny weather. The approximate entropy is the least in sunny weather, and it is less in rainy weather than in cloudy weather when r < 0.27, but the difference is not large; then, when r > 0.27, the value in rainy weather is greater than in cloudy weather, and the difference is large. That is to say, in sunny weather, when PV power is the least complex, and the approximate entropy is the smallest, the predictability is the largest; when the weather is cloudy or rainy, the predictability is lower, the approximate entropy is greater, and predictability is lower. Therefore, the predictive coefficient based on approximate entropy also has strong applicability for different weather types.
Relationship Between Approximate Entropy and Photovoltaic Prediction Error
To verify the correlation between the predictability and the ultra-short -term prediction accuracy, the ELM、Persistence method and BP are used here to produce the ultra-short-term forecasts of PV power for 4 h ahead based on the time series of the total output of different numbers of clustered 30 MW PV power stations over 76 days from July 01, 2017 to September 14, 2017, and the prediction error is calculated under the corresponding evaluation indexes, to measure the rationality of judging the predictability of PV power by approximate entropy. The mean value of the root means square error (RMSE) of fourth-hour forecasts calculated by Eq. 10 is shown in Table 4.
where pMi is predicted PV power, pPi is actual PV power, Cap is the total installed capacity of the clustered power stations.
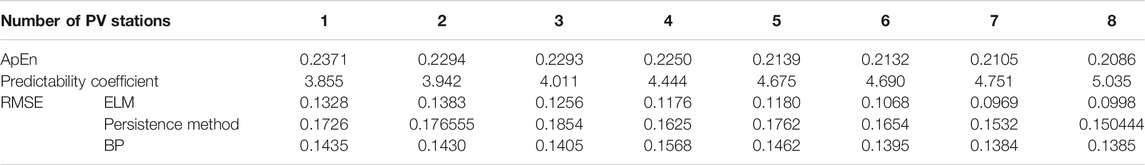
TABLE 4. Comparison of approximate entropy and prediction error.
It can be seen from Table 4 that the RMSE obtained by the above four methods all show a similar trend, the Pearson correlation coefficient of approximate entropy with RMSE listed in Table 4 is estimated to be around 0.912. In general, correlation coefficients of between 0.8 and 1.0 indicate that the two sets of data have a strong correlation. With the increasing of installed capacity, the RMSE of the whole day prediction results decreases gradually. In other words, the order of predictability of each sequence is in the same trend as the installed capacity, that is, the greater the installed capacity, the higher the predictability. This is consistent with the conclusion of approximate entropy and predictable coefficient.
The predictable coefficient, namely the reciprocal of approximate entropy, is an indicator for quantitative analysis of the predictability of PV power time series. The greater the value, the stronger the predictability of the corresponding PV power time series is, and the predictable coefficient is inversely proportional to the approximate entropy. Therefore, there is no lower bound on the predictive coefficient; The time series of cluster PV power is different from the time series of single field PV power, and its time series has certain implicit characteristics. The predictability degree of the PV power time series can be obtained through approximate entropy and predictable value.
The above analysis shows that the predictability coefficient of cluster PV power series is higher than that of a single station. For the same prediction method, when the cluster and single station are respectively predicted, the prediction accuracy of the cluster is also higher than that of a single station. It can be seen that the higher the predictability of PV power, the higher the prediction accuracy. On the other hand, for PV power stations with different installed capacities, the convergence degree of PV power stations with large installed capacities is also different. The statistical values of the predictable coefficients of PV power stations with different scales are shown in the third row of Table 4.
The performance of the prediction methods is additionally tested on sunny, cloudy, and rainy days, as shown in Table 5. It is found that the prediction error is the least on sunny days and relatively greater on rainy days. This is because cloudy and rainy days are greatly affected by cloud movement, resulting in frequent fluctuations of PV power and enhanced randomness of the sequence, which is consistent with the conclusion obtained by the approximate entropy. The Pearson correlation coefficient of approximate entropy sequence and error sequence listed in Table 5 is 0.931, indicating a high correlation between them.
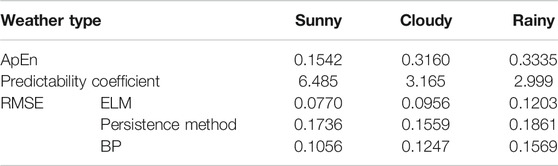
TABLE 5. Approximate entropy and prediction results for different types of weather.
Combined with the example analysis, it can be seen that the predictive coefficient based on approximate entropy is more suitable for the power of photovoltaic clusters. This is because the increasing number of photovoltaic clusters will produce the convergence effect, and the time segments with severe fluctuations will become relatively smooth with better predictability and higher predictability coefficient. For a single photovoltaic power station, the applicability range is smaller than that of a photovoltaic cluster, and it is more affected by weather conditions. Especially for rainy days, it can be seen that the prediction effect is poor and the coefficient of predictability is low. In sunny and cloudy weather conditions, the effect is consistent with the cluster, and the predictability is good, and the coefficient of predictability is high.
Conclusion
This paper has investigated the predictability of PV power which is believed to correlate to digital characteristics of the time series of PV power itself. Using approximate entropy, a predictability coefficient has been proposed here to quantitatively interpret the predictability of PV power. The following conclusions are drawn:
1) For a constant time scale, the predictability of the PV power time series increases with the number of clustered PV power plants. The predictability of the entire plant is greater than the predictability of a single unit. The mechanism of the clustering effect with PV power is consistent.
2) The value for approximate entropy is different in the context of different weather types, indicating that the predictability varies with weather types. The order of approximate entropy is rainy, cloudy, and sunny, from greatest to least. As the time scale gradually increases, no regularity appears for the predictability of PV power time series due to the convergence of PV power stations. Therefore, a shorter time series for PV power may be selected to analyze the sequence characteristics of a longer time scale.
3) The predictability index proposed based on approximate entropy theory can be used to quantitatively describe the predictability of PV power by the prediction coefficient, and can also provide a reference for other PV power prediction and evaluation indexes.
4) Due to the influence of cloud disturbances, changes in the working environment of PV modules, and severe weather changes, PV output power is expected to fluctuate to a certain extent, leading to greater uncertainty and reducing the predictability of PV power. Therefore, even if the prediction error of the model itself is ignored, the improvement of the prediction accuracy has certain limitations.
This paper mainly considers the predictability from the macro perspective of photovoltaic single station to photovoltaic cluster. The prediction method is statistical extrapolation. The advantage is to evaluate the predictability degree of PV under different weather conditions according to the predictable coefficient of approximate entropy value, that is, the reliability degree of point prediction results. However, there is no discussion on whether the prediction method based on photovoltaic cell module model and photoelectric conversion efficiency model has such a law. The next research idea is to discuss the law generated by the physical model and how to combine the predictable coefficient of approximate entropy measurement with how to improve the prediction accuracy of photovoltaic power generation.
Data Availability Statement
The original contributions presented in the study are included in the article/Supplementary Material, further inquiries can be directed to the corresponding author.
Author Contributions
All authors contributed to this research. KW conducted the experiments, performed the experiments, and wrote the draft of this paper. MY, YC, FF, XS and CM suggested the study idea and shared it in writing and revising the paper.
Funding
This work was fully supported by the National Key R&D Program of China (Technology and application of wind power / photovoltaic power prediction for promoting renewable energy consumption, 2018YFB0904200).
Conflict of Interest
The authors declare that the research was conducted in the absence of any commercial or financial relationships that could be construed as a potential conflict of interest.
References
Benhammane, M., Notton, G., Pichenot, G., Voarino, P., and Ouvrard, D. (2021). Overview of Electrical Power Models for Concentrated Photovoltaic Systems and Development of a New Operational Model with Easily Accessible Inputs. Renew. Sustain. Energ. Rev. 135, 110221. doi:10.1016/j.rser.2020.110221
Chepp, E. D., and Krenzinger, A. (2021). A Methodology for Prediction and Assessment of Shading on PV Systems. Solar Energy 216, 537–550. doi:10.1016/j.solener.2021.01.002
Durrani, S. P., Balluff, S., Wurzer, L., and Krauter, S. (2018). Photovoltaic Yield Prediction Using an Irradiance Forecast Model Based on Multiple Neural Networks. J. Mod. Power Syst. Clean. Energ. 6, 255–267. doi:10.1007/s40565-018-0393-5
Fedorov, V. M., Kostin, A. A., and Frolov, D. M. (2020). Influence of the Shape of the Earth on the Characteristics of the Irradiation of the Earth. Izv. Atmos. Ocean. Phys. 56, 1301–1313. doi:10.1134/S0001433820100035
Fei, W., Zx, A., and Zhao, Z. (2020). A Day-Ahead PV Power Forecasting Method Based on LSTM-RNN Model and Time Correlation Modification under Partial Daily Pattern Prediction Framework. Energ. Convers. Manage. 212, 112766.
Gielen, D., Boshell, F., Saygin, D., Bazilian, M. D., Wagner, N., and Gorini, R. (2019). The Role of Renewable Energy in the Global Energy Transformation. Energ. Strategy Rev. 24, 38–50. doi:10.1016/j.esr.2019.01.006
Hashemi, B., Taheri, S., Cretu, A.-M., and Pouresmaeil, E. (2021). Systematic Photovoltaic System Power Losses Calculation and Modeling Using Computational Intelligence Techniques. Appl. Energ. 284, 116396. doi:10.1016/j.apenergy.2020.116396
Kabeel, A. E., Sathyamurthy, R., El-Agouz, S. A., Muthu manokar, A., and El-Said, E. M. S. (2019). Experimental Studies on Inclined PV Panel Solar Still with Cover Cooling and PCM. J. Therm. Anal. Calorim. 138, 3987–3995. doi:10.1007/s10973-019-08561-6
Karthick, A., Manokar Athikesavan, M., Pasupathi, M. K., Manoj Kumar, N., Chopra, S. S., and Ghosh, A. (2020). Investigation of Inorganic Phase Change Material for a Semi-transparent Photovoltaic (STPV) Module. Energies 13, 3582. doi:10.3390/en13143582
Lei, Z., Wang, B., Wang, K., Pei, Y., and Huang, Z. (2021). Photovoltaic Power Missing Data Filling Based on Multiple Matching and Long‐ and Short‐term Memory Network. Int. Trans. Electr. Energ Syst. 31, e12829. doi:10.1002/2050-7038.12829
Liu, B., Yin, M., and Lin, Q. (2017). Control Strategy of Bess for Smoothing Fluctuation of Photovoltaic Power Based on Fuzzy Control Theory[C]//2017 Chinese Automation Congress (CAC). IEEE, 2744–2749.
Lopes, F. M., Silva, H. G., Salgado, R., Cavaco, A., Canhoto, P., and Collares-Pereira, M. (2018). Short-term Forecasts of GHI and DNI for Solar Energy Systems Operation: Assessment of the ECMWF Integrated Forecasting System in Southern Portugal. Solar Energy 170, 14–30. doi:10.1016/j.solener.2018.05.039
Manokar, A. M. (2020). Experimental Study on Effect of Different Mass Flow Rate in an Inclined Solar Panel Absorber Solar Still Integrated with Spiral Tube Water Heater. Desalination Water Treat. 176, 285–291. doi:10.5004/dwt.2020.25531
Manokar, A. M., Kabeel, A. E., Sathyamurthy, R., Mageshbabud, D., Madhud, B., Mafhu, B., et al. (2020). Effect of Mass Flow Rate on Fresh Water Improvement from Inclined PV Panel Basin Solar Still. Mater. Today Proc. 32, 374–378. doi:10.1016/j.matpr.2020.02.051
Manokar, A. M., Winston, D. P., Kabeel, A. E., and Sathyamurthy, R. (2018). Sustainable Fresh Water and Power Production by Integrating PV Panel in Inclined Solar Still. J. Clean. Prod. 172, 2711–2719. doi:10.1016/j.jclepro.2017.11.140
Ni, Z., Lyu, X., Yadav, O. P., Singh, B. N., Zheng, S., and Cao, D. (2020). Overview of Real-Time Lifetime Prediction and Extension for SiC Power Converters. IEEE Trans. Power Electron. 35, 7765–7794. doi:10.1109/TPEL.2019.2962503
Rafati, A., Joorabian, M., Mashhour, E., and Shaker, H. R. (2021). High Dimensional Very Short-Term Solar Power Forecasting Based on a Data-Driven Heuristic Method. Energy 219, 119647. doi:10.1016/j.energy.2020.119647
Ryan, G., Mosca, A., Chang, R., and Wu, E. (2019). At a Glance: Pixel Approximate Entropy as a Measure of Line Chart Complexity. IEEE Trans. Vis. Comput. Graphics 25, 872–881. doi:10.1109/TVCG.2018.2865264
Sasikumar, C., Manokar, A. M., Vimala, M., Prince Winston, D., Kabeel, A. E., Sathyamurthy, R., et al. (2020). Experimental Studies on Passive Inclined Solar Panel Absorber Solar Still. J. Therm. Anal. Calorim. 139, 3649–3660. doi:10.1007/s10973-019-08770-z
Shen, J., Wen, T., Chen, W., Lu, C., Yan, L., and Yang, J. (2018). Model Predicting the Microvascular Invasion and Satellite Lesions of Hepatocellular Carcinoma after Hepatectomy. Anz J. Surg. 88, E761–E766. doi:10.1111/ans.14473
Su, X., Li, X., Niu, Z., Wang, N. a., and Liang, X. (2021). A New Complexity-Based Three-Stage Method to Comprehensively Quantify Positive/negative Contribution Rates of Climate Change and Human Activities to Changes in Runoff in the Upper Yellow River. J. Clean. Prod. 287, 125017. doi:10.1016/j.jclepro.2020.125017
Wang, P., Zhang, S., Pu, Y., Cao, S., and Zhang, Y. (2021). Estimation of Photovoltaic Power Generation Potential in 2020 and 2030 Using Land Resource Changes: An Empirical Study from China. Energy 219, 119611. doi:10.1016/j.energy.2020.119611
Wu, X., Ralescu, D. A., and Liu, Y. (2010). A New Quadratic Deviation of Fuzzy Random Variable and its Application to Portfolio Optimization. Iranian J. Fuzzy Syst. 17, 1–18.
Xu, F., Shu, X., Li, X., and Zhang, X. (2020). Data-driven Bearing Fault Diagnosis of Microgrid Network Power Device Based on a Stacked Denoising Autoencoder in Deep Learning and Clustering by Fast Search without Data Labels. Complexity 2020, 1–29. doi:10.1155/2020/5013871
Yang, M., and Huang, X. (2018). Ultra-short-term Prediction of Photovoltaic Power Based on Periodic Extraction of PV Energy and LSH Algorithm. IEEE Access 6, 51200–51205. doi:10.1109/ACCESS.2018.2868478
Yang, M., Liu, D., Cui, Y., Huang, X., and Yan, G. (2020). Research on Complementary Algorithm of Photovoltaic Power Missing Data Based on Improved Cloud Model. Int. Trans. Electr. Energ Syst. 30, e12350. doi:10.1002/2050-7038.12350
Yang, M., Shi, C., and Liu, H. (2021). Day-ahead Wind Power Forecasting Based on the Clustering of Equivalent Power Curves. Energy 218, 119515. doi:10.1016/j.energy.2020.119515
Yang, M., Zhang, L., Cui, Y., Zhou, Y., Chen, Y., and Yan, G. (2020). Investigating the Wind Power Smoothing Effect Using Set Pair Analysis. IEEE Trans. Sustain. Energ. 11, 1161–1172. doi:10.1109/TSTE.2019.2920255
Zhang, J., Wang, C., and Chen, G. (2021). A Review Selection Method for Finding an Informative Subset from Online Reviews. Informs J. Comput. 33, 280–299. doi:10.1287/ijoc.2019.0950
Keywords: PV power predictability, approximate entropy, clustering effect, time series, weather type
Citation: Yang M, Wang K, Cui Y, Feng F, Su X and Ma C (2021) Investigating the Predictability of Photovoltaic Power Using Approximate Entropy. Front. Energy Res. 9:681494. doi: 10.3389/fenrg.2021.681494
Received: 16 March 2021; Accepted: 26 April 2021;
Published: 07 May 2021.
Edited by:
Mamdouh El Haj Assad, University of Sharjah, United Arab EmiratesReviewed by:
Kirubakaran V., Gandhigram Rural Institute, IndiaMuthu Manokar A., B. S. Abdur Rahman Crescent Institute of Science and Technology, India
Copyright © 2021 Yang, Wang, Cui, Feng, Su and Ma. This is an open-access article distributed under the terms of the Creative Commons Attribution License (CC BY). The use, distribution or reproduction in other forums is permitted, provided the original author(s) and the copyright owner(s) are credited and that the original publication in this journal is cited, in accordance with accepted academic practice. No use, distribution or reproduction is permitted which does not comply with these terms.
*Correspondence: Chenglian Ma, 2645952175@qq.com