South Africa After Paris—Fracking Its Way to the NDCs?
 Clara Luisa Orthofer
 Daniel Huppmann
 Volker Krey
- 1International Institute for Applied Systems Analysis, Laxenburg, Austria
- 2Technical University of Munich, Munich, Germany
South Africa is facing the triple challenge of (a) fuelling economic development and meeting the growing energy demand; (b) increasing the reliability of the electricity system; and (c) ensuring that domestic greenhouse gas emissions peak no later than 2030 to meet its nationally determined contributions (NDC) under the 2015 Paris Agreement. Recently discovered domestic shale gas reserves are being considered as a potential new energy source to provide clean, reliable and cheap electricity while mitigating greenhouse gas emissions relative to the dominant coal sector. In order to determine if shale gas can play a viable role in solving South Africa's energy trilemma, we apply a country-level version of the integrated assessment model MESSAGEix to analyze and quantify the interdependencies between shale gas, the energy system and South Africa's greenhouse gas emissions trajectory. The data and scripts to generate this study will be made available at https://github.com/tum-ewk/message_ix_south_africa following the publication of this manuscript. Our results indicate that shale gas extraction costs must be below 3 USD/GJ for this energy source to reach a significant share in the fuel mix; this is well below current cost estimates. If, however, low-cost shale gas is available, both coal and low-carbon sources are replaced by natural gas. Whether carbon dioxide emissions increase or decrease as a result depends on the stringency of the climate change mitigation policy in place: without carbon pricing, natural gas replaces coal and mitigates harmful emissions; under high carbon prices, power generation from coal is phased out in any case, and natural gas competes with zero-carbon renewables, leading to an increase of emissions compared to a no-shale scenario.
1. Introduction
South Africa's (SA) economy is characterized as one of the most carbon-intensive in the world (Winkler, 2007; Alton et al., 2014). National CO2 emissions per capita are approximately twice as high as the global average, and CO2 emissions per unit of GDP are close to three times as high (Table 1). Abundant coal resources and a heavily subsidized mining sector used to attract and support energy-intensive industries and an electricity sector based on coal-fired power plants.
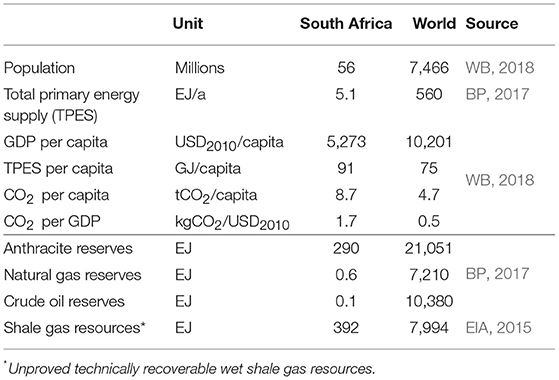
Table 1. Key indicators on SA's energy system in comparison to the world (all indicators refer to 2016).
Today, carbon-intensive consumers are still the major drivers of economic development in South Africa (Klausbruckner et al., 2016). But in spite of plentiful domestic resources, the electricity sector has been experiencing shortages and blackouts due to sub-optimal management and the reliance on old and inefficient coal power plants. This energy shortage peaked in 2008 during the so-called electricity crisis and has since been hampering economic development; security of supply dropped while electricity tariffs were increased high above the rate of inflation1. This development has raised awareness about the urgent need to modernize, diversify and strengthen the South African power plant portfolio (Pegels, 2010; Eberhard et al., 2014).
In addition to this need for a modernization and diversification of the electricity sector, the South African government defined ambitious targets for the decarbonization of the entire energy system. At the 2015 Conference of the Parties in Paris, South Africa confirmed and strengthened its intention to reduce greenhouse gas (GHG) emissions (UNFCCC, 2015). According to the Nationally Determined Contributions (NDC), South Africa envisions national GHG emissions peaking no later than 2030 and decreasing thereafter (UNFCCC, 2015). As shown in Figure 1, the proposed peak-plateau-decline trajectory will demand a significant structural transformation of the South African energy system, as it departs drastically from current emissions projections under “business-as-usual” assumptions (Henneman et al., 2016; Klausbruckner et al., 2016).
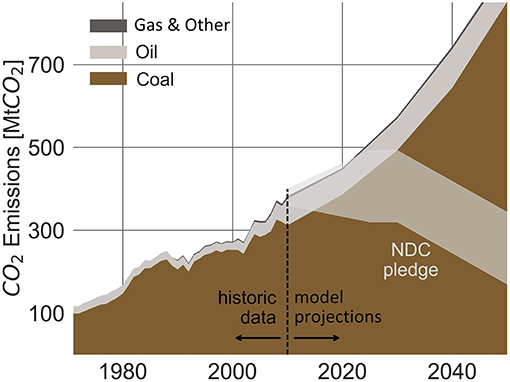
Figure 1. South Africa's energy-related CO2 emissions as recorded in the past (1971–2010) and as calculated for a business-as-usual scenario per emissions source. The fair shaded area shows South Africa's NDC reduction pledge.
One potential structural measure for ending South Africa's energy crisis is currently under governmental review and the subject of heated public debates: industrial-scale hydraulic shale gas fracturing, or fracking, a technique enabling natural gas production from previously uneconomic shale gas resources. Reserves in South Africa are speculated to be possibly found in abundance (up to 392 EJ) across the Karoo Basin in central and southern South Africa (EIA, 2015; Scholes et al., 2016)2. With its lower direct CO2 emissions compared to coal, natural gas from shale formations is considered as a possible remedy for South Africa's energy challenge. It may satisfy the growing energy demand while emitting less direct GHG and other pollutants than the current coal-based power plant fleet (Burnham et al., 2012). On the one hand, promoters point out the benefits of large-scale domestic shale gas development: economic growth, reduced local air pollution (e.g., sulfur, black carbon), and decreasing dependence on imports (Department of Minerals and Resources, 2012). On the other hand, opponents of fracking voice concerns about the potential negative social and environmental impacts resulting from shale gas extraction, such as increased threats of earthquakes, water pollution, ground water table lowering, and methane leakage (Esterhuyse et al., 2016).
The benefits and shortcomings of shale gas utilization are hence to be seen as multi-dimensional problems. There is a potential trade-off between the economic and local climate benefits vs. the potentially detrimental environmental side effects. Shale gas could reduce CO2 emissions by replacing coal as a more efficient and cleaner fuel (Hultman et al., 2011; Burnham et al., 2012; Cathles et al., 2012; O'Sullivan and Paltsev, 2012). Other studies observe that non-CO2 emissions associated with the production of shale gas, most importantly fugitive methane, might increase life-cycle GHG emissions of this fuel to levels above those of coal combustion, offsetting any benefits for the climate (Howarth et al., 2011; Miller et al., 2013; McJeon et al., 2014; Howarth, 2015). These contradicting views pose a challenge to the South African government when designing and implementing an effective carbon mitigation strategy, with the aim of balancing the competing goals of cheap and reliable energy, stable economic development, and a clean and safe environment. In order to support an informed debate and facilitate the decision-making process, the South African government has commissioned scientific assessments to conduct transparent and comprehensive analyses of the effects of shale gas fracking (Department of Minerals and Resources, 2012; Scholes et al., 2016). In the meantime, it placed a moratorium on the granting of licenses for the exploration of shale gas (Department of Energy, 2016a).
In the present work, we evaluate shale gas exploitation as a policy option to end South Africa's energy shortage and mitigate the country's fast-rising greenhouse gas emissions. In contrast to previous studies, we carry out a large-scale scenario analysis of the GHG mitigation potential of shale gas using a country-level application of the open-source Integrated Assessment Modeling framework MESSAGEix. We find that under current cost estimates, shale gas is not economical. However, if shale gas becomes available at low cost, it can impact South Africa's energy related GHG emissions, with the direction of the impact depending on the stringency of the climate policy in place.
The paper is structured as follows: first, a literature review introduces the current status of the South African energy system with special focus on the electricity sector. The literature review further introduces the currently ongoing scientific debate on shale gas development. Next, the model MESSAGEix-South Africa is described, including the underlying data assumptions as well as the parametrization of the scenario ensemble. In chapter four, the model results are presented and compared against the scenarios without any development of shale gas. Chapter five discusses the results and concludes.
2. Literature Review
2.1. South Africa's Energy System
South Africa's energy systems is dominated by it's rich domestic coal resources, with anthracite and other bituminous coal supplying close to 70% of the total primary energy. As a legacy of the economic sanctions and trade embargoes imposed in the mid-1980s to pressure the South African government to end apartheid, South Africa uses close to 15% of its annual domestic coal supply in coal-to-liquid and coal gasification units. In South Africa today, more than 25% of the domestic fuel oil supply is provided through coal-to-liquid plants that turn domestic coal into high-grade liquid fuels (IEA, 2016). To date, natural gas plays a minor role, supplying less than 3% of the primary energy mix; one fifth of that is used for producing fuel oils using gas-to-liquid plants. This low share of natural gas, limited to the industrial sector, is due to a lack of domestic supply and low import capacities (Pollet et al., 2015).
South Africa's power system is run by the state-controlled utility Eskom. In 2015, Eskom owned approximately 91% of South Africa's installed power generation capacity, while municipalities owned 2% and only 3% were held by private companies (Eberhard et al., 2016). The installed power generation capacity is dominated by coal fired power plants (83%), followed by oil and gas fired turbines, renewable power generation facilities and nuclear power plants, resulting in a fuel use for electricity lead by coal (93%), followed by nuclear energy and renewable sources.
As decided by the government and the South African Department of Energy, the development of the South African energy system is guided by the Integrated Energy Plan (IEP). The IEP is a model based macro-economic policy road map and planning framework designed to provide a vision of future energy infrastructure investments for the Republic of South Africa. It was first issued by the Department of Energy in 2003 following a decree in the White Paper on Energy Policy of 1998 (Department of Energy, 2016a). The vision laid out in this report was strongly connected to the underlying input parameters and model assumptions, such as technological and demand development, financial conditions, commodity and emissions costs. These assumptions are subject to change; hence, the IEP requires regular updates. This necessity became painfully obvious during the electricity crisis of 2008, when insufficient power supply caused power outages and forced load shedding. As a response, the Ministry of Energy mandated that the Department of Energy reviews and publishes the IEP on an annual basis. The latest IEP was published in 2016 (Department of Energy, 2016a) (at the time of writing).
One part of the IEP is the Integrated Resource Plan (IRP), a long-term policy document for South Africa's electricity supply strategy and the official government plan for new generation capacity. It was published first in 2012 and an updated version is currently in consultation. This iteration is expected to be finalized in 2019 (Department of Energy, 2013, 2016b). The IRP's main purpose is to identify the optimal investment strategy for the South African power system, given the local, social, economical and technical-engineering constraints. The projections modeled in the IRP provide a possible composition of South Africa's power generation to cover the electricity demand forecast within the next three decades.
To cover the power demand of 520 TWh forecast for 2050 in the baseline scenario, IRP recommends installing 130 GW of additional power generation capacity by 2050, of which approximately one third each should be constituted of wind turbines and gas fired power stations; the remaining third should be supplied by nuclear power stations, solar photovoltaic units (PV) and coal fired power plants (Table 2). While the majority of the required new capacity is expected to be built by Eskom, a significant share is to be installed by Independent Power Producers through the Independent Power Producer Procurement Program (IPPPP), a successful tender process for the installation of required power generation capacity introduced by the South African government in 20113.
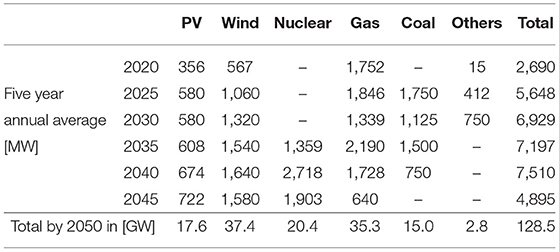
Table 2. Planned 5 year average new build capacities in the base case scenario of the IRP [MW/a] (Department of Energy, 2016b).
The IRP baseline scenario is, just like all four IEP scenarios, based on the assumptions that economically recoverable volumes of shale gas are extracted and that shale gas is available on the South African market at a competitive price. In our analysis, we develop an ensemble of scenarios that highlight the impact and significance of this assumption. We outline alternative scenarios incorporating the possibility that shale gas might not be economically viable or not available for extraction for other reasons such as environmental regulation.
2.2. Shale Gas
A multitude of studies have been conducted on environmental impacts of shale gas and fracking, such as its climate forcing potential (Howarth, 2015), local air pollution (Field et al., 2014; Altieri and Stone, 2016), and effects on the water supply (Vengosh et al., 2014). Most scientific studies base their assessments on data acquired in the US, the only country to produce shale gas at industrial scale today. However, the number of publications focusing on countries such as Australia, Canada, China and the UK is quickly rising, as those countries are eager to increase their production. In the following section, those studies and the three existing reports on the impact of shale gas in South Africa (Altieri and Stone, 2016; Scholes et al., 2016) are reviewed with a focus on live cycle assessments of the environmental factors such as GHG emissions impact, air quality, water use and pollution.
Electricity generated from natural gas has significantly lower direct CO2 emissions from power generation compared to coal or oil combustion, although they are still higher than electricity generated from low to no-carbon sources such as renewables and nuclear fuels (IPCC, 2006). Nevertheless, uncertainty exists about the life-cycle emissions of shale gas, especially if non-CO2 emissions such as fugitive methane emissions are considered. Several studies suggest that life-cycle GHG emissions of electricity from shale gas might be as high as those of electricity generated from conventional natural gas, which is approximately half the GHG emissions per unit compared to electricity produced from coal (Hultman et al., 2011; Jiang et al., 2011; Stephenson et al., 2011; Burnham et al., 2012; Weber and Clavin, 2012; Dale et al., 2013; Laurenzi and Jersey, 2013; Heath et al., 2014). However, some more recent studies find that life-cycle emissions might have been underestimated in previous studies and that fugitive methane emissions might be considerably higher than previously assumed (Pétron et al., 2012; Karion et al., 2013; Miller et al., 2013; Brandt et al., 2014; Schneising et al., 2014). Considering these new estimates, several researcher conclude that electricity from shale gas might have higher live cycle GHG emissions than electricity from coal (Howarth et al., 2011; Miller et al., 2013; McJeon et al., 2014; Howarth, 2015). In their risk assessment on South Africa, Winkler et al. (2016) see shale gas as a climate opportunity if used as a replacement for coal. They, however, evaluate the achievable climate benefit through shale gas fracking as susceptible to the risk of being eroded by fugitive methane emissions. Altieri and Stone (2016) add to this assessment by analyzing the air pollution of shale gas fracking through NOx, particulate matter, and non-methane volatile organic compounds and find that these emissions will worsen local air quality and potentially have negative impacts on human health.
While the direct emissions impact of shale gas fracking is dependent on the scale of methane leakage, concerns about indirect GHG emissions, such as additional emissions from increased energy use or from replacing low-carbon renewable energy sources with shale gas, have been raised (Alvarez et al., 2012; Brandt et al., 2014). Research indicates that those emissions might be decisive for establishing the overall direction of the GHG emissions impact of shale gas (Kersting et al., 2015). Multiple studies that evaluate the combined effect of direct and indirect GHG emissions of shale gas on a global scale find that increases in global supplies of unconventional natural gas will either not significantly reduce the trajectory or might even increase greenhouse gas emissions (e.g., McJeon et al., 2014; Kersting et al., 2015). The same has been found to be true on the national level in analyses of the United States (Newell and Raimi, 2014; Shearer et al., 2014). Our study contributes to literature by analyzing the combined impact of direct and indirect GHG emissions effect of shale gas utilization for South Africa.
Apart from its GHG emissions impact, shale gas fracturing has been related to other serious environmental concerns such as water table lowering, contamination, and the increased risk of earthquakes (Scanlon et al., 2014; Cooper et al., 2016). While the risk of increased occurrences of earthquakes as a result of shale gas fracking is assumed to be low in South Africa, the high water demand and the risk of water resource contamination is especially concerning for a water-scarce country such as South Africa (Durrheim et al., 2016). Approximately 75% of South Africa's shale resources are located in arid areas or regions with high water stress, where already today water resources are barely sufficient to meet demand as potable surface- and groundwater resources are seriously constrained. Therefore, it is questionable if capacity to supply the large amounts of water required for industrial scale shale gas fracking exists (Reig et al., 2014; Hobbs et al., 2016; Calderón et al., 2018). However, further geoscientific analyses and data are required in order to assess to what extent this water scarcity might limit or even prevent economic shale gas production (Hobbs et al., 2016).
3. Methodology
To identify the economic prospects of shale gas development and the associated change in CO2 emissions under climate change mitigation policies, we employ a multi-scenario analysis. We utilize a novel long-term horizon, linear, least-cost integrated assessment model of the South African energy system, MESSAGEix-South Africa. The main objective is to explore the uncertainties connected to shale gas utilization and to identify and evaluate the most relevant factors that impact the potential role of shale gas. Therefore, we developed this model specifically geared toward large scale sensitivity analysis. MESSAGEix-South Africa is well-suited to evaluate the GHG emissions impact of shale gas fracking as it provides a description of the entire energy supply chain. The linear model setup is computationally lean, which is a prerequisite for solving a large number of long-term scenarios to fully explore the ranges of different pathways in terms of emissions and the role of shale gas in the future South African energy system. This detailed scenario analysis is necessary to capture the full picture of system dynamics behind shale gas, the energy system, the economy, and its impact on climate forcing and the entire set of potential outcomes in the face of the uncertainty connected to it.
3.1. Model Description—MESSAGEix-South Africa
MESSAGEix-South Africa is a country-level application of the Integrated Assessment Model MESSAGEix, developed at the International Institute of Applied Systems Analysis (IIASA) over the past four decades. MESSAGEix is a dynamic bottom-up technology based optimization model designed for medium to long-term energy planning and policy analysis that provides a framework to represent energy systems with all their inter-dependencies and correlations. MESSAGEix can describe the entire energy system including resource extraction, trade, conversion, transmission and distribution, and the provision of energy end-use services such as light, space conditioning, industrial process heating, and transportation (Figure 2). The optimization model is solved to find the least-cost solution of satisfying energy demand under various technical, economic and ecological constraints. MESSAGEix-South Africa utilizes the MACRO module of the MESSAGE model introduced by Messner and Schrattenholzer (2000). This allows incorporating the macro-economic feedback from price changes on the demand by solving the two models iteratively. The combined model calculates amongst other variables the required capacity investment, the optimal energy system configuration, and the resulting emissions.
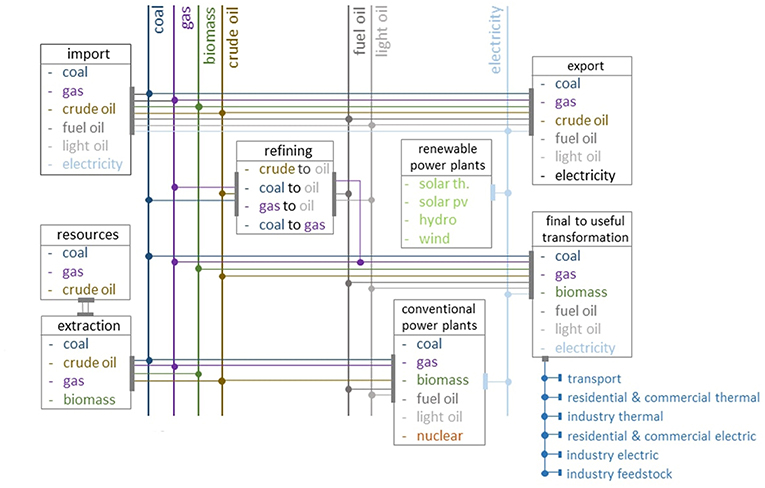
Figure 2. Stylized model work flow chart showing the commodities and technology groups described by the model MESSAGEix-South Africa.
For this analysis, we developed a country-level “stand alone” model of the South African energy system using the open-source MESSAGEix platform (Huppmann et al., 2019): this framework consists of a GAMS implementation of the energy-engineering-economic-environment optimization model; a dedicated database infrastructure for version-controlled management of input assumptions and model results; interfaces with scientific programming languages Python and R for efficient data processing; and a web user interface for visualization and analysis. The modeling platform is geared toward efficient scientific work-flows as well as the highest level of transparency of both input data and modeling results.
To develop the MESSAGEix-South Africa model, we implemented a work-flow to collect data from multiple sources, thereby automating much of the parametrization and calibration of a national energy system model. These data sources include the most recent global version of the MESSAGE model (Krey et al., 2016), energy use statistics provided by the International Energy Agency (IEA, 2016), historical power plant installation data from CARMA (Wheeler and Ummel, 2008; Ummel, 2012), and various national reports and statistics, as described in detail in section 3.2.
In order to adequately describe the utilization of South Africa's vast renewable energy potential for supplying base as well as peak load, and to capture its feedback on the electric sector's variability and reliability, the linearized renewable energy utilization representation suggested by Sullivan et al. (2013) is implemented in the MESSAGEix framework. The implemented methodology incorporates metrics for describing required reliability and variability-balancing in the electricity sector using capacity reserves and flexibility factors. The formulation thus respects system-wide stability effects and ensures the installation of sufficient dispatchable capacity at all times considering the impacts of volatile power generation from wind and solar.
This analysis focuses on the medium-term outlook until 2050, the time frame of relevance for the development of a shale gas industry and the horizon determining if South Africa can reach the emissions trajectory proposed in the NDC. The underlying model extends to 2070 to avoid end-of-time-horizon effects, which might otherwise bias the numerical results.
3.2. Data and Scenario Assumptions
In order to maintain consistency with the data set and most recent analyses of the global MESSAGE model, technology specifications, development costs, and constraints were based on the region “Sub-Saharan Africa” of the global data set (GEA, 2012; Krey et al., 2016). For the same reason, all socio-economic data, such as the development of the population and the GDP (Figure 3), are based on the recently published Shared Socioeconomic Pathways (SSP), a scientific narrative framework of socioeconomic development projections for climate change research (O'Neill et al., 2017; Riahi et al., 2017; van Vuuren et al., 2017). We chose the SSP narratives as they allow us to explain the results of our analysis in the global development context. Of the five available SSP scenarios, we based our assumptions on the “middle of the road” pathway SSP2 which represents a moderate future development (Dellink et al., 2017; Fricko et al., 2017; KC and Lutz, 2017). However, we adjusted parameters, most notably the technology costs, fossil and renewable resource potentials and historically installed capacities, where better data from national sources was available. Given that the power sector is the largest emitter of greenhouse gas emissions, the cost assumptions and technology data for power generation technologies were a focus of the data configuration. Suitable statistics are published together with the IRP (Bedilion et al., 2012; Department of Energy, 2013). The data and scripts to generate this study will be made available at https://github.com/tum-ewk/message_ix_south_africa following the publication of this manuscript.
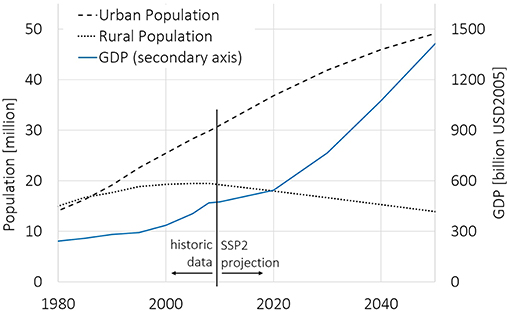
Figure 3. Historic development (1980–2010) of the urban and rural population as well as of the GDP, and the SSP2 projections (2020–2050) of the same (IIASA Energy Program, 2018).
3.2.1. Energy Resources and Potentials
Data on fossil energy commodities considered in the model are based on national and international resource assessments (Table 1). The renewable energy potential of photovoltaic and solar thermal power generation, is based on spatially disaggregated data sets prepared by the Potsdam Institute for Climate Impact Research and the German Aerospace Center (Pietzcker et al., 2014). The renewable energy potential of economic wind power generation, is based on a spatially disaggregated data set prepared by the National Renewable Energy Laboratory (Eurek et al., 2017). Considering the vast wind energy potential of South Africa, only the most profitable sites (on-shore sites located closer than 100 miles to consumption) are considered for this analysis. Given that the available wind power potential was never a limiting bound on the wind power generation, this assumption does not impact the model results.
3.2.2. Shale gas
The shale gas volumes considered for this analysis are based on the shale gas availability assessment by the EIA (2015), which claims that 392 EJ of shale gas, i.e., approximately sixty times South Africa's current primary energy use or close to 70% of global annual primary energy use in 2016, are technically recoverable in South Africa. This estimate includes unproven technically recoverable resources and might therefore be an overestimation of the realistically extractable resource volume (Geel et al., 2013). However, the impact of this overestimation is not significant as the resource volume is, in none of the tested scenarios, the limiting factor for shale gas extraction. The growth limitations for the shale gas industry are based on the growth rates of approximately 2 EJ/a experienced during the development of the major U.S. shale plays, i.e., the Fayetteville, Marcellus, Woodford, Bakken, Haynesville and Barnett plays (Richter, 2015; EIA, 2016a). In our model we limit the South African shale gas extraction during the first decade of production to 50% of the U.S. production growth rates because South Africa does not yet have the necessary gas infrastructure, including long-distance pipelines and local distribution networks. This calculation results in an annual production limit during the first decade of 1 EJ/a and thereafter in an annual growth rate of ±10%, which confirms literature estimates on South Africa's shale gas industry potential (Altieri and Stone, 2016).
3.2.3. Energy Demand
In our model the energy demand is represented as “useful energy” demand, i.e., the demand for energy services such as heating or electric appliances, such that the model endogenously determines the optimal mix of technologies and final energy consumption, under the given constraints on the energy system and policy measures in place. In MESSAGEix-South Africa the demand is split into three sectors: residential & commercial (RC), industrial, and transportation (Table 3). The energy demand of the RC and industrial sectors is subdivided into specific electric and thermal demand as well as consumption of non-energy feed stock (Figure 2). This representation of future energy consumption is extrapolated for South Africa, based on the historical development and the GDP and population forecast for South Africa developed in the SSP2 framework (Figure 3).
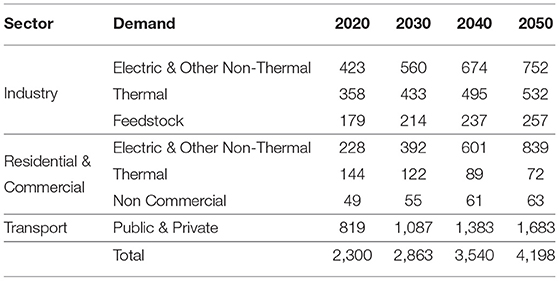
Table 3. Useful energy demand forecast for South Africa under SSP2 scenario assumptions [PJ] (Fricko et al., 2017).
3.2.4. Commodity Trade
MESSAGEix-South Africa is a national application; therefore, it requires assumptions on commodity trade and the global price levels of fossil fuels to close the model. As South Africa is highly dependent on oil imports and is exporting substantial quantities of coal, those assumptions are particularly relevant. For our analysis, global commodity prices and upper bounds on imports and exports are based on the SSP2 scenario. The resulting commodity prices are displayed in Table 4.
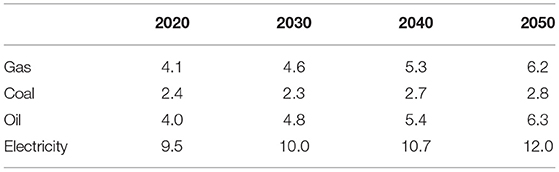
Table 4. Commodity market prices for under SSP2 scenario assumptions [USD2005/GJ] (Fricko et al., 2017).
3.2.5. Greenhouse Gas Emissions
MESSAGEix-South Africa considers CO2 and CH4 emissions emitted by the energy sector. The emissions are calculated “production-based,” i.e., all CO2 and CH4 from fuel combustion and all fugitive CH4 emissions occurring within country-boundaries contribute to the country's GHG emissions budget. For South Africa this method accounts for 99% of all energy related GHG emissions, and for 85 % of total national GHG emissions (Witi et al., 2014; WB, 2018). In order to compare the modeled emissions (considering energy related CO2 and CH4 only) to the GHG trajectory proposed in the NDC, we adjusted the proposed trajectory to the proportional share of non-CO2/CH4 and non-energy-related emissions. Therefore we adjusted the goal of reducing GHG emissions to 398–614 MtCO2 between 2025 to 2030 by 20% to account for the non-CO2 and non-CH4 emissions and for all greenhouse gas emissions emitted by non-energy applications; assuming, that the share of emissions from energy to non-energy applications (85%) as well as between CO2 and CH4 to total GHG emissions (≥ 99%) remains constant as suggested by the historical data (Witi et al., 2014).
The CO2 and CH4 emission factors for stationary combustion, considered in the model, are based on the IPCC (2006) national inventory guidelines; the fugitive CH4 emission factors are based on recent research by Höglund-Isaksson (2017)4. The global warming potential metric used by the model is based on the cumulative forcing potential over 100 years as listed in the IPCC's Fifth Assessment Report (Myhre et al., 2014).
3.2.6. Carbon Price
A suite of policies will be enacted to meet South Africa's emissions mitigation goals; these will include fiscal incentives, regulatory policies and public financing. However, for the purpose of this study we use carbon pricing as a proxy mechanism to represent the effect induced through a balanced policy portfolio. The marginal carbon tax rate proposed in the latest draft of South Africa's carbon tax bill is 9 USD/tCO2(Ministry of Finance, 2017). Taking into account the multiple tax exemptions in the bill, the effective rate is estimated to vary between 0.4 to 3.5 USD/tCO2(WB, 2016). The South African government proposes to raise the carbon tax by 2% above annual inflation during the years between introduction (scheduled for January 2019) and 2022 and a reduced annual increase matching the inflation rate in the years thereafter (Ministry of Finance, 2017). The final decision on the date of introduction will be, however, taking into account the state of the economy and thus be delayed. Therefore, we assume that there will be no carbon price before the model year 2020. In the scenario analysis we test various carbon price levels and project an rise of 5% per year across all sectors and industries.
3.2.7. Carbon Capture and Storage
We consider carbon capture and storage (CCS) technologies in the transformation as well as in the power sector5. Because carbon capture and storage technologies are not yet available at commercial scale, we estimate the first year of operation to be 2030 at the earliest, which is in line with current governmental expectations (Department of Energy, 2016a).
3.3. Scenario Description
Given the numerous uncertainties connected to shale gas exploitation in South Africa, we base our study on an analysis of 3,660 scenarios. Within this scenario ensemble, we vary the two most influential input parameters: the average shale gas extraction cost and the average effective carbon price across a wide range of values. Additionally we conducted a sensitivity analysis evaluating the impact of the applied international trade and discount rate assumptions (Appendix A).
3.3.1. No-Shale-Gas Scenarios
We first construct a set of scenarios which exclude shale gas exploitation in order to provide a reasonable counter-factual with which to assess the implications of shale gas utilization. This no-shale-gas scenario set incorporates 122 introductory carbon price levels ranging from 0 to 60 USD/tCO2 each, increasing at 5% per year. This extensive range reflects (a) the high carbon prices required for limiting global warming to 1.5°C (Aldy et al., 2010), (b) the low effective carbon tax level scheduled for introduction in South Africa (3.5 USD/tCO2) and (c) the current situation of no effective carbon price (Ministry of Finance, 2017).
3.3.2. Shale Gas Scenarios
The shale gas scenarios incorporate shale gas utilization under thirty different extraction cost levels ranging from 1 to 10 USD/GJ and the 122 carbon prices levels introduced in the no-shale-gas scenarios. For the first part of the analysis, we display the results of the entire set of 3,660 scenarios in a temporally aggregated manner in order to create a comprehensive understanding of the impact of shale gas upon the energy system, the GHG emissions and the economy. Then, we reduce the number of scenarios to seven representative carbon price levels for which we show the impact of shale gas costs on the GHG emissions development over the model horizon. Finally, we present the combined impact of the availability of cheap abundant shale gas with and without carbon prices on the power system using six representative scenarios (shale gas extraction cost: 1 & 3 USD/GJ, carbon price: 0, 10 and 30 USD/tCO2).
4. Results
4.1. Reaching the NDC Pledge Without Domestic Shale Gas
The left subplot in Figure 4 shows the relative GHG emission reduction in the no-shale-gas scenarios for seven representative carbon prices relative to the no-shale-gas/no-carbon-price scenario. The figure shows that in all no-shale-gas scenarios the variations in carbon price cause a strong variation in the emissions trajectories. We find that even though any positive carbon price will lead to a reduction in emissions compared to the no-carbon-price scenario, an introductory carbon price of 10 USD/tCO2 (introduction 2020, growing at 5% p.a. thereafter), or above is required in order to transform the emissions trajectory to resemble the trajectory proposed in the NDC.
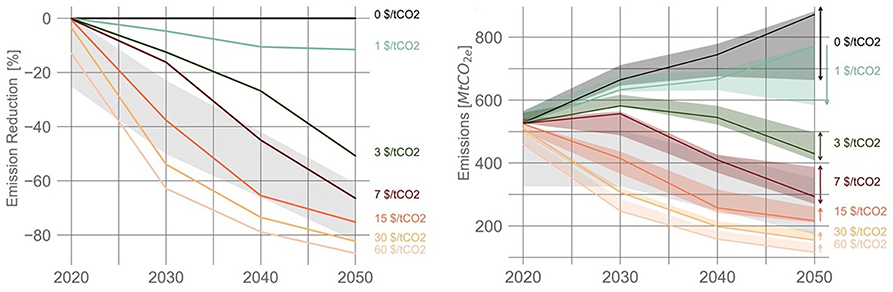
Figure 4. (Left) Energy-related GHG emissions at seven selected carbon prices relative to the zero carbon price scenario in the no-shale gas scenarios. The NDC pledge is shown as the gray shaded area. (Right) Energy-related GHG emissions at seven selected carbon prices under various gas extraction costs. The lines indicate the no-shale-gas scenarios, the shaded areas indicate the emissions range if shale gas is available at various extraction costs. The figure shows that shale gas utilization can decrease emissions at low carbon prices, but increases them at moderate to high carbon price levels. The gray shaded area shows South Africa's NDC reduction pledge (UNFCCC, 2015).
Focusing on the power sector, the introduction of a carbon price leads to a diversification of the fuel mix. In the absence of climate policy, coal will remain the dominant fuel source for power generation, with coal power plant capacities increasing to 100 GW total installed capacity. By 2050, the total annual power output from coal plants increases to 630 TWh by 2050 (Figure 5). With increasing carbon prices and correspondingly higher electricity tariffs, electricity demand decreases relative to the baseline and generation from renewable energy sources provides a growing share of installed capacity. Already a moderate introductory carbon price of 10 USD/tCO2 could reduce power demand by 15% and motivate the installation of over 100 GW of renewable power generation capacity thereby more than halving the power generation from coal by 2050. Additionally, coal power plants with carbon capture and storage (ccs) technology will become economically viable and thus further decrease energy related emissions. This power plant portfolio would require a coal power plant fleet for base load of approximately 45 GW. If the carbon price is introduced at 30 USD/tCO2 the coal power plant fleet will contribute no more than 5% of installed capacity by 2050. Instead, renewables will dominate the power plant fleet with approximately 140 GW of combined installed capacity supported by 70 GW of gas-fired power stations for peak load purposes, respectively.
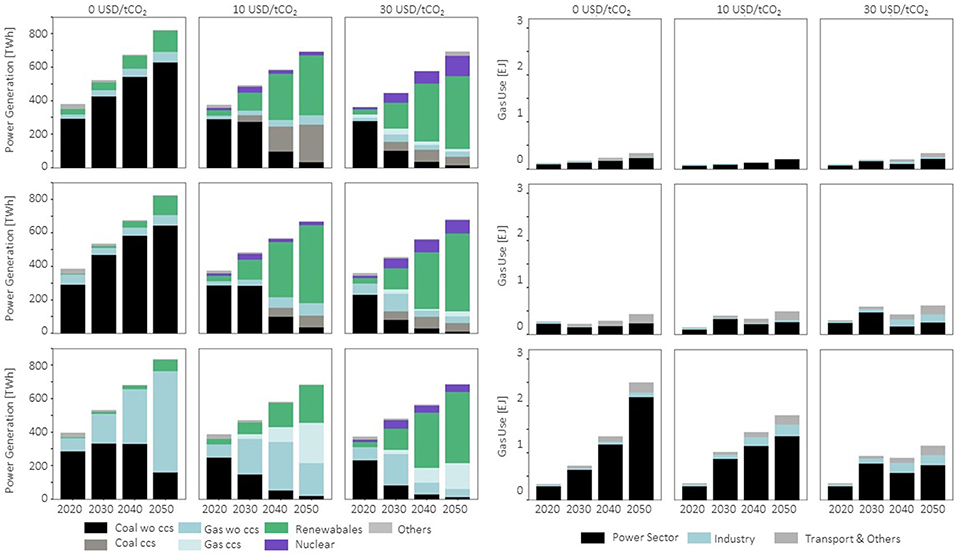
Figure 5. (Left) Power generation and (Right) gas utilization in nine selected scenarios featuring three different carbon prices (from left to right: 0, 10, and 30 USD/tCO2), a scenario set without shale gas (top) and two sets at variable shale gas extraction costs (center: 3 USD/GJ, bottom: 1 USD/GJ).
These no-shale-gas scenarios illustrate that the emissions trajectory pledged in South Africa's NDC can be met without the utilization of shale gas. We find that an effective carbon price of 10 USD/tCO2 installed by 2020 increasing by 5% p.a. to 43 USD/tCO2 by 2050 is sufficient for reducing South Africa's energy-related GHG emissions to the level required for meeting the trajectory proposed in the NDC.
4.2. The Impact of Shale Gas on Emissions and Economic Development
To explain and quantify the combined effect of shale gas under various extraction cost assumptions and a carbon price on the energy system, Figure 6 displays the results of all 3,660 scenarios in terms of primary fossil fuel and renewable energy consumption and the resulting GHG emission mitigation compared to the no-shale-gas no-carbon-price baseline scenario. In order to compare the scenarios comprehensively, all results are displayed aggregated over the model horizon of interest, i.e., the period 2020–2050. Additionally, in order to differentiate between cumulative and inter-temporal dynamic effects, the left and center column display the annual values of the representative model years 2030 and 2050.
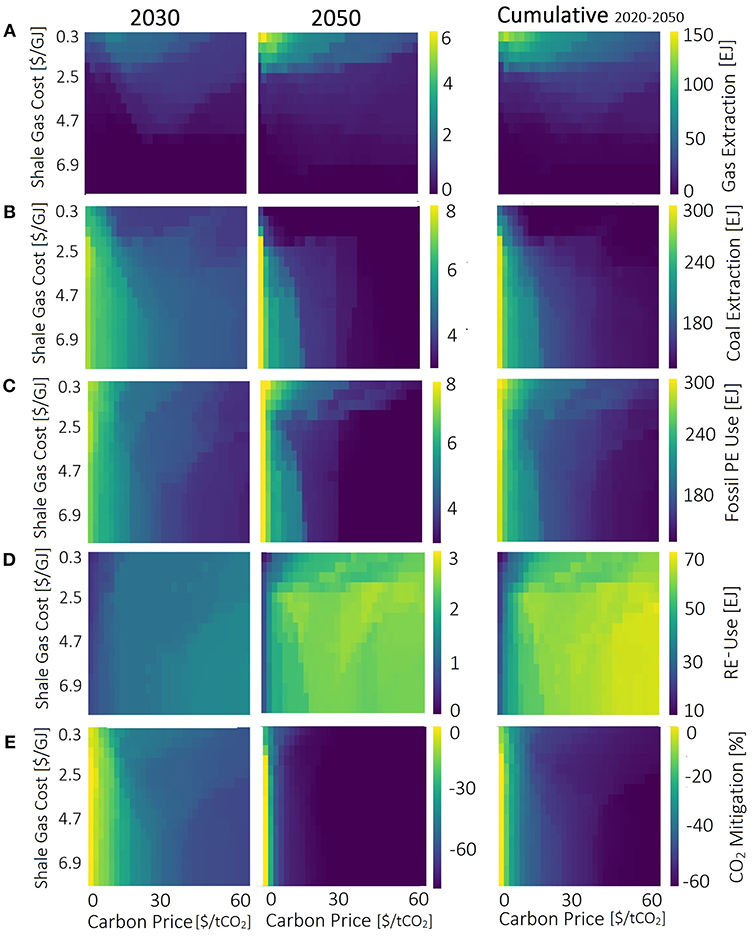
Figure 6. Results of the scenario analysis on the shale gas and coal extraction (A,B), the total fossil primary energy (PE) and the renewable energy (PE) consumption (C,D), and the CO2 emission mitigation (E). (E) Shows the relative change between the scenario results and the no-shale-gas and no-carbon-price baseline scenario. Left: 2030 model results, center: 2050 model results, right: cumulative model results (2020–2050).
The numerical results show that shale gas is economically competitive if variable extraction costs are below 3 USD/GJ (Figure 6A). If shale gas extraction is more expensive, only marginal amounts of shale gas are used. If, however, shale gas can be produced for less than 3 USD/GJ, the economics of shale gas extraction depend on the carbon price: higher extraction costs require higher carbon prices to make shale gas economically favorable compared to other fuels. But if shale gas use is economically viable, it can impact the energy system by increasing as well as decreasing fossil fuel and renewable energy use, depending on the stringency of climate policy in place. Thus, while merely 25 EJ of shale gas will be extracted at 2.5 USD/GJ if no carbon price is in place, about double the amount would be extracted at a carbon cost of 30 USD/tCO2.
Figure 6B shows the aggregate primary fossil energy consumption. Several dynamics can be observed in this plot. Firstly, it shows that primary fossil energy consumption decreases with increasing carbon price. Secondly, it displays that at a carbon price of above 10 USD/ MtCO2primary fossil energy consumption can be decreased by shale gas if prices lie within the range of 2 to 4 USD/GJ as in this range it supplements the renewable power generation facilities with high flexibility demand (here mostly solar power stations without storage). This area can therefore be identified as “sweet spot” around which renewable energy resources maximize the synergy effects with shale gas, thereby reducing the fossil energy consumption and consequently CO2 emissions. However, this effect reverses at shale gas cost below 2 USD/GJ as in those scenarios shale gas displaces the renewable power generation.
If the extraction of abundant shale gas is very cheap (variable extraction costs below 2 USD/GJ), fuel-switching from coal to shale gas is triggered, thereby reducing coal use by up to 30% (Figure 6B). Simultaneously, it economically outperforms renewable energy sources (Figure 6D), thereby reducing renewable low- and no-carbon technology deployment by up to one third and increasing overall primary fossil energy consumption.
Additionally, the energy demand is elastic and therefore responds with an increase to the availability of low cost shale gas. These three overlaying effects slightly decrease GHG emissions compared to the no-shale-gas scenarios if carbon prices are below 5 USD/tCO2, as in such scenarios shale gas primarily replaces coal rather than renewable energy sources. If, in contrast, carbon prices are above 5 USD/tCO2 the effect is inverted and overall energy-related GHG emissions are increased (Figure 6E) relative to a scenario with equivalent carbon prices and no shale gas availability. These effects hold true for most scenarios; however, when shale gas extraction costs are between 2 and 3 USD/GJ and carbon prices are between 10 to 20 USD/tCO2 primary energy consumption of fossil fuels is decreased by shale gas utilization as the combination of carbon price and shale gas extraction costs induce an increase of renewable energy utilization that surpasses the demand increase (Figures 6C,D).
Figure 6E depicts the CO2 mitigation relative to the no-shale-gas scenarios. It shows that CO2 emissions decrease rapidly with increasing carbon prices but that this effect can be impaired by the availability of low costs shale gas. Thus, while at a carbon price of 20 USD/tCO2 without shale gas, 50–60% could be mitigated, the availability of low cost shale gas could reduce this desired effect by up to 10%.
The gross domestic product (GDP) as a measure of energy system supply costs and elastic demand is affected by carbon prices and shale gas costs such that the amount of CO2 emitted per USD of GDP generated is increased by shale gas use at carbon prices above 10 USD/tCO26.
To summarize, the results of this scenario analysis show that shale gas would only be introduced to the South African energy system if extraction costs are below 3 USD/GJ. Furthermore we show that the cumulative GHG emissions over the next decades are strongly reduced with increasing carbon prices but that they are also influenced by shale gas use: at carbon prices above 10 USD/tCO2 cheap abundant shale gas use increases CO2 emissions and thus diminishes emission mitigation measures (Figure 6E).
4.3. Deployment of Shale Gas Over Time
The right hand side subplot in Figure 4 summarizes the energy-related GHG emissions under seven carbon price trajectories with various gas extraction costs. It visualizes the impact imposed by carbon price and shale gas extraction costs upon the emissions trajectory over time. While the left hand subplot in Figure 4 shows the relative emission reduction, the right plot displays the development of the absolute GHG emissions of the scenario sets. The figure displays the temporal disaggregation of what has been found before: shale gas utilization can impact South Africa's energy-related GHG emissions in either direction depending on the carbon price and the shale gas extraction costs. While at low carbon prices, the availability of shale gas can lower South Africa's GHG emissions, the emissions could increase compared to the no-shale-gas-baselines if carbon prices of 3 USD/tCO2 and above are in place.
4.3.1. Shale Gas Extraction
The right hand side plot in Figure 5 shows the development of gas use for various carbon prices and extraction costs. It indicates the high price sensitivity of shale gas use. Only if shale gas extraction is very cheap (around 1 USD/GJ), shale gas extraction is economically competitive to coal by 2020. Thus, only then the technological extraction constraint7 becomes binding. In the following decades the carbon price remains a decisive impact factor to shale gas use: without a carbon price, shale gas extraction increases gradually over time, such that more gas is used in later decades compared to scenarios with a carbon price; but the introduction and deployment of shale gas is more rapid during the first decades if a carbon price is introduced.
4.3.2. The Power Sector
In the following the development of the power sector is analyzed for the six scenarios [carbon price: 0, 10, and 60 USD/tCO2; shale gas extraction costs: low (1 USD/GJ) and moderate (3 USD/GJ)] displayed in the right hand side plot in Figure 5, that where not discussed in the no-shale gas scenario section.
In a no-carbon-price scenario, moderately priced shale gas (3 USD/GJ) has a small to negligible impact on the power system. Over the entire time horizon the majority of the electricity remains to be produced by coal fired power plants (80%). At a carbon price of 10 USD/tCO2 renewable power generation multiplies to approximately 60% of the total power demand of 2050. Supported by gas power plants, renewable power reduces coal power generation to below 10% of total installed capacity. If carbon prices increase further to 30 USD/tCO2, coal power generation could diminish by 2050 as renewable and gas power stations are complemented by nuclear power facilities to meet electricity demand.
If low-cost shale gas (1 USD/GJ) is available in abundance, gas-fired power plants will dominate South Africa's future power generation fleet at a no and moderate carbon price. In both scenarios, the low cost shale gas replaces the otherwise dominating power source. Without a carbon price in place, low-cost shale gas will supersede the otherwise predominant power generation from coal. At a carbon price of 10 USD/tCO2 and above the gas-fired power stations will not only economically out-compete coal power plants but also crowd out renewables, therefore displacing both technologies. At a carbon price of 30 USD/tCO2 a small share of nuclear power will supplement a power plant fleet constituting of gas ccs and renewable power plants (Figure 5).
5. Discussion
“A model is a simplification or approximation of reality and hence will not reflect all of reality.” (Burnham and Anderson, 2002). MESSAGEix-South Africa, as any other model, is no more than a quantitative best estimate of the development of South Africa's complex energy system. While MESSAGEix-South Africa's computationally lean set up is very suitable for the wide range scenario analysis, the restrained parameter choice also poses some caveats that will be discussed in the following.
First, MESSAGEix-South Africa is an primarily an energy system model that also allows for a simplified emissions assessment. However, in our model, CO2 and CH4 emissions from the energy system only are calculated and analyzed. As those emissions add up to more than 80% of total annual emissions including land use, land use change and forestry in South Africa we find the considered emissions sufficient for our study (Witi et al., 2014). In order to evaluate the fitness of the South African energy system to contribute it's fair share to meeting the emissions trajectory proposed in the NDC, we compared the modeled emissions with a reduced NDC trajectory representing the energy sectors emissions share. Thus, we assumed, that the ratio between energy related CO2 and CH4 emissions to total GHG emissions will remain constant within the next decade. We base this assumption on the historical development between 2000 and 2010 described in South Africa's emissions inventory (Witi et al., 2014). Within the documented period the share of emissions included in MESSAGEix-South Africa to total GHG emissions has remained between 79 and 83%.
Also, MESSAGEix-South Africa is a single node stand alone representation of the South African energy system. Thus, commodity transport infrastructure, such as gas pipelines and power grids, are not modeled. As infrastructure development is however a crucial aspect for an energy system, we included mathematical bounds to describe the critical infrastructure constraints.
Further, our analysis focuses on the technical feasibility of the power system to contribute it's fair share to South Africa's efforts of meeting the NDC emission targets. Thus, our model assesses the different energy resources available and finds the least cost supply strategy of the energy demand under the given technical constraints laid out in the model description (section 3.2). By applying the implemented growth constraints for technology change and user adaption, the model results reflect the technical and social implementability. However, our technology restraints are based on data describing historic developments and best estimates found in literature. Thus, in the light of South Africa's lack of a experience in gas infrastructure implementation, the applied growth rates for e.g., a potential shale gas industry might be misjudging actual construction capacities. However, we find, that while a change in the technological growth bounds can impact the results, it does not impact the underlying effects described in this paper.
Last, MESSAGEix-South Africa is a stand alone country model. Thus, imports as well as exports cannot be modeled endogenously but have to be predefined. For this analysis we assumed constant imports as well as exports. While this is a clear caveat of any stand alone country model, the conducted sensitivity analysis on the trade constraints shows that the dynamics described in the paper are robust against alternative assumptions on trade and global commodity prices. Therefore it can be assumed, that in case of a change in trade volumes South Africa's overall resource extraction level and thus emissions would change, but, the observed effects would remain the same. We address this shortcoming of using a country model by applying a sensitivity analysis with respect to trade assumptions that are summarized in Appendix A.
6. Conclusions and Outlook
South Africa is considering utilizing its shale gas reserves to reduce its high greenhouse gas emissions and initiate a downward shift in emissions in line with its GHG mitigation pledge submitted to the United Nations Framework Convention on Climate Change. In this paper, we evaluate the consequences of introducing shale gas upon South Africa's energy-related GHG emissions and the related implications for South Africa's ambitions to fulfill the NDC pledges: reduce greenhouse gas emissions to 398–614 MtCO2-e, including land use, land use change and forestry, over the period 2025-2030 (UNFCCC, 2015). In our impact assessment we extend previous research on South Africa by constructing a technology-specific assessment model of the South African energy system that incorporates global development trends through projections from the SSP2 pathway. Unlike previous studies, this study evaluates several thousand scenarios to capture the dynamics behind shale gas costs, carbon prices and the energy system.
Our model setup determines the interaction between growing demand for energy services in the baseline scenario with mitigation policies and availability of shale gas, in line with the triple goal of providing clean, cheap and reliable energy to support economic development. The macro-economic feedback captures the impact of lower or higher energy costs depending on shale gas availability as well as the stringency of mitigation policy. Energy prices for consumers and distributional effects depend on a range of policy choices concerning the design of these carbon prices and the recycling of carbon price revenue. Results indicate that fulfilling the NDC pledge implies low direct GDP losses in most cases compared to a no-policy baseline. However, the model setup does not consider benefits stemming from an better environment and public health improvement, which are not captured in GDP.
The no-shale-gas scenarios confirm and extend the findings of previous research: a carbon price can effectively reduce South Africa's energy-related GHG emissions (Merven et al., 2014; Henneman et al., 2016). As already described in literature, we confirm that already a moderate carbon price of 10 USD/tCO2 (in 2020, growing at 5% p.a.) could reduce the South African GHG emissions by 60 % compared to the BAU (no-shale-gas and no-carbon-price) scenario, thus, fulfilling the NDC pledge (Pegels, 2010). Additionally, our systematic sensitivity analysis adds to the literature by allowing for a detailed impact assessment on effects that carbon prices have upon the country's power system and the energy supply chain.
The shale gas scenarios indicate that if shale gas is abundant at low cost it can play a significant role in South Africa's energy future, thereby confirming for South Africa what has previously been found for other countries (Jacoby et al., 2012; Baranes et al., 2017). However, we find that for shale gas to have a large impact, variable extraction costs have to lie well below 3 USD/GJ. While shale gas extraction costs experienced in the United States range between 2 to 6 USD/GJ (EIA, 2016b), current estimates on shale gas extraction costs considering the South African geology and infrastructure range between 4 to 10 USD/GJ (Scholes et al., 2016). This highlights that lowering extraction costs below current estimates would be critical for shale gas to play a substantial role. However, from today's perspective, this technological development seems very unlikely. Alas, if shale gas become available at such low prices and if the required vast infrastructure can be provided in time, the effect on the greenhouse gas emissions depends on the climate policy in place. We find that under a modestly ambitious climate policy (carbon prices below 5 USD/tCO2 in 2020) shale gas could help lower South Africa's GHG emissions by replacing coal as the primary fuel source.8 However, this reduction will not be sufficient to meet the envisioned trajectory. But under a more ambitious climate policy, which is necessary for fulfilling the NDC pledge, shale gas is competing with low-carbon fuels such as renewable energy sources, thereby leading to comparatively higher GHG emissions and a delay in renewable energy deployment. Therefore, it would be necessary to tighten climate policy and the suggested carbon price in order to achieve the same GHG emissions reduction if low cost shale gas is available.
Author Contributions
CO developed the MESSAGEix South Africa model, implemented the scenarios, and coordinated the writing of the manuscript. DH and VK advised on the design of the scenario protocol and contributed to the manuscript.
Conflict of Interest Statement
The authors declare that the research was conducted in the absence of any commercial or financial relationships that could be construed as a potential conflict of interest.
The reviewer HM declared a past co-authorship with one of the authors VK to the handling editor.
Acknowledgments
Part of the research was developed in the Young Scientists Summer Program at the International Institute for Systems Analysis, Laxenburg (Austria) with financial support from the Austrian National Member Organization and the Peccei Award. We thank Behnam Zakeri (IIASA) for his help on the MACRO configuration.
Supplementary Material
The Supplementary Material for this article can be found online at: https://www.frontiersin.org/articles/10.3389/fenrg.2019.00020/full#supplementary-material
Footnotes
1. ^The nominal price of electricity increased by over 330 % between the financial years 2008/09 and 2015/16 (ESKOM, 2018).
2. ^The estimates of the technically recoverable shale gas reserves themselves vary drastically between sources: while the EIA (2015) estimates up to 392 EJ of shale gas to be possibly recoverable, de Kock et al. (2017) find in their assessment proof for no more than 13 EJ to be exploitable with current technical measures.
3. ^The IPPPP is set up to procure renewable and non-renewable power generation capacity through bid rounds. Each bid round is designed to a determined size differentiated by technology. Between the first bid round in 2011 and the end of the fourth bid round in 2017, 6.3 GW of renewable power projects could be procured through the IPPPP of which 3.2 GW had been constructed and connected to the grid by the end of 2017 (IRENA, 2018).
4. ^Höglund-Isaksson (2017) calculates the fugitive methane emissions as follows: coal mining 2.36 ktCH4/Mt, natural gas extraction 0.05 ktCH4/PJ, shale gas fracking 0.32 ktCH4/PJ.
5. ^CCS-capable fuel transformation technologies available to the model are: coal to methanol, synthetic liquids (coal to light and fuel oil) and gas to methanol. CCS-capable power plants technologies available to the model are: coal, integrated coal gasification and natural gas combined-cycle power plants.
6. ^It should be noted that the GDP effects described here do not include benefits from reduced climate change impacts or advantages and disadvantages connected to mitigation action (e.g., reduced air pollution and associated health and environmental impacts).
7. ^1 EJ in the first year increasing by 10% annually.
8. ^Considering CO2 and CH4 emissions from combustion as well as fugitive CH4 emissions from the extraction process.
References
Aldy, J., Ley, E., and Parry, I. (2010). What is the Role of Carbon Taxes in Climate Change Mitigation? PREM notes no. 2. Washington, DC: World Bank Group. Available online at: http://documents.worldbank.org/curated/en/214261468325275914/What-is-the-role-of-carbon-taxes-in-climate-change-mitigation
Altieri, K. E., and Stone, A. (2016). Prospective air pollutant emissions inventory for the development and production of unconventional natural gas in the Karoo Basin, South Africa. Atmospher. Environ. 129, 34–42. doi: 10.1016/j.atmosenv.2016.01.021
Alton, T., Arndt, C., Davies, R., Hartley, F., Makrelov, K., Thurlow, J., et al. (2014). Introducing carbon taxes in South Africa. Appl. Energy 116, 344–354. doi: 10.1016/j.apenergy.2013.11.034
Alvarez, R. A., Pacala, S. W., Winebrake, J. J., Chameides, W. L., and Hamburg, S. P. (2012). Greater focus needed on methane leakage from natural gas infrastructure. Proc. Natl. Acad. Sci. U.S.A. 109, 6435–6440. doi: 10.1073/pnas.1202407109
Baranes, E., Jacqmin, J., and Poudou, J.-C. (2017). Non-renewable and intermittent renewable energy sources: friends and foes? Energy Policy 111, 58–67. doi: 10.1016/j.enpol.2017.09.018
Bedilion, R., Booras, G., Coleman, T., Lyons, C., Nguyen, B., and Ramachandran, G. (2012). Power Generation Technology Data for Integrated Resource Plan of South Africa: Final Technical Update. Technical report, Electric Power Research Institute, Palo Alto, CA.
BP (2017). Statistical Review of World Energy. Available online at: http://www.bp.com/en/global/corporate/energy-economics/statistical-review-of-world-energy.html
Brandt, A. R., Heath, G. A., Kort, E. A., O'Sullivan, F., Pétron, G., Jordaan, S. M., et al. (2014). Energy and environment. Methane leaks from North American natural gas systems. Science (New York, N.Y.) 343, 733–735. doi: 10.1126/science.1247045
Burnham, A., Han, J., Clark, C. E., Wang, M., Dunn, J. B., and Palou-Rivera, I. (2012). Life-cycle greenhouse gas emissions of shale gas, natural gas, coal, and petroleum. Environ. Sci. Technol. 46, 619–627. doi: 10.1021/es201942m
Burnham, K. P., and Anderson, D. R. (2002). Model Selection and Multimodel Inference: A Practical Information-Theoretic Approach. New York, NY: Springer-Verlag.
Calderón, A. J., Guerra, O. J., Papageorgiou, L. G., and Reklaitis, G. V. (2018). Disclosing water-energy-economics nexus in shale gas development. Appl. Energy 225, 710–731. doi: 10.1016/j.apenergy.2018.05.001
Cathles, L. M., Brown, L., Taam, M., and Hunter, A. (2012). A Commentary on “The Greenhouse-Gas Footprint of Natural Gas in Shale Formations” by R.W. Howarth, R. Santoro, and Anthony Ingraffea. Clim. Change 113, 525–535. doi: 10.1007/s10584-011-0333-0
Cooper, J., Stamford, L., and Azapagic, A. (2016). Shale gas: a review of the economic, environmental, and social sustainability. Energy Technol. 4, 772–792. doi: 10.1002/ente.201500464
Dale, A. T., Khanna, V., Vidic, R. D., and Bilec, M. M. (2013). Process based life-cycle assessment of natural gas from the Marcellus Shale. Environ. Sci. Technol. 47, 5459–5466. doi: 10.1021/es304414q
de Kock, M. O., Beukes, N. J., Adeniyi, E. O., Cole, D., Gotz, A. E., Geel, C., et al. (2017). Deflating the shale gas potential of South Africa's Main Karoo basin. South Afr. J. Sci. 113, 1–12. doi: 10.17159/sajs.2017/20160331
Dellink, R., Chateau, J., Lanzi, E., and Magné, B. (2017). Long-term economic growth projections in the shared socioeconomic pathways. Glob. Environ. Change 42, 200–214. doi: 10.1016/j.gloenvcha.2015.06.004
Department of Energy (2013). Integrated Resource Plan (IRP), 2010-2030. Available online at: http://www.doe-irp.co.za/content/IRP2010_updatea.pdf
Department of Energy (2016a). Integrated Energy Plan (IEP). Available online at: http://www.doe-irp.co.za/content/IRP2010_updatea.pdf
Department of Energy (2016b). Integrated Resource Plan (IRP) Update. Available online at: http://www.energy.gov.za/IRP/2016/Draft-IRP-2016-Assumptions-Base-Case-and-Observations-Revision1.pdf
Department of Minerals Resources (2012). Investigation of Hydraulic Fracturing. Available online at: http://www.eisourcebook.org/cms/South%20Africa%20report%20re.%20Karoo%20basin%20fracking.pdf
Durrheim, R., Doucouré, M., and Midzi, V. (2016). “Erthquakes,” in Shale Gas Development in the Central Karoo, eds. R. Scholes, P. Lochner, G. Schreiner, L. Snyman-Van der Walt, and M. de Jager (Stellenbosch: CSIR), 27–28.
Eberhard, A., Gratwick, K., Morella, E., and Antmann, P. (2016). Independent Power Projects in Sub-Saharan Africa: Lessons from Five Key Countries. Washington, DC: The World Bank.
Eberhard, A., Kolker, J., and Leigland, J. (2014). South Africa's Renewable Energy IPP Procurement Program: Success Factors and Lessons. Washington, DC: Public-Private Infrastructure Advisory Facility and The World Bank Group. Available online at: URL http://www.gsb.uct.ac.za/files/PPIAFReport.pdf
EIA (2015). Technically Recoverable Shale Oil and Shale Gas Resources: South Africa. Available online at: https://www.eia.gov/analysis/studies/worldshalegas/pdf/South_Africa_2013.pdf
EIA (2016a). Online Database - Shale Gas Production. Available online at: https://www.eia.gov/dnav/ng/ng_prod_shalegas_s1_a.htm
EIA (2016b). Trends in U.S. Oil and Natural Gas Upstream Costs. Available online at: https://www.eia.gov/analysis/studies/drilling/pdf/upstream.pdf
ESKOM (2018). Tariffs and Charges. Available online at: http://www.eskom.co.za/CustomerCare/TariffsAndCharges/Pages/Tariff_History.aspx
Esterhuyse, S., Avenant, M., Redelinghuys, N., Kijko, A., Glazewski, J., Plit, L., et al. (2016). A review of biophysical and socio-economic effects of unconventional oil and gas extraction - implications for South Africa. J. Environ. Manage. 184(Pt 2):419–430. doi: 10.1016/j.jenvman.2016.09.065
Eurek, K., Sullivan, P., Gleason, M., Hettinger, D., Heimiller, D., and Lopez, A. (2017). An improved global wind resource estimate for integrated assessment models. Energy Econ. 64, 552–567. doi: 10.1016/j.eneco.2016.11.015
Field, R. A., Soltis, J., and Murphy, S. (2014). Air quality concerns of unconventional oil and natural gas production. Environ. Sci. Process. Impacts 16, 954–969. doi: 10.1039/C4EM00081A
Fricko, O., Havlik, P., Rogelj, J., Klimont, Z., Gusti, M., Johnson, N., et al. (2017). The marker quantification of the shared socioeconomic pathway 2: a middle-of-the-road scenario for the 21st century. Glob. Environ. Change 42, 251–267. doi: 10.1016/j.gloenvcha.2016.06.004
GEA (2012). Global Energy Assessment: Toward a Sustainable Future. Cambridge, Laxenburg: Cambridge University Press and International Institute for Applied Systems Analysis.
Geel, C., Schulz, H.-M., Booth, P., deWit, M., and Horsfield, B. (2013). Shale gas characteristics of permian black shales in South Africa: results from recent drilling in the Ecca Group (Eastern Cape). Energy Proc. 40, 256–265. doi: 10.1016/j.egypro.2013.08.030
Heath, G. A., O'Donoughue, P., Arent, D. J., and Bazilian, M. (2014). Harmonization of initial estimates of shale gas life cycle greenhouse gas emissions for electric power generation. Proc. Natl. Acad. Sci. U.S.A. 111, E3167–E3176. doi: 10.1073/pnas.1309334111
Henneman, L. R., Rafaj, P., Annegarn, H. J., and Klausbruckner, C. (2016). Assessing emissions levels and costs associated with climate and air pollution policies in South Africa. Energy Policy 89, 160–170. doi: 10.1016/j.enpol.2015.11.026
Hobbs, P., Day, E., Rosewarne, P., Esterhuyse, S., Schulze, R., Day, J., et al. (2016). “Water resources,” in Shale Gas Development in the Central Karoo, eds. R. Scholes, P. Lochner, G. Schreiner, L. Snyman-Van der Walt, and M. de Jager (Stellenbosch: CSIR), 5.1–5.123.
Höglund-Isaksson, L. (2017). Bottom-up simulations of methane and ethane emissions from global oil and gas systems 1980 to 2012. Environ. Res. Lett. 12:024007. doi: 10.1088/1748-9326/aa583e
Howarth, R. (2015). Methane emissions and climatic warming risk from hydraulic fracturing and shale gas development: implications for policy. Energy Emission Cont. Technol. 3, 45–54. doi: 10.2147/EECT.S61539
Howarth, R. W., Santoro, R., and Ingraffea, A. (2011). Methane and the greenhouse-gas footprint of natural gas from shale formations. Clim. Change 106, 679–690. doi: 10.1007/s10584-011-0061-5
Hultman, N., Rebois, D., Scholten, M., and Ramig, C. (2011). The greenhouse impact of unconventional gas for electricity generation. Environ. Res. Lett. 6:049504. doi: 10.1088/1748-9326/6/4/049504
Huppmann, D., Gidden, M., Fricko, O., Kolp, P., Orthofer, C., Pimmer, M., et al. (2019). The MESSAGEix integrated assessment model and the ix modeling platform (ixmp) an open framework for integrated and cross-cutting analysis of energy, climate, the environment, and sustainable development. Environ. Model. Softw. 112, 143–156. doi: 10.1016/j.envsoft.2018.11.012
IIASA Energy Program (2018). SSP Public Database (Version 1.1). Available online at: https://tntcat.iiasa.ac.at/SspDb/
IPCC (2006). Revised 2006 IPCC Guidelines for National Greenhouse Gas Inventories: The Workbook (Volume 2). Available online at: https://www.ipcc-nggip.iges.or.jp/public/2006gl/
IRENA (2018). Renewable Energy Auctions: Cases From Sub-Saharan Africa. Abu Dhabi: International Renewable Energy Agency.
Jacoby, H. D., O'Sullivan, F. M., and Paltsev, S. (2012). The influence of shale gas on U.S. energy and environmental policy. Econ. Energy Environ. Policy 1, 37–51. doi: 10.5547/2160-5890.1.1.5
Jiang, M., Michael Griffin, W., Hendrickson, C., Jaramillo, P., VanBriesen, J., and Venkatesh, A. (2011). Life cycle greenhouse gas emissions of Marcellus shale gas. Environ. Res. Lett. 6:034014. doi: 10.1088/1748-9326/6/3/034014
Karion, A., Sweeney, C., Pétron, G., Frost, G., Michael Hardesty, R., Kofler, J., et al. (2013). Methane emissions estimate from airborne measurements over a western United States natural gas field. Geophys. Res. Lett. 40, 4393–4397. doi: 10.1002/grl.50811
KC, S., and Lutz, W. (2017). The human core of the shared socioeconomic pathways: population scenarios by age, sex and level of education for all countries to 2100. Glob. Environ. Change 42, 181–192. doi: 10.1016/j.gloenvcha.2014.06.004
Kersting, J., Duscha, V., Schleich, J., and Keramidas, K. (2015). The Impact of Shale Gas on the Costs of Climate Policy. Available online at: https://www.umweltbundesamt.de/sites/default/files/medien/378/publikationen/climate_change_03_2015_the_impact_of_shale_gas_1.pdf
Klausbruckner, C., Annegarn, H., Henneman, L. R., and Rafaj, P. (2016). A policy review of synergies and trade-offs in South African climate change mitigation and air pollution control strategies. Environ. Sci. Policy 57, 70–78. doi: 10.1016/j.envsci.2015.12.001
Krey, V., Havlik, P., Fricko, O., Zilliacus, J., Gidden, M., Strubegger, M., et al. (2016). MESSAGE-GLOBIOM 1.0 Documentation. Laxenburg: International Institute for Applied Systems Analysis.
Laurenzi, I. J., and Jersey, G. R. (2013). Life cycle greenhouse gas emissions and freshwater consumption of Marcellus shale gas. Environ. Sci. Technol. 47, 4896–4903. doi: 10.1021/es305162w
McJeon, H., Edmonds, J., Bauer, N., Clarke, L., Fisher, B., Flannery, B. P., et al. (2014). Limited impact on decadal-scale climate change from increased use of natural gas. Nature 514, 482–485. doi: 10.1038/nature13837
Merven, B., Moyo, A., Stone, A., Dane, A., and Winkler, H. (2014). “The socio-economic implications of mitigation in the power sector including carbon taxes in South Africa,” in Working Paper for CDKN Projecton Linking Sectoral and Economy-Wide Models (Cape Town).
Messner, S., and Schrattenholzer, L. (2000). MESSAGE-MACRO: linking an energy supply model with a macroeconomic module and solving it iteratively. Energy 25, 267–282. doi: 10.1016/S0360-5442(99)00063-8
Miller, S. M., Wofsy, S. C., Michalak, A. M., Kort, E. A., Andrews, A. E., Biraud, S. C., et al. (2013). Anthropogenic emissions of methane in the United States. Proc. Natl. Acad. Sci. U.S.A. 110, 20018–20022. doi: 10.1073/pnas.1314392110
Ministry of Finance (2017). Draft Carbon Tax Bill. Available online at: http://www.treasury.gov.za/public%20comments/CarbonTaxBll2017/Draft%20Carbon%20Tax%20Bill%20December%202017.pdf
Myhre, G., Shindell, D., Bréon, F.-M., Collins, W., Fuglestvedt, J., Huang, J., et al. (2014). “Anthropogenic and natural radiative forcing,” in Climate Change 2013, eds. T. Stocker, D. Qin, G.-K. Plattner, M. M. Tignor, S. K. Allen, J. Boschung, A. Nauels, Y. Xia, V. Bex, and P. M. Midgley (Cambridge: Cambridge University Press), 659–740.
Newell, R. G., and Raimi, D. (2014). Implications of shale gas development for climate change. Environ. Sci. Technol. 48, 8360–8368. doi: 10.1021/es4046154
O'Neill, B. C., Kriegler, E., Ebi, K. L., Kemp-Benedict, E., Riahi, K., Rothman, D. S., et al. (2017). The roads ahead: narratives for shared socioeconomic pathways describing world futures in the 21st century. Glob. Environ. Change 42, 169–180. doi: 10.1016/j.gloenvcha.2015.01.004
O'Sullivan, F., and Paltsev, S. (2012). Shale gas production: potential versus actual greenhouse gas emissions. Environ. Res. Lett. 7:044030. doi: 10.1088/1748-9326/7/4/044030
Pegels, A. (2010). Renewable energy in South Africa: potentials, barriers and options for support. Energy Policy 38, 4945–4954. doi: 10.1016/j.enpol.2010.03.077
Pétron, G., Frost, G., Miller, B. R., Hirsch, A. I., Montzka, S. A., Karion, A., et al. (2012). Hydrocarbon emissions characterization in the Colorado Front Range: a pilot study. J. Geophys. Res. 117:D04304. doi: 10.1029/2011JD016360
Pietzcker, R. C., Stetter, D., Manger, S., and Luderer, G. (2014). Using the sun to decarbonize the power sector: the economic potential of photovoltaics and concentrating solar power. Appl. Energy 135, 704–720. doi: 10.1016/j.apenergy.2014.08.011
Pollet, B. G., Staffell, I., and Adamson, K.-A. (2015). Current energy landscape in the Republic of South Africa. Int. J. Hydrog. Energy 40, 16685–16701. doi: 10.1016/j.ijhydene.2015.09.141
Reig, P., Luo, T., and Proctor, J. N. (2014). Global shale gas development: Water availability and business risks. https://www.wri.org/publication/global-shale-gas-development-water-availability-business-risks#
Riahi, K., van Vuuren, D. P., Kriegler, E., Edmonds, J., O'Neill, B. C., Fujimori, S., et al. (2017). The shared socioeconomic pathways and their energy, land use, and greenhouse gas emissions implications: an overview. Glob. Environ. Change 42, 153–168. doi: 10.1016/j.gloenvcha.2016.05.009
Richter, P. M. (2015). From boom to bust? A critical look at US shale gas projections. Econ. Energy Environ. Policy 4, 1–24. doi: 10.5547/2160-5890.4.1.pric
Scanlon, B. R., Reedy, R. C., and Philippe Nicot, J. (2014). Will water scarcity in semiarid regions limit hydraulic fracturing of shale plays? Environ. Res. Lett. 9:124011. doi: 10.1088/1748-9326/9/12/124011
Schneising, O., Burrows, J. P., Dickerson, R. R., Buchwitz, M., Reuter, M., and Bovensmann, H. (2014). Remote sensing of fugitive methane emissions from oil and gas production in North American tight geologic formations. Earth's Future 2, 548–558. doi: 10.1002/2014EF000265
Scholes, R., Lochner, P., Schreiner, G., Snyman-Van der Walt, L., and de Jager, M. (eds.). (2016). Shale Gas Development in the Central Karoo: A Scientific Assessment of the Opportunities and Risks. Stellenbosch: CSIR.
Shearer, C., Bistline, J., Inman, M., and Davis, S. J. (2014). The effect of natural gas supply on US renewable energy and CO 2 emissions. Environ. Res. Lett. 9:094008. doi: 10.1088/1748-9326/9/9/094008
Stephenson, T., Valle, J. E., and Riera-Palou, X. (2011). Modeling the relative GHG emissions of conventional and shale gas production. Environ. Sci. Technol. 45, 10757–10764. doi: 10.1021/es2024115
Sullivan, P., Krey, V., and Riahi, K. (2013). Impacts of considering electric sector variability and reliability in the MESSAGE model. Energy Strategy Rev. 1, 157–163. doi: 10.1016/j.esr.2013.01.001
Ummel, K. (2012). CARMA Revisited: An Updated Database of Carbon Dioxide Emissions From Power Plants Worldwide. Washington, DC: Center for Global Development, 304. doi: 10.2139/ssrn.2226505
UNFCCC (2015). South Africa's Nationally Determined Contribution (INDC). Bonn: Technical report, United Nations Framework Convention on Climate Change.
van Vuuren, D. P., Riahi, K., Calvin, K., Dellink, R., Emmerling, J., Fujimori, S., et al. (2017). The shared socio-economic pathways: trajectories for human development and global environmental change. Glob. Environ. Change 42, 148–152. doi: 10.1016/j.gloenvcha.2016.10.009
Vengosh, A., Jackson, R. B., Warner, N., Darrah, T. H., and Kondash, A. (2014). A critical review of the risks to water resources from unconventional shale gas development and hydraulic fracturing in the United States. Environ. Sci. Technol. 48, 8334–8348. doi: 10.1021/es405118y
WB (2016). Modeling the Impact on South Africa's Economy of Introducing a Carbon Tax. Available online at: http://us-cdn.creamermedia.co.za/assets/articles/attachments/65696_carbon_tax_modelling_report_final_oct_2016.pdf
WB (2018). World Development Indicators Online Database. Available online at: http://data.worldbank.org/data-catalog/world-development-indicators
Weber, C. L., and Clavin, C. (2012). Life cycle carbon footprint of shale gas: review of evidence and implications. Environ. Sci. Technol. 46, 5688–5695. doi: 10.1021/es300375n
Wheeler, D., and Ummel, K. (2008). Calculating CARMA: Global Estimation of CO2 Emissions from the Power Sector. Washington, DC: Center for Global Development, 145. Available online at: https://www.cgdev.org/publication/
Winkler, H. (2007). Energy policies for sustainable development in South Africa. Energy Sustain. Dev. 11, 26–34. doi: 10.1016/S0973-0826(08)60561-X
Winkler, H., Altieri, K., Clarke, S., Garland, R. M., Kornelius, G., and Meas, M. (2016). “Air quality and greenhouse gas emissions,” in Shale Gas Development in the Central Karoo, eds. R. Scholes, P. Lochner, G. Schreiner, L. Snyman-Van der Walt, and M. de Jager (Stellenbosch: CSIR), 3.1–3.74.
Keywords: MESSAGEix, carbon price, scenario analysis, COP 21, NDC, integrated assessment modeling
Citation: Orthofer CL, Huppmann D and Krey V (2019) South Africa After Paris—Fracking Its Way to the NDCs? Front. Energy Res. 7:20. doi: 10.3389/fenrg.2019.00020
Received: 03 September 2018; Accepted: 12 February 2019;
Published: 05 March 2019.
Edited by:
Sonia Yeh, Chalmers University of Technology, SwedenReviewed by:
Sugandha D. Tuladhar, NERA Economic Consulting, United StatesHaewon McJeon, Pacific Northwest National Laboratory (DOE), United States
Copyright © 2019 Orthofer, Huppmann and Krey. This is an open-access article distributed under the terms of the Creative Commons Attribution License (CC BY). The use, distribution or reproduction in other forums is permitted, provided the original author(s) and the copyright owner(s) are credited and that the original publication in this journal is cited, in accordance with accepted academic practice. No use, distribution or reproduction is permitted which does not comply with these terms.
*Correspondence: Clara Luisa Orthofer, clara.orthofer@tum.de