 Takafumi Mizuno1,2*
 Yasumoto Matsui2
 Makiko Tomida3,4Yasuo Suzuki2,5Shinya Ishizuka1
 Tsuyoshi Watanabe2Marie Takemura2
 Yukiko Nishita3
 Chikako Tange3
 Hiroshi Shimokata3,6Shiro Imagama1
 Rei Otsuka3Hidenori Arai7
- 1Department of Orthopaedic Surgery, Nagoya University Graduate School of Medicine, Nagoya, Japan
- 2Center for Frailty and Locomotive Syndrome, National Center for Geriatrics and GerontologyObu, Obu, Japan
- 3Department of Epidemiology of Aging, National Center for Geriatrics and Gerontology, Obu, Japan
- 4Graduate School of Humanities and Social Sciences, Nagoya City University, Nagoya, Japan
- 5Faculty of Health Sciences, Department of Human Care Engineering, Nihon Fukushi University, Mihama, Japan
- 6Graduate School of Nutritional Sciences, Nagoya University of Arts and Sciences, Nisshin, Japan
- 7National Center for Geriatrics and Gerontology, Obu, Japan
Background: The quadriceps muscle is one of the human body’s largest and most clinically important muscles and is evaluated using mid-thigh computed tomography (CT); however, its relationship with motor function and sarcopenia remains unclear. Herein, we investigated the relationship between the cross-sectional area (CSA) of the quadriceps muscle, CT attenuation value (CTV), dual-energy X-ray absorptiometry muscle mass measurements, and muscle strength and motor function to evaluate the relationship between muscle mass loss and motor function decline, determine the diagnostic ability for sarcopenia, and confirm the usefulness of quadriceps muscle CT evaluation.
Methods: A total of 472 middle-aged and older community dwellers (254 men and 218 women) aged ≥40 years (mean age: 62.3 years) were included in this study. The quantity and quality of the quadriceps muscle were assessed using CSA and CTV (CSA×CTV) as a composite index multiplied by quality and quantity. Age-adjusted partial correlations by sex with eight motor functions (knee extension muscle strength, power, normal walking speed, fast walking speed, grip strength, sit-up ability, balance ability, and reaction time) were evaluated, including correction methods for height, weight, and body mass index (BMI). Further, the accuracy of sarcopenia diagnosis was evaluated using appendicular muscle mass with dual-energy X-ray absorptiometry measurements, grip strength, and walking speed as the gold standard, and receiver operating characteristic curves were plotted to evaluate diagnostic performance.
Results: In men, CSA and CSA×CTV were significantly associated with seven of the eight motor functions (p<0.05), excluding only balance ability. BMI-corrected CSA was significantly correlated with all eight motor functions in men and women (p<0.05). In the diagnosis of sarcopenia based on skeletal muscle index, CSA (area under the curve (AUC) 0.935) and CSA×CTV (AUC 0.936) and their correction by height (CSA/height (AUC 0.917) and CSA×CTV/height (AUC 0.920)) were highly accurate and useful for diagnosis in men but moderately accurate in women (CSA (AUC 0.809), CSA×CTV (AUC 0.824), CSA/height (AUC 0.799), CSA×CTV/height (AUC 0.814)).
Conclusion: The present results showed that a single CT image of the quadriceps muscle at the mid-thigh is useful for diagnosing sarcopenic changes, such as loss of muscle mass, muscle weakness, and muscle function.
Introduction
Sarcopenia is a critical condition that increases the risk of mortality and functional disability in older individuals (1). In 2018, the European Working Group on Sarcopenia in Older People focused on muscle mass and quality as key parameters for diagnosing sarcopenia (2). Imaging modalities such as computed tomography (CT), magnetic resonance imaging, and ultrasonography enable a detailed evaluation of the constituent elements of the transverse section and have been reported to be potentially useful in assessing muscle quality (3–7). CT could be a better form of assessment because of its accuracy, reproducibility, and objectivity (8). Prior studies using CT have attempted to assess muscle mass using the cross-sectional area (CSA) and muscle quality using the CT attenuation value (CTV) at the mid-thigh or abdomen (4, 9). However, which muscles should be evaluated to assess muscle mass and quality and how the results should be corrected remain unclear. Skeletal muscle mass index (SMI) is an index used in the diagnostic criteria for sarcopenia, usually calculated by dividing skeletal muscle mass (ASM) by the square of height. On the other hand, as recently reported, there is a debate regarding the superiority of ASM alone or ASM/body mass index (BMI) over SMI in predicting prognosis (10–12), this traditional method is considered a controversial correction method. Therefore, it is necessary to verify which method of muscle mass index is appropriate: uncorrected, based on height, height squared, body weight, or BMI.
We previously reported that the percentage of CSA reduction in the quadriceps (Qc) muscle was greater than that in the hamstrings on mid-thigh CT of older individuals (13). Further, because the Qc muscle is one of the largest muscles, it may be particularly susceptible to the effects of aging and sarcopenia (14) (15). Additionally, the Qc muscle is relatively easy to assess using portable devices, such as ultrasound scanners (3) and is therefore of clinical importance. Although we previously reported data from a hospital cohort (16), there have been few detailed evaluations of the relationship between Qc CT and other modalities on muscle mass and physical function in community populations, and no reports have yet clarified the diagnostic ability of Qc CT for muscle mass or strength loss or physical function decline. Herein, we investigated the relationship between Qc CT measurements, including various corrections, and dual-energy X-ray absorptiometry (DXA) measurements, including various corrections, muscle strength, and motor function, in a cross-sectional survey of middle-aged and older individuals in the general Japanese population to confirm the usefulness of Qc CT by evaluating its diagnostic ability for sarcopenia and by exploring its relationship with muscle mass loss and impaired motor function.
Methods
Participants
The National Institute for Longevity Sciences-Longitudinal Study of Aging (NILS-LSA) investigated age-related differences among randomly selected middle-aged and older community dwellers aged ≥40 years from resident registrations in Obu city and Higashiura town (Aichi Prefecture, Japan). This study observed and documented the normal aging process in individuals over time, and was operated as a dynamic cohort comprising age- and sex-matched random participants; for dropouts under 80 years of age at follow-up, new participants of the same sex and age group were recruited, as well as new participants aged ≥40 years were recruited annually (17). The seventh wave of the NILS-LSA was conducted from July 2010 to July 2012 and included 2,330 participants. Among these, 525 consecutive participants were included in this study after February 2, 2012. The right mid-thigh CT data of the participants were stored in Digital Imaging and Communications in Medicine format with measurable CTVs. Five of the 525 participants who refused or could not undergo CT imaging or who had poor-quality or difficult-to-evaluate images, as well as 48 participants in whom motor function could not be tested owing to illness on the day of the study (e.g., knee pain, back pain, fatigue, lightheadedness), schedule delays, or severe comorbidities were excluded. Finally, 472 participants (254 men and 218 women, mean age: 62.3 years, age range: 40–89 years) in whom the right knee extension muscle strength (KES) could be measured were included in the analysis. Furthermore, 367 (135 men and 232 women, mean age: 77.2 ± 7.1 years, age range: 53–96 years) out of 500 patients who visited the Integrated Healthy Aging Clinic at the National Center for Geriatrics and Gerontology, Japan, from 2016 to 2019 were included for external validation in this study (18, 19). Of these, patients with gait impairment due to severe knee or hip osteoarthritis, and progressive motor disease such as Parkinson’s disease were excluded because of the difficulty in accurately assessing physical function, and cases with missing data were excluded. This research was approved by the institutional ethics committee (certification no. 1361 and 881) and was conducted in accordance with the ethical standards laid down in the 1964 Declaration of Helsinki and its later amendments. Written informed consent was obtained from all participants.
Qc femoris CT
Participants underwent a single-slice CT examination of the right mid-thigh (location: midpoint of the superior pole of the patella and inguinal crease; settings: 120 kV, 120 mA; rotation time: 1 s; field of view: 233 mm) using SOMATOM Sensation 64™ (Siemens, Munich, Germany). CSAs and CTVs from the CT images were analyzed using sliceOmatic software version 5.0 (TomoVision, Magog, Canada). CSAs were evaluated as a measure of the total Qc muscle, including the intermuscular fat mass, and CTVs were evaluated as a measure of muscle quality, reflecting the intramuscular fat and intramyocellular lipid levels. Manual range selection was used for the Qc muscle (Figure 1). Additionally, CSA multiplied by CTV was defined as a composite index multiplied by quality and quantity. The following parameters were created to evaluate the correction method: CSA/height, CSA/height2, CSA/weight, CSA/BMI, CTV/BMI, CSA×CTV/height, CSA×CTV/height2, CSA×CTV/weight, CSA×CTV/BMI. The SOMATOM Sensation 64 (Siemens, Munich, Germany; settings: 120 kV, 120 mA; rotation time: 1 s; field of view: 233 mm) and Aquilion CXL (CANON, Tochigi, Japan; settings: 135 kV, 150 mA; rotation time: 1 s; field of view: 4.0 mm) were used in the external validation cohort using the same analysis methods.
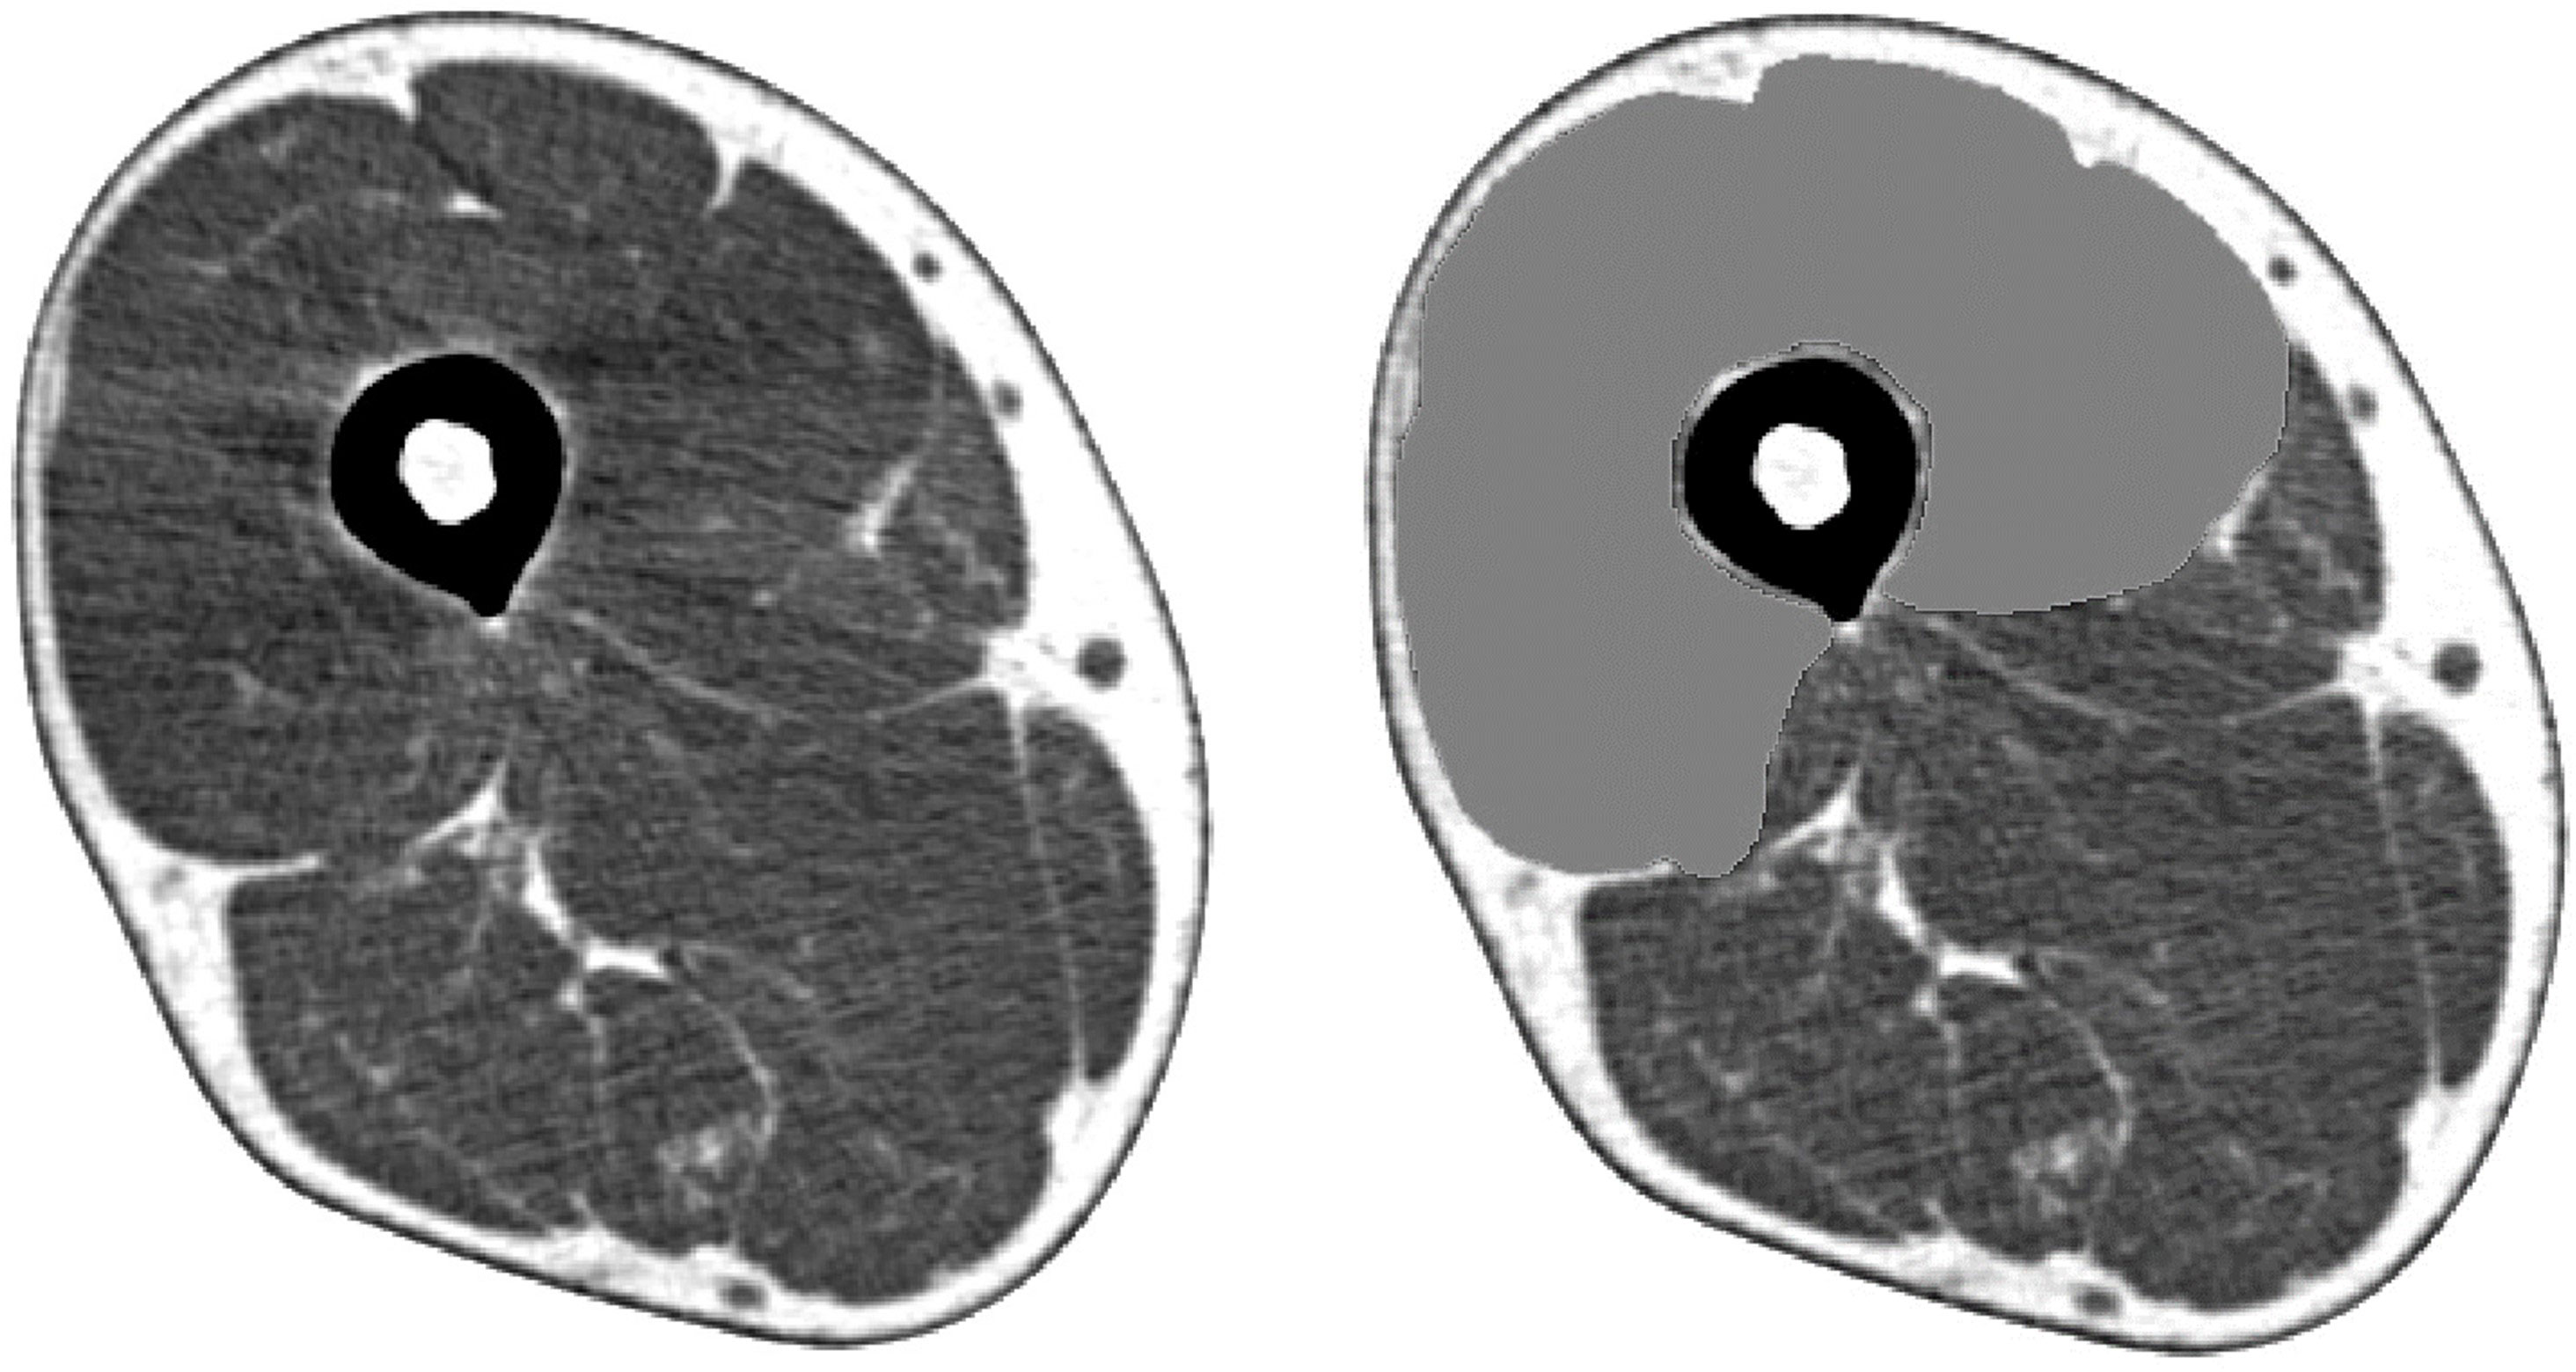
Figure 1 Cross-sectional muscle area of the quadriceps femoris determined by mid-thigh computed tomography.
Skeletal muscle mass measured using DXA
Skeletal muscle mass was measured using QDR-4500 DXA (Hologic, Bedford, MA, USA). The participants were placed supine on the DXA table, with their limbs held close to their bodies. The whole-body lean soft tissue mass comprised the soft tissue masses of the arms, legs, and trunk. The ASM was determined by combining the lean soft tissue masses of the arms and legs, and the SMI (kg/m2) was calculated as ASM/height2. Given the controversy of this method, the ASM, SMI, ASM/weight, and ASM/BMI were additionally used in the analysis (2). Another DXA machine (Lunar iDXA, GE Healthcare, Chicago, IL, USA) was used in the external validation cohort.
Motor function measurement
KES and power
KES was measured using T.K.K.1281 (Takei, Niigata, Japan). Participants were instructed to sit on a chair and extend both knees from a 90° flexed position, and the highest value of three tests conducted on the right lower extremity was used. The value of the extension muscle strength divided by the total area of the Qc muscle (KES/CSA, N/cm2) was also used as one of the muscle quality indices. This was modified from a previous study, which defined knee extension power as the total lean muscle mass divided by the total leg area (N/cm3) (20).
Leg extension power was measured using T.K.K.4236 (Takei, Niigata, Japan). The participants were fastened to a chair with a seat belt and instructed to extend their knees as quickly and strongly as possible in a horizontal direction with their feet placed on a foot plate, and the maximum value from eight attempts was used. KES in the external validation cohort was measured using ZP-500N (Imada Co., Ltd., Toyohashi, Aichi, Japan) (21).
Measurement of physical performance
Grip strength (kg) was measured using T.K.K.4301a (Takei, Niigata, Japan). Walking speed was measured using the YW-3 walking analysis system (Yagami, Aichi, Japan); normal and fast walking speeds were determined over a 10-m walk. Regarding balance ability, closed-eye balance (seconds) was measured using T.K.K.4315a (Takei, Niigata, Japan), with both hands on the waist, one foot on the ground, eyes closed at the point of balance, and posture maintained. The maximum value of two measurements (a maximum of 180 seconds) was used. The whole-body reaction time (seconds) was used as an index of agility; using T.K.K.4312a (Takei, Niigata, Japan), the average value of five repetitions was taken as the adopted value (i.e., legs shoulder-width apart on the measurement mat, knees lightly flexed in preparation, and a quick jump when the lamp lit up red). Upper body raising (times), an index of endurance described as a sit-up, was measured using T.K.K. 4329a (Takei, Niigata, Japan). The participants were assessed while lying supine on the seat with their knees and ankles draped over a cushion in front of the abdominal table and with their hands folded behind their heads, performing as many sit-ups as possible. The number of times per measurement (30 seconds) was used as the adopted value. In the external validation cohort, grip strength was measured using the ZP-500N force gauge (IMADA Co., Ltd., Toyohashi, Aichi, Japan), while normal walking speed was measured using Walkway MW-1000 (ANIMA Corp., Tokyo, Japan).
Other parameters
The height and weight of all participants were assessed, and their BMI was calculated as weight/height2 (kg/m2). The participants’ medical histories (including hypertension, dyslipidemia, diabetes, heart disease, and stroke), vitamin administration, and smoking status were obtained through questionnaires.
Statistical analysis
Statistical analyses were performed using SAS version 9.3 (SAS Institute, NC, USA), with statistical significance set at p<0.05. Measurements were not excluded, even if they were outliers. CSA, ASM, and their corrected values divided by height, height2, weight, and BMI were used as indices of muscle mass. CTV and its corrected value divided by BMI and KES/CSA were used as indices of muscle quality. CSA×CTV and its corrected value divided by height, height2, weight, and BMI were used as combined indices of muscle mass and muscle quality. The relationship between these variables and physical function was evaluated according to sex using Pearson’s correlation coefficient, adjusted for age. For reference, a test of differences in correlation coefficients (22) was performed for the SMI. Additionally, the Asian Working Group for Sarcopenia (AWGS) 2019 reference values were used to assess muscle function loss (grip strength <28 kg for men and <18 kg for women and/or walking speed 1.0 m/second) and muscle mass loss (DXA <7.0 kg/m2 for men and <5.4 kg/m2 for women) (23). Those who fulfilled these categories were also classified as having sarcopenia (muscle mass loss and reduced physical function). Receiver operating characteristic (ROC) curves were plotted to evaluate the diagnostic performance. The diagnostic accuracy was evaluated based on the area under the curve (AUC), with 0.9–1.0, 0.7–0.9, and 0.5–0.7 being considered high, moderate, and low, respectively. A comparison of ROC curves was also carried out for grip strength and SMI for reference (24). The optimal cutoff value was determined as the value closest to the upper left of the ROC curve, and sensitivity and specificity at that value were calculated. Diagnostic performance was validated in the external validation cohort using the determined cutoff values. Diagnostic odds ratio (DOR) was calculated with 0.5 added to all contingency tables because calculating it is impossible when the number of false positives or false negatives is 0 (25, 26).
Results
Participant characteristics
The characteristics of the participants are summarized in Table 1.
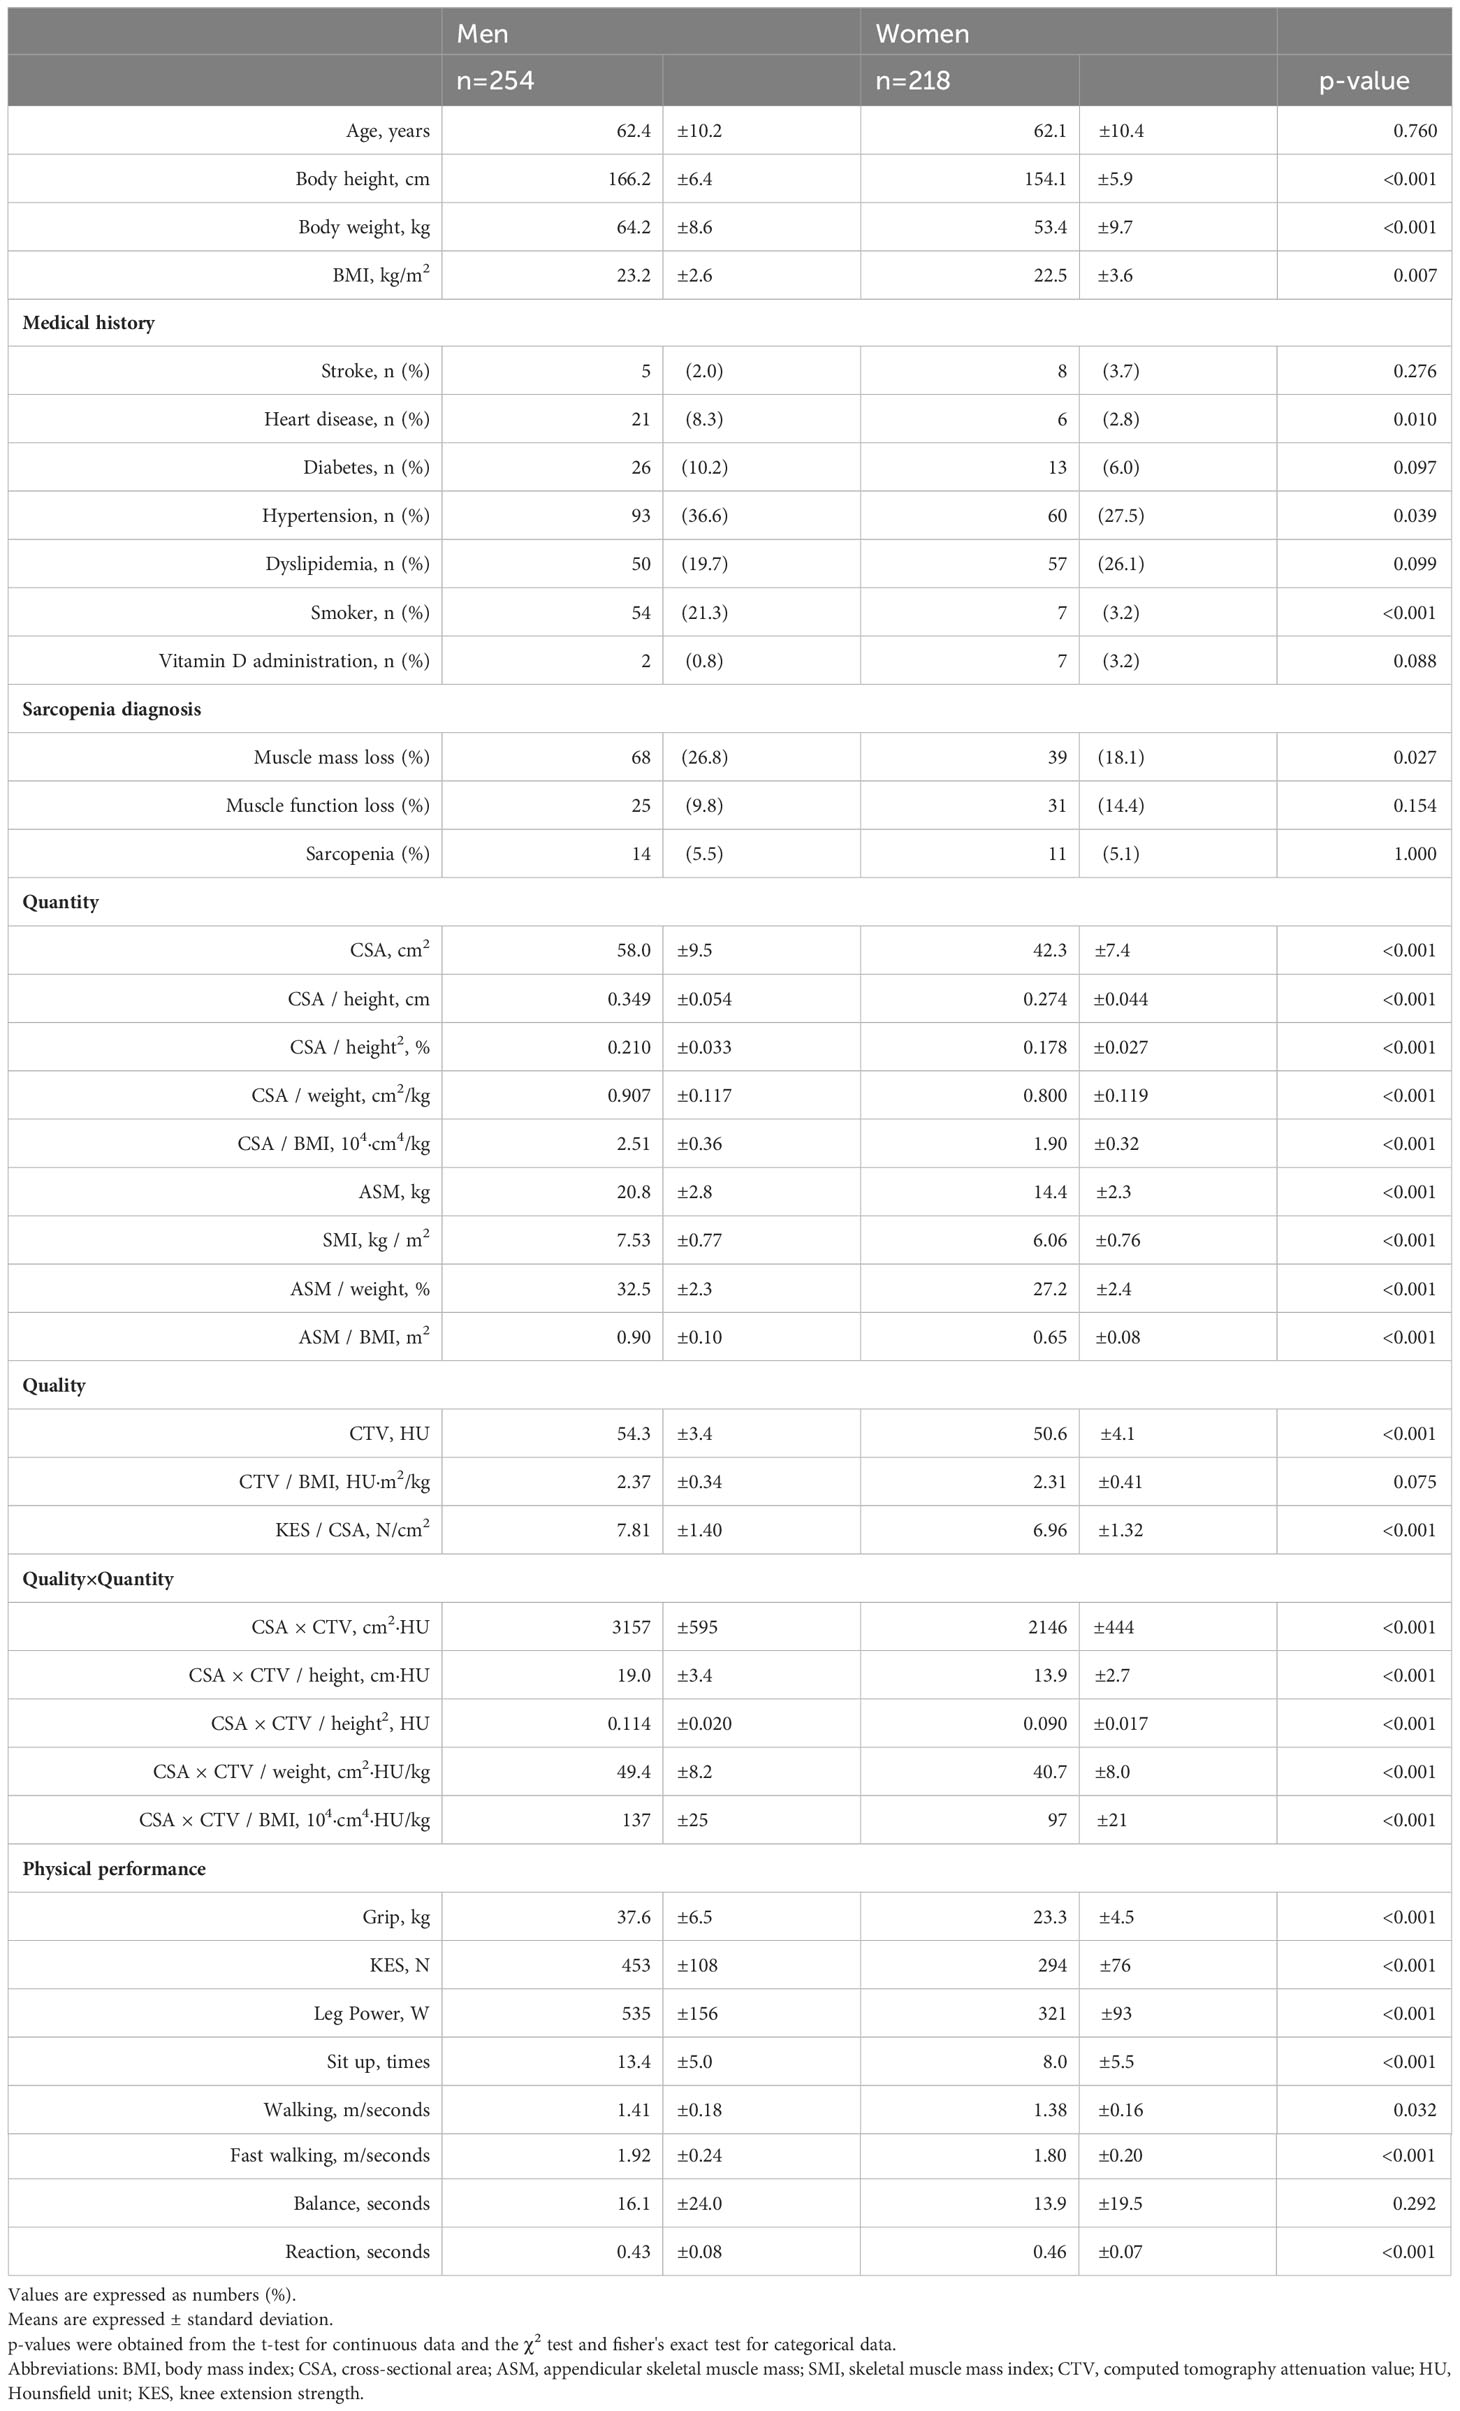
Table 1 Characteristics of the study participants.
Physical function and CT and DXA measurements
Non-adjusted correlations were significantly related for most variables (Tables S1, S2). Tables 2, 3 show the results for age-adjusted partial correlations by sex. The following sections concisely describe the results; please refer to the Tables for correlation coefficients and other information.
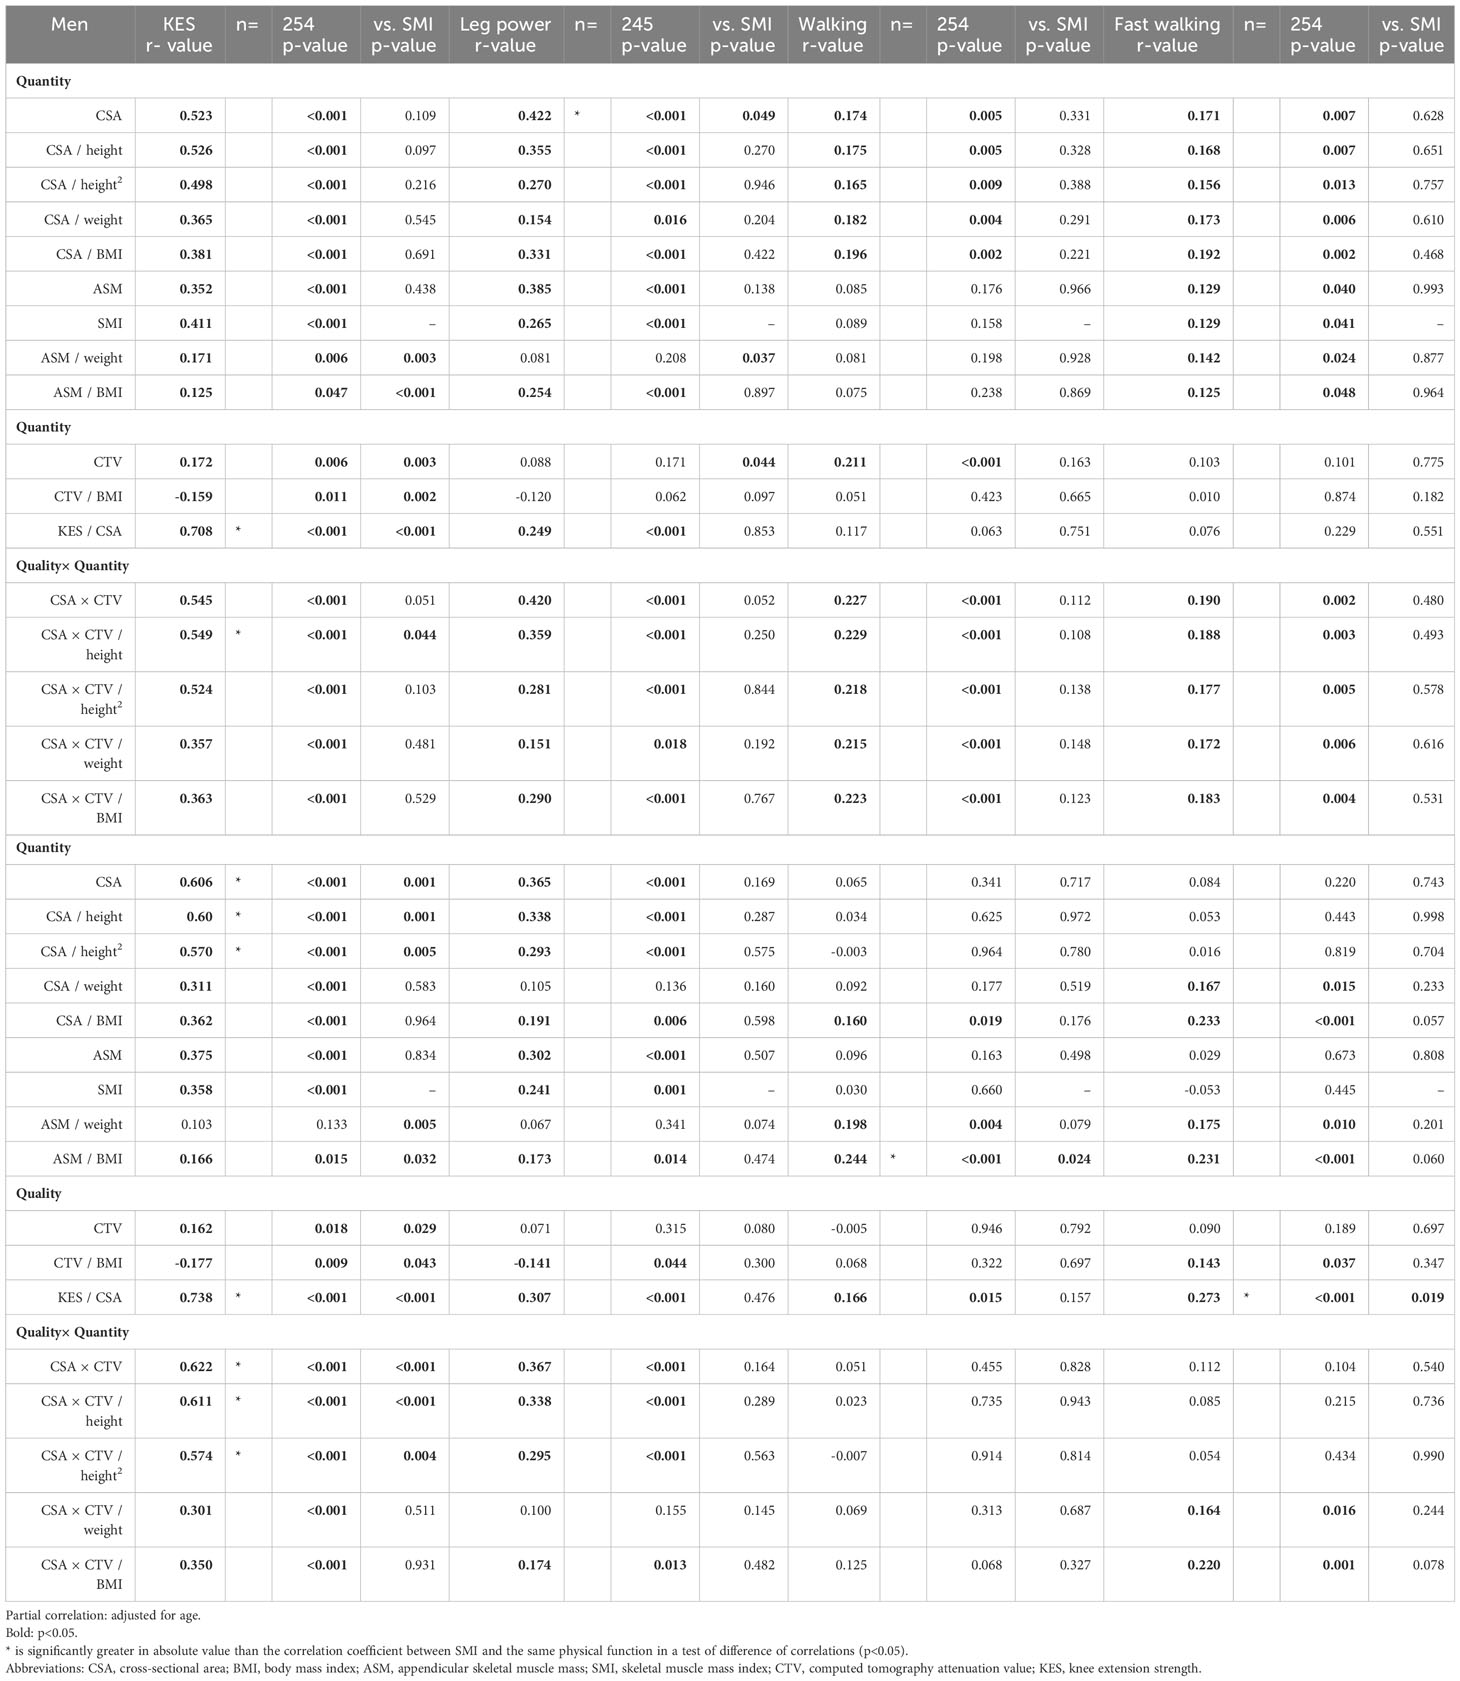
Table 2 Correlation of physical functions with computed tomography and dual-energy X-ray absorptiometry measurement (1).
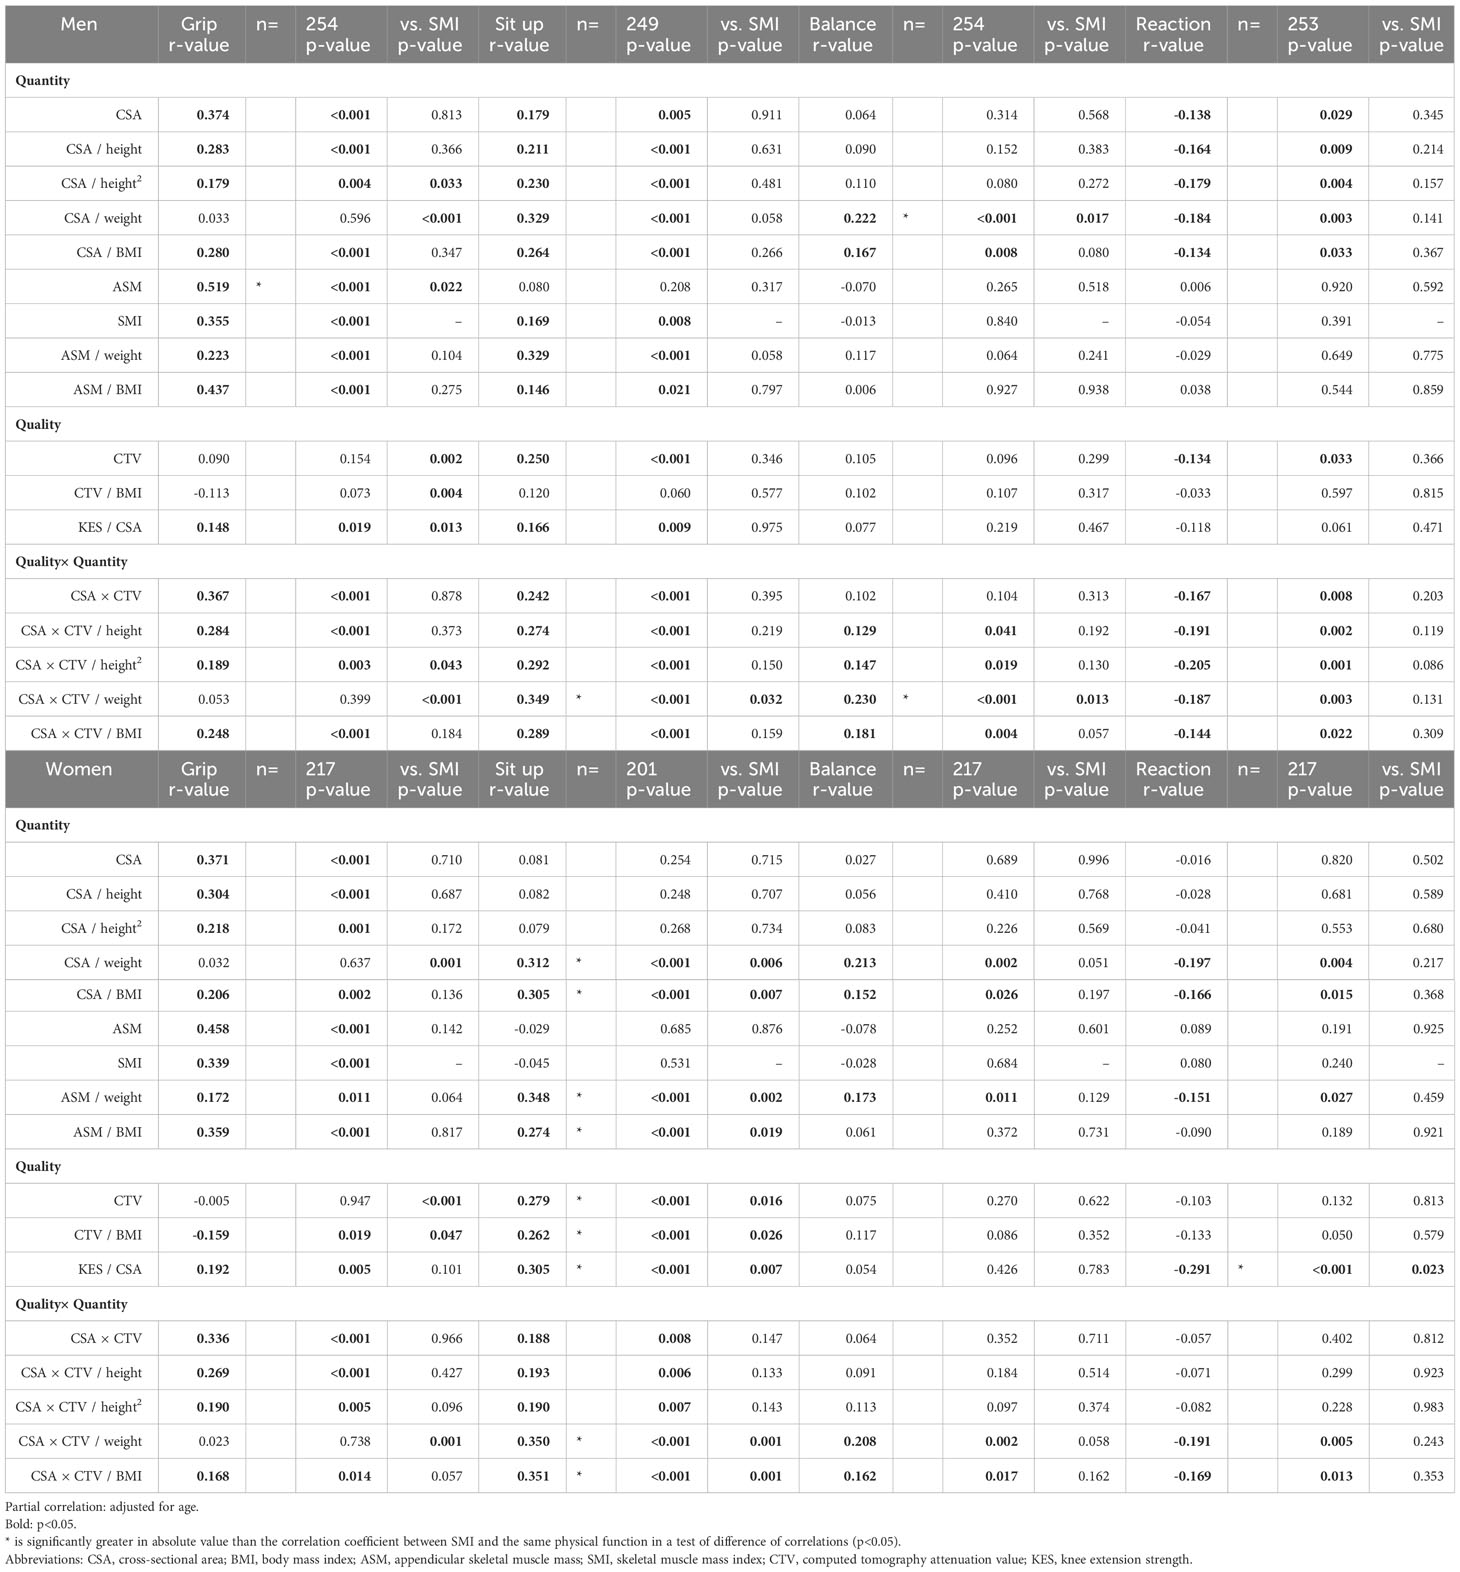
Table 3 Correlation of physical functions with computed tomography and dual-energy X-ray absorptiometry measurement (2).
No correction
In CSA for men, significant correlations were observed for seven variables. In CTV for men, significant correlations were observed for four variables. In CSA×CTV for men, significant correlations were found for seven variables. In CSA for women, significant correlations were observed for three variables. In CTV for women, significant correlations were observed for two variables. In CSA×CTV for women, significant correlations were observed for four variables. Those that showed significantly superior correlations compared to SMI were leg power for men’s CSA (p=0.049), KES for women’s CSA (p=0.001), KES for women’s CSA×CTV (p<0.001), and sit-up for women’s CTV (p=0.016).
Height correction
KES for men showed significant correlations for CSA (r=0.523), CSA/height (r=0.526), and CSA/height2 (r=0.498), while KES for women also showed significant correlations for CSA (r=0.606), CSA/height (r=0.604), and CSA/height2 (r=0.570). Leg power for men was significantly correlated with CSA (r=0.422), CSA/height (r=0.355), and CSA/height2 (r=0.270), whereas leg power for women was significantly correlated with CSA (r=0.365), CSA/height (r=0.338), and CSA/height2 (r=0.293). Correlations were as strong with height correction as without, particularly for KES and leg power.
Weight correction
In CSA/weight for men, significant correlations were observed for seven variables. In CSA×CTV/weight for men, significant correlations were observed for seven variables. In CSA/weight for women, significant correlations were observed for five variables. In CSA×CTV/weight for women, significant correlations were observed for five variables. Compared with other correction methods, weight correction showed a poorer relationship with the direct function of muscle output, such as strength and power; nevertheless, it was significantly correlated with several other variables. In particular, with a particularly strong relationship between sit-up and balance.
BMI correction
In CSA/BMI for men, significant correlations were observed for all eight variables. In CSA×CTV/BMI for men, significant correlations were observed for all eight variables. In CSA/BMI for women, significant correlations were observed for all eight variables. In CSA×CTV/BMI for women, significant correlations were observed for seven variables. Correction by BMI was a measurement variable related to most physical functions.
Diagnostic performance
In the diagnostic accuracy evaluation, when values for both men and women are listed, those of the men are presented first.
Sarcopenia diagnosis
CSA (AUC 0.935), CSA×CTV (AUC 0.936), CSA/height (AUC 0.917), and CSA×CTV/height (AUC 0.920) showed higher and better diagnostic accuracy than SMI (AUC 0.915) in men; however, no significant difference was detected (p>0.05). CSA (AUC 0.809) and CSA×CTV (AUC 0.824) showed moderate diagnostic accuracy in women, which was significantly inferior to SMI (AUC 0.932; p<0.05). Grip strength (AUC 0.946, 0.976) showed the best diagnostic performance among all variables. ASM (AUC 0.943, 0.904) showed the same high accuracy as SMI (AUC 0.915, 0.932), but the diagnostic performance of other corrections, such as ASM/weight (AUC 0.767, 0.772) and ASM/BMI (AUC 0.873, 0.756), was only moderate (Table 4).
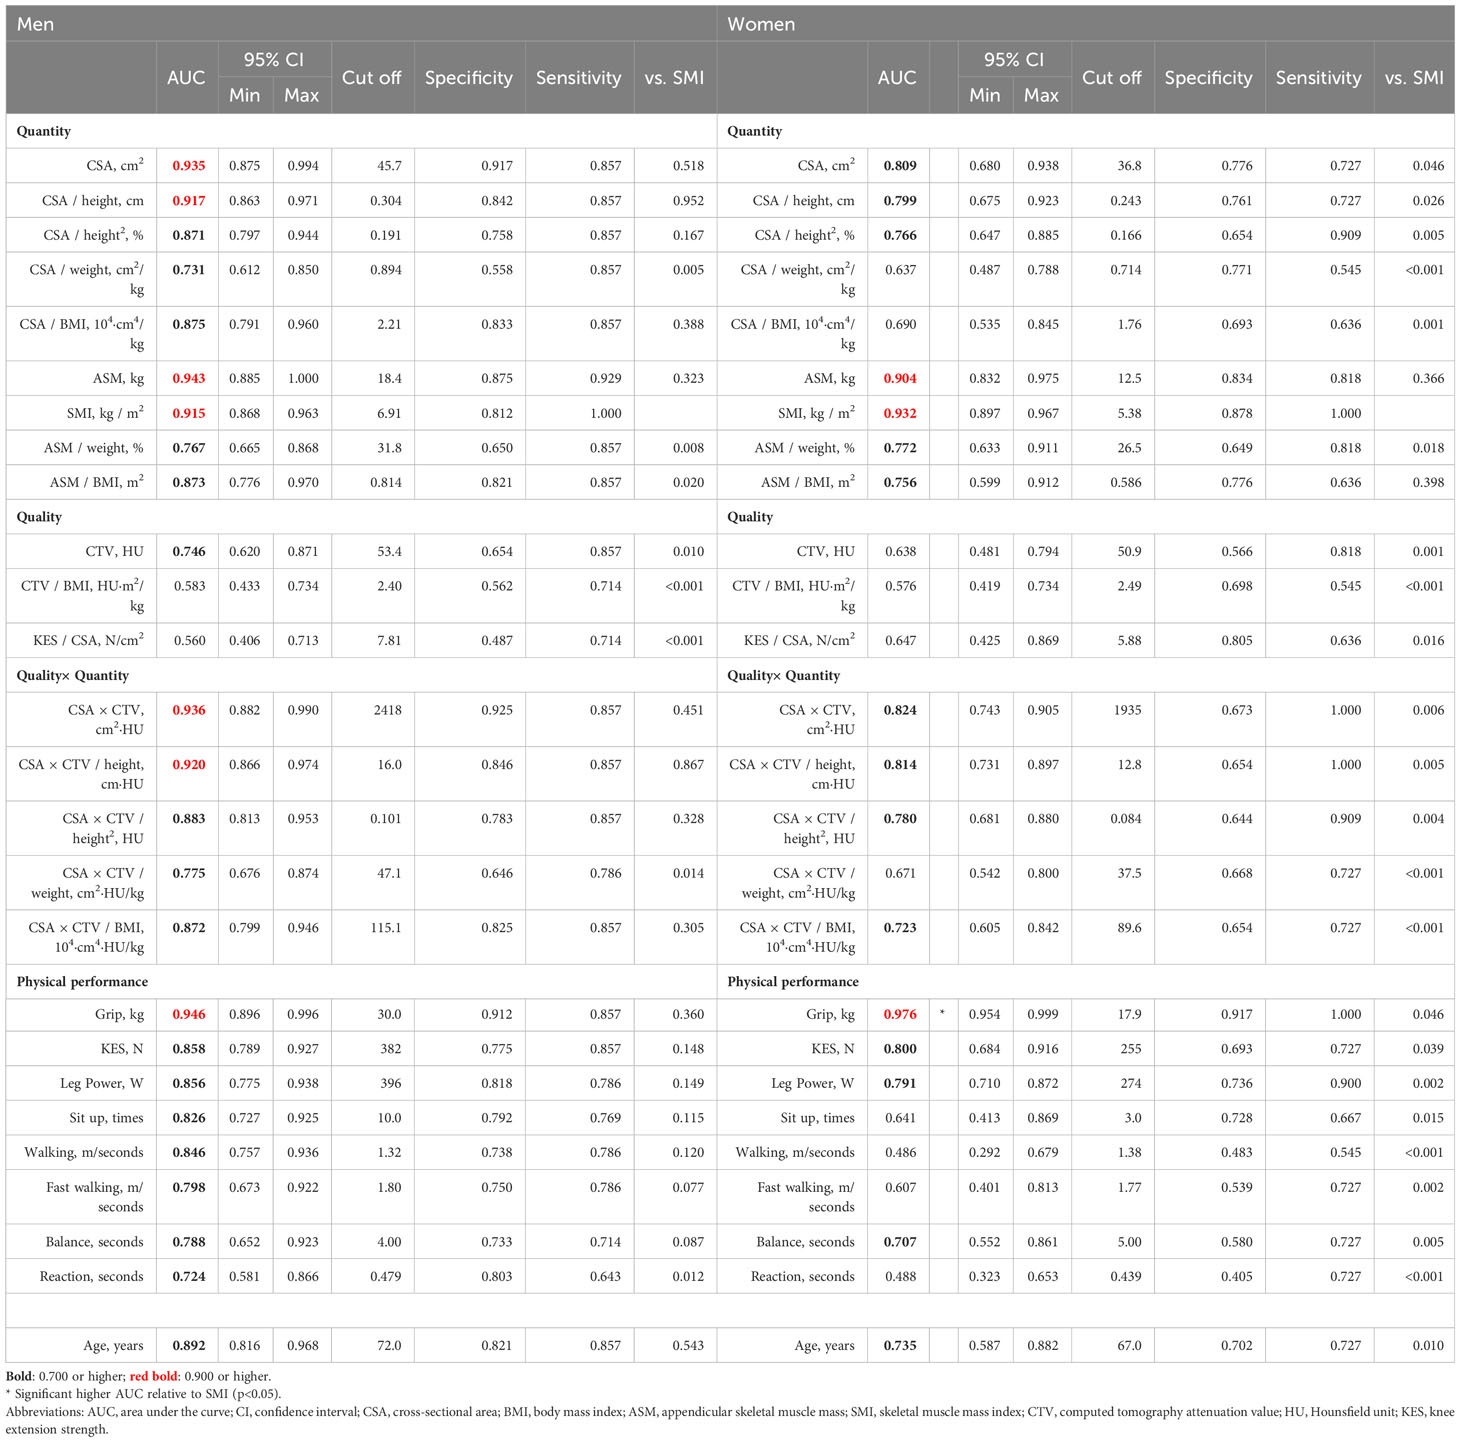
Table 4 Receiver operating characteristic curve for diagnosis vs. Sarcopenia.
Low muscle mass diagnosis
CSA (AUC 0.867, 0.791), CSA/height (AUC 0.878, 0.807), CSA/height2 (AUC 0.876, 0.805), CSA×CTV (AUC 0.814, 0.737), CSA×CTV/height (AUC 0.829, 0.748), and CSA×CTV/height2 (AUC 0.829, 0.748) exhibited moderate accuracy in both men and women and showed significantly better diagnostic accuracy than grip strength (AUC 0.681, 0.717) in men only (p<0.001 for all). In DXA measurements, ASM (AUC 0.904, 0.922) had a high accuracy in both men and women and showed significantly better diagnostic performance than grip strength (p<0.001) (Table 5).
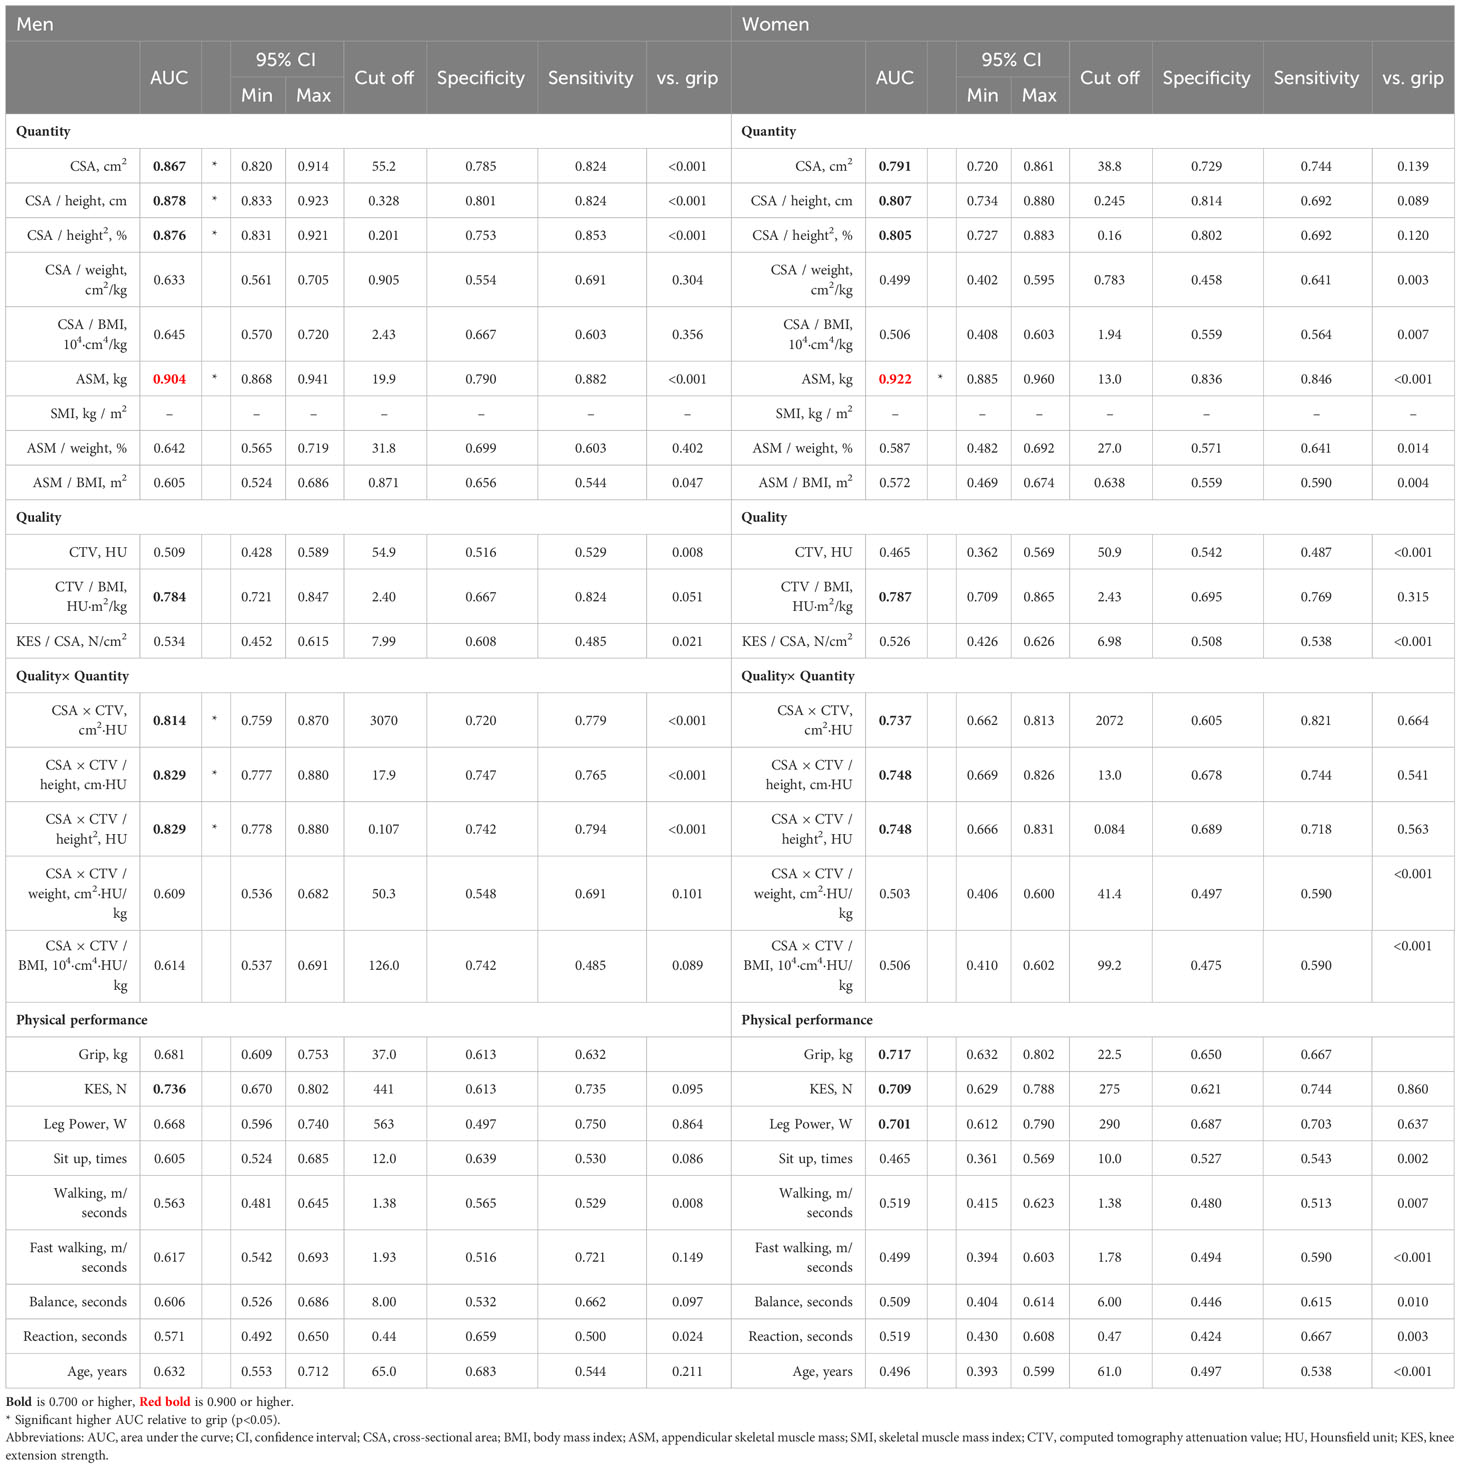
Table 5 Receiver operating characteristic curve for diagnosis vs. low muscle mass.
Low muscle function diagnosis
None of the variables with high accuracy were found in the CT and DXA measurements in both men and women. CSA×CTV (AUC 0.868, 0.810; p=0.039, 0.007) and CSA (AUC 0.853, 0.769; p=0.047, 0.039) were significantly better than SMI (AUC 0.774. 0.643) in both men and women. CSA×CTV/height (AUC 0.782; p=0.022) also showed a significantly better diagnostic performance than SMI in women. ASM (AUC 0.867, 0.768) showed moderate accuracy and significantly better diagnostic performance than SMI in both men and women (p=0.006, p<0.001), whereas ASM/BMI (AUC 0.883, 0.740) showed moderate accuracy and was significantly better than SMI in men (p=0.035) (Table 6).
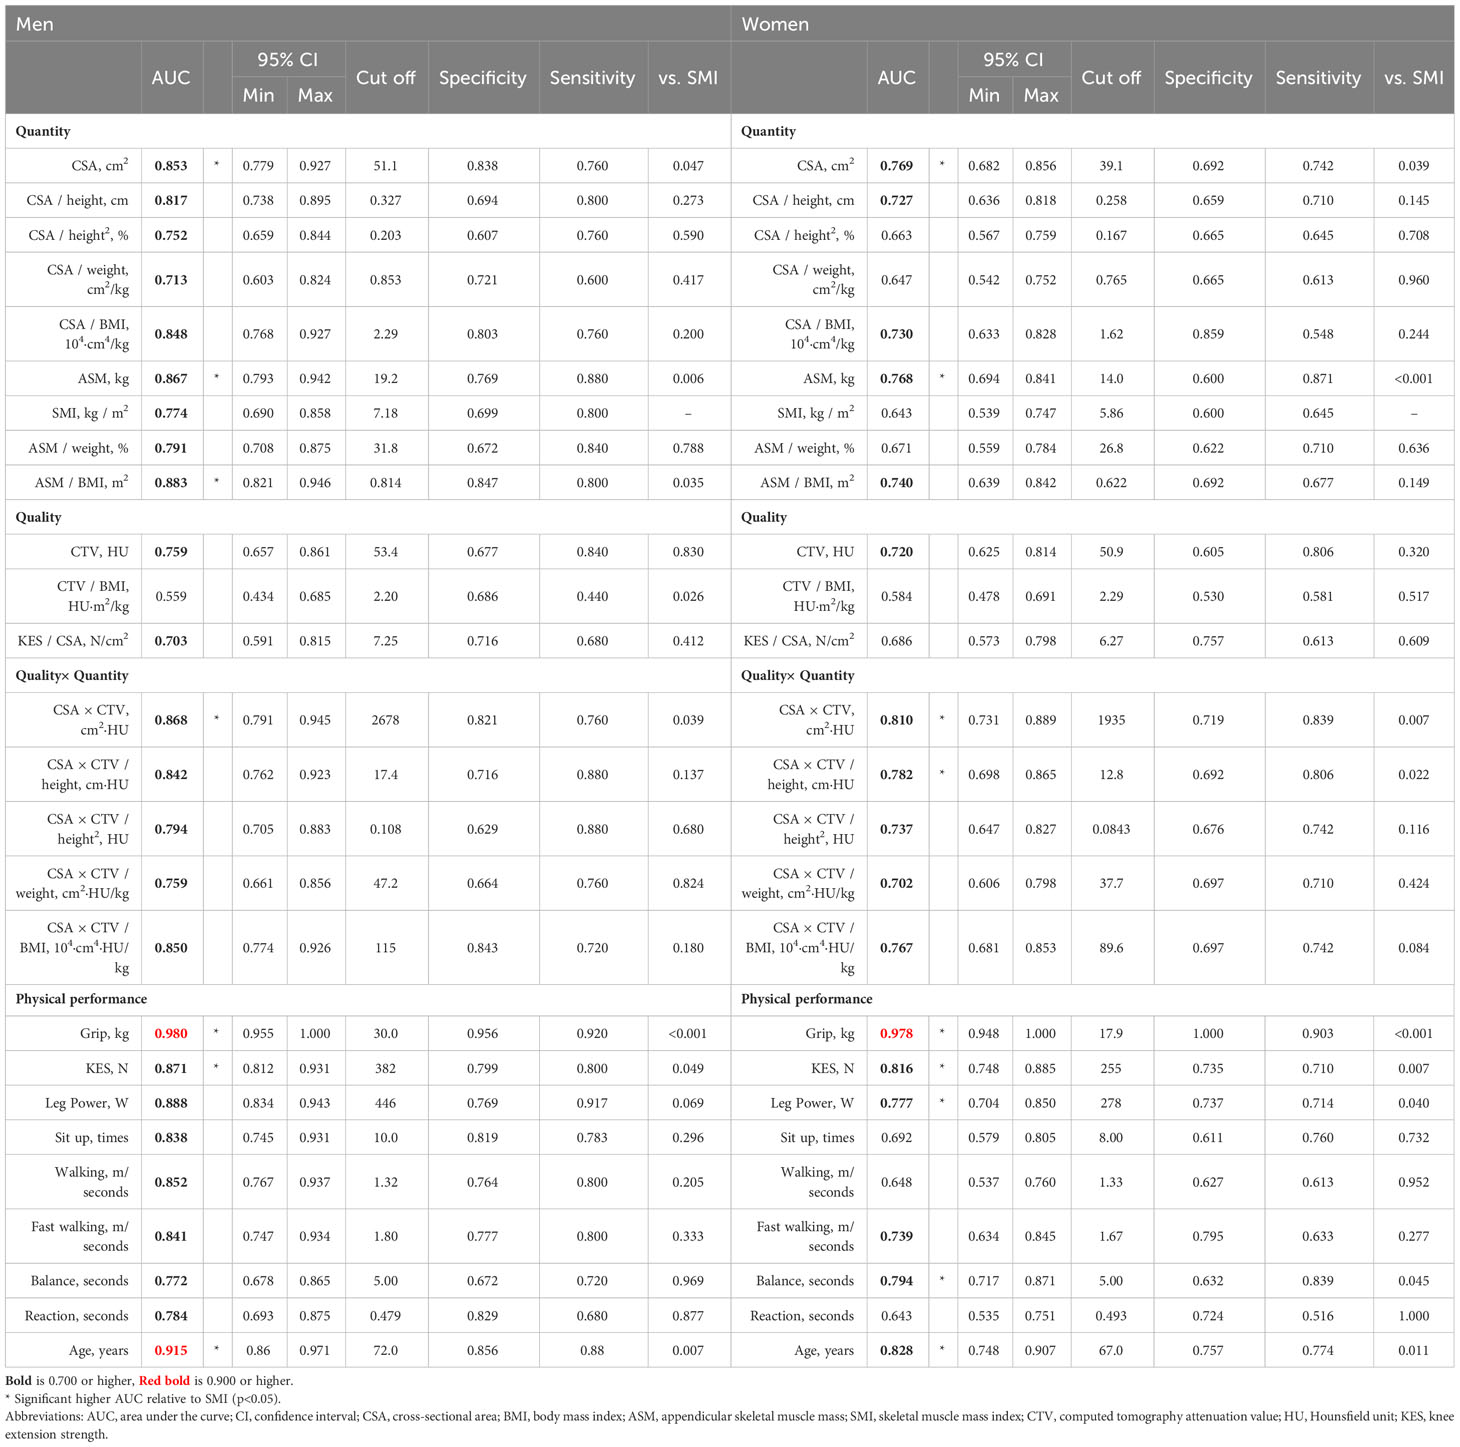
Table 6 Receiver operating characteristic curve for diagnosis vs. low muscle function.
Validation of diagnostic performance in an external validation cohort
The characteristics of the participants are summarized in (Table 7) Table 8. As for sarcopenia, CSA (DOR 5.55, 19.86), CSA/height (DOR 5.23, 14.45), and CSA/height2 (DOR 5.57, 11.21) were good. CSA×CTV (DOR 6.05) was favorable in men, whereas CSA×CTV had a high DOR (29.82) but much lower accuracy (0.39) in women. As for low muscle mass, men displayed good diagnostic performance with respect to CSA (DOR 9.89), CSA×CTV (DOR 11.71), CSA/height (DOR 12.64), CSA/height2 (DOR 14.15), CSA×CTV/height (DOR 9.18), and CSA×CTV/height2 (DOR 13.41). Women had better CSA (DOR 23.61), CSA/height (DOR 14.32), and CSA/height2 (DOR 13.77); CSA×CTV and its height-corrected values had a higher DOR, but lower accuracy. As for low muscle function, CSA (DOR 3.28, 3.86), CSA×CTV (DOR 5.23, 5.20), CSA/BMI (DOR 4.93, 5.42), and CSA×CTV/BMI (DOR 4.54, 6.51) showed good diagnostic performance. Women also had good CTV (DOR 5.14) and CSA×CTV/weight (DOR 4.81).
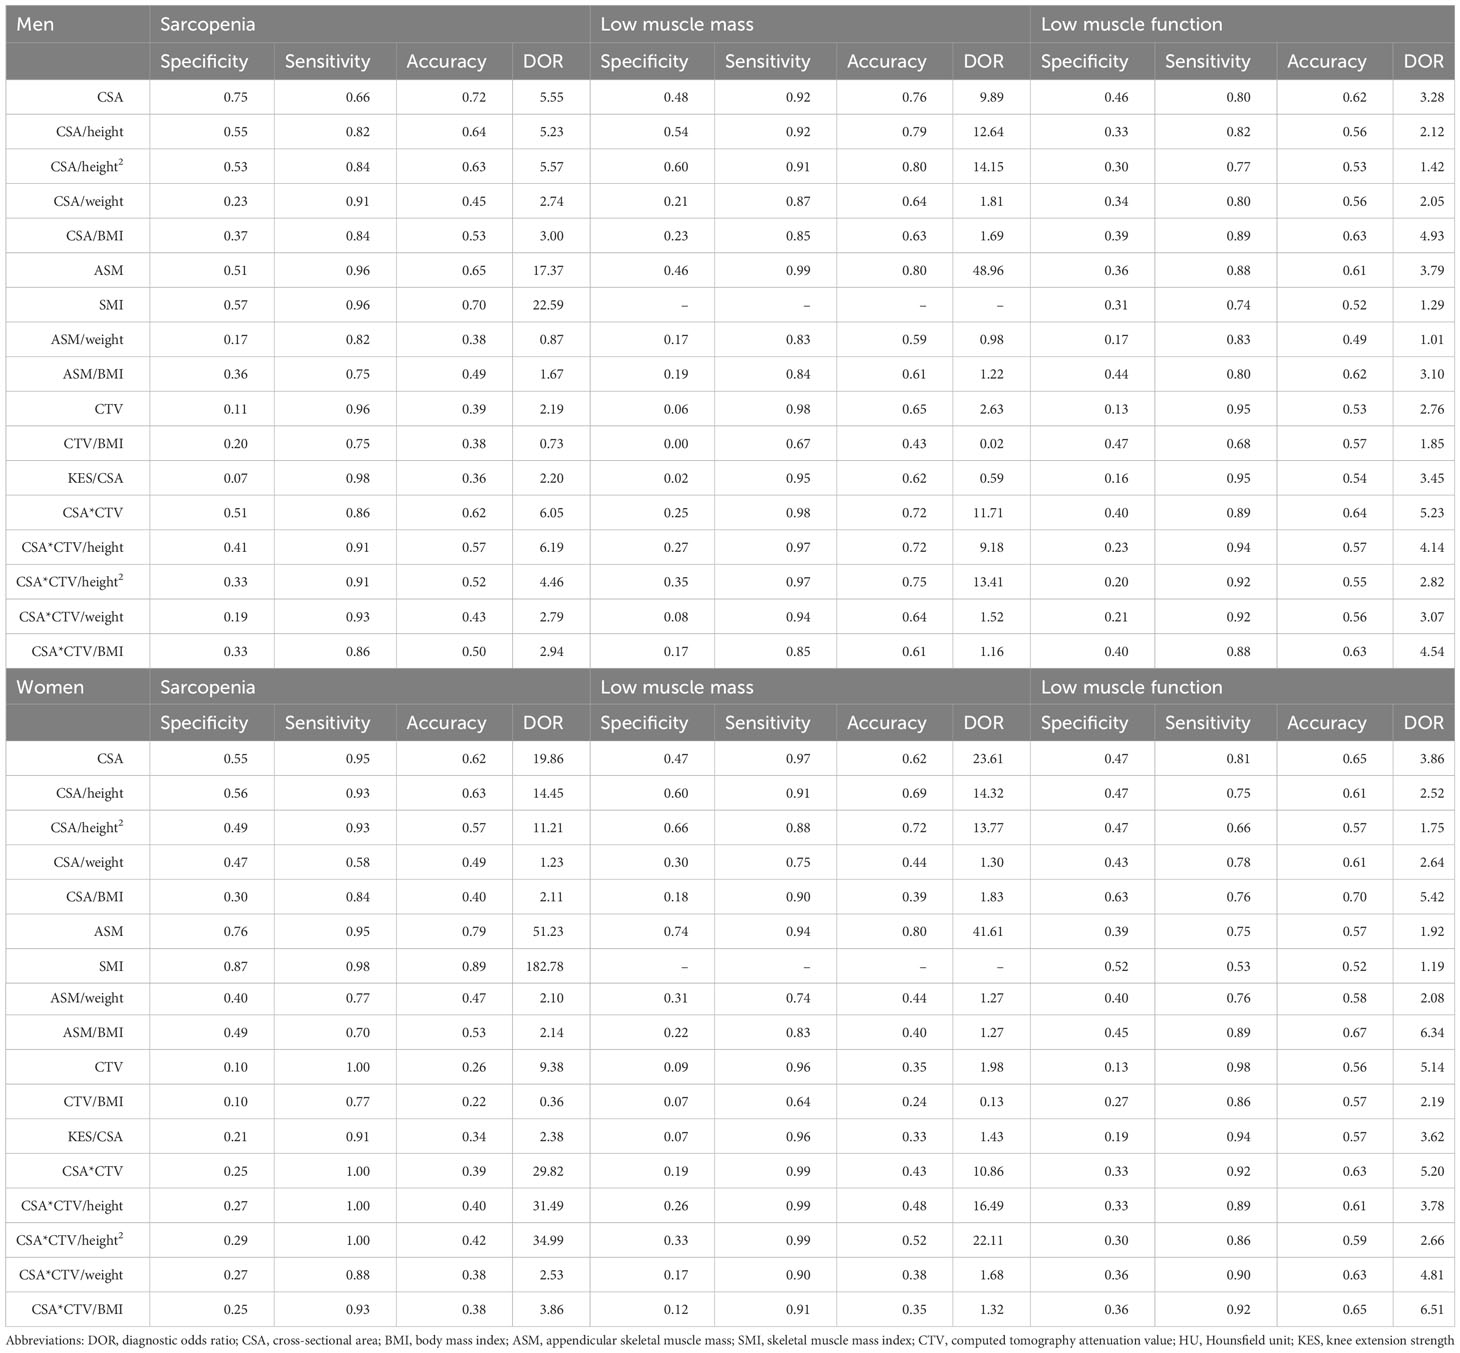
Table 7 Validation of diagnostic performance in the external validation cohort.
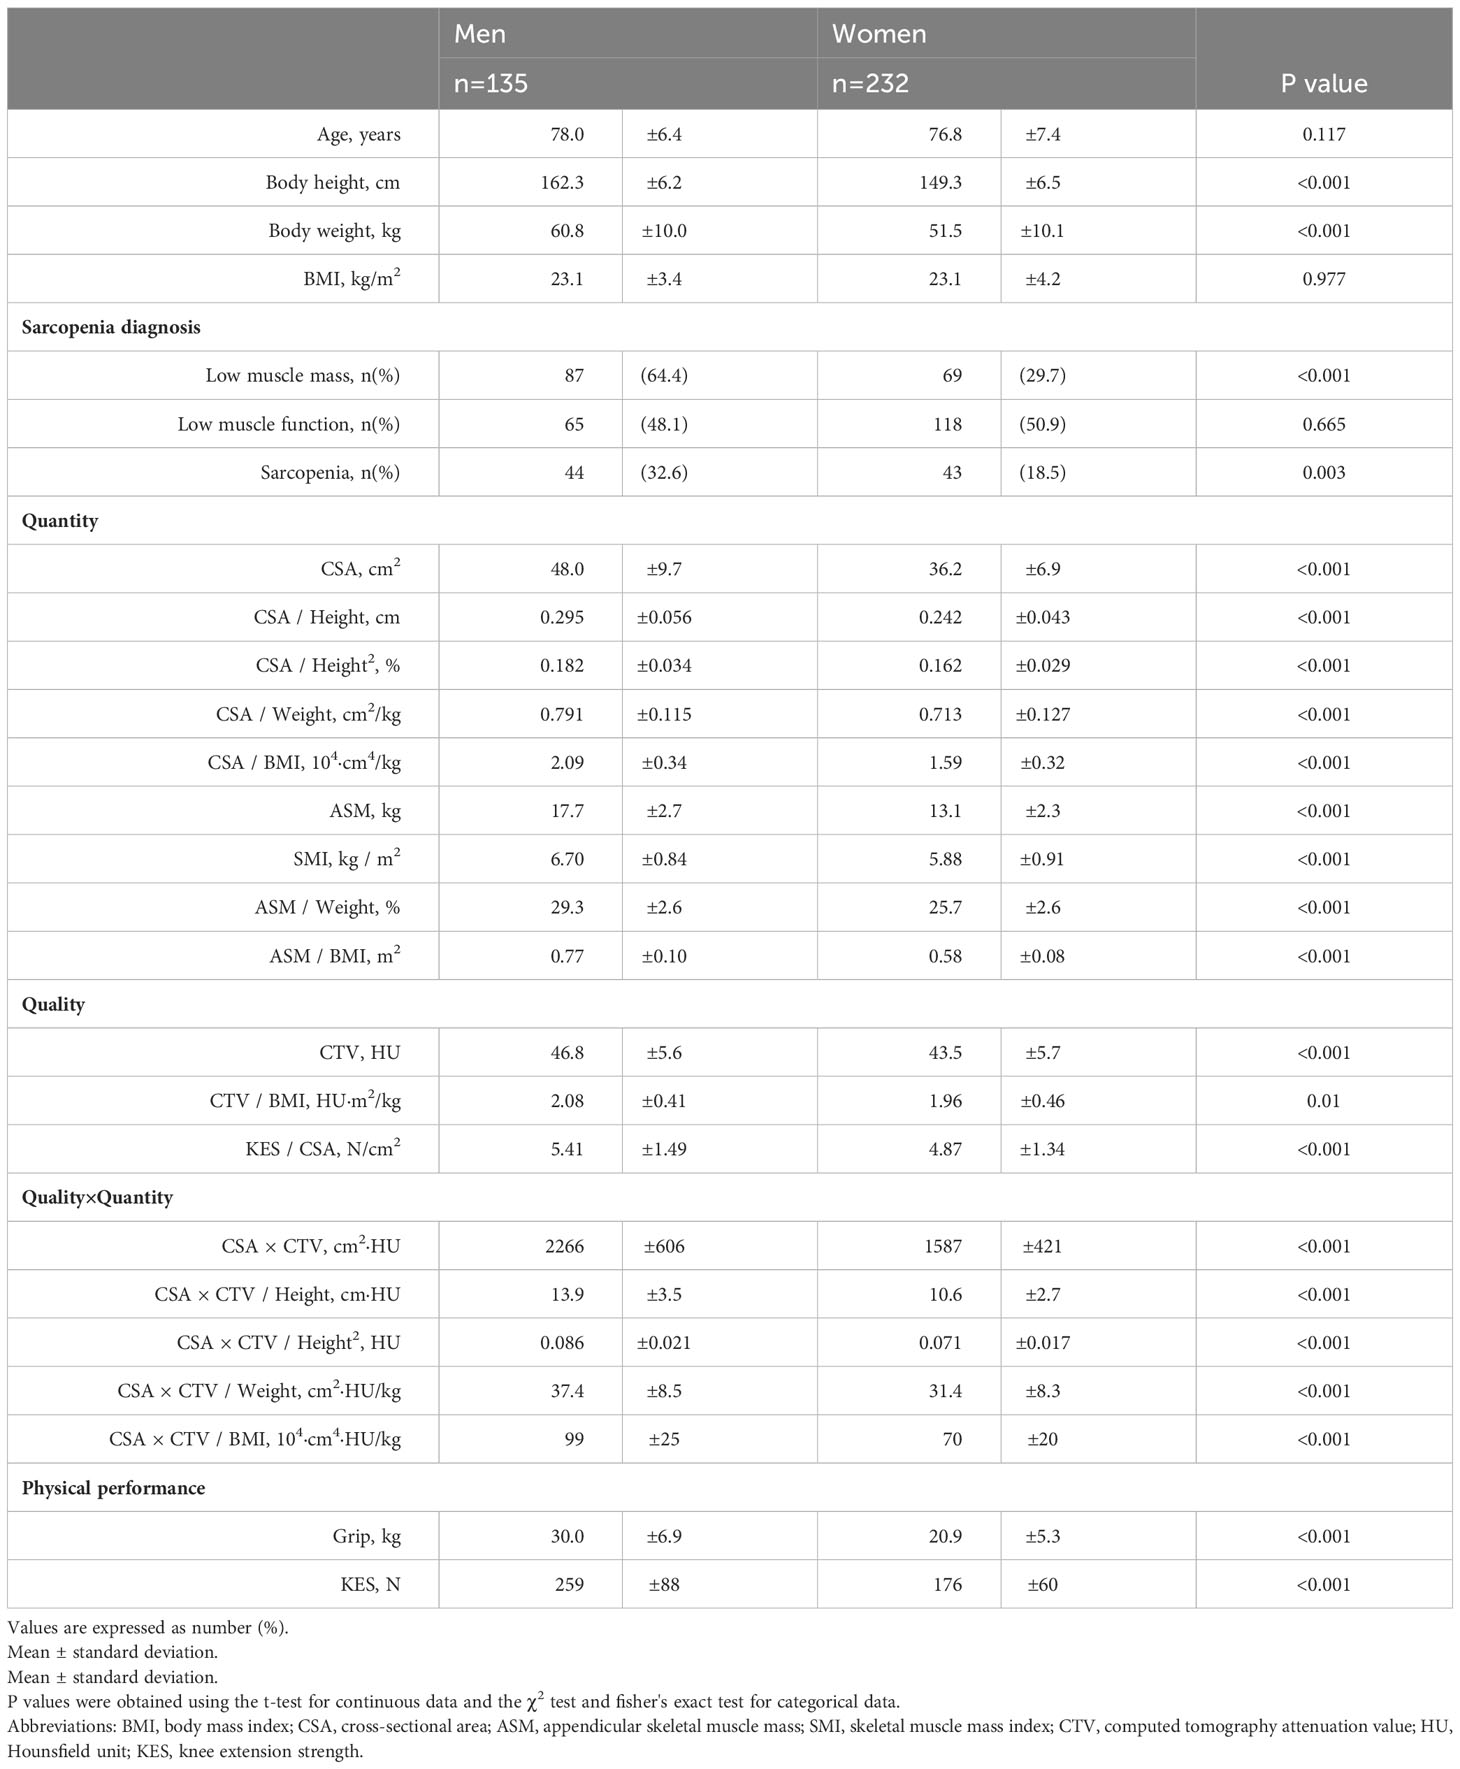
Table 8 Characteristics of the external validation cohort.
Discussion
This study is the first to compare physical function, muscle mass, and muscle quality-related parameters measured using CT and DXA, including various corrections, and investigate the relationship between muscle mass loss, muscle function loss, and sarcopenia diagnosis based on the AWGS 2019 diagnostic criteria in the general Asian population.
Parameters such as CSA, CTV, and CSA×CTV, which can be calculated using CT, showed a correlation with many physical functions. As the correlations with physical functions vary depending on the parameters and correction methods, it is important to consider using different parameters for different purposes. Because of the small difference, no direct statistical testing was performed. However, the uncorrected CSA×CTV, examined as a composite item of muscle mass and quality, showed a slightly stronger association than the uncorrected CSA in many functions. This tendency was stronger in men than in women, suggesting that CSA×CTV may be a better indicator of overall physical function than CSA or CTV alone. We previously reported that KES was independently related to Qc CSA and CTV (14), in the present study, the Qc muscle is the primary working muscle for KES and power; hence, uncorrected CSA, CSA×CTV, and height-corrected variables are suitable for evaluation. Regarding height correction, there was almost no difference in correction by height2. Considering the possibility of overcorrection, we believe that correction by height is sufficient. In functions other than muscle strength, weight correction for CSA, CSA×CTV, and ASM showed several correlations, indicating that weight correction is a good index for evaluating motor abilities other than muscle strength. In sit-ups, weight-corrected CSA, CSA×CTV, and ASM showed better correlation than other correction methods in both men and women, indicating a high degree of specificity. Although CTV is not highly correlated with physical function, it was most highly correlated in endurance events such as sit-ups. CTV reflects fatty infiltration, and the lower value of CTV when fat is abundant is thought to be a major factor influencing CTV reduction in muscles (27). Part of CTV may be derived from type 1 fibers, which have a high-fat content in myocytes (28, 29). This indicates that the presence of more type 1 fibers in the muscle would decrease the CTV; however, the present results indicated a positive correlation, which is the opposite of that assumed to be derived from muscle fiber type. The reasons for this may include that the effect of fat infiltration may be more significant than the effect of muscle fiber type and that the rectus femoris is the only Qc muscle directly involved in upper body raising and the trunk muscle is the main working muscle, which may not have been directly evaluated.
The correction for BMI is also noteworthy. ASM/BMI is most strongly and directly correlated with weakness and slowness (10), and dividing the muscle mass by BMI is a good method for physical function assessment. In CT measurements, the correction for BMI showed significant correlations with several physical functions. Indeed, CSA/BMI was significantly correlated with all physical functions in both sexes, and CSA×CTV/BMI was significantly correlated with all physical functions, except for normal walking speed in women. Correcting indices that include muscle mass, such as CSA and CSA×CTV, with BMI is considered a good index for objective evaluation of a wide range of physical functions other than muscle strength in both sexes. Qualitative changes in muscle quality have been reported to result in fatty infiltration in skeletal muscles (5, 30) and changes in the proportion of muscle fibers (31, 32), leading to muscle weakness and decreased physical performance (33–35). However, physical performance can be objectively evaluated using indices that consider muscle mass, muscle quality, and obesity; this partially supports previous reports that muscle strength and physical performance cannot necessarily be evaluated based on muscle mass alone. In measurements using CT, the simultaneous evaluation of fat content and muscle mass may be used as a suitable index for sarcopenia, which was previously assessed based on the combined evaluation of muscle mass loss and decline in muscle strength and physical function. The relationship between qualitative muscle changes and muscle function is thought to be based on the relationship between intramuscular adipose tissue and visceral fat, while visceral fat is strongly correlated with muscle mass loss and ectopic fat, such as intramuscular adipose tissue (36, 37). In particular, fatty infiltration is likely to increase in patients with diabetes and non-alcoholic fatty liver (38–40). While the relationship of muscle quality and quantity with motor function was clarified in this study, the long-term prognosis remains unclear. However, based on reports on the association between CTV and life-threatening diseases, the CTV in muscle assessment may be a major surrogate marker that can predict life expectancy. Further studies on this topic are warranted.
Regarding the diagnostic accuracy of sarcopenia, CSA, CSA×CTV, and their correction by height were highly accurate in men, showing a diagnostic accuracy comparable to that of ASM and SMI, which reflects the total body muscle mass. However, we found little difference between CSA and CSA×CTV. In men, the Qc muscle mass or its correction for height alone was highly indicative of sarcopenia, which was diagnosed using SMI and grip strength or walking speed. Hence, the assessment of Qc muscle mass is quite meaningful, and CSA×CTV is an excellent criterion; nonetheless, its measurement method is challenging compared with that of CSA alone. CSA and CSA×CTV showed moderate diagnostic accuracy in women, which was lower than that in men. This suggests a slight difference between the indicated CT measurements of Qc muscle mass and SMI in women. A minor improvement in the accuracy of sarcopenia diagnosis was observed by using CSA×CTV. Although no statistical comparisons were made, the external validation cohort was an older cohort with lower muscle mass and strength and a higher prevalence of sarcopenia than the internal cohort. Validation using the cutoffs determined for the internal cohort showed that measurements that were good AUCs in the internal cohort were more likely to show good DOR in the external cohort but with some differences in diagnostic accuracy. Taking into account the external validation cohort results, it is still concise to use CSA or CSA height correction, but the use of CSA×CTV and height correction may be considered for higher sensitivity.
Regarding the relationship with muscle mass, the correction of CSA and CSA×CTV by height and height2 showed good diagnostic accuracy in men, although not as robust as that of ASM. These parameters showed good diagnostic value in women but were not as good as in men. This sex difference may be related to the fundamental question of whether the SMI is appropriate as a reference value for sarcopenia, especially in women. Indeed, Baumgartner et al. reported that the relationship of SMI with physical function and frailty in women was relatively weaker when they first proposed SMI as ASM/height2 for the diagnosis of sarcopenia and muscle mass loss (41). In a previously reported analysis of our cohort, the decline in height with age was greater in women than in men, and the non-apparent decline in SMI in women is thought to be due to the greater decline in height, as compared with the decline in muscle mass with aging (11, 42). It could be inferred that some women have “hidden muscle mass loss,” a condition in which the SMI does not decrease but the muscle mass decreases. However, given that the difference in the diagnosis of sarcopenia and muscle mass loss is greater than that of ASM without height correction, the Qc muscle in women may not be representative of total body muscle mass. As we only included middle-aged and older people in the present study, it was impossible to determine the clear criteria for muscle mass loss, such as the -2 standard deviation in younger people. Additionally, because this was a cross-sectional study, the longitudinal significance of these parameters could not be evaluated. Therefore, it was not possible to determine whether Qc muscle analysis is an appropriate method for assessing those who cannot be evaluated well using SMI. Future studies in this regard are warranted. Taking into account the external validation cohort results, the use of CSA or CSA height and height2 correction is concise for the diagnosis of muscle mass loss based on SMI; however, the use of CSA×CTV and its height and height2 correction may also be considered for higher sensitivity.
With respect to physical function, CSA, CSA×CTV, ASM, and their BMI correction, as well as height correction in CSA and CSA×CTV, showed good diagnostic accuracy, with similar accuracies in both men and women. Thus, an increase in diagnostic performance could be expected when CSA and CTV are evaluated simultaneously. The accuracy of CT and DXA measurements in assessing muscle function is similar to that of KES, and they more accurately reflect motor function decline than SMI. This could be because these indices are more closely related to physical function than SMI, as previously mentioned. Furthermore, ASM and ASM/BMI are more likely to be associated with prognosis than SMI (11). Although prognoses were not assessed in this study, CSA, CSA×CTV, and their BMI-corrected values may be assessed with both physical function and prognosis. Future studies must evaluate their long-term association. Taking into account the external validation cohort, it seems advisable to consider the use of CSA or its BMI correction or, with the expectation of high sensitivity, CSA×CTV or its BMI correction for muscle dysfunction.
The present study has some limitations. First, this was a cross-sectional study, and a longitudinal study is therefore required to clarify the effect of each measurement. Second, CT has disadvantages such as radiation exposure, cost, and equipment requirements. Nevertheless, it is not necessary to perform CT on the entire length of the Qc muscle, and radiation exposure can, therefore, be minimized. Third, the CTV is difficult to use as an absolute value because there may be racial differences in this parameter (30).
For CT to be widely used for muscle evaluation in the future, it is necessary to verify the differences between models and to automate a more objective and simple measurement method. This is because the possibility that performance differences between models and differences in image processing may affect measurement values cannot be denied. It would be necessary, for example, to evaluate differences between models by photographing the same subject and verifying the differences. Nonetheless, we believe that a detailed Qc muscle evaluation using CT with relative objectivity, as in the present study, can be used to confirm the validity and reproducibility of the reference values and to evaluate non-invasive techniques such as echoes, which have a narrower imaging range and tend to be less reproducible and can also contribute to the development of other modalities. The external validation cohort was used; however, this cohort was older than the base cohort, which may have resulted in differences in sensitivity and specificity due to spectrum bias.
In conclusion, we investigated the relationship of Qc muscle mass and muscle quality with physical function and its use in diagnosing sarcopenia. In both men and women, Qc CT measurements, represented by CSA, showed a good association with motor function, and simultaneous assessment of CSA and CTV and BMI correction increased the correlation with several motor functions. Sarcopenia diagnosis based on SMI, CSA, and CSA×CTV and their correction by height were highly accurate and useful for diagnosis in men but were only moderately accurate in women. Overall, these results suggest that CT imaging of the Qc muscle is a useful diagnostic method for sarcopenic changes such as muscle mass loss, muscle weakness, and loss of muscle function.
Data availability statement
The data analyzed in this study is subject to the following licenses/restrictions: Not available to outsiders. Requests to access these datasets should be directed to RO, otsuka@ncgg.go.jp.
Ethics statement
The studies involving humans were approved by The Ethics and Conflict of Interest Committee of the National Center for Geriatrics and Gerontology. The studies were conducted in accordance with the local legislation and institutional requirements. The participants provided their written informed consent to participate in this study.
Author contributions
TM: Formal analysis, Validation, Visualization, Writing – original draft. YM: Conceptualization, Funding acquisition, Writing – review & editing. MTo: Formal analysis, Writing – review & editing. YS: Software, Writing – review & editing. SIs: Supervision, Writing – review & editing. TW: Methodology, Writing – review & editing. MTa: Validation, Writing – review & editing. YN: Data curation, Investigation, Writing – review & editing. CT: Data curation, Formal Analysis, Writing – review & editing. HS: Funding acquisition, Supervision, Writing – review & editing. SIm: Supervision, Writing – review & editing. RO: Investigation, Project administration, Resources, Writing – review & editing. HA: Supervision, Writing – review & editing.
Funding
The author(s) declare financial support was received for the research, authorship, and/or publication of this article. This study was supported by JSPS KAKENHI (grant number: 19K09638) and Research Funding for Longevity Sciences (19–10, 29–12, 20–12) from the National Center for Geriatrics and Gerontology, Japan.
Acknowledgments
The authors would like to thank all participants, health professionals, and researchers from the Section of the NILS-LSA and the Center for Frailty and Locomotive Syndrome involved in the data collection and analyses.
Conflict of interest
The authors declare that the research was conducted in the absence of any commercial or financial relationships that could be construed as a potential conflict of interest.
Publisher’s note
All claims expressed in this article are solely those of the authors and do not necessarily represent those of their affiliated organizations, or those of the publisher, the editors and the reviewers. Any product that may be evaluated in this article, or claim that may be made by its manufacturer, is not guaranteed or endorsed by the publisher.
Supplementary material
The Supplementary Material for this article can be found online at: https://www.frontiersin.org/articles/10.3389/fendo.2023.1259350/full#supplementary-material
References
1. Beaudart C, Zaaria M, Pasleau F, Reginster J-Y, Bruyère O. Health outcomes of sarcopenia: A systematic review and meta-analysis. PloS One (2017) 12:e0169548. doi: 10.1371/journal.pone.0169548
2. Cruz-Jentoft AJ, Bahat G, Bauer J, Boirie Y, Bruyère O, Cederholm T, et al. Sarcopenia: Revised European consensus on definition and diagnosis. Age Ageing (2019) 48:16–31. doi: 10.1093/ageing/afy169
3. Yamada M, Kimura Y, Ishiyama D, Nishio N, Abe Y, Kakehi T, et al. Differential characteristics of skeletal muscle in community-dwelling older adults. J Am Med Dir Assoc (2017) 18:807.e9–807.e16. doi: 10.1016/j.jamda.2017.05.011
4. Visser M, Goodpaster BH, Kritchevsky SB, Newman AB, Nevitt M, Rubin SM, et al. Muscle mass, muscle strength, and muscle fat infiltration as predictors of incident mobility limitations in well-functioning older persons. J Gerontol A Biol Sci Med Sci (2005) 60:324–33. doi: 10.1093/gerona/60.3.324
5. Azzabou N, Hogrel JY, Carlier PG. NMR based biomarkers to study age-related changes in the human quadriceps. Exp Gerontol (2015) 70:54–60. doi: 10.1016/j.exger.2015.06.015
6. Sergi G, Trevisan C, Veronese N, Lucato P, Manzato E. Imaging of sarcopenia. Eur J Radiol (2016) 85:1519–24. doi: 10.1016/j.ejrad.2016.04.009
7. Giovannini S, Brau F, Forino R, Berti A, D’ignazio F, Loreti C, et al. Sarcopenia: Diagnosis and management, state of the art and contribution of ultrasound. J Clin Med (2021) 10:5552. doi: 10.3390/jcm10235552
8. Goodpaster BH, Thaete FL, Kelley DE. Composition of skeletal muscle evaluated with computed tomography. Ann N Y Acad Sci (2000) 904:18–24. doi: 10.1111/j.1749-6632.2000.tb06416.x
9. Anderson DE, D’Agostino JM, Bruno AG, Demissie S, Kiel DP, Bouxsein ML. Variations of CT-based trunk muscle attenuation by age, sex, and specific muscle. J Gerontol A Biol Sci Med Sci (2013) 68:317–23. doi: 10.1093/gerona/gls168
10. Cawthon PM, Peters KW, Shardell MD, McLean RR, Dam TTL, Kenny AM, et al. Cutpoints for low appendicular lean mass that identify older adults with clinically significant weakness. J Gerontol A Biol Sci Med Sci (2014) 69:567–75. doi: 10.1093/gerona/glu023
11. Otsuka R, Matsui Y, Tange C, Nishita Y, Tomida M, Ando F, et al. What is the best adjustment of appendicular lean mass for predicting mortality or disability among Japanese community dwellers? BMC Geriatr (2018) 18:8. doi: 10.1186/s12877-017-0699-6
12. Kim KM, Jang HC, Lim S. Differences among skeletal muscle mass indices derived from height-, weight-, and body mass index-adjusted models in assessing sarcopenia. Korean J Intern Med (2016) 31:643–50. doi: 10.3904/kjim.2016.015
13. Kasai T, Ishiguro N, Matsui Y, Harada A, Takemura M, Yuki A, et al. Sex- and age-related differences in mid-thigh composition and muscle quality determined by computed tomography in middle-aged and elderly Japanese. Geriatr Gerontol Int (2015) 15:700–6. doi: 10.1111/ggi.12338
14. Mizuno T, Matsui Y, Tomida M, Suzuki Y, Nishita Y, Tange C, et al. Differences in the mass and quality of the quadriceps with age and sex and their relationships with knee extension strength. J Cachexia Sarcopenia Muscle (2021) 12:900–12. doi: 10.1002/jcsm.12715
15. Naruse M, Trappe S, Trappe TA. Human skeletal muscle-specific atrophy with aging: a comprehensive review. J Appl Physiol (2023) 134:900–14. doi: 10.1152/japplphysiol.00768.2022
16. Oba H, Matsui Y, Arai H, Watanabe T, Iida H, Mizuno T, et al. Evaluation of muscle quality and quantity for the assessment of sarcopenia using mid-thigh computed tomography: a cohort study. BMC Geriatr (2021) 21:239. doi: 10.1186/s12877-021-02187-w
17. Shimokata H, Ando F, Niino N. A new comprehensive study on aging-the national institute for longevity sciences, longitudinal study of aging (NILS-LSA). J Epidemiol (2000) 10:1–9. doi: 10.2188/jea.10.1sup_1
18. Hirano Y, Yamada Y, Matsui Y, Ota S, Arai H. Lower limb muscle quality and phase angle contribute to the reduced walking speed among older adults. Geriatr Gerontol Int (2022) 22:603–9. doi: 10.1111/ggi.14423
19. Kuriyama K, Matsui Y, Suzuki Y, Mizuno T, Watanabe T, Takemura M, et al. Relationship between sarcopenia classification and thigh muscle mass, fat area, muscle CT value and osteoporosis in middle-aged and older Japanese adults. Bone (2022) 163:116487. doi: 10.1016/j.bone.2022.116487
20. Tracy BL, Ivey FM, Hurlbut D, Martel GF, Lemmer JT, Siegel EL, et al. Muscle quality. II. Effects of strength training in 65- to 75-yr-old men and women. J Appl Physiol (1999) 86:195–201. doi: 10.1152/jappl.1999.86.1.195
21. Fujita R, Matsui Y, Harada A, Takemura M, Kondo I, Nemoto T, et al. Does the Q – H index show a stronger relationship than the H:Q ratio in regard to knee pain during daily activities in patients with knee osteoarthritis? J Phys Ther Sci (2016) 28:3320–4. doi: 10.1589/jpts.28.3320
22. Meng X, Rosenthal R, Rubin DB. Comparing correlated correlation coefficients. Psychol Bull (1992) 111:172–5. doi: 10.1037/0033-2909.111.1.172
23. Chen LK, Woo J, Assantachai P, Auyeung TW, Chou MY, Iijima K, et al. Asian working group for sarcopenia: 2019 consensus update on sarcopenia diagnosis and treatment. J Am Med Dir Assoc (2020) 21:300–307.e2. doi: 10.1016/j.jamda.2019.12.012
24. DeLong ER, DeLong DM, Clarke-Pearson DL. Comparing the areas under two or more correlated receiver operating characteristic curves: A nonparametric approach. Biometrics (1988) 44:837–45. doi: 10.2307/2531595
25. Moses LE, Shapiro D, Littenberg B. Combining independent studies of a diagnostic test into a summary roc curve: Data-analytic approaches and some additional considerations. Stat Med (1993) 12:1293–316. doi: 10.1002/sim.4780121403
26. Glas AS, Lijmer JG, Prins MH, Bonsel GJ, Bossuyt PMM. The diagnostic odds ratio: A single indicator of test performance. J Clin Epidemiol (2003) 56:1129–35. doi: 10.1016/S0895-4356(03)00177-X
27. Goodpaster BH, Kelley DE, Thaete FL, He J, Ross R. Skeletal muscle attenuation determined by computed tomography is associated with skeletal muscle lipid content. J Appl Physiol (2000) 89:104–10. doi: 10.1152/jappl.2000.89.1.104
28. Schrauwen-Hinderling VB, Hesselink MKC, Schrauwen P, Kooi ME. Intramyocellular lipid content in human skeletal muscle. Obesity (2006) 14:357–67. doi: 10.1038/oby.2006.47
29. Staron RS, Hagerman FC, Hikida RS, Murray TF, Hostler DP, Crill MT, et al. Fiber type composition of the vastus lateralis muscle of young men and women. J Histochem Cytochem (2000) 48:623–9. doi: 10.1177/002215540004800506
30. Goodpaster BH, Carlson CL, Visser M, Kelley DE, Scherzinger A, Harris TB, et al. Attenuation of skeletal muscle and strength in the elderly: The health ABC study. J Appl Physiol (2001) 90:2157–65. doi: 10.1152/jappl.2001.90.6.2157
31. Lexell J, Taylor CC, Sjöström M. What is the cause of the ageing atrophy? Total number, size and proportion of different fiber types studied in whole vastus lateralis muscle from 15- to 83-year-old men. J Neurol Sci (1988) 84:275–94. doi: 10.1016/0022-510X(88)90132-3
32. Mattiello-Sverzut AC, Chimelli L, Moura MS de A, Teixeira S, de Oliveira JAM. The effects of aging on biceps brachii muscle fibers: a morphometrical study from biopsies and autopsies. Arq Neuropsiquiatr (2003) 61:555–60. doi: 10.1590/S0004-282X2003000400006
33. Young H-J, Jenkins NT, Zhao Q, Mccully KK. Measurement of intramuscular fat by muscle echo intensity. Muscle Nerve (2015) 52:963–71. doi: 10.1002/mus.24656
34. Akima H, Yoshiko A, Tomita A, Ando R, Saito A, Ogawa M, et al. Relationship between quadriceps echo intensity and functional and morphological characteristics in older men and women. Arch Gerontol Geriatr (2017) 70:105–11. doi: 10.1016/j.archger.2017.01.014
35. Watanabe Y, Yamada Y, Fukumoto Y, Ishihara T, Yokoyama K, Yoshida T, et al. Echo intensity obtained from ultrasonography images reflecting muscle strength in elderly men. Clin Interv Aging (2013) 8:993–8. doi: 10.2147/CIA.S47263
36. Lim S, Meigs JB. Ectopic fat and cardiometabolic and vascular risk. Int J Cardiol (2013) 169:166–76. doi: 10.1016/j.ijcard.2013.08.077
37. Yang YX, Chong MS, Lim WS, Tay L, Yew S, Yeo A, et al. Validity of estimating muscle and fat volume from a single MRI section in older adults with sarcopenia and sarcopenic obesity. Clin Radiol (2017) 72:427.e9–427.e14. doi: 10.1016/j.crad.2016.12.011
38. Park SW, Goodpaster BH, Strotmeyer ES, de Rekeneire N, Harris TB, Schwartz AV, et al. Decreased muscle strength and quality in older adults with type 2 diabetes: the health, aging, and body composition study. Diabetes (2006) 55:1813–8. doi: 10.2337/db05-1183
39. Komiya H, Mori Y, Yokose T, Kurokawa N, Horie N, Tajima N. Effect of intramuscular fat difference on glucose and insulin reaction in oral glucose tolerance test. J Atheroscler Thromb (2006) 13:136–42. doi: 10.5551/jat.13.136
40. Kitajima Y, Hyogo H, Sumida Y, Eguchi Y, Ono N, Kuwashiro T, et al. Severity of non-alcoholic steatohepatitis is associated with substitution of adipose tissue in skeletal muscle. J Gastroenterol Hepatol (2013) 28:1507–14. doi: 10.1111/jgh.12227
41. Baumgartner RN, Koehler KM, Gallagher D, Romero L, Heymsfield SB, Ross RR, et al. Epidemiology of sarcopenia among the elderly in New Mexico. Am J Epidemiol (1998) 147:755–63. doi: 10.1093/oxfordjournals.aje.a009520
Keywords: computed tomography, quadriceps femoris, muscle quality, muscle mass, sarcopenia
Citation: Mizuno T, Matsui Y, Tomida M, Suzuki Y, Ishizuka S, Watanabe T, Takemura M, Nishita Y, Tange C, Shimokata H, Imagama S, Otsuka R and Arai H (2023) Relationship between quadriceps muscle computed tomography measurement and motor function, muscle mass, and sarcopenia diagnosis. Front. Endocrinol. 14:1259350. doi: 10.3389/fendo.2023.1259350
Received: 15 July 2023; Accepted: 23 October 2023;
Published: 16 November 2023.
Edited by:
Jianliang Jin, Nanjing Medical University, ChinaReviewed by:
Sung Hye Kong, Seoul National University Bundang Hospital, Republic of KoreaSilvia Giovannini, Catholic University of the Sacred Heart, Rome, Italy
Copyright © 2023 Mizuno, Matsui, Tomida, Suzuki, Ishizuka, Watanabe, Takemura, Nishita, Tange, Shimokata, Imagama, Otsuka and Arai. This is an open-access article distributed under the terms of the Creative Commons Attribution License (CC BY). The use, distribution or reproduction in other forums is permitted, provided the original author(s) and the copyright owner(s) are credited and that the original publication in this journal is cited, in accordance with accepted academic practice. No use, distribution or reproduction is permitted which does not comply with these terms.
*Correspondence: Takafumi Mizuno, takafumi.mizuno@med.nagoya-u.ac.jp