 Maria Elena Martinez1†
 Arturo Hernandez
- 1Center for Molecular Medicine, MaineHealth Institute for Research, Scarborough, ME, United States
- 2Graduate School for Biomedical Sciences and Engineering, University of Maine, Orono, ME, United States
- 3Department of Medicine, Tufts University School of Medicine, Boston, MA, United States
Background: The genetic code does not fully explain individual variability and inheritance of susceptibility to endocrine conditions, suggesting the contribution of epigenetic factors acting across generations.
Methods: We used a mouse model of developmental thyrotoxicosis (Dio3-/- mouse) to analyze endocrine outcomes in the adult offspring of Dio3-/- males using standard methods for body composition, and baseline and fasting hormonal and gene expression determinations in serum and tissues of relevance to the control of energy balance.
Results: Compared to controls, adult females with an exposed father (EF females) exhibited higher body weight and fat mass, but not lean mass, a phenotype that was much milder in EF males. After fasting, both EF females and males exhibited a more pronounced decrease in body weight than controls. EF females also showed markedly elevated serum leptin, increased white adipose tissue mRNA expression of leptin and mesoderm-specific transcript but decreased expression of type 2 deiodinase. EF females exhibited decreased serum ghrelin, which showed more pronounced post-fasting changes in EF females than in control females. EF female hypothalami also revealed significant decreases in the expression of pro-opiomelanocortin, agouti-related peptide, neuropeptide Y and melanocortin receptor 4. These markers also showed larger changes in response to fasting in EF females than in control females. Adult EF females showed no abnormalities in serum thyroid hormones, but pituitary expression of thyrotropin-releasing hormone receptor 1 and thyroid gland expression of thyroid-stimulating hormone receptor, thyroid peroxidase and iodotyrosine deiodinase were increased at baseline and showed differential regulation after fasting, with no increase in Trhr1 expression and more pronounced reductions in Tshr, Tpo and Iyd. In EF males, these abnormalities were generally milder. In addition, postnatal day 14 (P14) serum leptin was markedly reduced in EF pups.
Discussion: A paternal excess of thyroid hormone during development modifies the endocrine programming and energy balance in the offspring in a sexually dimorphic manner, with baseline and dynamic range alterations in the leptin-melanocortin system and thyroid gland, and consequences for adiposity phenotypes. We conclude that thyroid hormone overexposure may have important implications for the non-genetic, inherited etiology of endocrine and metabolic pathologies.
1 Introduction
The etiology of complex human conditions, including endocrine and metabolic disorders, is not fully understood. Despite their significant heritability, genetic factors alone cannot explain a large proportion of clinical cases (1–5), suggesting the possibility that intergenerational epigenetic effects (1, 6–8) elicited by environmental circumstances in progenitors or ancestors significantly contribute to the onset or susceptibility to these conditions. In this regard, it is increasingly appreciated that diet (9, 10), obesity (11, 12), environmental chemicals (13) and drugs (14), hormone levels (15), infection states (16), stress and trauma (17) and social interactions (18–20), among other factors, may cause changes in maternal and paternal germ line epigenetic signatures that will lead to phenotypic abnormalities in the offspring and subsequent generations, with broad implications for pathophysiology.
Despite the extensive recent literature on factors that can exert intergenerational epigenetic effects in humans and animal models, we have very limited knowledge of the roles played in this paradigm by the thyroid hormones (21). Yet the role of aberrant thyroid hormone exposure and signaling in intergenerational epigenetics is of particular importance given the high prevalence of thyroid conditions in humans (22), including pregnant women, and the ubiquitous presence in our environment of chemicals that can disrupt thyroid hormone physiology (23, 24).
Recent work has shown that thyroid hormones elicit transgenerational epigenetic effects in humans, as demonstrated by studies on multiple generation descendants of women carrying a mutation in the thyroid hormone receptor beta (15, 25). These women experience abnormally elevated thyroid hormone levels during pregnancy, and their genetically normal offspring exhibits a thyroid axis with altered sensitivity to thyroid hormones, a trait that is maintained for at least two generations across the paternal lineage (15). We have also demonstrated the occurrence of transgenerational epigenetic effects by thyroid hormones using a mouse model of genetic deficiency in the type 3 deiodinase (DIO3), the enzyme that clears both thyroid hormones (26), thyroxine (T4), and 3,5,3’-triiodothyronine (T3), which is considered the active hormone and responsible for canonical signaling due to its highest affinity for the nuclear thyroid hormone receptor (27, 28). Due to the strong developmental pattern of expression of Dio3 (29–33), mice lacking DIO3 function exhibit pronounced fetal and neonatal thyrotoxicosis (34, 35) leading to reduced testis size (32) and decreased methylation in the neonatal testis that in adulthood translates into an aberrant sperm methylome (36). We have shown that these thyroid hormone-driven alterations in the epigenetic information of the male germ line cause abnormalities in genetically normal F2-generation descendants, affecting neonatal brain gene expression patterns and adult behavior (36).
However, the seminal work by Bakke in the 70s using rat models of adult hypothyroidism and neonatal thyrotoxicosis (thyroid hormone excess) indicated that animals subjected to these insults produced offspring with abnormal body weight and altered size of several endocrine organs (37, 38). Following on these historic and simple observations, the goal of the present study is to determine the intergenerational effects of thyroid hormones on growth and neuroendocrine physiology using the DIO3-deficiency mouse model of developmental thyrotoxicosis. Thus, here we investigate the energy balance and neuroendocrine phenotypes in the offspring of T3-overexposed males compared to that of animals of the same genotype generated by non-exposed males. Mice from T3-overexposed fathers manifest sexually dimorphic alterations in adiposity, physiological response to fasting and multiple endocrine endpoints of the leptin-melanocortin system and the thyroid axis, suggesting that thyroid hormone states in previous generations are a significant determinant of endocrine and metabolic outcomes.
2 Methods
2.1 Experimental animals and animal studies
As a model of developmental overexposure to T3, we used mice genetically deficient in the type 3 deiodinase (DIO3). We have previously described that Dio3 -/- mice exhibit markedly elevated serum levels of T3 during fetal and early neonatal life (34). All experimental mice were on an outbred CD-1 genetic background to overcome the impaired fertility of Dio3-/- mice on inbred genetic backgrounds. The original mutant mouse strain was generated in a 129/SvJ genetic background (34, 39) and has been backcrossed on a CD-1 background for more than 12 generations. Due to the genomic imprinting and preferential expression of the Dio3 gene from the paternal allele (39–41), the colony has been maintained for more than eight generations by crossing wild type males with heterozygous females, so that the heterozygous mice generated for colony maintenance are phenotypically normal, as they carry the Dio3 mutation in the maternal allele, which is already largely suppressed due to genomic imprinting (39, 41). To avoid the influence of confounding factors and minimize biological variability, mothers of experimental animals were mated at two months of age with 2-3 month old males. Experimental animals were born before the mother was four months old. Experimental mice represent only first litters from three to seven different mothers, and litter size was limited to 8-12 pups at birth. Mothers of experimental mice were single-caged before giving birth to avoid paternal effects and a concurrent pregnancy while raising the pups. Animals for adult studies were weaned at the age of three weeks, caged in groups of three or four, and sacrificed at 18-20 weeks of age within the third and fifth hour of the light cycle (~Zeitgeber time 3-5). All mice were maintained on a 12 h light/dark cycle, and food (Envigo-Harlan Teklad T.2918.15 for non-breeders and T.2919.10 for breeders) and water were provided ad libitum. For fasting experiments, mice were fasted overnight for 16 h before euthanasia. Also, some neonatal determinations were performed in mice on a 50/50 mixed 129/SvJ/C57BL/6J genetic background, using the same experimental design. This subset of experimental animals was generated by mating 129/SvJ males of the appropriate genotype with wild type (WT) C57BL/6J females. All mice were euthanized by CO2 asphyxiation at a rate of 30-50% volume of the euthanasia chamber per minute, according to the guidelines of the American Veterinary Medical Association. Tissues were harvested and immediately frozen on dry ice until further use. All experiments were approved by the MaineHealth Institute for Research Institutional Animal Care and Use Committee (IACUC), under current protocol number 2112.
2.2 Experimental design
Experimental mice were generated by crossing Dio3-/- males with Dio3+/+ females (Figure 1). We have previously shown that Dio3-/- mice are overexposed to T3 during fetal and early neonatal life (34), and that the neonatal germ cells and adult sperm of Dio3-/- males show alterations in DNA methylation (36). The offspring of these males will be heterozygous for the Dio3 mutation (Dio3m+/p-) and will have a mutated paternal Dio3 allele. To generate suitable control mice, we crossed wild type females with Dio3m-/p+ males (Figure 1). This cross will generate mice of exactly the same genotype (Dio3m+/p-) as experimental mice, but in this case the father will be phenotypically normal (not overexposed to T3 during development (40)) as the mutated allele is the maternal one. Thus, both control (non-exposed fathers, NF mice) and experimental mice (exposed fathers, EF mice) had exactly the same genotype and were born to independent wild type females, the only difference between both groups being the T3 overexposure status of the fathers.
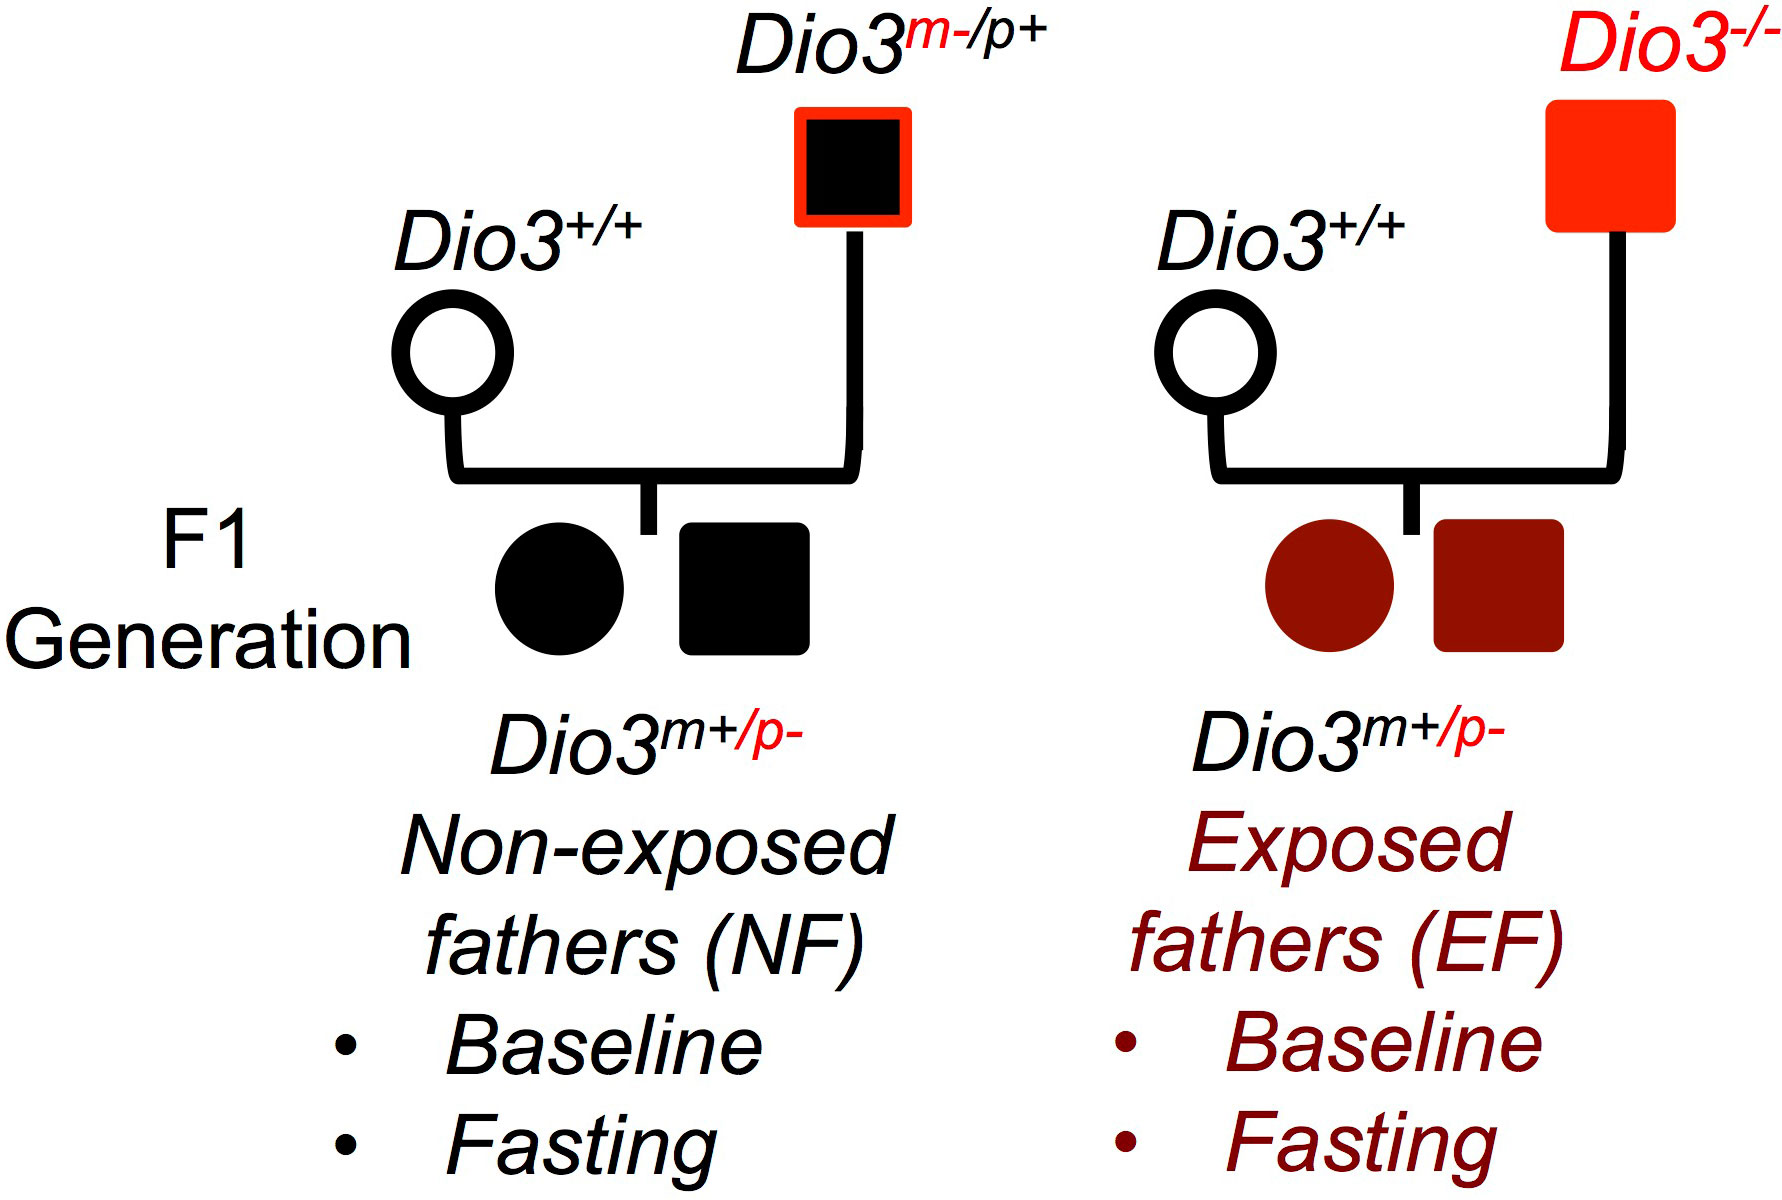
Figure 1 Experimental design. Mating diagrams used to generate the mice to study the net effect of paternal T3 overexposure. Dio3 -/- mice are overexposed to T3 during fetal and early neonatal life. EF, mice generated by a T3 exposed father; NF, mice generated by non-exposed father. (Not all possible genotypes are shown).
2.3 Body composition and serum hormone determinations
Fat and lean mass were measured in isofluorane-anesthetized mice using a Lunar PIXImus II DEXA Densitometer (Fitchburg, WI). During the 5 min of this scanning procedure, mice were maintained anesthetized with a constant airflow containing 3% isofluorane and 3% oxygen.
Blood from adult and neonates was collected from the inferior vena cava, allowed to clot at 4 °C for at least four hours. After 10 minutes centrifugation at 3000 g, serum was taken from the supernatant and stored at -70 °C until further used. Serum levels of T3 and T4 were measured in 10 and 1 μl of serum, respectively, as previously described (42–44) by highly sensitive specific radioimmunoassays using in-house generated antibodies. Serum determinations of leptin, adiponectin and ghrelin were performed using commercially available ELISA kits according to the manufacturer’s instructions. Leptin and Adiponectin kits were purchased from R&D Systems (Bio-Techne, Minneapolis, MN, USA); ghrelin kit was purchased from EMD Millipore Corporation (Billerica, MA, USA).
2.4 Real time quantitative PCR
Mouse tissues were harvested and subsequently frozen on dry ice. Total RNA was extracted using the RNeasy kit from Qiagen (Valencia, CA). Total RNA (1 µg) was reverse transcribed with M-MLV reverse transcriptase in the presence of random decamers (both from Thermo Fisher Scientific, Waltham, MA) at 65°C for 5 min, then 37°C for 50 min. The 20 μl reverse transcription reactions were DNAse treated and diluted by adding 230 μl of RNase free water. An aliquot of each sample was mixed together for an internal standard and diluted fourfold. Real-time PCR reactions were set up in duplicate with gene-specific primers and SYBR Select Master Mix (Thermo Fisher Scientific, Waltham, MA), and run on the CFX Connect from Bio-Rad (Hercules, CA), where they underwent an initial 10 min denaturing step, followed by 36 cycles of a denaturing step (94°C for 30 s) and an annealing/extension step (60°C for 1 min). For each individual sample, expression was corrected by the expression of one or more (geometric mean) housekeeping genes (Gapdh, Actb, Ppia or Rn18s), if they did not exhibit any significant difference in expression between experimental groups. Expression data are shown in arbitrary units and represented as fold-change over the mean value in the control group, or as fold-change over baseline values for fasting experiments. The sequences of the primers used for each gene determination are shown in Supplementary Table 1.
2.5 Statistical analysis
Statistical analyses were performed using the statistical tools of GraphPad Prism 6 (GraphPad Software, Inc.). Given the sexual dimorphisms in body weight and endocrine parameters, adult females and males were analyzed separately. A Student’s t-test was used to determine statistical significance at baseline between the two experimental groups. We used one-way ANOVA and Tukey’s post hoc test to determine statistical significance in comparisons between experimental groups or treatments. Unless otherwise indicated, responses to fasting (gene expression and hormone concentrations) were calculated as a ratio between post-fasting and corresponding baseline values, or as an increment (body composition) between post-fasting and corresponding baseline. Statistical significance was defined as P<0.05. Data are represented as the individual values of independent biological samples and the mean ± SEM. The number of mice (independent samples) used per experimental group is indicated in each figure and typically varied between 17-22 for baseline body composition, 5-12 for the rest of the adult studies, and 14-23 for neonatal studies.
3 Results
3.1 Body composition and fasting response in mice with T3-overexposed fathers
We examined weight and body composition in mice (EF mice) fathered by males overexposed to T3 during development, and compared them with control mice (NE mice) of the same genotype (see Methods) fathered by phenotypically normal males (Figure 1). We observed that EF females showed a marked increase in body weight that was the result of increased adiposity and not of changes in lean mass (Figure 2A). Compared to control males, EF males did not exhibit significant differences in body weight or lean mass, but we noted a mild increase in fat mass and a significant increase in fat percentage (Figure 2B).
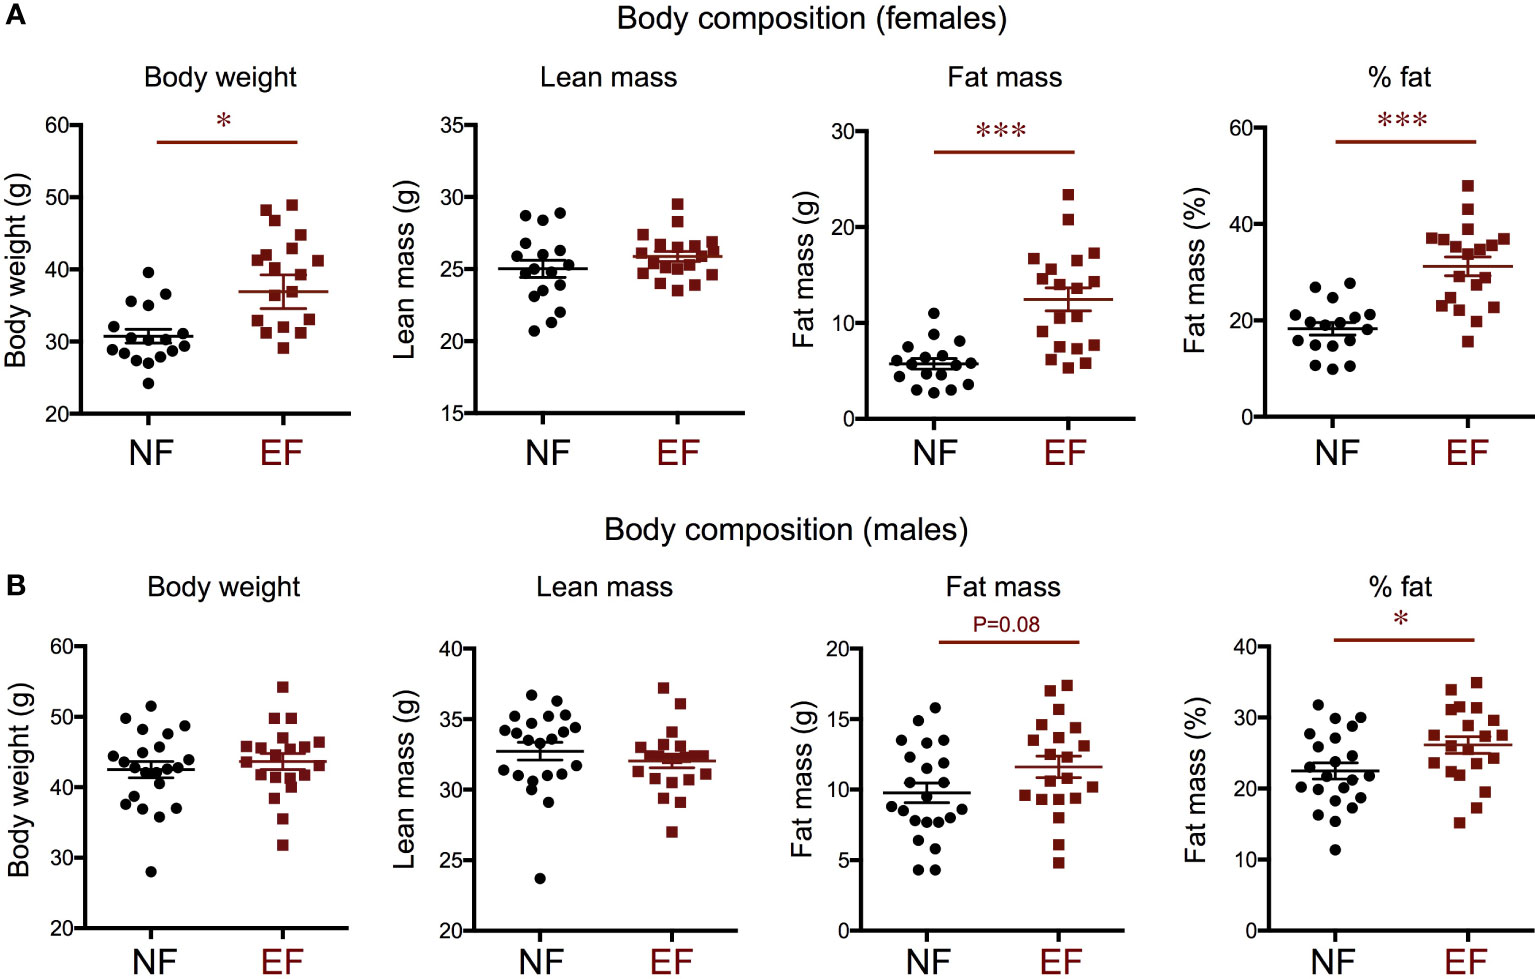
Figure 2 Body composition in the female (A) and male (B) offspring of T3-overexposed (EF) and non-exposed (NF) fathers. Each point represents a different animal. Experimental animals represent four to seven different litters. * and *** indicate P<0.05 and 0.001, respectively, as determined by the Student’s t-test (n=17-22).
We subjected a subset of animals to a 16 h fasting and determined individual changes in body composition. Both EF and NE female lost total weight after fasting, and this was largely due to a decrease in lean mass, not fat mass (Figure 3A). However, this post-fasting loss in body weight and lean mass was significantly more pronounced in EF females than in NE females (Figure 3A). Regarding males, both EF and NF males showed similar reductions in lean mass after fasting (Figure 3B), but total body weight loss was larger in EF males (Figure 3B). This difference, in contrast to females, was accounted for by a lack in fat mass increase, which was noted in NF males (Figure 3B).
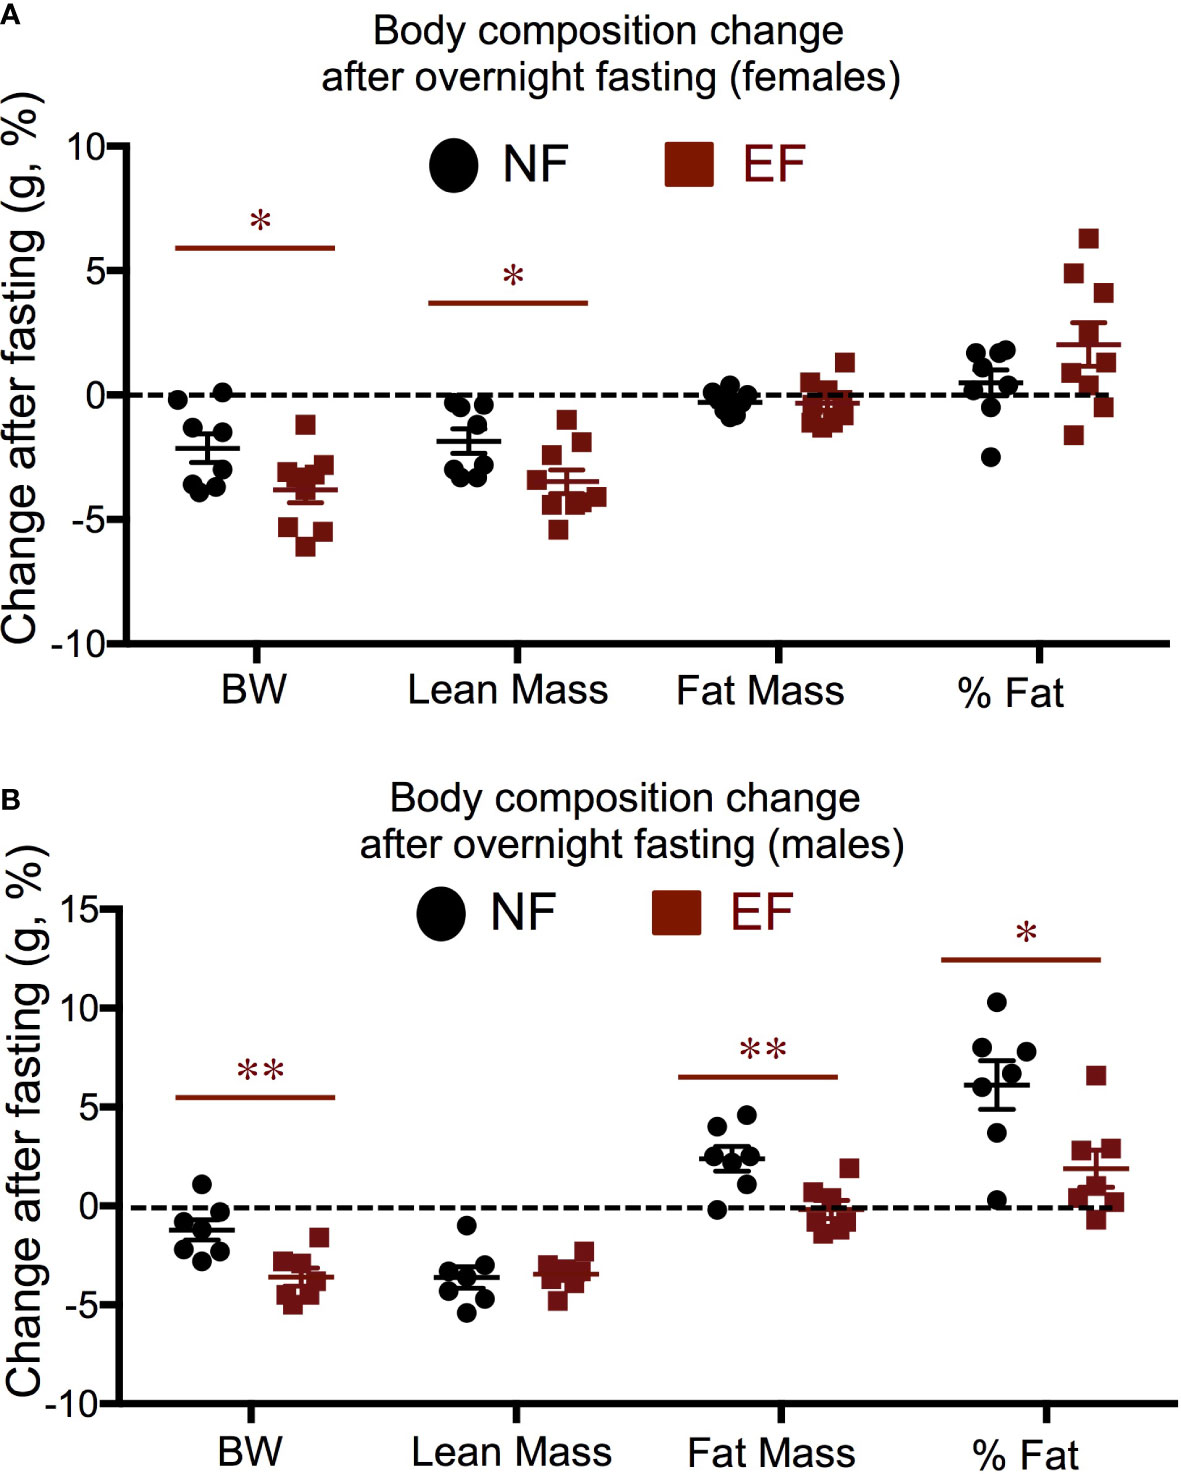
Figure 3 Body composition changes in response to a 16 h fasting. (A) Females; (B) Males. Data represent the % change vs baseline values. *, ** indicate P<0.05, 0.01, respectively as determined by the Student’s t-test (n=7-9).
3.2 Baseline and fasting response of thyroid axis endpoints
We then investigated hormone levels and gene expression of relevance to the thyroid axis. We observed no differences between EF and NF females in serum levels of T3 and T4 (Figure 4A). In males, no difference in serum T4 was noted, but EF males showed significantly increased serum T3 (Figure 4B). After fasting, females and males of both experimental groups manifested a reduction of serum T4 from baseline levels, but this reduction was comparable between EF and NF mice of either sex (Figure 4C).
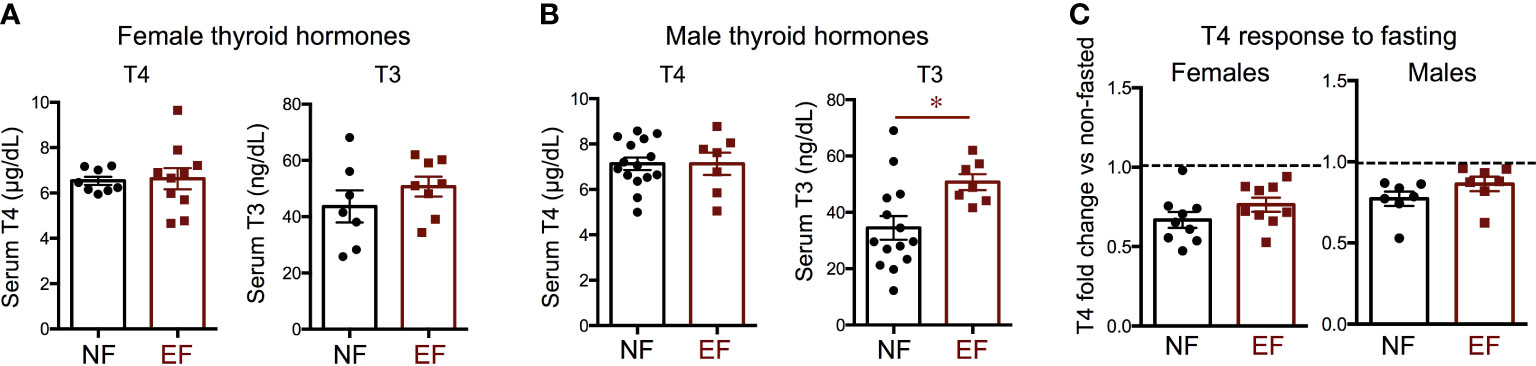
Figure 4 Baseline thyroid hormones and T4 change after fasting. Serum thyroid hormone levels in females (A) and males (B); (C) Change in T4 after fasting in females and males. * indicate P<0.05 as determined by the Student’s t-test (n=7-15).
We measured gene expression in the thyroid gland of markers thyroid-stimulating hormone receptor (Thsr), thyroid peroxidase (Tpo) and iodotyrosine deiodinase (Iyd). We observed that the expression of all three markers at baseline was significantly elevated in EF females (Figure 5A), but significantly decreased in EF males (Figure 5B). Although the expression of these markers was higher in EF female thyroid glands, their expression after fasting was more pronouncedly reduced from baseline levels than in NF females. (Figure 5C). In contrast, fasting elicited comparable reductions in the expression of these markers in EF and NF males, and we only noted that Tpo fasting response was not as large in EF males as in NF males (Figure 5D).
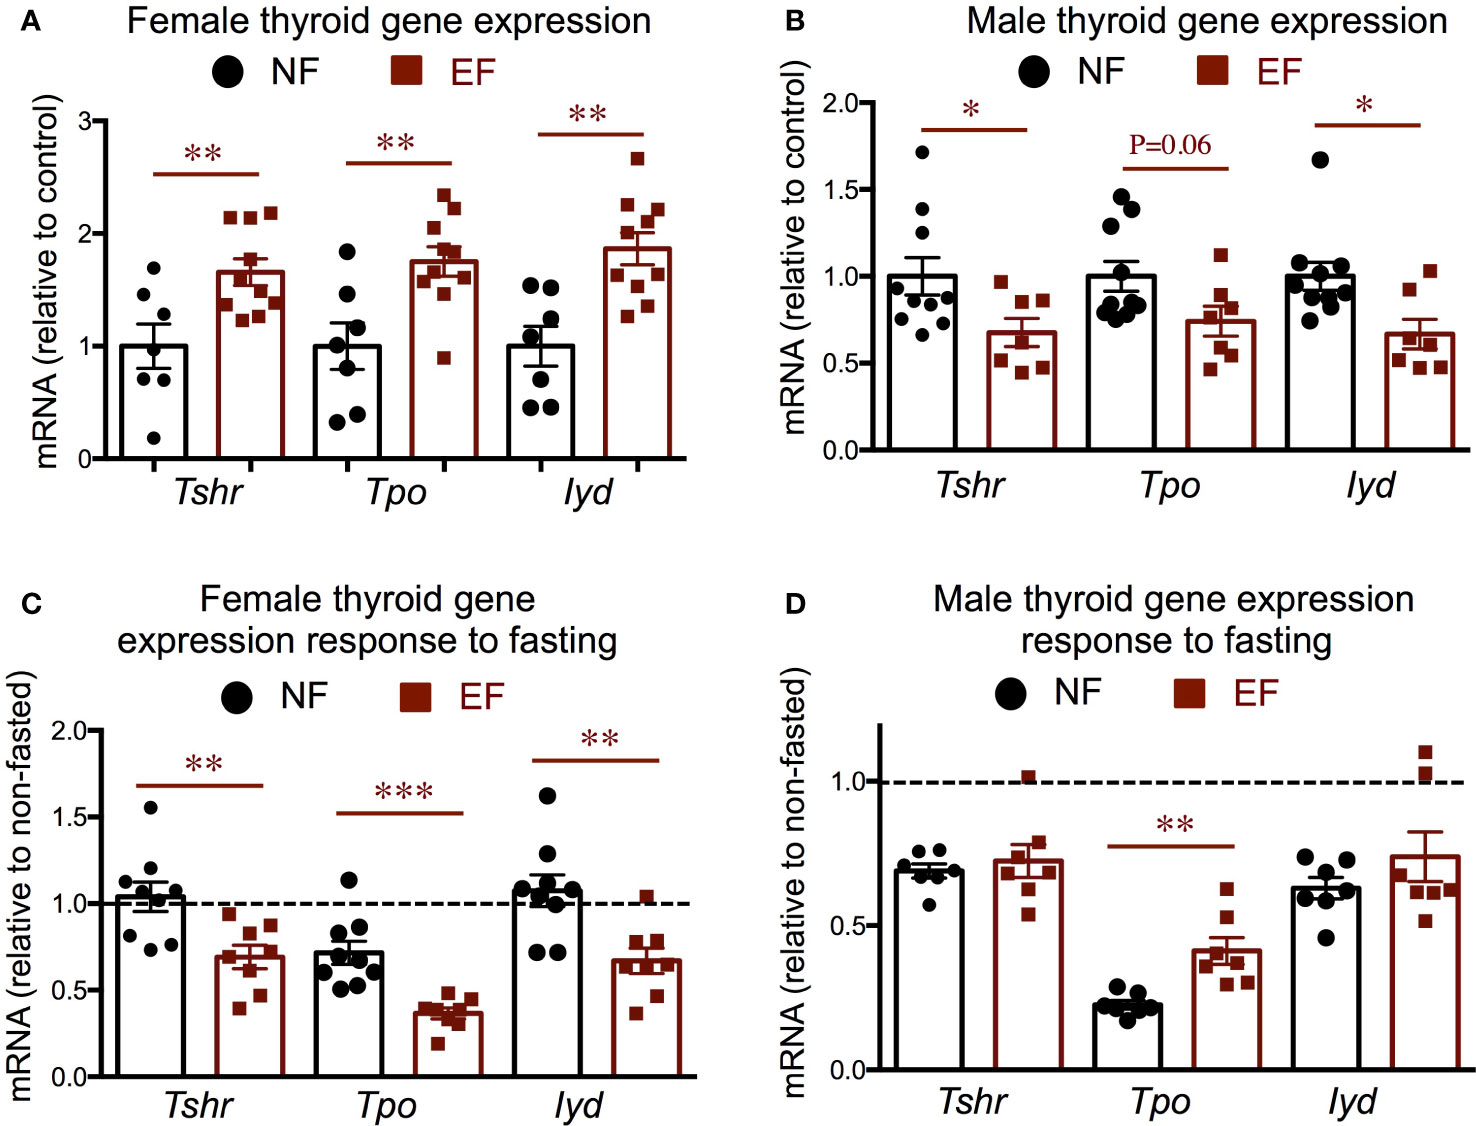
Figure 5 Baseline and post-fasting thyroid gland gene expression. (A, B) Baseline gene expression in females (A) and males (B); (C, D) Post-fasting fold change in gene expression over corresponding baseline values in females (C) and males (D). *, **, *** indicate P<0.05, 0.01 and 0.001, respectively as determined by the Student’s t-test (A, B) or by one-way ANOVA and Tukey’s post hoc test (C, D) (n=7-10).
Pituitary and hypothalamic gene expression did not show major differences between EF and NF females. We observed increased pituitary Trhr1expression in EF females, and a slight, not significant, increased in Tshb expression but no changes in type 2 deiodinase (Dio2), Dio3, or T3 target kruppel-like factor 9 (Klf9) (Figure 6A). EF females also exhibited decreased hypothalamic expression of thyrptropin-releasing hormone (Trh) at baseline, but no differences in the expression of Dio2, Dio3 or T3-target hairless (Hr) (Figure 6B). We observed no differences between EF and NF females in the fasting response of pituitary expression of Klf9, Dio2 or Dio3. However, pituitary thyrotropin-releasing hormone receptor 1 (Trhr1) expression robustly increased in NF females after fasting, but this response was not observed in EF females (Figure 6C). In addition, a post-fasting reduction in pituitary thyroid-stimulating hormone beta chain (Tshb) expression was noted in both female groups, but this response was significantly more pronounced in EF females (Figure 6C). Regarding hypothalamic expression, we observed a differential response to fasting in the expression of Dio2 and Dio3, while the increased expression of T3-target Hr was similar in both groups (Figure 6D).
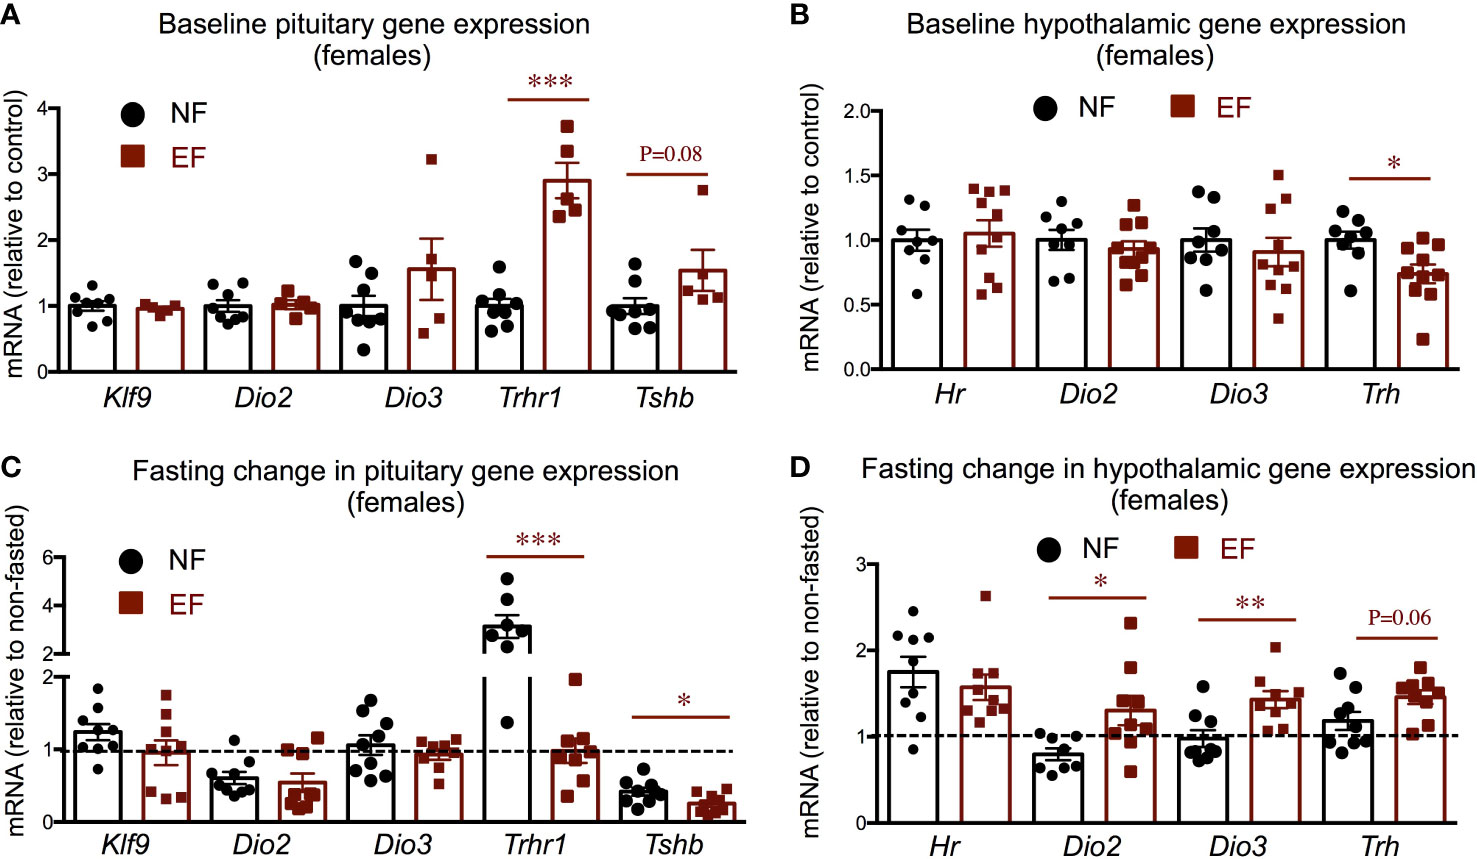
Figure 6 Female baseline and post-fasting pituitary and hypothalamic expression of thyroid axis genes. (A, B) Baseline gene expression in the pituitary (A) and hypothalamus (B). (C, D) Post-fasting change in gene expression in the pituitary (C) and hypothalamus (D). *, **, *** indicate P<0.05, 0.01 and 0.001, respectively as determined by the Student’s t-test (A, B) or by one-way ANOVA and Tukey’s post hoc test (C, D) (n=7-9).
In males, thyroid axis-related pituitary and hypothalamic expression did not show remarkable differences between EF and NE groups (Supplementary Figure 1A–D). At baseline, pituitary expression of Dio3 was reduced in EF males, a trend also observed in Trhr1 expression (Supplementary Figure 1A), while experimental groups showed no differences in the hypothalamic expression of the genes examined (Supplementary Figure 1B). After fasting, male pituitary expression of Dio2, Dio3, Trhr1 and Tshb was decreased to different extents compared to baseline levels, but these reductions were similar between EF and NF males (Supplementary Figure 1C). In the hypothalami of males, fasting elicited minor or no changes in gene expression, and no differential responses were observed between EF and NF males (Supplementary Figure 1D).
3.3 Baseline and fasting response of leptin-melanocortin system and energy balance endpoints
We also investigated hormone and molecular endpoints of the leptin-melanocortin system that may be associated with the adiposity phenotypes. Consistent with their body composition, serum leptin was markedly elevated in EF females, while we observed no differences in serum adiponectin (Figure 7A). After fasting, leptin levels were slightly reduced in both experimental groups of females, but the response was comparable in both experimental groups (Figure 7B). Serum adiponectin did not change in either group after fasting (Figure 7B). Interestingly, we observed that serum ghrelin, an orexigenic hormone, was significantly reduced at baseline in EF females (Figure 7A). After fasting, as expected, serum ghrelin was markedly increased in both experimental groups, but the increase was significantly larger in EF females (Figure 7B).
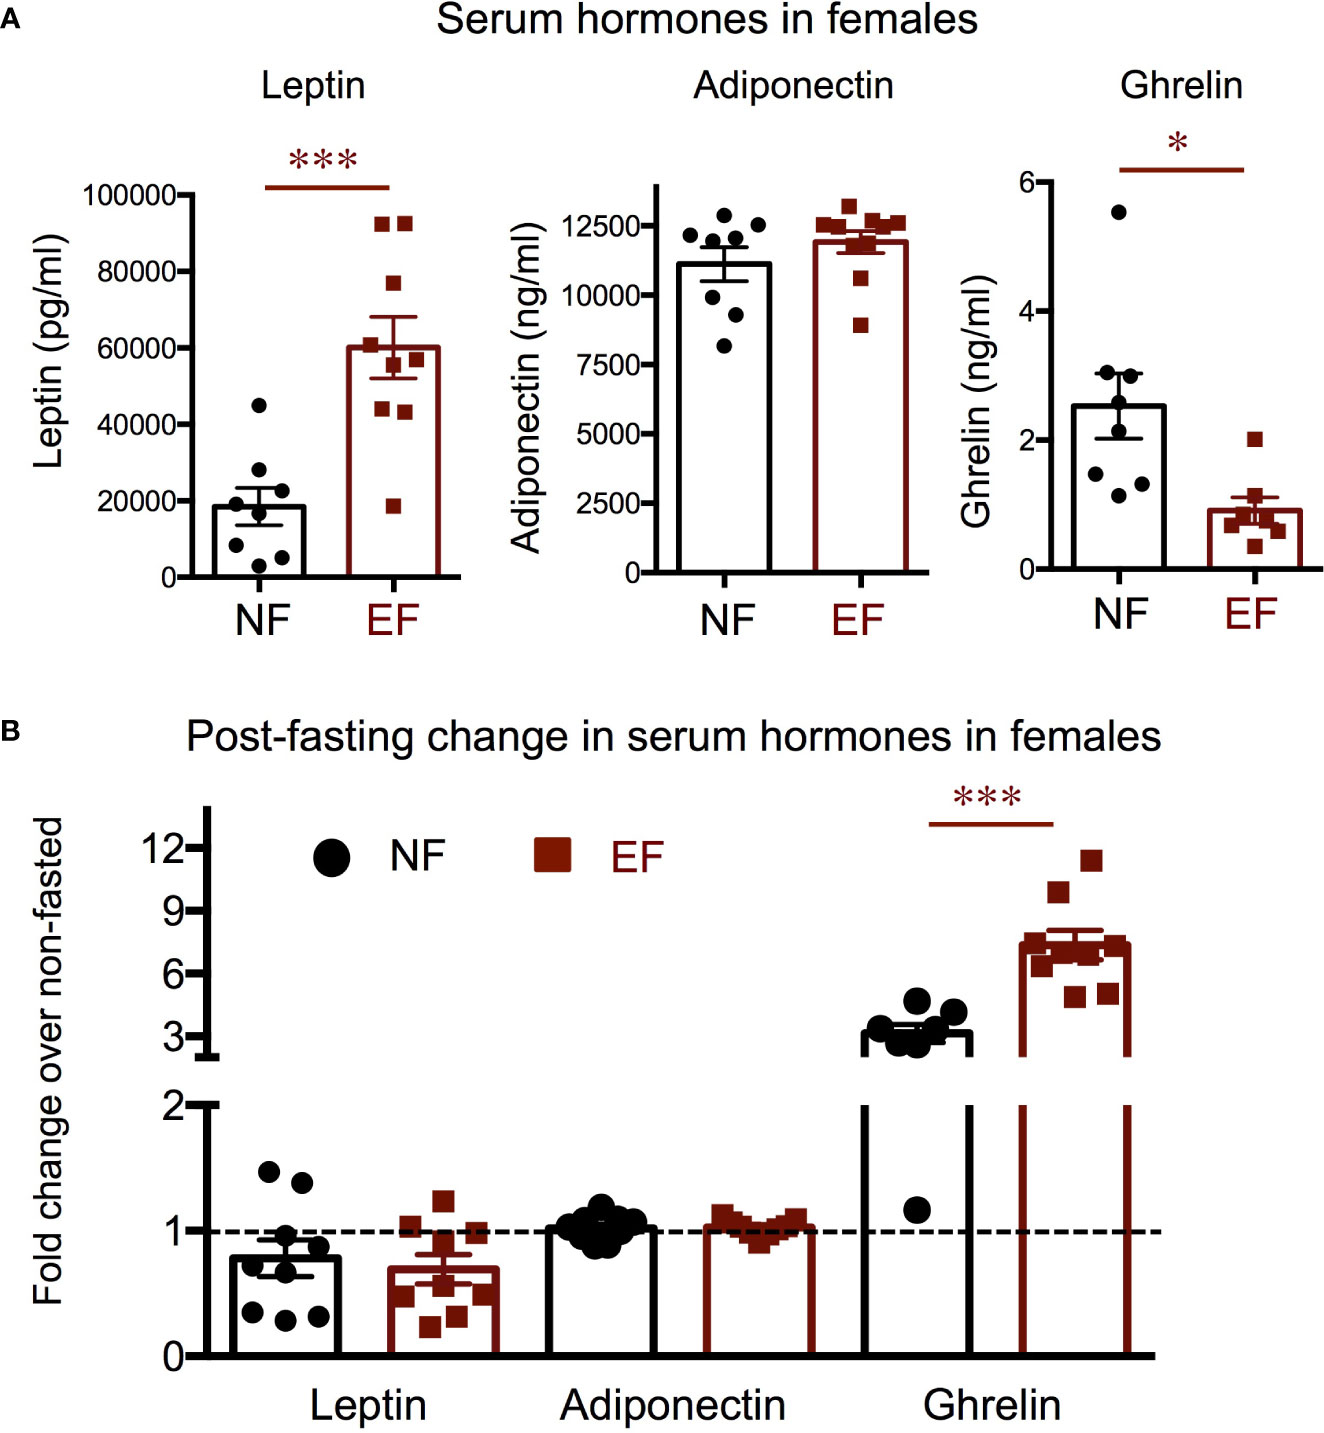
Figure 7 Female baseline and post-fasting serum levels of hormones regulating energy balance. (A) Baseline serum hormone levels. (B) Fold change in hormone levels in response to 16 h fasting. *, *** indicate P<0.05, 0.001, respectively, as determined by the Student’s t-test (A) or by one-way ANOVA and Tukey’s post hoc test (B) (n=7-9).
We observed no differences between EF and NF males in serum levels of leptin, adiponectin or ghrelin (Supplementary Figure 2A). However, the post-fasting decrease in serum leptin was significantly more pronounced in EF males than in NF males (Supplementary Figure 2B). Fasting adiponectin in EF males also trended lower than in NF males, although it did not reach statistical significance (Supplementary Figure 2A). The changes in serum ghrelin after fasting were large in both groups of males and of similar magnitude.
We then determined the hypothalamic expression of genes related to the leptin-meanocortin system and energy balance. We observed that EF females show significant decreases in the hypothalamic expression of leptin-melanocortin system components, including pro-opiomelanocortin (Pomc), agouti-related peptide (Agrp), neuropeptide Y (Npy) and melanocortin receptor 4 (Mc4r) (Figure 8A), while no differences were noted in the expression of other determinants of energy balance like uncoupling protein 2 (Ucp2) and bone morphogenetic protein receptor 1a (Bmpr1a). After overnight fasting, responses relative to their corresponding baselines were significantly more pronounced in EF females, with larger changes in all the markers measured (Figure 8B).
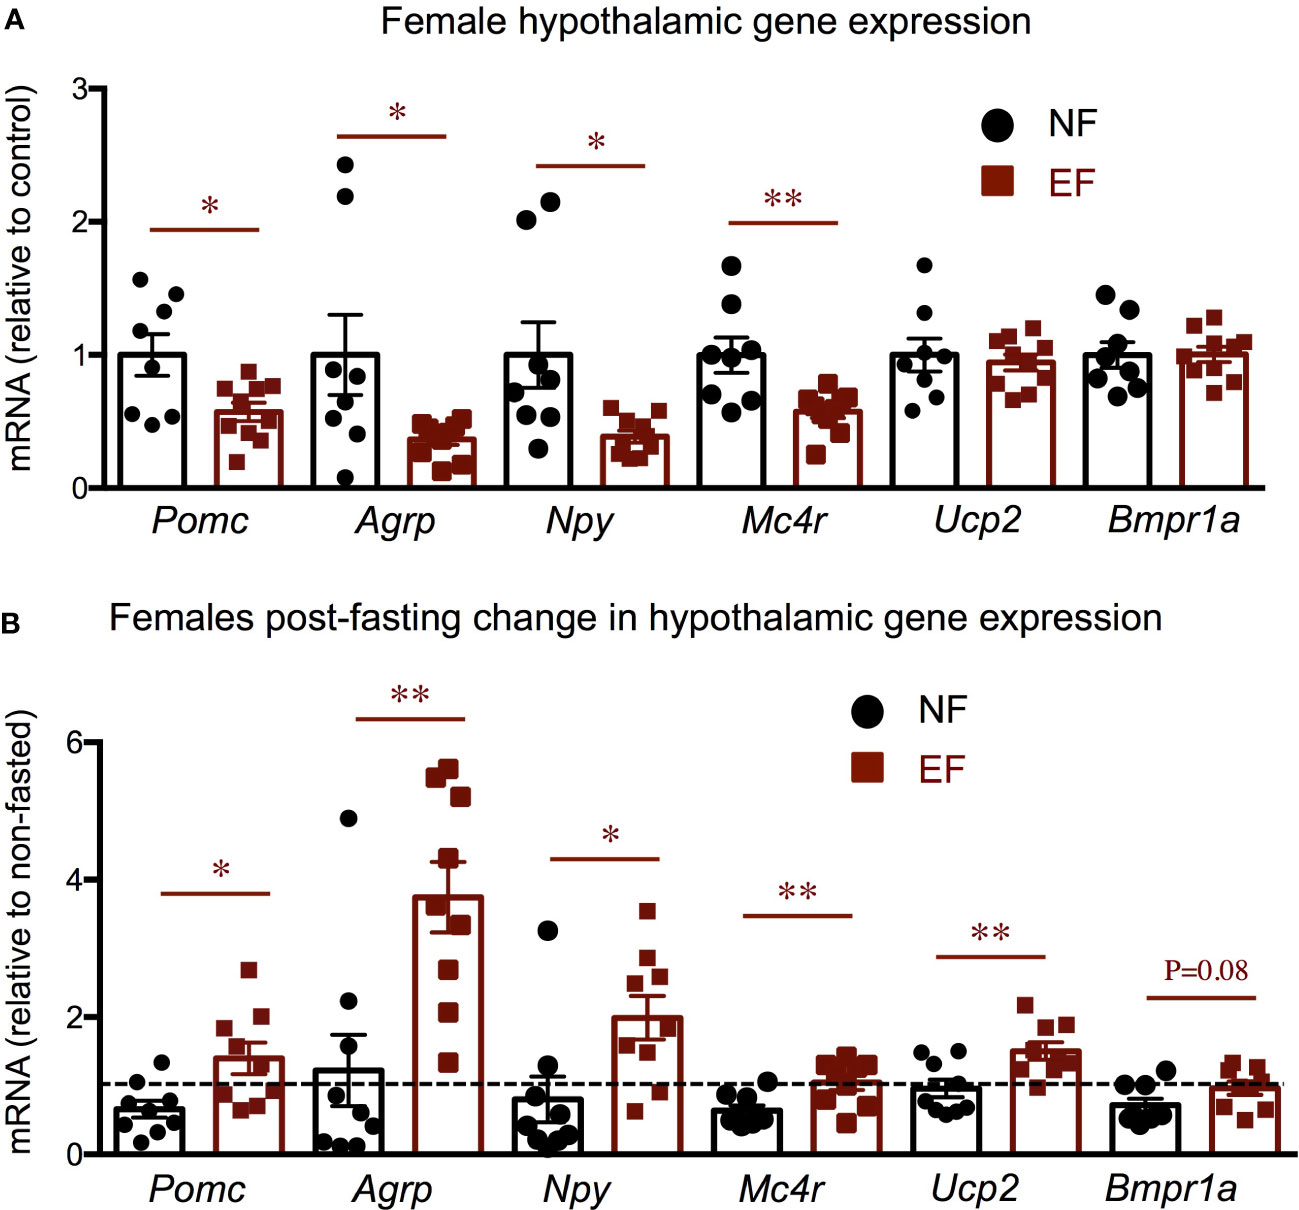
Figure 8 Female baseline and post-fasting hypothalamic expression of energy balance related genes. Baseline (A) and post-fasting change (B) in hypothalamic gene expression. * and ** indicate P<0.05 and 0.01, respectively, as determined by the Student’s t-test (A) or by one-way ANOVA and Tukey’s post hoc test (B) (n=8-10).
These results were sexually dimorphic, as they were not observed in EF males. At baseline, hypothalamic expression of all those markers was not different between EF and NF males (Supplementary Figure 3A). In this regard, fasting responses in EF and NF males were similar for Pomc, Agrp, Npy and Ucp2, while we observed a modest difference for Mc4r and Bmpr1a. For these genes, the post-fasting expression levels were slightly different between experimental groups, with their expression values in EF males being higher than in NF males due to an absence of post-fasting decrease or the presence of a post-fasting increase, respectively (Supplementary Figure 3B).
Given the increased adiposity in EF females, we explored relevant gene expression in white adipose tissue (WAT). Compared to control females, the sub-cutaneous WAT of EF females showed increased expression of adiposity markers mesoderm-specific transcript (Mest) and leptin (Lep) (the latter did not reach statistical significance), but no differences in the expression of adiponectin (Adipoq), adipocyte progenitor marker delta-like non canonical notch ligand 1 (Dlk1) or T3-generating, beiging marker Dio2 (Figure 9A). However, gonadal WAT manifested remarkable changes in gene expression. In this fat depot, adiposity markers Mest and Lep were strongly up-regulated, while Dlk1 expression trended higher (Figure 9B). Importantly, we also observed that Dio2 expression was markedly suppressed in EF gonadal fat, but this decrease was not accompanied by reduced expression of T3 target genes Klf9, Hr and glycerol phosphate dehydrogenase 2 (Gpd2) (Figure 9B).
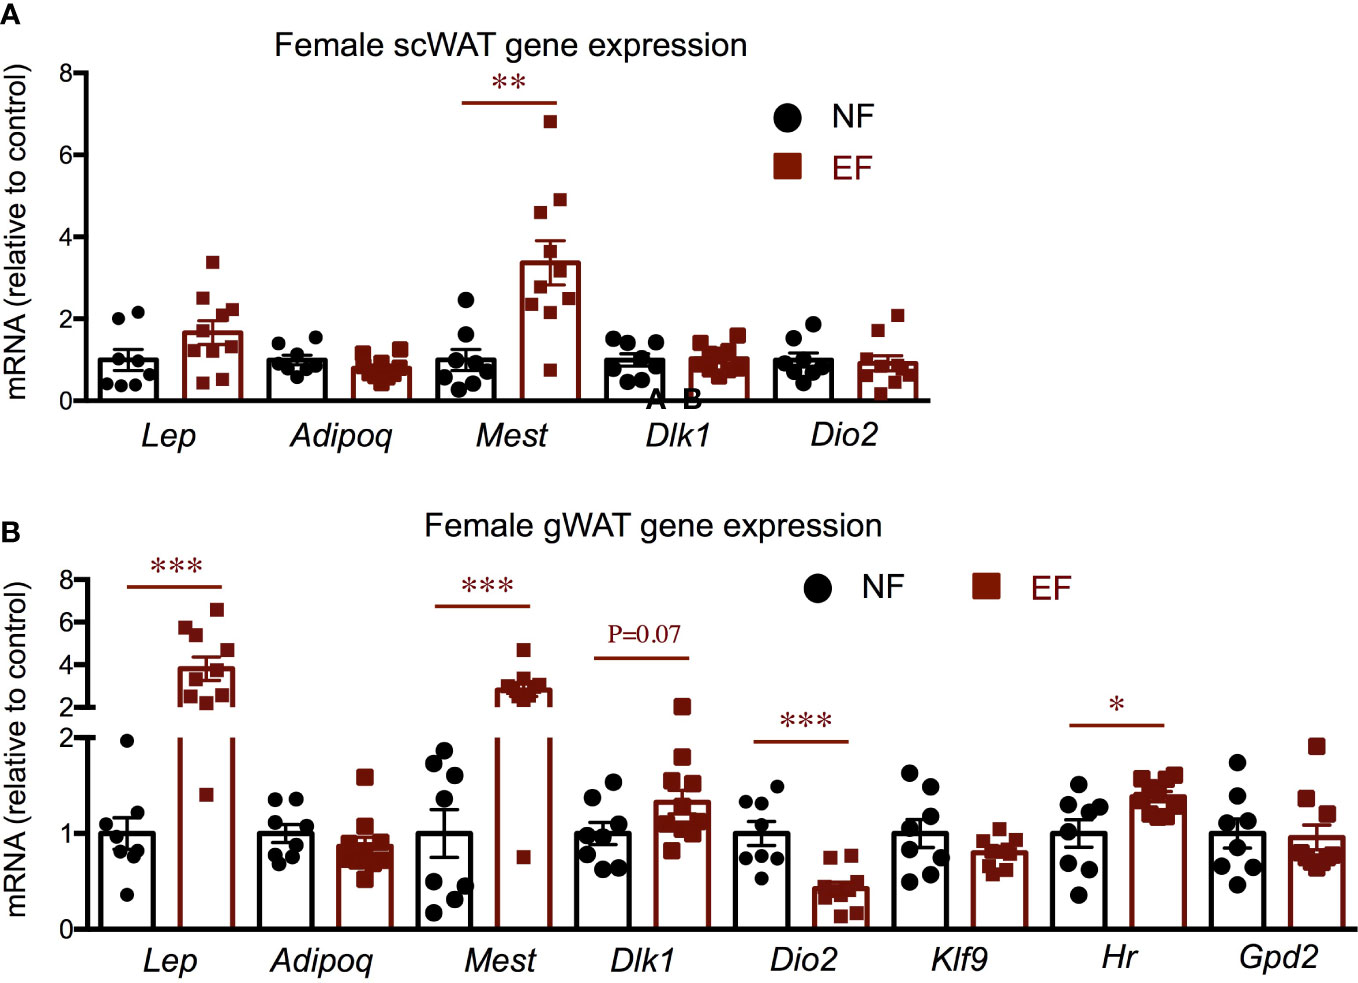
Figure 9 Female gene expression in WAT depots. Gene expression in subcutaneous WAT (A) and in gonadal WAT (B). *, **, *** indicate P<0.05, 0.01 and 0.001, respectively as determined by the Student’s t-test (n=8-10).
3.4 Neonatal leptin and T4
We then examine serum levels of leptin and T4 during late neonatal development. At postnatal day 14 (P14), serum leptin was markedly reduced in EF mice compared to NF mice (Figure 10A). The lower leptin in EF mice was comparable to that in their T3-overexposed fathers (Dio3-/- males) at the same age, while the higher leptin levels in NF mice were similar to those in genetically intact Dio3+/+ mice (Figure 10A). At P20, serum levels were significantly higher in EF mice than in NF mice (Figure 10A), suggesting a pronounced disruption in serum leptin ontogeny in EF animals. At P14, we observed no differences in serum adiponectin between EF and NF mice, and values were similar to those in Dio3+/+ animals (Figure 10B). Similarly, EF, NF and Dio3+/+ mice showed comparable levels of serum T4 at P14, while values at this age for Dio3+/+ mice were markedly suppressed (Figure 10C).
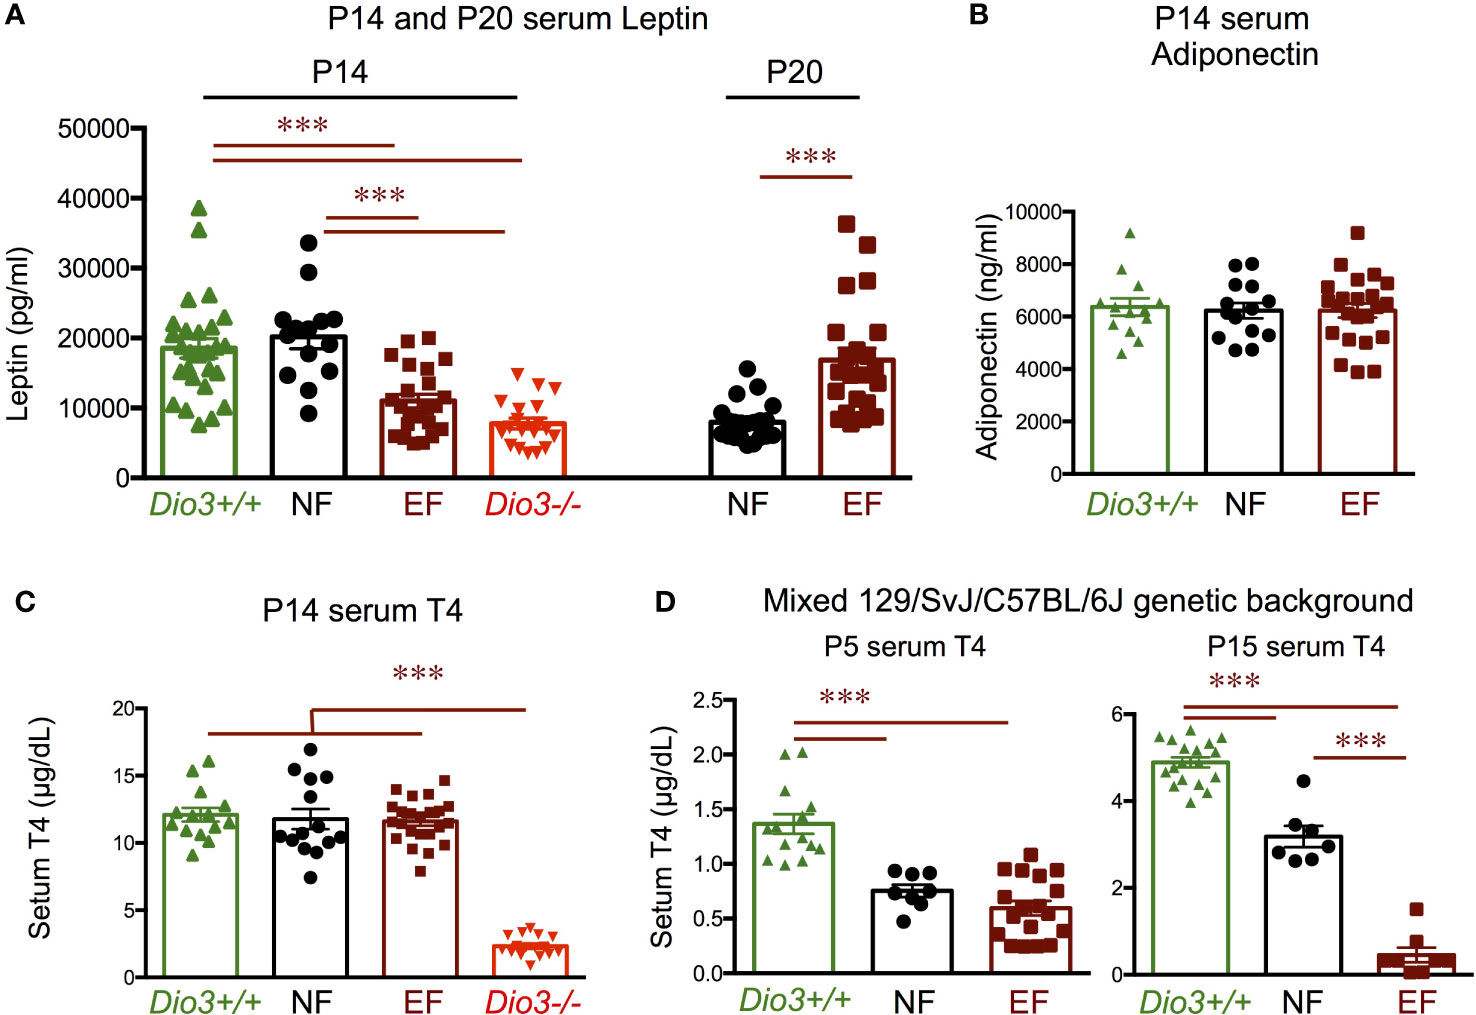
Figure 10 Postnatal hormone profiles. (A) Seum leptin in P14 and P20 mice of both sexes. (B) Serum adiponectin in P14 mice of both sexes. (C) Serum T4 in P14 mice of both sexes. (D) Serum T4 in P5 and P15 mice of both sexes on a mixed 129/SvJ/C57BL/6J genetic background. *** indicate P< 0.001 as determined by the Student’s t-test (P20 data) or by one-way ANOVA and Tukey’s post hoc test (P5, P14 and P15 data) (n=8-27).
Interestingly, using the same experimental design with animals on a 50/50 mixed genetic background (129/SvJ with C57BL/6J, see Methods), we observed that both EF and NF mice have reduced serum T4 compared to Dio3+/+ mice at P4 (Figure 10D). By P15, we still observed lower serum T4 in EF and NF mice compared to Dio3+/+ values, but there was a pronounced divergence in serum T4 between EF and NF mice, with the latter trending higher and closer to Dio3+/+ values, while T4 in EF mice remained strongly suppressed, with values comparable to those in Dio3-/- mice (Figure 10D).
4 Discussion
Mice with global DIO3 deficiency provide a robust, consistent model of fetal and early neonatal thyrotoxicosis (34, 40). Using this model, we have recently shown that developmental T3 excess modifies the epigenetic information of the male germ line (36), with potential consequences for phenotypic alterations in the next generation (36, 45). This possibility was supported by seminal work by Bakke using a model of neonatal injections of pharmacological doses of T4 (neo-T4 model) (37, 46). Given that DIO3-deficient male (and female) mice exhibit marked alterations in adiposity and in the physiology of the thyroid axis and the leptin-melanocortin system, we investigated those phenotypes in the offspring of DIO3-deficient males.
In contrast to their fathers, which show reduced growth and decreased adiposity (47), the offspring of Dio3-/- males exhibited an increase in body weight in females, but not in males. This observation is consistent with old studies using neo-T4 rats as a model of neonatal thyrotoxicosis, and showing that the female –but not male- offspring of neo-T4 males also exhibited elevated body weight (37). Although that previous study did not provide information about fat mass, in our study, the increased body weight in EF females is largely the result of increased adiposity. Not surprisingly, the obesity phenotype in EF females was associated with a higher level of serum leptin, and with increased WAT expression of Lep and Mest, two well-established markers of adipose tissue expansion (48–51). Furthermore, EF female WAT also showed reduced expression of Dio2, an enzyme activated by adrenergic stimuli (52) and that participates in the “beiging” of adipose tissue (53, 54) by locally generating T3 and increasing T3 action (55). Thus the reduction of Dio2 suggests a lower metabolic level in the WAT of these females. The more pronounced abnormal gene expression profile in gonadal WAT compared to subcutaneous WAT is consistent with observations of differential physiology of different WAT depots (56–58).
The obesity phenotype of EF females suggested abnormalities in energy balance that might be a consequence of altered programming of the leptin-melanocortin system, as previously shown for their Dio3-/- fathers (47). Indeed, the decreased baseline expression of hypothalamic leptin-dependent markers Pomc, Agrp, Npy and Mc4r, as well as their enhanced response to a fasting challenge, indicate an abnormal set-point and a larger dynamic range in the leptin-melanocortin system of EF females, which could be the cause of an abnormal energy balance and obesity. Interestingly, EF females show at baseline lower serum level of ghrelin, an orexigenic peptide (59), but the change in ghrelin after wasting was much larger, again suggesting an abnormally expanded range in physiological mechanisms affecting feeding.
EF females also exhibited differences in body composition changes after overnight fasting. Although both groups of females lost body weight, EF females lost more weight than controls, and this was largely explained by a more pronounced reduction in lean mass, while fat mass remained at similar levels. As the leptin-melanocortin system has critical role in the physiological response to fasting (60), the differential sensitivity to fasting in body composition further illustrates the abnormal programming of this system in EF females.
Thyroid hormones are also critical regulators of metabolism and energy balance (61), and the initial observations by Bakke et al. suggested alterations of the hypothalamic-pituitary-thyroid axis in the offspring of Neo-T4 males (37). Although we did not observed differences between experimental female groups in serum levels of thyroid hormones at baseline or after fasting, the expression of thyroid markers in EF females thyroid glands was significant increased, an observation that could be consistent with thyroid gland hypertrophy, and with the thyroid gland enlargement previously reported in the female offspring of Neo-T4 males (37). Although the elevation in pituitary Tshb expression in EF females did not reach statistical significance, it was also observed in the female offspring of neo-T4 males (37), and it could explain the increased expression of thyroid markers as a result of elevated TSH action on the thyroid gland. Still the marked difference in the fasting response of pituitary Tshb expression suggests an abnormal physiological programming. Thus, although unchanged thyroid hormone concentrations do not explain the adiposity phenotype, the serum, thyroid gland and pituitary endpoints in EF females all point to an abnormally regulated HPT axis. Although only paraventricular nucleus TRH is hypophysiotropic, the reduced hypothalamic expression of TRH but modest increase in pituitary expression of Tshb also suggests altered pituitary sensitivity to TRH, a phenotype that has also been observed in relevant rat (37) and human (15) models of paternal thyrotoxicosis.
The abnormal programming of endocrine systems in the offspring of males that experienced T3 excess during development is likely the result of altered epigenetic information in the sperm of these males (36), leading to disrupted development in the offspring. In this regard, aberrant ontogeny of leptin and thyroid hormones may play a role in the adult phenotypes observed. Serum leptin exhibits a marked peak around P10 in mice (62), and a large body of literature indicates that this peak exerts important trophic effects in the maturing hypothalamus. Alterations in the neonatal peak of leptin have demonstrated its importance not only for the programming of the hypothalamic melanocortin system and associated feeding and energy balance circuitries (63–73), but also for the physiology of other hypothalamic-pituitary neuroendocrine systems (74–76). In this context, the markedly reduced serum leptin manifested by P14 EF mice of both sexes could be indicative of an abnormal leptin profile during neonatal life, and possibly of a blunted leptin peak, which could partially explain the hypothalamic-related phenotypes in adult animals. However, our data represent only one time point and P14, chosen for these initial studies due to thyroid hormones peaking at this time, is not the ideal timing for measuring peak leptin. Thus, demonstration that neonatal leptin abnormalities are indeed causing the adult endocrine phenotypes of EF mice will require more comprehensive studies of neonatal leptin profiles and possible experiments of phenotype rescue by timely neonatal administration of leptin. In this regard, changes in neonatal leptin profiles have also been previously associated with the intergenational effects of maternal nutrition status in a sheep model (77). Interestingly, the reduced neonatal leptin in EF mice is comparable to that in their Dio3-/- fathers, suggesting a paternal epigenetic transmission of neonatal leptin phenotypes.
Developmental alterations in serum thyroid hormones could also be contributing to the adult phenotypes of EF mice. For example, neonatal excess in T3 levels, as that observed in Dio3-/- mice and neo-T4 rats, also influences the programming of HPT axis and leptin-melanocortin system (47, 78, 79). Low neonatal levels of thyroid hormone can also determine hypothalamic leptin signaling in adult life (80). However, we observed no alterations in that regard. P14 levels of T4 in EF mice were the same as in the NF control group and in Dio3+/+ mice, even though we observed a marked excess-T3 suppresion of serum T4 in their Dio3-/- fathers, consistent with previous reports (34). It is still possible that alterations in serum thyroid hormones occur in the EF mice studied at earlier ages and are then normalized by P14. This possibility is illustrated by the results we obtained from mice on a different genetic background. On a mixed C57BL/6J/129/SvJ genetic background serum T4 in P4 EF mice is strongly suppressed to a comparable degree to that in Dio3-/- mice. At this age NF mice also exhibit a milder T4 suppresion. T4 remains suppressed by P14 in EF mice and partially normalizes in NF mice, suggesting a pattern of normalization with late neonatal development, and opening the possibility that the adult phenotypes identified in our main experiment are also partly the result of aberrant thyroid hormone levels in early life. These results also suggest the severity of some T3-induced intergenerational epigenetic effects is dependent on the genetic background of the animals, a notion that has been noted in other paradigms of intergenerational effects (81).
Although the phenotypes observed in EF males are milder than those in females, their percentage of body fat, body composition response to fasting, thyroid gland markers and post-fasting leptin, to name a few parameters, are still significantly abnormal, also suggesting an endocrine programming different from controls that could potentially affect other physiological systems, or be more overtly revealed by other types of physiological challenges. Considering the likely developmental origins of the phenotypes observed, as discussed above, the sexual dimorphism in adult outcomes may be the result of leptin and thyroid hormone cross-talk with mechanisms of hypothalamic sexual differentiation during neonatal life.
In summary, our results demonstrate that paternal alterations in thyroid hormone states may cause broad effects in the neuroendocrine physiology of the offspring, affecting their susceptibility to obesity and endocrine disease. These outcomes likely develop from aberrant neonatal leptin or other hormones as a result of the altered epigenetic information that is transmitted via the sperm of fathers overexposed to T3. In humans, this paradigm may have important implications for susceptibility to endocrine disease in children whose fathers were exposed to excessive T3 signaling while in utero due to maternal thyroid disease.
Data availability statement
The original contributions presented in the study are included in the article/Supplementary Material. Further inquiries can be directed to the corresponding author.
Ethics statement
The animal study was reviewed and approved by MaineHealth Institute for Research Instituional Animal Care and Use Committee.
Author contributions
MEM and ZW performed all the experiments, generated and analyzed data, and drafted results and figures. AH designed the study and wrote the manuscript. All authors contributed to the article and approved the submitted version.
Funding
This research was funded by grant DK095908 from the US National Institute for Diabetes, Digestive and Kidney Diseases. This work utilized the Molecular Phenotyping and the Physiology Core Facilities at MaineHealth Institute for Research. These core facilities are partly supported by grants P30GM106391, U54GM115516, and P20GM121301 from the National Institute of General Medical Sciences.
Acknowledgments
We are grateful to Jean Jamo for thoughtful support with animal care and husbandry.
Conflict of interest
The authors declare that the research was conducted in the absence of any commercial or financial relationships that could be construed as a potential conflict of interest.
Publisher’s note
All claims expressed in this article are solely those of the authors and do not necessarily represent those of their affiliated organizations, or those of the publisher, the editors and the reviewers. Any product that may be evaluated in this article, or claim that may be made by its manufacturer, is not guaranteed or endorsed by the publisher.
Supplementary material
The Supplementary Material for this article can be found online at: https://www.frontiersin.org/articles/10.3389/fendo.2023.1210414/full#supplementary-material
References
1. Trerotola M, Relli V, Simeone P, Alberti S. Epigenetic inheritance and the missing heritability. Hum Genomics (2015) 9:17. doi: 10.1186/s40246-015-0041-3
2. Shen X. The curse of the missing heritability. Front Genet (2013) 4:225. doi: 10.3389/fgene.2013.00225
3. Manolio TA. Finding the missing heritability of complex diseases. Nature (2009) 461:747–53. doi: 10.1038/nature08494
4. Hemminki K, Forsti A, Houlston R, Bermejo JL. Searching for the missing heritability of complex diseases. Hum Mutat (2011) 32:259–62. doi: 10.1002/humu.21392
5. Lee SH, Wray NR, Goddard ME, Visscher PM. Estimating missing heritability for disease from genome-wide association studies. Am J Hum Genet (2011) 88(3):294–305. doi: 10.1016/j.ajhg.2011.02.002
6. Koch L. Epigenetics: an epigenetic twist on the missing heritability of complex traits. Nat Rev Genet (2014) 15:218. doi: 10.1038/nrg3698
7. Koch L. Disease genetics: insights into missing heritability. Nat Rev Genet (2014) 15:218. doi: 10.1101/2023.06.07.23291095
8. Lempradl A. Germ cell-mediated mechanisms of epigenetic inheritance. Semin Cell Dev Biol (2020) 97:116–22. doi: 10.1016/j.semcdb.2019.07.012
9. Jimenez-Chillaron JC, Isganaitis E, Charalambous M, Gesta S, Pentinat-Pelegrin T, Faucette RR, et al. Intergenerational transmission of glucose intolerance and obesity by in utero undernutrition in mice. Diabetes (2009) 58:460–8. doi: 10.2337/db08-0490
10. Rachdaoui N, Sarkar DK. Transgenerational epigenetics and brain disorders. Int Rev Neurobiol (2014) 115:51–73. doi: 10.1016/B978-0-12-801311-3.00002-0
11. Jung YH, Bixler BJ, Ruiz D, Wang HL, Lisenbaum H, Xiang J-F, et al. Transgenerational inheritance of BPA-induced obesity correlates with transmission of new CTCF sites in the Fto gene. bioRxiv (2020) 2020:2020.11.20.391672. doi: 10.1101/2020.11.20.391672
12. Palu RAS, Praggastis SA, Thummel CS. Parental obesity leads to metabolic changes in the F2 generation in Drosophila. Mol Metab (2017) 6:631–9. doi: 10.1016/j.molmet.2017.03.012
13. Skinner MK. Endocrine disruptors in 2015: Epigenetic transgenerational inheritance. Nat Rev Endocrinol (2016) 12:68–70. doi: 10.1038/nrendo.2015.206
14. Wang HV, Forestier S, Corces VG. Exposure to sevoflurane results in changes of transcription factor occupancy in sperm and inheritance of autism†. Biol Reprod (2021) 105:705–19. doi: 10.1093/biolre/ioab097
15. Anselmo J, Scherberg NH, Dumitrescu AM, Refetoff S. Reduced sensitivity to thyroid hormone as a transgenerational epigenetic marker transmitted along the human male line. Thyroid Off J Am Thyroid Assoc (2019) 29:778–82. doi: 10.1089/thy.2019.0080
16. Weaver IC. Integrating early life experience, gene expression, brain development, and emergent phenotypes: unraveling the thread of nature via nurture. Adv Genet (2014) 86:277–307. doi: 10.1016/B978-0-12-800222-3.00011-5
17. Jawaid A, Roszkowski M, Mansuy IM. Transgenerational epigenetics of traumatic stress. Prog Mol Biol Transl Sci (2018) 158:273–98. doi: 10.1016/bs.pmbts.2018.03.003
18. Yeshurun S, Hannan AJ. Transgenerational epigenetic influences of paternal environmental exposures on brain function and predisposition to psychiatric disorders. Mol Psychiatry (2019) 24:536–48. doi: 10.1038/s41380-018-0039-z
19. Bale TL. Epigenetic and transgenerational reprogramming of brain development. Nat Rev Neurosci (2015) 16:332–44. doi: 10.1038/nrn3818
20. Weaver IC, Cervoni N, Champagne FA, D'Alessio AC, Sharma S, Seckl JR, et al. Epigenetic programming by maternal behavior. Nat Neurosci (2004) 7:847–54. doi: 10.1038/nn1276
21. Hernandez A, Martinez ME, Chaves C, Anselmo J. Epigenetic developmental programming and intergenerational effects of thyroid hormones. Vitamins hormones (2023) 122:23–49. doi: 10.1016/bs.vh.2023.01.003
22. McLachlan SM, Nagayama Y, Rapoport B. Insight into Graves' hyperthyroidism from animal models. Endocrine Rev (2005) 26:800–32. doi: 10.1210/er.2004-0023
23. Ramhøj L, Hass U, Gilbert ME, Wood C, Svingen T, Usai D, et al. Evaluating thyroid hormone disruption: investigations of long-term neurodevelopmental effects in rats after perinatal exposure to perfluorohexane sulfonate (PFHxS). Sci Rep (2020) 10:2672. doi: 10.1038/s41598-020-59354-z
24. de Souza JS, Kizys MM, da Conceição RR, Glebocki G, Romano RM, Ortiga-Carvalho TM, et al. Perinatal exposure to glyphosate-based herbicide alters the thyrotrophic axis and causes thyroid hormone homeostasis imbalance in male rats. Toxicology (2017) 377:25–37. doi: 10.1016/j.tox.2016.11.005
25. Anselmo J, Chaves CM. Physiologic significance of epigenetic regulation of thyroid hormone target gene expression. Eur Thyroid J (2020) 9:114–23. doi: 10.1159/000506423
26. Hernandez A. Structure and function of the type 3 deiodinase gene. Thyroid (2005) 15:865–74. doi: 10.1089/thy.2005.15.865
27. Cheng SY, Leonard JL, Davis PJ. Molecular aspects of thyroid hormone actions. Endocrine Rev (2010) 31:139–70. doi: 10.1210/er.2009-0007
28. Brent GA. Mechanisms of thyroid hormone action. J Clin Invest (2012) 122:3035–43. doi: 10.1172/JCI60047
29. Huang SA, Dorfman DM, Genest DR, Salvatore D, Larsen PR. Type 3 iodothyronine deiodinase is highly expressed in the human uteroplacental unit and in fetal epithelium. J Clin Endocrinol Metab (2003) 88:1384–8. doi: 10.1210/jc.2002-021291
30. Galton VA, Martinez E, Hernandez A, St Germain EA, Bates JM, St Germain DL. Pregnant rat uterus expresses high levels of the type 3 iodothyronine deiodinase. J Clin Invest (1999) 103:979–87. doi: 10.1172/JCI6073
31. Kaplan MM, Yaskoski KA. Maturational patterns of iodothyronine phenolic and tyrosyl ring deiodinase activities in rat cerebrum, cerebellum, and hypothalamus. J Clin Invest (1981) 67:1208–14. doi: 10.1172/JCI110136
32. Martinez ME, Karaczyn A, Stohn JP, Donnelly WT, Croteau W, Peeters RP, et al. The type 3 deiodinase is a critical determinant of appropriate thyroid hormone action in the developing testis. Endocrinology (2016) 157:1276–88. doi: 10.1210/en.2015-1910
33. Hernandez A, Martinez ME, Ng L, Forrest D. Thyroid hormone deiodinases: dynamic switches in developmental transitions. Endocrinology (2021) 162(8):1–15. doi: 10.1210/endocr/bqab091
34. Hernandez A, Martinez ME, Fiering S, Galton VA, St Germain D. Type 3 deiodinase is critical for the maturation and function of the thyroid axis. J Clin Invest (2006) 116:476–84. doi: 10.1172/JCI26240
35. Martinez ME, Hernandez A. The type 3 deiodinase is a critical modulator of thyroid hormone sensitivity in the fetal brain. Front Neurosci (2021) 15:703–30. doi: 10.3389/fnins.2021.703730
36. Martinez ME, Duarte CW, Stohn JP, Karaczyn A, Wu Z, DeMambro VE, et al. Thyroid hormone influences brain gene expression programs and behaviors in later generations by altering germ line epigenetic information. Mol Psychiatry (2020) 25:939–50. doi: 10.1038/s41380-018-0281-4
37. Bakke JL, Lawrence NL, Robinson S, Bennett J. Endocrine studies in the untreated F1 and F2 progeny of rats treated neonatally with thyroxine Biol. Neonate (1977) 31:71–83. doi: 10.1159/000240946
38. Bakke JL, Lawrence NL, Robinson S, Bennett J. Observations on the untreated progeny of hypothyroid male rats. Metabolism: Clin Exp (1976) 25:437–44. doi: 10.1016/0026-0495(76)90076-7
39. Hernandez A, Fiering S, Martinez E, Galton VA, St Germain D. The gene locus encoding iodothyronine deiodinase type 3 (Dio3) is imprinted in the fetus and expresses antisense transcripts. Endocrinology (2002) 143:4483–6. doi: 10.1210/en.2002-220800
40. Martinez ME, Charalambous M, Saferali A, Fiering S, Naumova AK, St Germain D, et al. Genomic imprinting variations in the mouse type 3 deiodinase gene between tissues and brain regions. Mol Endocrinol (Baltimore Md.) (2014) 28:1875–86. doi: 10.1210/me.2014-1210
41. Tsai CE, Lin SP, Ito M, Takagi N, Takada S, Ferguson-Smith AC. Genomic imprinting contributes to thyroid hormone metabolism in the mouse embryo. Curr Biol (2002) 12:1221–6. doi: 10.1016/S0960-9822(02)00951-X
42. Gil-Ibanez P, Belinchon MM, Morte B, Obregon MJ, Bernal J. Is the intrinsic genomic activity of thyroxine relevant in vivo? Effects on gene expression in primary cerebrocortical and neuroblastoma cells. Thyroid Off J Am Thyroid Assoc (2017) 27:1092–8. doi: 10.1089/thy.2017.0024
43. Bárez-López S, Obregon MJ, Martínez-de-Mena R, Bernal J, Guadaño-Ferraz A, Morte B. Effect of triiodothyroacetic acid treatment in mct8 deficiency: A word of caution. Thyroid (2016) 26:618–26. doi: 10.1089/thy.2015.0388
44. Escobar-Morreale HF, Obregon MJ, Hernandez A, Escobar del Rey F, Morreale de Escobar G. Regulation of iodothyronine deiodinase activity as studied in thyroidectomized rats infused with thyroxine or triiodothyronine. Endocrinology (1997) 138:2559–68. doi: 10.1210/endo.138.6.5212
45. Martinez ME, Stohn JP, Mutina EM, Whitten RJ, Hernandez A. Thyroid hormone elicits intergenerational epigenetic effects on adult social behavior and fetal brain expression of autism susceptibility genes. Front Neurosci (2022) 16:1055116. doi: 10.3389/fnins.2022.1055116
46. Bakke JL, Lawrence N, Wilber JF. The late effects of neonatal hyperthyroidism upon the hypothalamic-pituitary-thyroid axis in the rat. Endocrinology (1974) 95:406–11. doi: 10.1210/endo-95-2-406
47. Wu Z, Martinez ME, St Germain DL, Hernandez A. Type 3 deiodinase role on central thyroid hormone action affects the leptin-melanocortin system and circadian activity. Endocrinology (2017) 158:419–30. doi: 10.1210/en.2016-1680
48. Friedman J. 20 years of leptin: leptin at 20: an overview. J Endocrinol (2014) 223:T1–8. doi: 10.1530/JOE-14-0405
49. Friedman JM. The function of leptin in nutrition, weight, and physiology. Nutr Rev (2002) 60:S1–14. doi: 10.1301/002966402320634878
50. Anunciado-Koza RP, Manuel J, Mynatt RL, Zhang J, Kozak LP, Koza RA. Diet-induced adipose tissue expansion is mitigated in mice with a targeted inactivation of mesoderm specific transcript (Mest). PloS One (2017) 12:e0179879. doi: 10.1371/journal.pone.0179879
51. Anunciado-Koza RP, Higgins DC, Koza RA. Adipose tissue Mest and Sfrp5 are concomitant with variations of adiposity among inbred mouse strains fed a non-obesogenic diet. Biochimie (2016) 124:134–40. doi: 10.1016/j.biochi.2015.05.007
52. Fonseca TL, Werneck-de-Castro JPS, Bianco AC. Role of the type 2 iodothyronine deiodinase (D2) in the control of thyroid hormone signaling. Biochim Biophys Acta (2013) 1830:3956–64. doi: 10.1016/j.bbagen.2012.08.019
53. Park SJ, Shon DH, Kim JH, Ryu YH, Ko Y. SAMM50 regulates thermogenesis of beige adipocytes differentiated from human adipose-derived stem cells by balancing mitochondrial dynamics. Int J Mol Sci (2022) 23(12):6764. doi: 10.3390/ijms23126764
54. Ju L, Chen S, Alimujiang M, Bai N, Yan H, Fang Q, et al. A novel role for Bcl2l13 in promoting beige adipocyte biogenesis. Biochem Biophys Res Commun (2018) 506:485–91. doi: 10.1016/j.bbrc.2018.10.034
55. Lin JZ, Martagón AJ, Cimini SL, Gonzalez DD, Tinkey DW, Biter A, et al. Pharmacological activation of thyroid hormone receptors elicits a functional conversion of white to brown fat. Cell Rep (2015) 13:1528–37. doi: 10.1016/j.celrep.2015.10.022
56. Narita T, Kobayashi M, Itakura K, Itagawa R, Kabaya R, Sudo Y, et al. Differential response to caloric restriction of retroperitoneal, epididymal, and subcutaneous adipose tissue depots in rats. Exp gerontology (2018) 104:127–37. doi: 10.1016/j.exger.2018.01.016
57. Wronska A, Kmiec Z. Structural and biochemical characteristics of various white adipose tissue depots. Acta physiologica (Oxford England) (2012) 205:194–208. doi: 10.1111/j.1748-1716.2012.02409.x
58. Sackmann-Sala L, Berryman DE, Munn RD, Lubbers ER, Kopchick JJ. Heterogeneity among white adipose tissue depots in male C57BL/6J mice. Obes (Silver Spring Md.) (2012) 20:101–11. doi: 10.1038/oby.2011.235
59. Andrews ZB. Central mechanisms involved in the orexigenic actions of ghrelin. Peptides (2011) 32:2248–55. doi: 10.1016/j.peptides.2011.05.014
60. Caron A, Dungan Lemko HM, Castorena CM, Fujikawa T, Lee S, Lord CC, et al. POMC neurons expressing leptin receptors coordinate metabolic responses to fasting via suppression of leptin levels. eLife (2018) 7:1–18. doi: 10.7554/eLife.33710
61. Bianco AC. Minireview: cracking the metabolic code for thyroid hormone signaling. Endocrinology (2011) 152:3306–11. doi: 10.1210/en.2011-1104
62. Bouret SG, Simerly RB. Development of leptin-sensitive circuits. J Neuroendocrinol (2007) 19:575–82. doi: 10.1111/j.1365-2826.2007.01563.x
63. Bouret SG, Simerly RB. Minireview: Leptin and development of hypothalamic feeding circuits. Endocrinology (2004) 145:2621–6. doi: 10.1210/en.2004-0231
64. Djiane J, Attig L. Role of leptin during perinatal metabolic programming and obesity. J Physiol Pharmacol (2008) 59 Suppl 1:55–63.
65. Toste FP, de Moura EG, Lisboa PC, Fagundes AT, de Oliveira E, Passos MC. Neonatal leptin treatment programmes leptin hypothalamic resistance and intermediary metabolic parameters in adult rats. Br J Nutr (2006) 95:830–7. doi: 10.1079/BJN20061726
66. Vickers MH, Gluckman PD, Coveny AH, Hofman PL, Cutfield WS, Gertler A, et al. Neonatal leptin treatment reverses developmental programming. Endocrinology (2005) 146:4211–6. doi: 10.1210/en.2005-0581
67. Mela V, Jimenez S, Freire-Regatillo A, Barrios V, Marco EM, Lopez-Rodriguez AB, et al. Blockage of neonatal leptin signaling induces changes in the hypothalamus associated with delayed pubertal onset and modifications in neuropeptide expression during adulthood in male rats. Peptides (2016) 86:63–71. doi: 10.1016/j.peptides.2016.10.003
68. Zeltser LM. Developmental influences on circuits programming susceptibility to obesity. Front Neuroendocrinol (2015) 39:17–27. doi: 10.1016/j.yfrne.2015.07.002
69. Bouyer K, Simerly RB. Neonatal leptin exposure specifies innervation of presympathetic hypothalamic neurons and improves the metabolic status of leptin-deficient mice. J Neurosci Off J Soc Neurosci (2013) 33:840–51. doi: 10.1523/JNEUROSCI.3215-12.2013
70. Beltrand J, Sloboda DM, Connor KL, Truong M, Vickers MH. The Effect of Neonatal Leptin Antagonism in Male Rat Offspring Is Dependent upon the Interaction between Prior Maternal Nutritional Status and Post-Weaning Diet. J Nutr Metab (2012) 2012:296935. doi: 10.1155/2012/296935
71. Granado M, Garcia-Caceres C, Fuente-Martin E, Diaz F, Mela V, Viveros MP, et al. Effects of acute changes in neonatal leptin levels on food intake and long-term metabolic profiles in rats. Endocrinology (2011) 152:4116–26. doi: 10.1210/en.2011-1233
72. Gluckman PD, Lillycrop KA, Vickers MH, Pleasants AB, Phillips ES, Beedle AS, et al. Metabolic plasticity during mammalian development is directionally dependent on early nutritional status. Proc Natl Acad Sci United States America (2007) 104:12796–800. doi: 10.1073/pnas.0705667104
73. Dutra SC, Moura EG, Rodrigues AL, Lisboa PC, Bonomo I, Toste FP, et al. Cold exposure restores the decrease in leptin receptors (OB-Rb) caused by neonatal leptin treatment in 30-day-old rats. J Endocrinol (2007) 195:351–8. doi: 10.1677/JOE-07-0366
74. Childs GV, Odle AK, MacNicol MC, MacNicol AM. The importance of leptin to reproduction. Endocrinology (2021) 162(2):1–18. doi: 10.1210/endocr/bqaa204
75. Odle AK, Allensworth-James ML, Akhter N, Syed M, Haney AC, MacNicol M, et al. Tropic role for leptin in the somatotrope as a regulator of POU1F1 and POU1F1-dependent hormones. Endocrinology (2016) 157:3958–71. doi: 10.1210/en.2016-1472
76. Proulx K, Clavel S, Nault G, Richard D, Walker CD. High neonatal leptin exposure enhances brain GR expression and feedback efficacy on the adrenocortical axis of developing rats. Endocrinology (2001) 142:4607–16. doi: 10.1210/endo.142.11.8512
77. Shasa DR, Odhiambo JF, Long NM, Tuersunjiang N, Nathanielsz PW, Ford SP. Multigenerational impact of maternal overnutrition/obesity in the sheep on the neonatal leptin surge in granddaughters (2005). Int J Obes (2015) 39:695–701. doi: 10.1038/ijo.2014.190
78. Bakke JL, Lawrence N, Wilber JF. The late effects of neonatal hyperthyoridism upon the hypothalamic-pituitary-thyroid axis in the rat. Endocrinology (1974) 95:406–11. doi: 10.1210/endo-95-2-406
79. Hernandez A, Martinez ME, Liao XH, Van Sande J, Refetoff S, Galton VA, et al. Type 3 deiodinase deficiency results in functional abnormalities at multiple levels of the thyroid axis. Endocrinology (2007) 148:5680–7. doi: 10.1210/en.2007-0652
80. Tapia-Martínez J, Cano-Europa E, Blas-Valdivia V, Franco-Colín M. Thyroxine treatment during the perinatal stage prevents the alterations in the obRb-STAT3 leptin signaling pathway caused by congenital hypothyroidism. Hormone Metab Res = Hormon- und Stoffwechselforschung = Hormones metabolisme (2020) 52:815–21. doi: 10.1055/a-1160-9833
Keywords: thyroid hormone, intergenerational epigenetics, adiposity, hypothalamic-pituitary-thyroid axis, fasting, leptin, energy balance, sexual dimorphism
Citation: Martinez ME, Wu Z and Hernandez A (2023) Paternal developmental thyrotoxicosis disrupts neonatal leptin leading to increased adiposity and altered physiology of the melanocortin system. Front. Endocrinol. 14:1210414. doi: 10.3389/fendo.2023.1210414
Received: 22 April 2023; Accepted: 10 July 2023;
Published: 25 July 2023.
Edited by:
Jin Young Huh, Sogang University, Republic of KoreaReviewed by:
Gwen V. Childs, University of Arkansas for Medical Sciences, United StatesFernanda Thomazini, Federal University of São Paulo, Brazil
Copyright © 2023 Martinez, Wu and Hernandez. This is an open-access article distributed under the terms of the Creative Commons Attribution License (CC BY). The use, distribution or reproduction in other forums is permitted, provided the original author(s) and the copyright owner(s) are credited and that the original publication in this journal is cited, in accordance with accepted academic practice. No use, distribution or reproduction is permitted which does not comply with these terms.
*Correspondence: Arturo Hernandez, Arturo.Hernandez@mainehealth.org
†These authors share first authorship