 Qiuwei Tian
 Caixia He1
 Marady Hun
 Yi-Cheng Fu
 Mingyi Zhao
 Qingnan He
- 1Department of Pediatrics, The Third Xiangya Hospital, Central South University, Changsha, China
- 2Department of Pediatrics, Renmin Hospital of Wuhan University, Wuhan University, Wuhan, China
Background: Globally, chronic kidney disease (CKD) is a growing public health concern. Serum uric acid (SUA) is an easily detectable and readily available biochemical indicator that has long been recognized as an independent risk factor for CKD. In addition, studies have indicated a potential relationship between SUA and body mass index (BMI). However, studies on the effect of SUA levels on the estimated glomerular filtration rate (eGFR) in adolescents with different BMIs are very rare.
Methods: Weighted multiple regression analysis was used to estimate the independent relationship between SUA and log-transformed eGFR. Additionally, we used a weighted generalized additive model and smooth curve fitting to describe the nonlinear relationships in the subgroup analysis.
Results: First, SUA was negatively associated with log-transformed eGFR even after adjusting for all covariates (β=-0.0177, 95% CI: -0.0203-0.0151, P<0.0001). Second, the results of the stratified analysis found that after adjusting for all covariates, the decrease in log-transformed eGFR due to changes in per SUA levels (Per 1, mg/dL increase) was elevated in female adolescents (β=-0.0177, 95% CI: -0.0216, -0.0138, P<0.0001), adolescents aged 12-15 years (β=-0.0163, 95% CI: -0.0200, -0.0125, P<0.0001) and black (β=-0.0199, 95% CI: -0.0251, -0.0148, P<0.0001) adolescents. Furthermore, we found that adolescents with a higher BMI had higher SUA levels, and the effect of SUA on eGFR was significantly higher in underweight adolescents (β=-0.0386, 95% CI: (-0.0550, -0.0223), P<0.0001).
Conclusion: SUA was negatively associated with the eGFR in adolescents aged 12-19 years. Furthermore, we found for the first time that SUA affects the eGFR differently in adolescents with different BMIs. This effect was particularly significant in underweight adolescents.
Introduction
Chronic kidney disease (CKD) is a growing global public health problem. Over the nearly 30 years from 1990 to 2017, the global prevalence of CKD at all ages increased by 29.3%, while the age-standardized prevalence remained stable (1). Previous studies on adults have found that both poor lifestyle habits, such as smoking, alcohol consumption and sedentary lifestyle, as well as a polluted atmosphere, such as elevated fine particulate matter (PM2.5) in the air, and even low birth weight in infants can be risk factors for the development and progression of CKD (2–4). Although epidemiological studies on CKD in adolescents are very limited, it is indisputable that CKD in children and adolescents has become one of the most significant diseases affecting their lives. Therefore, it is critical to find a biomarker that facilitates early prediction and timely intervention by clinicians for the prevention of CKD in adolescents.
It is well known that uric acid is the final product of purine metabolism. As a clinically easily detectable and available biochemical indicator, SUA is closely associated with diseases such as hypertension (5–7), diabetes (7–10), and metabolic syndrome (11, 12) and has been recognized as an independent risk factor for the development of CKD (13, 14). Meanwhile, SUA levels are also correlated with body mass index (BMI). For example, some scholars have found a nonlinear relationship between BMI and SUA in adults (15). In addition, studies in obese patients have also found that elevated SUA levels are always accompanied by obesity in both adults and adolescents (16, 17). This may be related to oxidative stress and the inflammatory response induced by xanthine oxidoreductase-derived reactive oxygen species and uric acid (18, 19). Therefore, based on the findings of previous studies, we hypothesized that controlling BMI might enable the modification of SUA levels in adolescents.
Previous findings have indicated that serum uric acid can cause renal injury through both crystal-dependent and crystal-independent mechanisms (20, 21). Therefore, in this study, we used the estimated glomerular filtration rate (eGFR) as a measure of basal renal function in adolescents based on a cross-sectional survey from the National Health and Nutrition Examination Survey (NHANES) database with the aim of exploring two main questions. First, we investigated the relationship between SUA and eGFR in adolescents in a cross-sectional survey with a large sample size. Second, we investigated the effect of SUA levels on renal function in adolescents with different BMIs, with the aim of exploring whether the renal injury effect of SUA can be reduced by controlling the BMI of adolescents, thus preventing the occurrence of CKD in adolescents.
Materials and methods
Study population
The National Health and Nutrition Examination Survey (NHANES) is a large cross-sectional survey based on the U.S. population with a two-year survey cycle. This survey collected a large amount of survey information from the general U.S. population through a complex, multistage, probability sampling design. All adult participants provided written informed consent, and participants under 18 years of age were required to submit the consent of their parents or guardians. For data researchers and users, the survey data from NHANES are publicly available at www.cdc.gov/nchs/nhanes/. NHANES has been reviewed by the National Center for Health Statistics Research Ethics Review Board.
Our study collected relevant data, including demographics, physical examinations, laboratory tests, and questionnaires, during the three survey cycles of NHANES 2011-2016 and analyzed them. The inclusion and exclusion details of the study population in this study are shown in Figure 1.
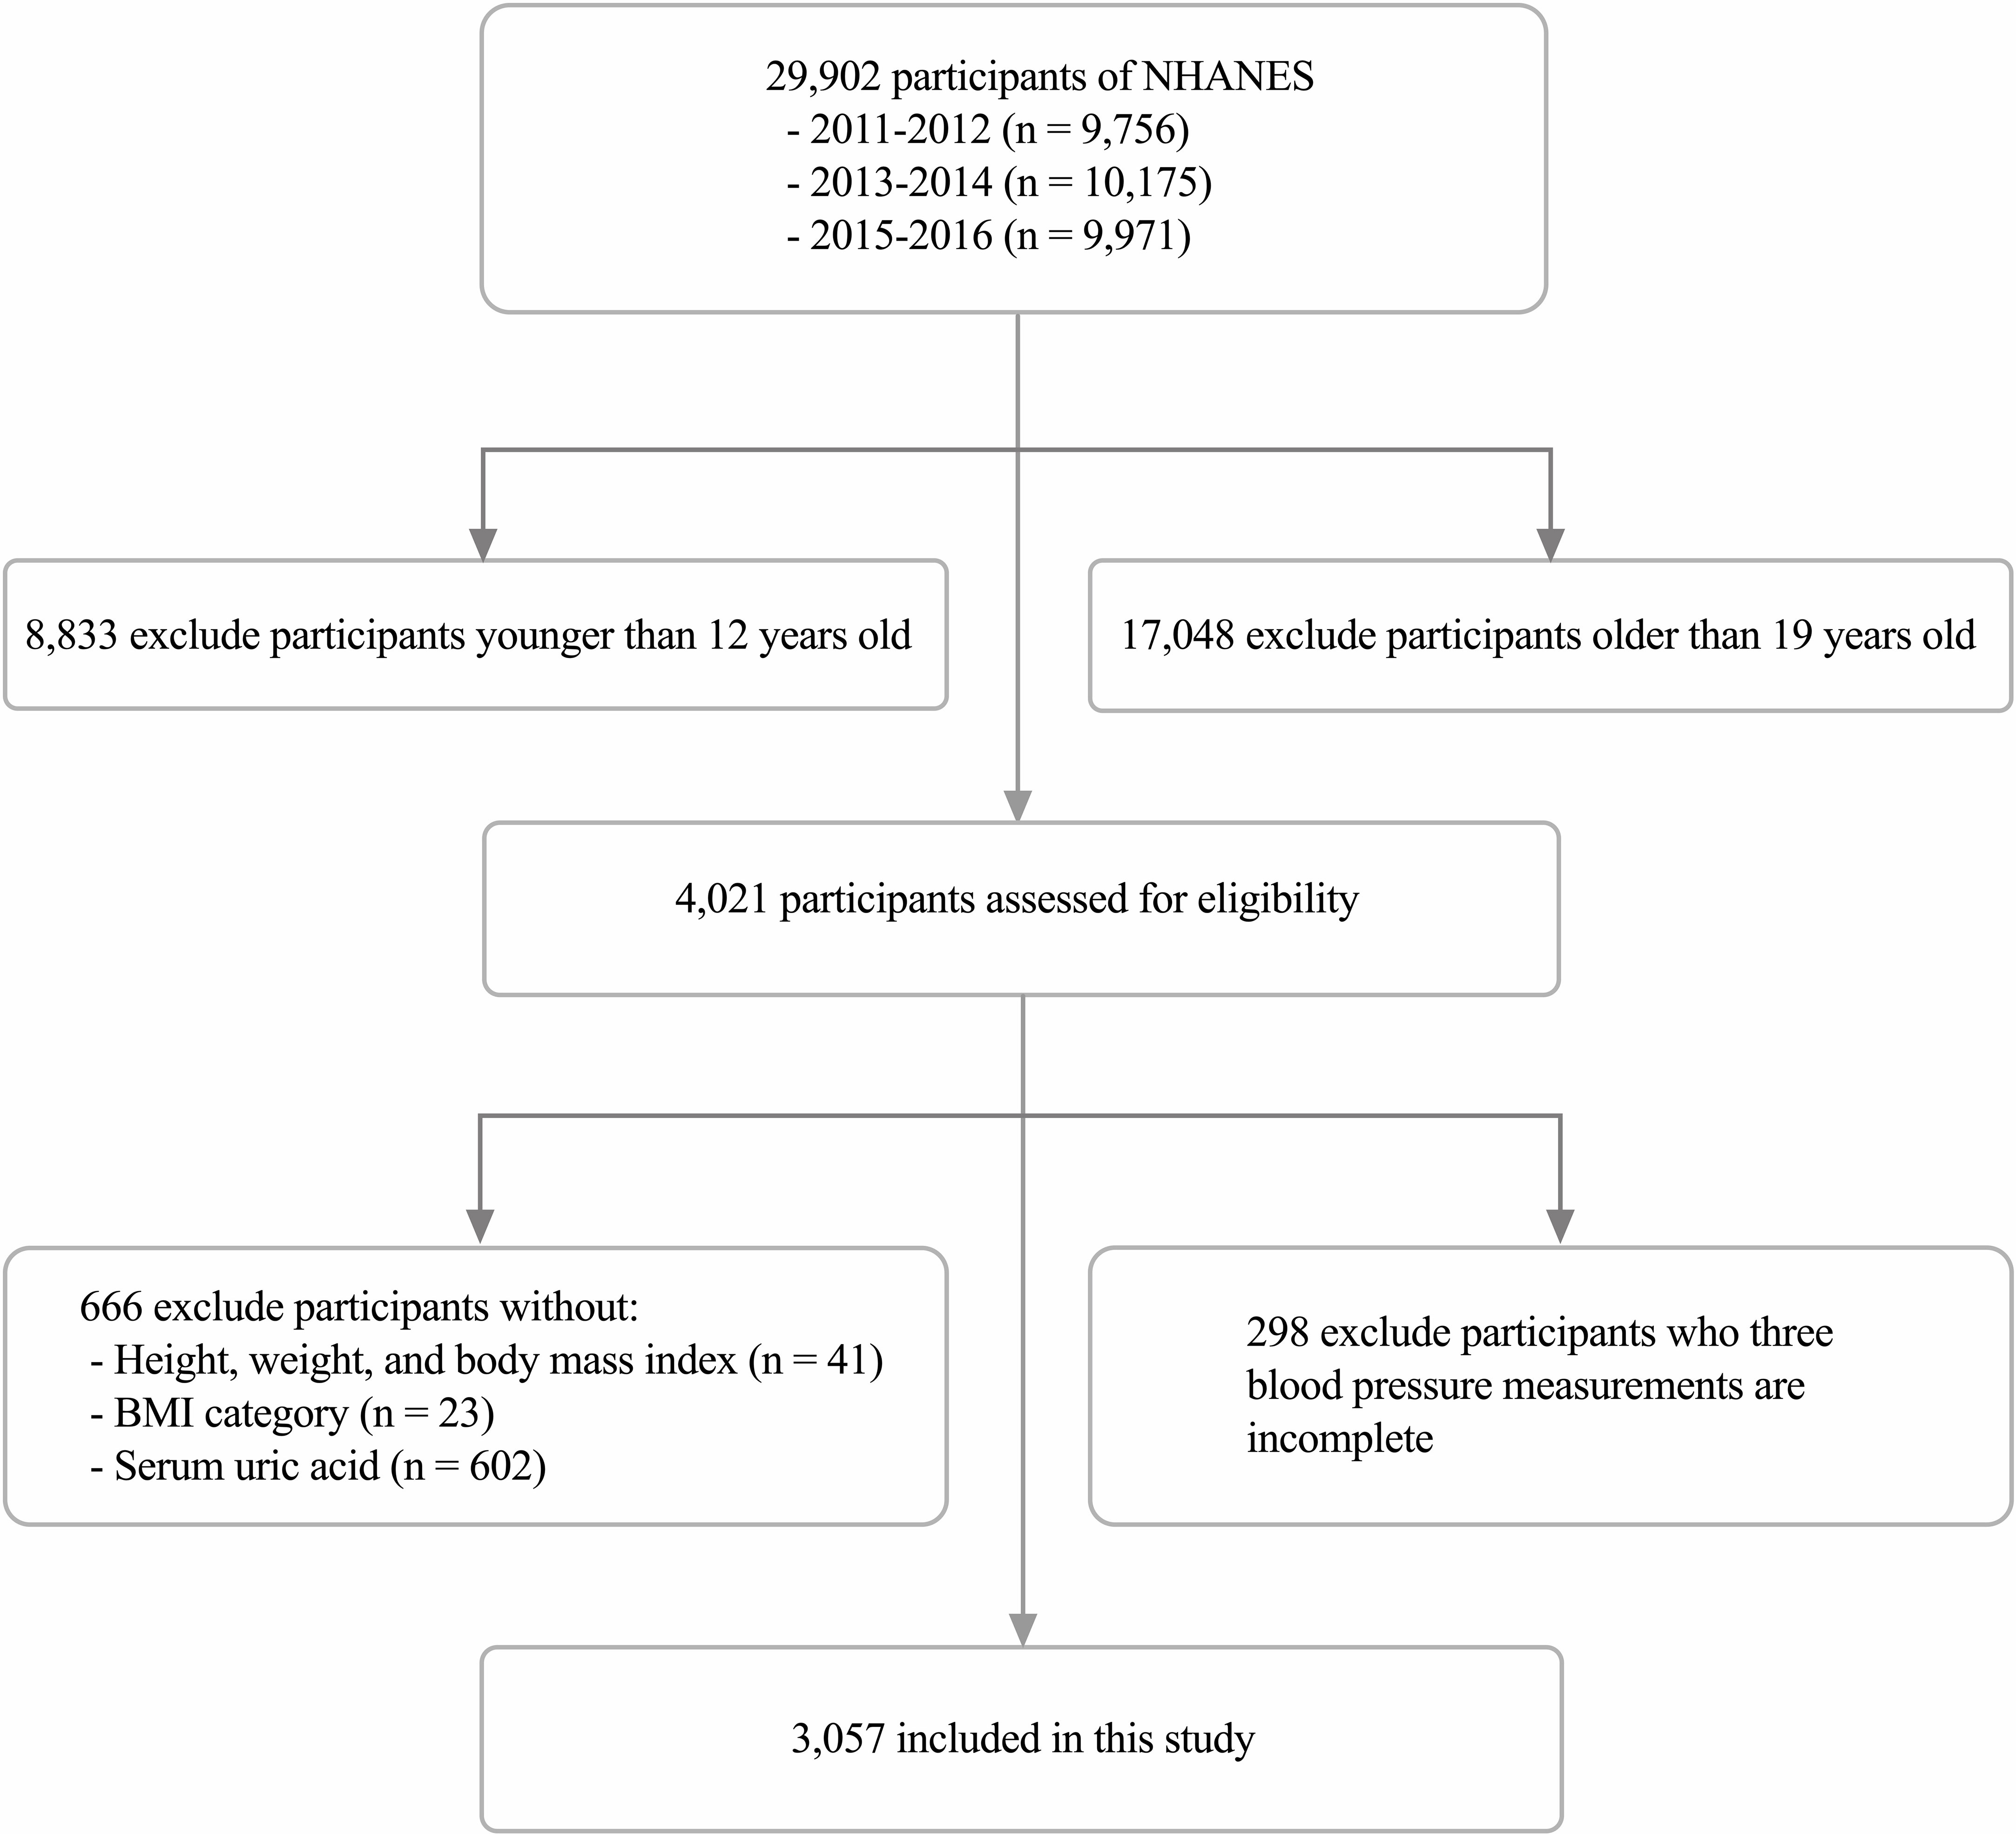
Figure 1 Flow of participants through the study.
Variables
The exposure variable in this study was SUA. The DxC800 uses a timed endpoint method to measure the concentration of uric acid in serum, plasma or urine. The outcome variable was the estimated glomerular filtration rate (eGFR), calculated using the latest modified Schwartz equation: eGFR=0.413*[height (cm)/serum creatinine (mg/dL)] (22). The body measurement data were collected in the Mobile Examination Center (MEC) by trained health technicians. The poverty income ratio is the ratio of family income to poverty and is calculated using the Department of Health and Human Services (HHS) poverty guidelines as the poverty measure. The scale includes the following terms and corresponding values: “mild” (poverty income ratio <1.99), “moderate” (1.99 ≤ poverty income ratio ≤ 3.49), and “severe” (poverty income ratio > 3.49). The BMI (body mass index), expressed as weight in kilograms divided by height in meters squared (kg/m2), is commonly used to classify weight status. The definitions of underweight, normal weight, overweight, and obesity in children and adolescents are not directly comparable with the definitions in adults, which were defined as “underweight” (BMI < 5th percentile), “normal weight” (BMI 5th to < 85th percentiles), “overweight” (BMI 85th to < 95th percentiles) and “obese” (BMI ≥ 95th percentile) (23). Some details of other incorporated variables are openly available at www.cdc.gov/nchs/nhanes/.
Based on previous relevant studies, clinical experience, and data collected in the NHANES database, the continuous variables among the covariates included in this study were age, weight, waist circumference, BMI, systolic blood pressure (SBP), diastolic blood pressure (DBP), albumin, globulin, total protein, alanine aminotransferase (ALT), aspartate aminotransferase (AST), gamma glutamyl transaminase (GGT), lactate dehydrogenase (LDH), blood urea nitrogen (BUN), serum glucose, total cholesterol, triglycerides, low-density lipoprotein (LDL), high-density lipoprotein (HDL), and urinary albumin creatinine ratio (ACR). The categorical variables among the covariates were sex, race, education level, poverty income ratio, and BMI category. In addition, height and serum creatinine were not included as covariates because of their involvement in the calculation of the eGFR.
Data analysis
Data analysis for this study was completed under the guidance of the CDC guidelines. Furthermore, given the complexity and nonresponse of the NHANES survey design, we used sample weights to analyze the data. Because of the skewed distribution of the eGFR, we used the log-transformed eGFR (LgeGFR) for the analysis of the eGFR. First, the sample weights were used in the analysis of weighted means (continuous variables), percentages (categorical variables), and standard errors of baseline characteristics. Second, after adjustment for potential confounders, weighted multiple regression analysis was used to estimate the independent relationship between SUA and LgeGFR. Third, weighted generalized additive models and smooth curve fitting were used to describe the nonlinear relationships in the subgroup analysis. Three models were used in the regression analysis: Model 1 was the crude model and did not include any covariates for adjustment; Model 2 was adjusted for age, sex, race, and BMI; Model 3 was adjusted for age, sex, race, education attainment, poverty income ratio, weight, waist circumference, BMI, BMI category, SBP, DBP, albumin, globulin, total protein, ALT, AST, GGT, LDH, BUN, serum glucose, total cholesterol, triglycerides, LDL, HDL, and the ACR.
Categorical variables are expressed as frequencies or percentages, and continuous variables are expressed as the means ± standard deviations. All data analyses were performed using the R package data software (http://www.R-project.org) and Empower (http://www.empowerstats.com). P < 0.05 was considered statistically significant.
Results
Description of baseline characteristics
The weighted demographic and medical characteristics are described in Table 1. A total of 3057 adolescents aged 12-19 years were included in our study, of whom 51.88% were male, 48.12% were female, 55.17% were white, 13.84% were black, 14.40% were Mexican American, and 16.60% were of other races. Significant differences were found in each of the baseline characteristics of the groups according to the four subgroups of SUA, except for poverty income ratio, globulin and total cholesterol. In addition, participants with SUA in the lower range (Q1: <4.00 mg/dL, Q2: 4.10-4.80 mg/dL) were more likely to be female (79.67%, 69.51%), while those in the higher range (Q3: 4.90-5.70 mg/dL, Q4: ≥5.80 mg/dL) were more likely to be male (64.32%, 81.21%). Compared to other subgroups, participants in the top quartile of SUA levels had a higher weight, height, waist circumference, BMI, SBP, DBP, albumin, ALT, AST, LDH, BUN, serum creatinine, serum glucose, total cholesterol, triglycerides, and LDL and lower levels of HDL and eGFR. Additionally, we observed that participants in the lowest quartile of SUA levels had much higher urinary albumin creatinine ratios than those in the other groups.
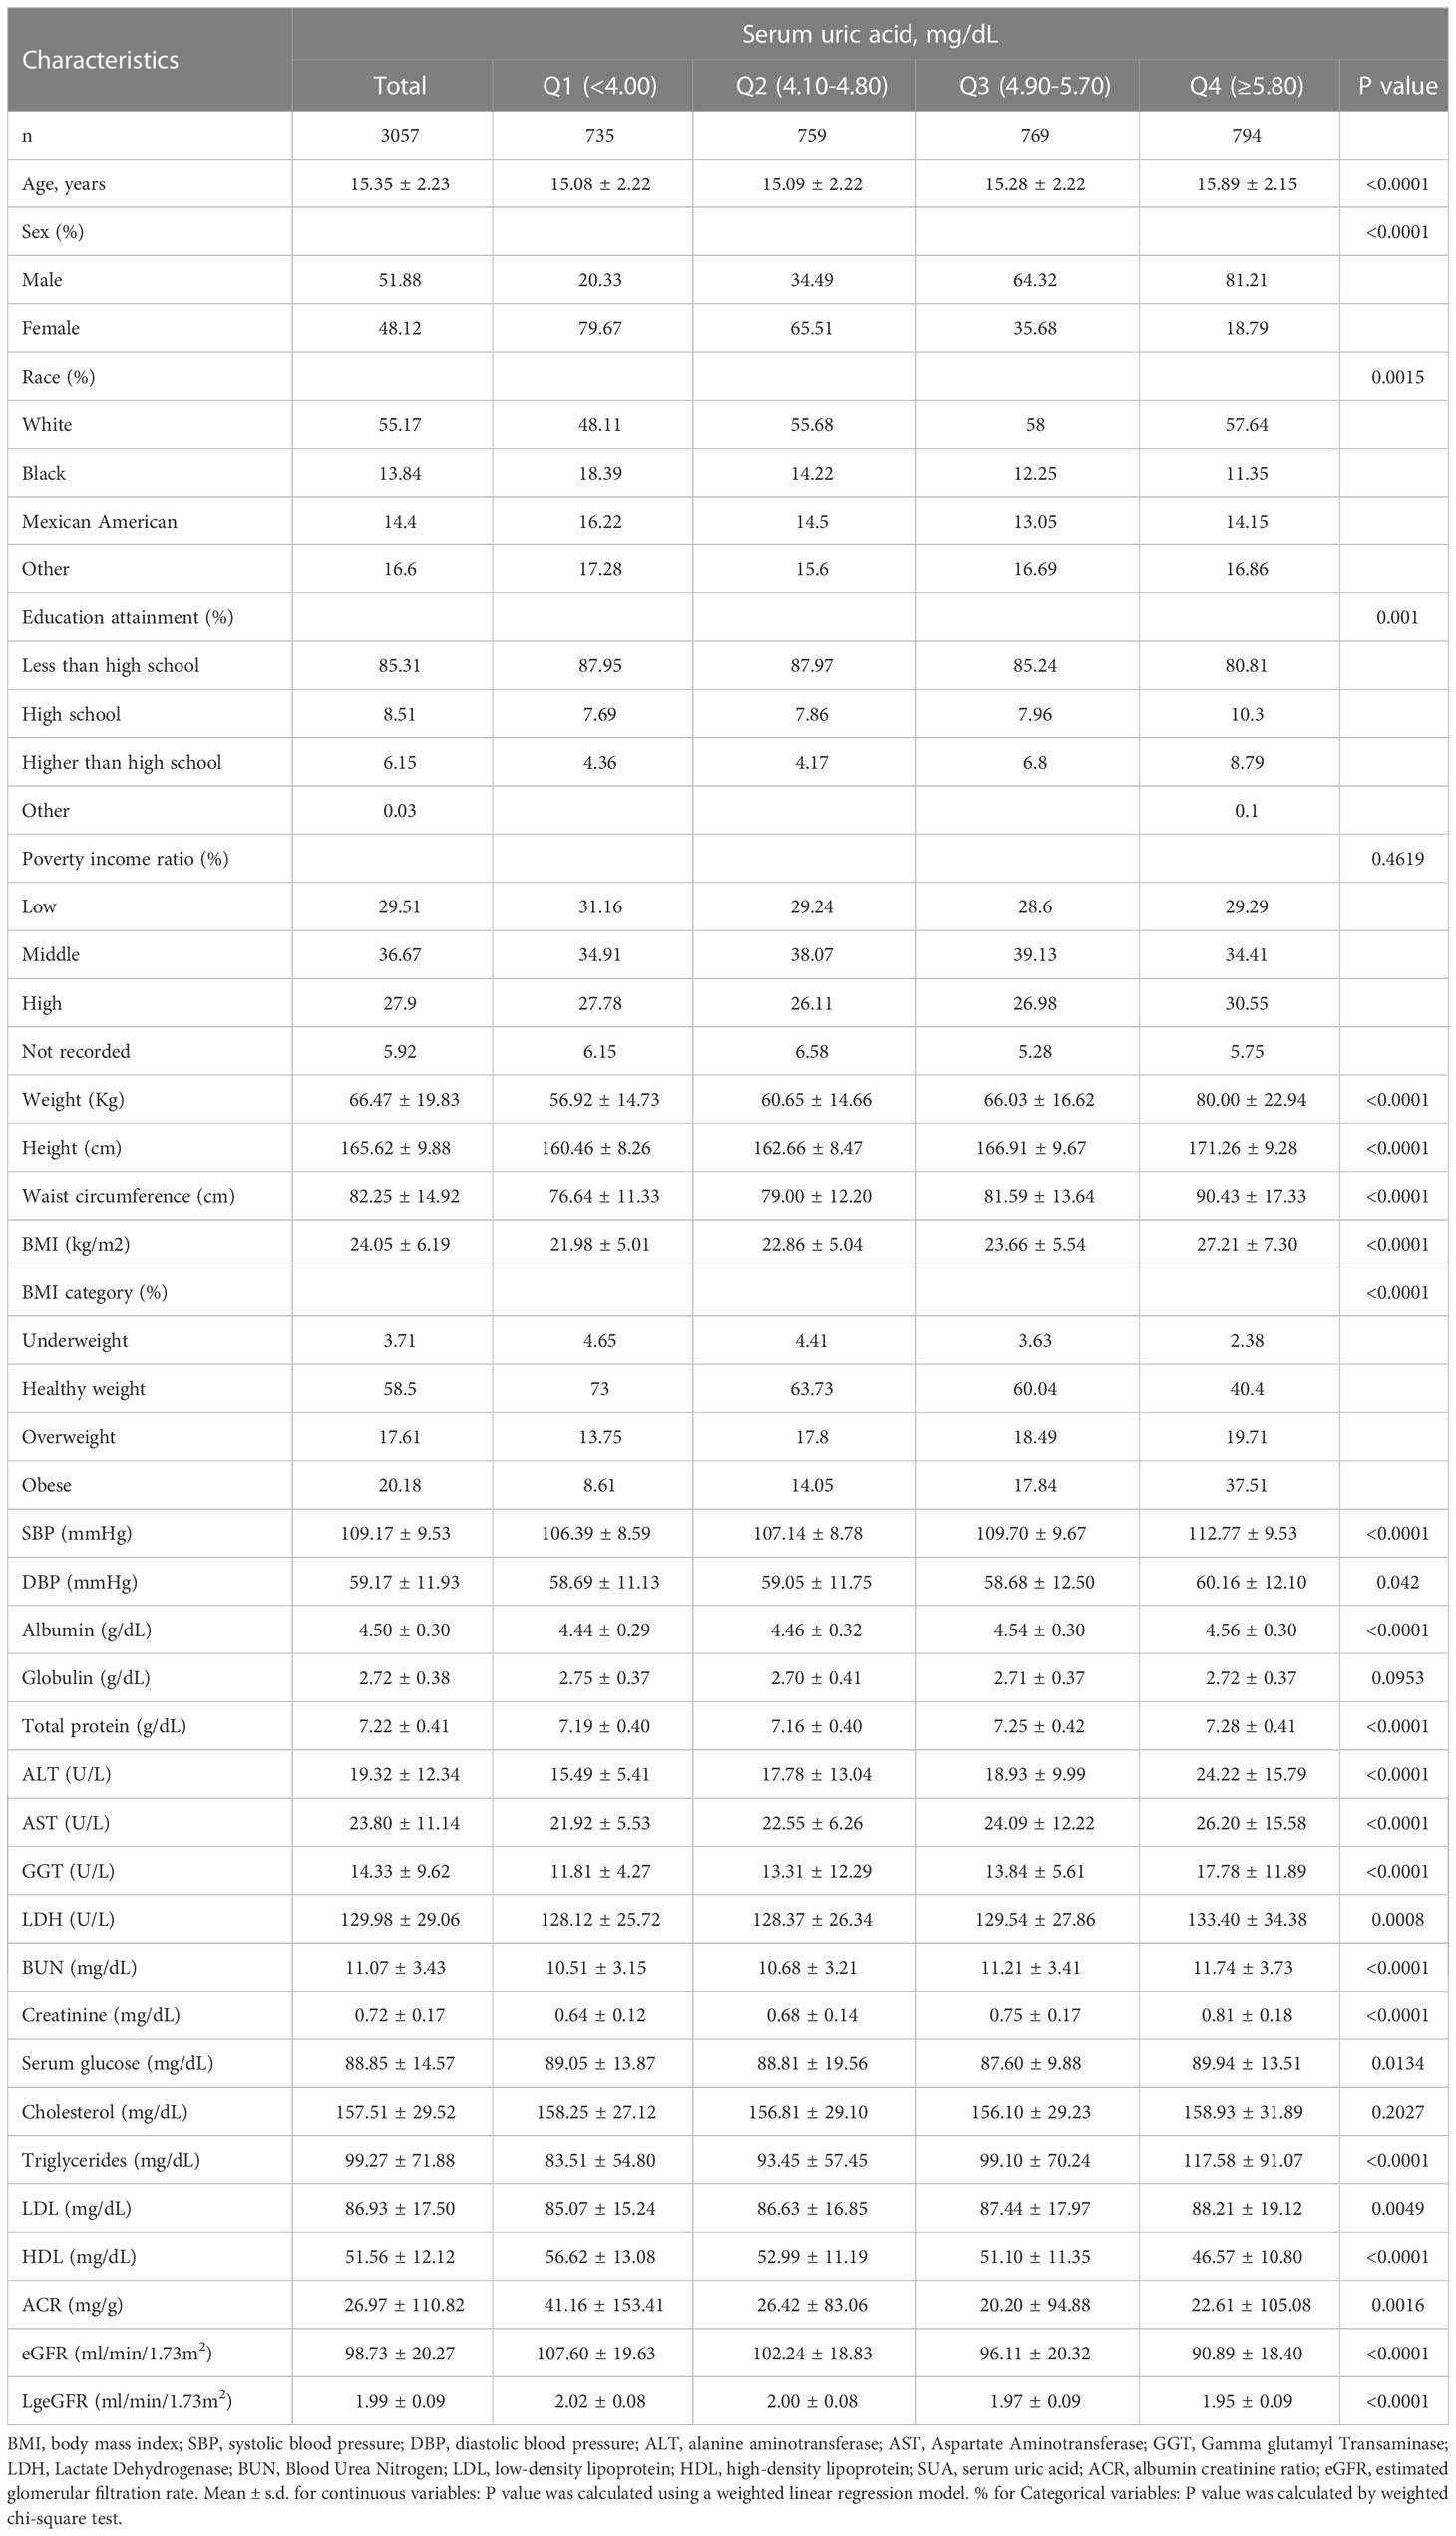
Table 1 Description of 3,057 participants included in the present study.
Relationship between SUA and log-transformed eGFR
The results of the multivariate regression analysis are shown in Table 2, and the smoothed curve fits and scatter plots are shown in Figure 2. When not adjusted for any covariates (Model 1), SUA was negatively associated with log-transformed eGFR (β=-0.0232, 95% CI: -0.0256-0.0207, P<0.0001). After adjusting for age, sex, race, and BMI category only (Model 2) (β=-0.0177, 95% CI: -0.0204- -0.0151, P<0.0001) and after adjusting for all covariates (Model 3) (β=-0.0177, 95% CI: -0.0203-0.0151, P<0.0001), this negative correlation remained. In addition, we found that compared to baseline levels in the lowest quartile of SUA, the log-transformed eGFR of the group in the highest quartile was 0.0508 lg (ml/min/1.73 m2) lower than that of the lowest quartile. Meanwhile, P for trend test all had P<0.001, suggesting that the trend of decreased LgeGFR was significant for each increase in SUA level.
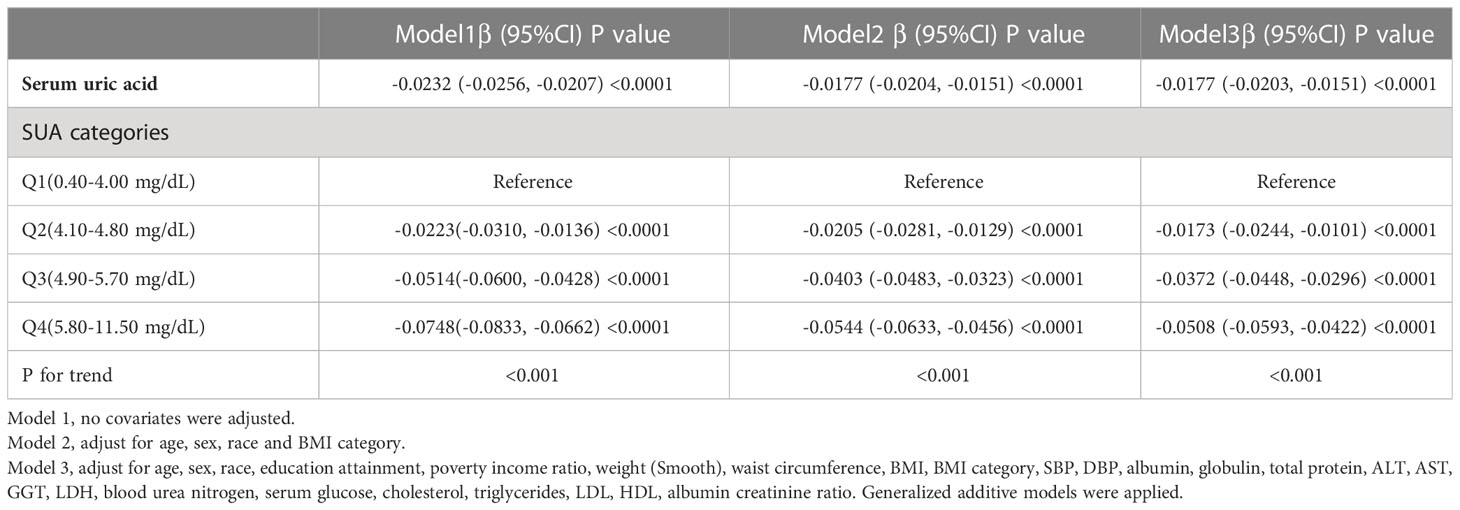
Table 2 Association of SUA with LgeGFR among 3,057 12–19 year-old adolescents, NHANES 2011–2016.
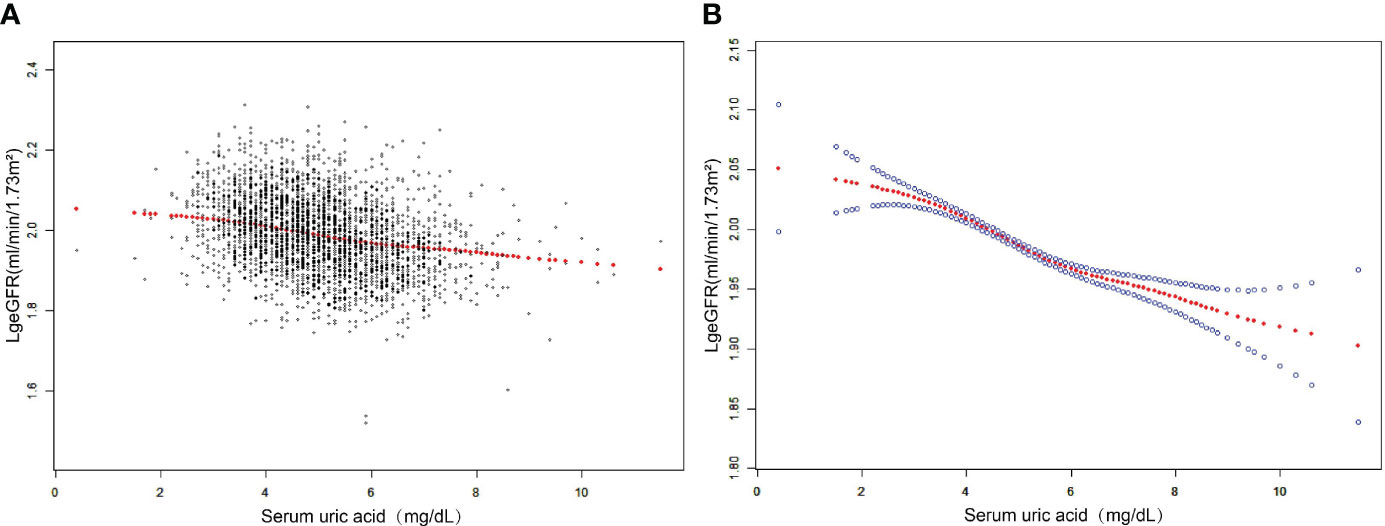
Figure 2 The association between SUA and log-transformed eGFR. (A) Each black point represents a sample. (B) The solid red line represents the smooth curve fit between variables. Blue bands represent the 95% confidence interval from the fit. Adjusted for age, sex, race, education attainment, poverty income ratio, weight, waist circumference, BMI, BMI category, SBP, DBP, albumin, globulin, total protein, ALT, AST, GGT, LDH, blood urea nitrogen, serum glucose, cholesterol, triglycerides, LDL, HDL, albumin creatinine ratio.
Subgroup analysis based on potential effects
Subgroup analysis according to sex, age, race, and BMI category is shown in Table 3. After subgroup analysis by sex, age, and race, male adolescents (SUA 5.60 ± 1.15 mg/dL), adolescents aged 16-19 years (SUA 5.19 ± 1.27 mg/dL), and white adolescents (SUA 5.12 ± 1.20 mg/dL) had higher SUA levels. After adjustment for all covariates (Model 3), the decrease in log-transformed eGFR due to changes in SUA levels (Per 1, mg/dL increase) was higher in female adolescents (β=-0.0177, 95% CI: -0.0216, -0.0138, P<0.0001), adolescents aged 12-15 years (β=- 0.0163, 95% CI: -0.0200, -0.0125, P<0.0001) and black (β=-0.0199, 95% CI: -0.0251, -0.0148, P<0.0001) adolescents. Furthermore, we found that adolescents with higher BMI had higher SUA levels, and the effect of SUA on eGFR was highest in underweight adolescents compared to other body types (β=-0.0386, 95% CI: (-0.0550, -0.0223), P<0.0001). As shown in Figure 3, after stratifying by age, sex, race and BMI category, we also attempted to use smoothed curve fitting to find a linear and nonlinear relationship between SUA and log-transformed eGFR in different subgroups. Finally, interaction tests showed that the relationship between SUA and log-transformed eGFR was significantly different (P for interaction < 0.05) between adolescents of different races (P for interaction = 0.015) and different BMI categories (P for interaction = 0.003), while this negative relationship was concordant across subgroups of sex and age.
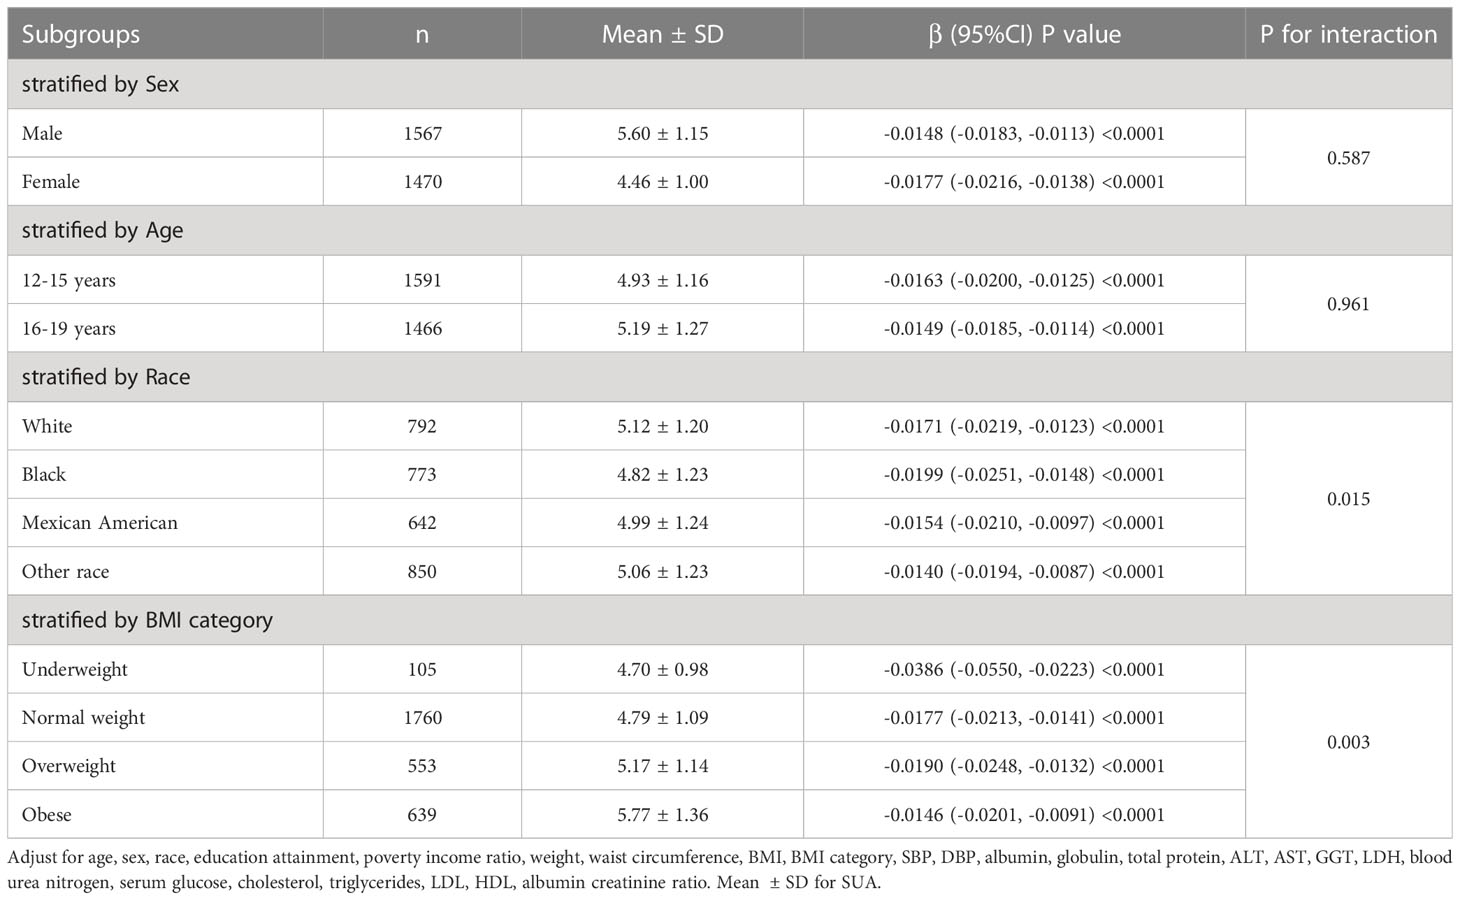
Table 3 Subgroup analyses of the effect of SUA on LgeGFR.
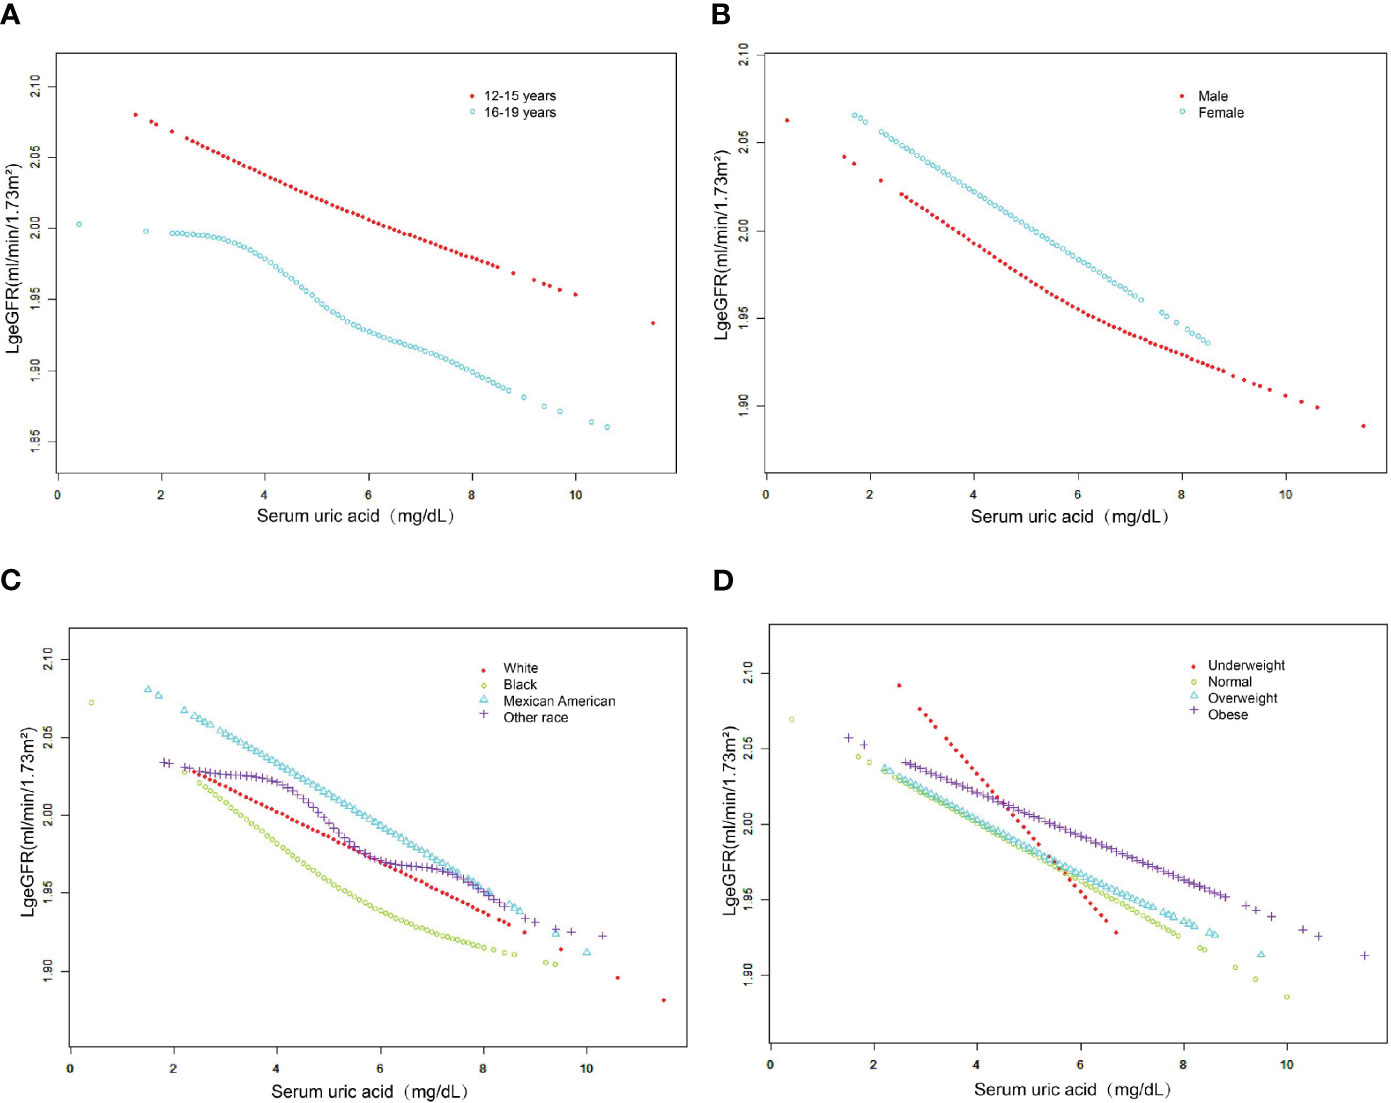
Figure 3 The association between serum uric acid and log-transformed eGFR stratified by age (A), sex (B), race (C) and BMI category (D). Adjusted for education attainment, poverty income ratio, weight, waist circumference, BMI, SBP, DBP, albumin, globulin, total protein, ALT, AST, GGT, LDH, blood urea nitrogen, serum glucose, cholesterol, triglycerides, LDL, HDL, albumin creatinine ratio.
Log-transformed eGFR by quartiles of SUA, stratified by age and BMI category
As shown in Table 4, we stratified adolescents aged 12-19 years by age. The results showed a significant association between SUA levels and lower log-transformed eGFR (P for trend < 0.001) among all normal weight adolescents, underweight adolescents aged 16-19 years, overweight adolescents aged 12-15 years, and obese adolescents among the 3057 participants included after adjustment for age, sex, race, and BMI category. Additionally, the strongest associations were observed in all normal weight adolescents combined, 16- to 19-year-old underweight adolescents, and 12- to 15-year-old overweight adolescents, all of whom had reduced log-transformed eGFR for each SUA quartile. Finally, the results of the trend test were significant (P for trend<0.001) for all subgroups except for underweight adolescents aged 12-15 years and overweight and obese adolescents aged 16-19 years.
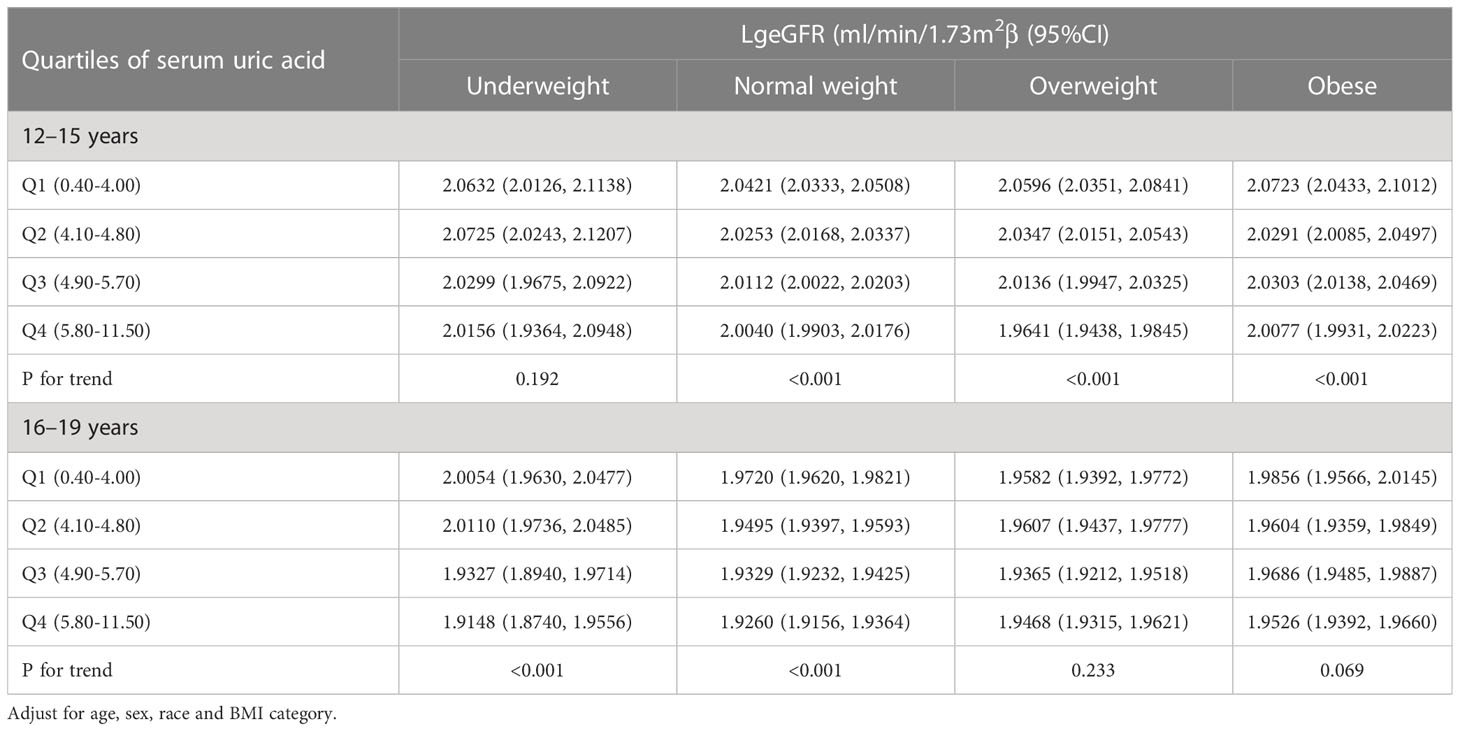
Table 4 log-transformed eGFR by quartiles of serum uric acid, stratified by age and BMI category.
Discussion
In this large population-based and representative cross-sectional study, we found an inverse relationship between SUA and log-transformed eGFR, and the relationship was significantly different among adolescents of different ethnicities and BMI. Notably, compared with adolescents with other BMI categories, we found for the first time that the effect of SUA on log-transformed eGFR was greatest in underweight adolescents. Finally, this study also investigated the conclusions of a previous study that higher SUA levels are associated with higher BMI and that there are sex differences in SUA levels.
Recently, many intensive studies on SUA have found that SUA is an associated risk factor for many diseases (10, 13, 24–26). Previous studies on the effect of SUA on kidney injury have mainly focused on the prognosis of CKD. However, this field is still fraught with controversy. Sampson A.L. et al. performed a systematic review including 12 studies with 1,187 participants. The results indicated that the protective effect of uric acid-lowering therapy on renal function has obvious time-dependent effects. A decrease in serum creatinine and an increase in eGFR were observed after one year of uric acid-lowering therapy, but it showed little or no effect on eGFR after two years (27). However, another study showed different results about an inverse relationship between SUA levels and protection from CKD incidence and progression. Lower UA levels were protective for the risk of CKD incidence (RR 0.65 [95% CI 0.56-0.75]) and progression (RR 0.55 [95% CI 0.44-0.68]) (28). The results that we obtained also support this conclusion. That is, an apparent aggravated kidney injury characterized by a decrease in the eGFR is accompanied by elevated levels of serum uric acid. The reason for this result may be related to crystal-dependent or crystal-independent mechanisms of renal injury associated with SUA (20, 21). Nevertheless, further longitudinal studies are needed to verify these contradictory findings, which can be attributed to the differences in study design, study populations, and adjustment of confounding factors.
The study of uric acid has yielded a wealth of research results over the past few decades, both in the basic and clinical fields. The most discussed mechanisms of uric acid-induced kidney injury include oxidative stress, endothelial cell dysfunction, renal fibrosis, and renal inflammatory response (29). Past studies on the physiological functions of uric acid have found that it can counteract oxidative stress by avoiding oxidative inactivation of endothelial enzymes and by maintaining vascular endothelium-mediated vasodilatation (30). However, uric acid can also exacerbate cell and tissue damage due to oxidative stress by increasing the production of reactive oxygen species. For example, as precursors of uric acid, purines can increase reactive oxygen levels by inducing IFN-γ upregulation of xanthine oxidoreductase expression (31). Excessive production of reactive oxygen species causes cellular damage, including vascular endothelial cells. Meanwhile, high-dose uric acid-mediated reduction in nitric oxide synthase activity and nitric oxide production is also involved in endothelial cell dysfunction, which ultimately increases the incidence of numerous adverse outcome events represented by cardiovascular events (32). More evidence from basic research is needed to confirm the details of this mechanism.
In the current study, we used a combination of subgroup analysis and an interaction test to find different effects of SUA on eGFR in adolescents with different BMIs. In addition, we focused for the first time on underweight adolescents as a potential at-risk population. As mentioned earlier, the effect of SUA levels on kidney function in the population can be influenced by many metabolic diseases and even by poor lifestyle habits such as smoking and alcohol consumption (33–35). Thus, the selection of adolescents can avoid the interference of these potential confounders and make them the ideal population to study.
Baseline data on renal function in underweight adolescents are limited. A study of malnutrition-inflammation-cachexia syndrome (MICS) in older individuals concluded that MICS could influence the relationship between high eGFR and mortality, particularly in people with low body mass index (36). This suggests, to some extent, that underweight adolescents may have an impairment of the glomerular filtration rate itself. Furthermore, although low SUA levels in the underweight adolescents in this study cannot be defined as hypouricemia compared to other adolescents, previous studies have found that renal hypouricemia can lead to the development of kidney stones as well as exercise-induced acute kidney injury (37, 38).
In addition, low weight is often associated with a reduced incidence of hyperuricaemia (39). A recent cohort study based on a large sample size found that SUA<5.7 mg/dL was a key inflection point for predicting mortality risk in the population. The study showed for the first time that muscle loss and weight loss were more common in people with low SUA and were associated with higher mortality (40). A point worth noting for us is that the eGFR, which measured glomerular filtration levels in adolescents in this study, is an imperfect estimate of the true glomerular filtration rate based on creatinine measurements. Among the factors affecting creatinine concentrations are, on the one hand, residual functional clearance from the glomerulus and, on the other hand, indirect conversion of creatine from muscle metabolism. Therefore, muscle mass is a key factor influencing the magnitude of eGFR based on creatinine measurements (41). In the present study, the greatest effect of SUA on glomerular filtration rate was observed in adolescents with a lean BMI, probably due to the influence of low SUA levels in the lean adolescents themselves, and on the other hand, because eGFR based on creatinine measurements cannot avoid the interference of muscle mass due to differences in body mass. Therefore, obtaining measures of true glomerular filtration levels that are not confounded by muscle metabolic factors, such as inulin clearance and eGFR from radioactive elements, is particularly important in future studies (42, 43). Thus, this evidence may partially explain our results.
Meanwhile, case-control studies revealed that lower birth weight may be associated with the onset and progression of CKD in adulthood, possibly due to damage to the nephrons (44–47). The causes of impaired renal function may be related to the severity of perinatal complications, lower birth weight and shorter gestational age (48). However, due to the lack of the adolescents’ relevant medical history dating back to birth in the NHANES database, it is not known whether there is a low glomerular filtration rate secondary to birth in the underweight adolescents in the present study. Therefore, an in-depth study based on a larger sample size is urgently needed to validate the findings of this study.
There are several limitations to our study. First, the present study is a cross-sectional study based on the NHANES database, which has the inherent weakness of being unable to reveal causal relationships between exposures and outcomes. Second, although we adjusted for numerous covariates that may influence the relationship between SUA and eGFR, the lack of prior medical history of adolescents in the database may have some impact on the effect values of the final study findings. Finally, we used the latest revision of the Schwartz formula to calculate the estimated glomerular filtration rate (22), but this is not a completely accurate proxy for the true glomerular filtration rate in adolescents of all ages. Therefore, more in-depth and well-designed longitudinal study designs are needed to elucidate the relationship between the two.
Conclusion
SUA was negatively associated with eGFR in adolescents aged 12-19 years. Furthermore, we found for the first time that SUA affects eGFR differently in adolescents with different BMIs. This effect was particularly significant in underweight adolescents. Therefore, we suggest that society and families should pay attention to the monitoring and management of BMI in adolescents, thus providing guidance for the prevention of CKD in adolescents. However, this study conclusion needs to be confirmed in further prospective studies and in a larger representative sample of underweight adolescents.
Data availability statement
The datasets presented in this study can be found in online repositories. The names of the repository/repositories and accession number(s) can be found in the article/Supplementary Material.
Ethics statement
The studies involving human participants were reviewed and approved by The ethics review board of the National Center for Health Statistics. Written informed consent to participate in this study was provided by the participants’ legal guardian/next of kin. Written informed consent was obtained from the individual(s), and minor(s)’ legal guardian/next of kin, for the publication of any potentially identifiable images or data included in this article.
Author contributions
QT and CH had the idea for the study. QT and CH selected studies for inclusion and abstracted data. ZW, MH, YF and QT did the statistical analyses. CH and QT interpreted the data. QT wrote the first draft. MZ and QH critically revised the paper for important intellectual content. All authors contributed to the article and approved the submitted version.
Funding
This research was funded by Hunan innovative province construction project (Grant No. 2019SK2211), Key research and development project of Hunan Province (Grant No.2020SK2089), The Natural Science Foundation of Hunan province (Grant Nos 2020JJ4833, 2019SK2211, and XY040019), Hunan Province Key Field R&D Program (Grant No. 2020SK2097), and Horizontal Project (Grant Nos KY080269, KY080262, XY080323, and XY080324).
Acknowledgments
The authors appreciate the time and effort given by participants during the data collection phase of the NHANES project.
Conflict of interest
The authors declare that the research was conducted in the absence of any commercial or financial relationships that could be construed as a potential conflict of interest.
Publisher’s note
All claims expressed in this article are solely those of the authors and do not necessarily represent those of their affiliated organizations, or those of the publisher, the editors and the reviewers. Any product that may be evaluated in this article, or claim that may be made by its manufacturer, is not guaranteed or endorsed by the publisher.
Supplementary material
The Supplementary Material for this article can be found online at: https://www.frontiersin.org/articles/10.3389/fendo.2023.1138513/abstract#supplementary-material
References
1. Bikbov B, Purcell CA, Levey AS, Smith M, Abdoli A, Abebe M, et al. Global, regional, and national burden of chronic kidney disease, 1990-2017: a systematic analysis for the global burden of disease study 2017. Lancet (London England). (2020) 395(10225):709–33.
2. Kelly JT, Su G, Zhang L, Qin X, Marshall S, González-Ortiz A, et al. Modifiable lifestyle factors for primary prevention of CKD: a systematic review and meta-analysis. J Am Soc Nephrol JASN (2021) 32(1):239–53. doi: 10.1681/ASN.2020030384
3. Duan JW, Li YL, Li SX, Yang YP, Li F, Li Y, et al. Association of long-term ambient fine particulate matter (PM(2.5)) and incident CKD: a prospective cohort study in China. Am J Kidney Dis (2022) 80(5):638–47.e1. doi: 10.1053/j.ajkd.2022.03.009
4. Gjerde A, Skrunes R, Reisæter AV, Marti HP, Vikse BE. Familial contributions to the association between low birth weight and risk of CKD in adult life. Kidney Int Rep (2021) 6(8):2151–8. doi: 10.1016/j.ekir.2021.05.032
5. Fang J, Alderman MH. Serum uric acid and cardiovascular mortality the NHANES I epidemiologic follow-up study, 1971-1992. national health and nutrition examination survey. Jama (2000) 283(18):2404–10. doi: 10.1001/jama.283.18.2404
6. Messerli FH, Frohlich ED, Dreslinski GR, Suarez DH, Aristimuno GG. Serum uric acid in essential hypertension: an indicator of renal vascular involvement. Ann Internal Med (1980) 93(6):817–21. doi: 10.7326/0003-4819-93-6-817
7. Viazzi F, Leoncini G, Vercelli M, Deferrari G, Pontremoli R. Serum uric acid levels predict new-onset type 2 diabetes in hospitalized patients with primary hypertension: the MAGIC study. Diabetes Care (2011) 34(1):126–8. doi: 10.2337/dc10-0918
8. Doria A, Krolewski AS. Diabetes: lowering serum uric acid levels to prevent kidney failure. Nat Rev Nephrol (2011) 7(9):495–6. doi: 10.1038/nrneph.2011.107
9. Allison SJ. Diabetes: serum uric acid level is associated with early GFR loss in type 1 diabetes. Nat Rev Nephrol (2010) 6(8):446. doi: 10.1038/nrneph.2010.92
10. Ismail L, Materwala H, Al Kaabi J. Association of risk factors with type 2 diabetes: a systematic review. Comput Struct Biotechnol J (2021) 19:1759–85. doi: 10.1016/j.csbj.2021.03.003
11. Pugliese NR, Mengozzi A, Virdis A, Casiglia E, Tikhonoff V, Cicero AFG, et al. The importance of including uric acid in the definition of metabolic syndrome when assessing the mortality risk. Clin Res Cardiol Off J German Cardiac Soc (2021) 110(7):1073–82. doi: 10.1007/s00392-021-01815-0
12. Lee AM, Gurka MJ, DeBoer MD. Correlation of metabolic syndrome severity with cardiovascular health markers in adolescents. Metab: Clin experiment (2017) 69:87–95. doi: 10.1016/j.metabol.2017.01.008
13. Srivastava A, Kaze AD, McMullan CJ, Isakova T, Waikar SS. Uric acid and the risks of kidney failure and death in individuals with CKD. Am J Kidney Dis (2018) 71(3):362–70. doi: 10.1053/j.ajkd.2017.08.017
14. Carrero JJ, Stenvinkel P. Predialysis chronic kidney disease in 2010: novel targets for slowing CKD progression. Nat Rev Nephrol (2011) 7(2):65–6. doi: 10.1038/nrneph.2010.177
15. Zhou H, Liu Z, Chao Z, Chao Y, Ma L, Cheng X, et al. Nonlinear relationship between serum uric acid and body mass index: a cross-sectional study of a general population in coastal China. J Trans Med (2019) 17(1):389. doi: 10.1186/s12967-019-02142-9
16. Jørgensen RM, Bøttger B, Vestergaard ET, Kremke B, Bahnsen RF, Nielsen BW, et al. Uric acid is elevated in children with obesity and decreases after weight loss. Front pedia (2021) 9:814166. doi: 10.3389/fped.2021.814166
17. Zeng J, Lawrence WR, Yang J, Tian J, Li C, Lian W, et al. Association between serum uric acid and obesity in Chinese adults: a 9-year longitudinal data analysis. BMJ Open (2021) 11(2):e041919. doi: 10.1136/bmjopen-2020-041919
18. Battelli MG, Bortolotti M, Polito L, Bolognesi A. The role of xanthine oxidoreductase and uric acid in metabolic syndrome. Biochim Biophys Acta Mol Basis Dis (2018) 1864(8):2557–65. doi: 10.1016/j.bbadis.2018.05.003
19. Furuhashi M. New insights into purine metabolism in metabolic diseases: role of xanthine oxidoreductase activity. Am J Physiol Endocrinol Metab (2020) 319(5):E827–e34. doi: 10.1152/ajpendo.00378.2020
20. Ejaz AA, Johnson RJ, Shimada M, Mohandas R, Alquadan KF, Beaver TM, et al. The role of uric acid in acute kidney injury. Nephron (2019) 142(4):275–83. doi: 10.1159/000499939
21. Sharaf El Din UAA, Salem MM, Abdulazim DO. Uric acid in the pathogenesis of metabolic, renal, and cardiovascular diseases: a review. J Adv Res (2017) 8(5):537–48. doi: 10.1016/j.jare.2016.11.004
22. Schwartz GJ, Munoz A, Schneider MF, Mak RH, Kaskel F, Warady BA, et al. New equations to estimate GFR in children with CKD. J Am Soc Nephrol JASN (2009) 20(3):629–37. doi: 10.1681/ASN.2008030287
23. Kuczmarski RJ, Ogden CL, Guo SS, Grummer-Strawn LM, Flegal KM, Mei Z, et al. 2000 CDC growth charts for the united states: methods and development. Vital Health Stat Ser 11 Data Natl Health Survey (2002) 2002(246):1–190.
24. Ali N, Mahmood S, Islam F, Rahman S, Haque T, Islam S, et al. Relationship between serum uric acid and hypertension: a cross-sectional study in Bangladeshi adults. Sci Rep (2019) 9(1):9061. doi: 10.1038/s41598-019-45680-4
25. Ali N, Miah R, Hasan M, Barman Z, Mou AD, Hafsa JM, et al. Association between serum uric acid and metabolic syndrome: a cross-sectional study in Bangladeshi adults. Sci Rep (2020) 10(1):7841. doi: 10.1038/s41598-020-64884-7
26. Rocha E, Vogel M, Stanik J, Pietzner D, Willenberg A, Körner A, et al. Serum uric acid levels as an indicator for metabolically unhealthy obesity in children and adolescents. Hormone Res paedia (2018) 90(1):19–27. doi: 10.1159/000490113
27. Sampson AL, Singer RF, Walters GD. Uric acid lowering therapies for preventing or delaying the progression of chronic kidney disease. Cochrane Database system Rev (2017) 10(10):Cd009460. doi: 10.1002/14651858.CD009460.pub2
28. Gonçalves DLN, Moreira TR, da Silva LS. A systematic review and meta-analysis of the association between uric acid levels and chronic kidney disease. Sci Rep (2022) 12(1):6251. doi: 10.1038/s41598-022-10118-x
29. Su HY, Yang C, Liang D, Liu HF. Research advances in the mechanisms of hyperuricemia-induced renal injury. BioMed Res Int (2020) 2020:5817348. doi: 10.1155/2020/5817348
30. Becker BF. Towards the physiological function of uric acid. Free Radical Biol Med (1993) 14(6):615–31. doi: 10.1016/0891-5849(93)90143-I
31. Wang H, Xie L, Song X, Wang J, Li X, Lin Z, et al. Purine-induced IFN-γ promotes uric acid production by upregulating xanthine oxidoreductase expression. Front Immunol (2022) 13:773001. doi: 10.3389/fimmu.2022.773001
32. Park JH, Jin YM, Hwang S, Cho DH, Kang DH, Jo I. Uric acid attenuates nitric oxide production by decreasing the interaction between endothelial nitric oxide synthase and calmodulin in human umbilical vein endothelial cells: a mechanism for uric acid-induced cardiovascular disease development. Nitric Oxide Biol Chem (2013) 32:36–42. doi: 10.1016/j.niox.2013.04.003
33. Major TJ, Topless RK, Dalbeth N, Merriman TR. Evaluation of the diet wide contribution to serum urate levels: meta-analysis of population based cohorts. BMJ (Clinical Res ed). (2018) 363:k3951. doi: 10.1136/bmj.k3951
34. Kim Y, Kang J. Association of urinary cotinine-verified smoking status with hyperuricemia: analysis of population-based nationally representative data. Tobacco induced dis (2020) 18:84. doi: 10.18332/tid/127269
35. Nakagawa N, Hasebe N. Impact of mild-to-moderate alcohol consumption and smoking on kidney function. Hypertension Res (2017) 40(9):809–10. doi: 10.1038/hr.2017.51
36. Ou SM, Chen YT, Hung SC, Shih CJ, Lin CH, Chiang CK, et al. Association of estimated glomerular filtration rate with all-cause and cardiovascular mortality: the role of malnutrition-inflammation-cachexia syndrome. J cachexia sarcopenia muscle (2016) 7(2):144–51. doi: 10.1002/jcsm.12053
37. Ichida K, Hosoyamada M, Hisatome I, Enomoto A, Hikita M, Endou H, et al. Clinical and molecular analysis of patients with renal hypouricemia in Japan-influence of URAT1 gene on urinary urate excretion. J Am Soc Nephrol JASN (2004) 15(1):164–73. doi: 10.1097/01.ASN.0000105320.04395.D0
38. Hosoyamada M. Hypothetical mechanism of exercise-induced acute kidney injury associated with renal hypouricemia. Biomedicines (2021) 9(12):1847. doi: 10.3390/biomedicines9121847
39. Liu DM, Jiang LD, Gan L, Su Y, Li F. ASSOCIATION BETWEEN SERUM URIC ACID LEVEL AND BODY MASS INDEX IN SEX- AND AGE-SPECIFIC GROUPS IN SOUTHWESTERN CHINA. Endocr Pract (2019) 25(5):438–45. doi: 10.4158/EP-2018-0426
40. Baker JF, Weber DR, Neogi T, George MD, Long J, Helget LN, et al. Associations between low serum urate, body composition, and mortality. Arthritis Rheumatol (Hoboken NJ) (2023) 75(1):133–40. doi: 10.1002/art.42301
41. Nankivell BJ, Nankivell LFJ, Elder GJ, Gruenewald SM. How unmeasured muscle mass affects estimated GFR and diagnostic inaccuracy. EClinicalMedicine (2020) 29-30:100662. doi: 10.1016/j.eclinm.2020.100662
42. Inker LA, Titan S. Measurement and estimation of GFR for use in clinical practice: core curriculum 2021. Am J Kidney Dis (2021) 78(5):736–49. doi: 10.1053/j.ajkd.2021.04.016
43. Levey AS, Coresh J, Tighiouart H, Greene T, Inker LA. Measured and estimated glomerular filtration rate: current status and future directions. Nat Rev Nephrol (2020) 16(1):51–64. doi: 10.1038/s41581-019-0191-y
44. Al Salmi I, Hoy WE, Kondalsamy-Chennakes S, Wang Z, Healy H, Shaw JE. Birth weight and stages of CKD: a case-control study in an Australian population. Am J Kidney Dis (2008) 52(6):1070–8. doi: 10.1053/j.ajkd.2008.04.028
45. White SL, Perkovic V, Cass A, Chang CL, Poulter NR, Spector T, et al. Is low birth weight an antecedent of CKD in later life? a systematic review of observational studies. Am J Kidney Dis (2009) 54(2):248–61. doi: 10.1053/j.ajkd.2008.12.042
46. Brathwaite KE, Levy RV, Sarathy H, Agalliu I, Johns TS, Reidy KJ, et al. Reduced kidney function and hypertension in adolescents with low birth weight, NHANES 1999-2016. Pediatr Nephrol (2023) 2144. doi: 10.1007/s00467-023-05958-2
47. Gilarska M, Raaijmakers A, Zhang ZY, Staessen JA, Levtchenko E, Klimek M, et al. Extremely low birth weight predisposes to impaired renal health: a pooled analysis. Kidney Blood Pressure Res (2019) 44(5):897–906. doi: 10.1159/000502715
Keywords: serum uric acid, estimated glomerular filtration rate, BMI, adolescents, NHANES
Citation: Tian Q, He C, Wang Z, Hun M, Fu Y-C, Zhao M and He Q (2023) Relationship between serum uric acid and estimated glomerular filtration rate in adolescents aged 12-19 years with different body mass indices: a cross-sectional study. Front. Endocrinol. 14:1138513. doi: 10.3389/fendo.2023.1138513
Received: 05 January 2023; Accepted: 28 June 2023;
Published: 26 July 2023.
Edited by:
Weixia Sun, The First Hospital of Jilin University, ChinaReviewed by:
Benli Su, Second Hospital of Dalian Medical University, Dalian, ChinaMiguel Murguía-Romero, National Autonomous University of Mexico, Mexico
Copyright © 2023 Tian, He, Wang, Hun, Fu, Zhao and He. This is an open-access article distributed under the terms of the Creative Commons Attribution License (CC BY). The use, distribution or reproduction in other forums is permitted, provided the original author(s) and the copyright owner(s) are credited and that the original publication in this journal is cited, in accordance with accepted academic practice. No use, distribution or reproduction is permitted which does not comply with these terms.
*Correspondence: Qingnan He, heqn2629@csu.edu.cn; Mingyi Zhao, zhao_mingyi@csu.edu.cn