 Hongdian Li
 Mingxuan Li
 Shaoning Dong3
 Sai Zhang
- 1Dongfang Hospital, Beijing University of Chinese Medicine, Beijing, China
- 2Beijing Hospital of Traditional Chinese Medicine, Capital Medical University, Beijing, China
- 3Department of Nephrology, Tianjin academy of Traditional Chinese Medicine Affiliated Hospital, Tianjin, China
Background: Observational studies have identified a possible link between thyroid function and diabetic microangiopathy, specifically in diabetic kidney disease (DKD) and diabetic retinopathy (DR). However, it is unclear whether this association reflects a causal relationship.
Objective: To assess the potential direct effect of thyroid characteristics on DKD and DR based on Mendelian randomization (MR).
Methods: We conducted an MR study using genetic variants as an instrument associated with thyroid function to examine the causal effects on DKD and DR. The study included the analysis of 4 exposure factors associated with thyroid hormone regulation and 5 outcomes. Genomewide significant variants were used as instruments for standardized freethyroxine (FT4) and thyroid-stimulating hormone (TSH) levels within the reference range, standardized free triiodothyronine (FT3):FT4 ratio, and standardized thyroid peroxidase antibody (TPOAB) levels. The primary outcomes were DKD and DR events, and secondary outcomes were estimated glomerular filtration rate (eGFR), urinary albumin-to-creatinine ratio (ACR) in diabetes, and proliferative diabetic retinopathy (PDR). Satisfying the 3 MR core assumptions, the inverse-variance weighted technique was used as the primary analysis, and sensitivity analysis was performed using MR-Egger, weighted median, and MR pleiotropy residual sum and outlier techniques.
Results: All outcome and exposure instruments were selected from publicly available GWAS data conducted in European populations. In inverse-variance weighted random-effects MR, gene-based TSH with in the reference range was associated with DKD (OR 1.44; 95%CI 1.04, 2.41; P = 0.033) and eGFR (β: -0.031; 95%CI: -0.063, -0.001; P = 0.047). Gene-based increased FT3:FT4 ratio, decreased FT4 with in the reference range were associated with increased ACR with inverse-variance weighted random-effects β of 0.178 (95%CI: 0.004, 0.353; P = 0.046) and -0.078 (95%CI: -0.142, -0.014; P = 0.017), respectively, and robust to tests of horizontal pleiotropy. However, all thyroid hormone instruments were not associated with DR and PDR at the genetic level.
Conclusion: In diabetic patients, an elevated TSH within the reference range was linked to a greater risk of DKD and decreased eGFR. Similarly, decreased FT4 and an increased FT3:FT4 ratio within the reference range were associated with increased ACR in diabetic patients. However, gene-based thyroid hormones were not associated with DR, indicating a possible pathway involving the thyroid-islet-renal axis. However, larger population studies are needed to further validate this conclusion.
Introduction
Diabetic Kidney Disease (DKD) and Diabetic Retinopathy (DR) are among the most crucial microvascular lesions in diabetes, and frequently occur concomitantly (1). The growing global prevalence of diabetes is also leading to an increase in the population affected by DKD and DR. DKD is a major contributor to End-stage Renal Disease (ESRD), with an estimated 91% of all new cases of diabetes-related ESRD attributed to Type 2 Diabetes Mellitus (T2DM) according to the US Renal Data System (2). In developed countries, nearly 40% of DKD patients eventually require dialysis (3). DR is a leading cause of blindness among adults, and it is projected that over 200 million people worldwide will develop DR by 2040 (4). The complex chain reaction initiated by diabetes may be attributed to the buildup of Advanced Glycation End Products (AGEs) and increased erythrocyte adhesion to endothelial cells, which is a key pathogenic mechanism of the vascular complications associated with T2DM (5, 6). There may also be potential associations with other factors, including thyroid function.
Thyroid-related diseases and diabetes mellitus are two of the most significant metabolic disorders that have a well-documented association (7–9). The presence of thyroid hormone receptors in the vascular endothelial tissue means that alterations in circulating thyroid hormone levels can contribute to the development and progression of vascular disease (10). Hence, the influence of thyroid function on diabetic microvascular complications is attracting increased attention. The regulation of thyroid function is intricate and involves multiple components, including the pituitary and hypothalamus, feedback mechanisms, and the thyroid’s own characteristics and functions. The pituitary gland produces and releases thyroid-stimulating hormone (TSH), which stimulates the release of thyroxine from the thyroid gland. Thyroxine circulates in the body in a balanced state between its isolated protein-bound form and the bioavailable free form, referred to as free thyroxine (FT4). In both the thyroid and peripheral tissues, FT4 is converted to the active form of triiodothyronine (FT3), which can be assessed by the FT3:FT4 ratio in the circulation (11). Thyroid peroxidase antibodies (TPOAB), a biomarker of autoimmune thyroid disease, is a sensitive indicator of thyroid function and diverse physiological responses (12). Observational cross-sectional studies have revealed an independent association between the presence of subclinical hypothyroidism (SCH) and DKD (13). The results showed that DKD was negatively correlated with levels of free triiodothyronine (FT3) and free thyroxine (FT4), and positively correlated with thyroid-stimulating hormone (TSH) levels. In addition, low to normal levels of thyroid hormones were associated with the presence of massive albuminuria, and TSH and FT3 were found to be potential predictors of DKD (14–16). The hypothalamic-pituitary-thyroid axis plays a critical role in retinal development and increases retinal vascular density (17, 18). A recent study conducted in China explored the relationship between FT3 levels and DR in patients with T2DM who have normal thyroid function. Results showed a negative association between FT3 levels and DR in these patients (19). This observation was further supported by the finding that treatment of T2DM patients with thyroid hormones was associated with improvement in retinopathy (20). DKD and DR are interdependent risk factors for one another, with evidence suggesting a shared relationship with thyroid function (21–23). However, despite being influenced by common factors, current population-based clinical studies lack sufficient evidence to establish a direct causal link between thyroid function and the development of DKD and DR. Further research is needed to fully understand the underlying mechanisms and establish a clear relationship between these conditions.
Mendelian randomization (MR) is an analytical approach that leverages genetic variation to assess the causal relationship between independent and outcome variables in observational studies. This method is considered to be less susceptible to confounding or reverse causality compared to traditional observational analyses (24). The premise of MR is that if 7thyroid hormone levels have a direct impact on the development of DKD and DR, then genetic variants affecting thyroid function should also be associated with DKD and DR, with the magnitude of this association being consistent with the observed relationships.
The aim of this study was to investigate the potential causal relationship between thyroid function and DKD and DR using two-sample MR analysis. To complement the findings of MR, we conducted a further analysis using estimated glomerular filtration rate (eGFR) and urinary albumin to creatinine ratio (ACR) in patients with DM as secondary outcomes. The purpose of this complementary analysis was to provide additional evidence on the causal effect of thyroid function on DKD. Additionally, our study aimed to explore the causal effect of thyroid hormones on proliferative diabetic retinopathy (PDR), with the intention of identifying the need for increased protection of thyroid function in patients with severe DR lesions.
Methods
Data sources
In a genome-wide association study (GWAS) of thyroid traits among individuals of European ancestry, instrument-exposure associations were identified for FT4, FT3:FT4 ratio, TSH, and TPOAB based on single nucleotide polymorphisms (SNPs). Only SNPs that reached genome-wide significance levels (p < 5 × 10⁻⁸) were considered in this European population. To avoid linkage disequilibrium reactions and the potential double counting of similar genes within a certain range, screening conditions were set at R2 < 0.001 and kb = 10,000. A GWAS of reference range FT4 levels was conducted using data from 72,167 European subjects, as published by Teumer et al. The study identified 31 genetic loci with significant associations with reference range FT4 levels, implicating a role for these loci in thyroid development, physiological function and transport of thyroid hormones, as well as metabolism of these hormones (25). In a study conducted by Panicker et al., GWAS data for the FT3:FT4 ratio was obtained. The results revealed that a SNP, rs2235544, located in the DIO1 gene was significantly associated with the FT3:FT4 ratio at a genome-wide level. The researchers found that the presence of the C allele at this SNP locus was associated with an increase in the activity of deiodinase 1, leading to an elevated FT3:FT4 ratio. This elevated ratio was found to affect the physiological function of the thyroid gland (26). Genetic susceptibility loci associated with TSH levels in the reference range were derived from two studies that identified a total of 61 susceptibility loci associated with TSH levels in the reference range, and these loci were strongly associated with the development of thyroid cancer and goitre (27, 28). Medici et al. and Schultheiss et al. conducted two GWAS studies that identified a total of five susceptibility loci associated with TPOAB that predicted which TPOAB positivity predisposed to the development of clinical thyroid dysfunction (29, 30). The studies were granted ethical clearance by the institutional review board. Table 1 displays the characteristics of the results from the Genome-Wide Association Study (GWAS).
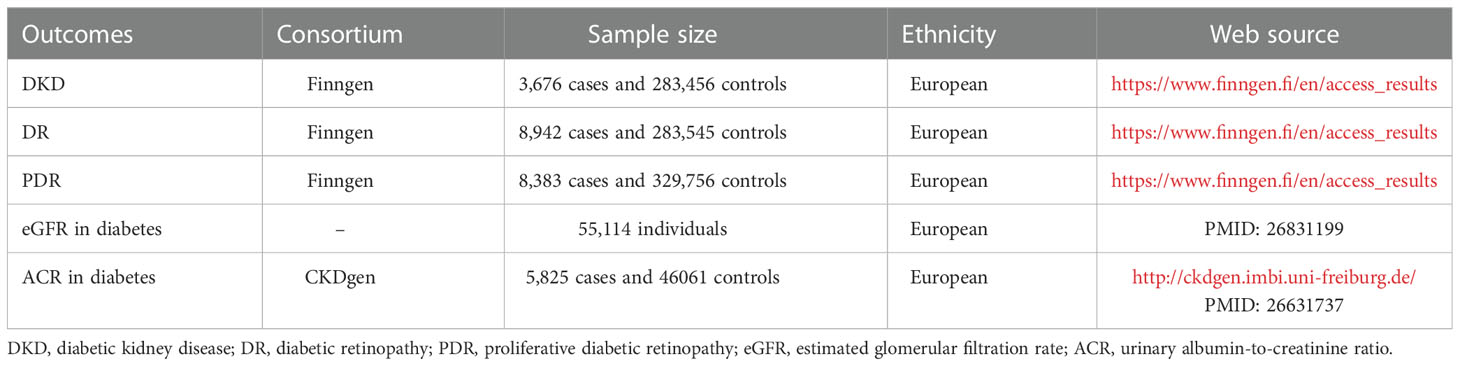
Table 1 The characteristics of GWAS studies on the outcomes.
The outcome measures were drawn from publicly available genetic association studies conducted in European populations. The primary outcomes were DKD and DR, and the raw data was obtained from the Finngen database (r8) (31), which included patients with all types of diabetes. The genetic association study cohort for DKD consisted of 3,676 cases and 283,456 controls, while the cohort for DR consisted of 8,942 cases and 283,545 controls. Secondary outcomes included eGFR and ACR in individuals with diabetes and PDR. The genetic association study data for eGFR in individuals with diabetes was obtained from the study by Pattaro et al. published in 2016, which consisted of 39 studies and a total of 55,114 individuals with diabetes. eGFR was calculated using the four-variable Modification of Diet in Renal Disease Study Equation (32). The genetic association study data for ACR in 5,825 individuals with diabetes and 46061 controls was obtained from the study by Teumer et al. published in 2016, and ACR was calculated as the ratio of urinary albumin to urinary creatinine to account for variations in urine concentration (33). The genetic association study cohort for PDR was also obtained from the Finngen database, consisting of 8,383 cases and 329,756 controls (31).
Mendelian randomization analysis
In this study, the MR analysis tool was utilized to determine the causal relationship between thyroid function and various outcome indicators. SNPs were used as instrumental variables to estimate the causal effect. To ensure the validity of the results, three core assumptions were made: first, the genetic variations were associated with exposure factors; second, the genetic variations were independent of confounding factors; and third, the genetic variations only had an effect on the outcome through the exposure and not through any other pathways (Figure 1). To obtain the primary overall instrumental estimate, an Inverse-Variance Weighted Fixed-Effects MR method was employed, which considered all genetic variants as valid instruments without any pleiotropy. The individual instrumental estimates and their standard errors were then combined using the Inverse-Variance Weighted (IVW) method to produce the final MR results (34). In order to mitigate the impact of horizontal pleiotropy, where genetic variation has a significant effect on results via pathways other than exposure, the current study utilized three statistical methods: IVW random-effects (IVW-RE), weighted median (WM), and MR-Egger methods (35, 36). To ensure robust results, a range of sensitivity analyses were conducted, including heterogeneity tests, horizontal pleiotropy tests, funnel plot analysis, and a leave-1-variant-out analysis using the IVW-RE method, where one variable was excluded from the analysis in each iteration. The individual instrumental variables were analyzed using the Instrumental Variable Ratio (Wald) estimator.
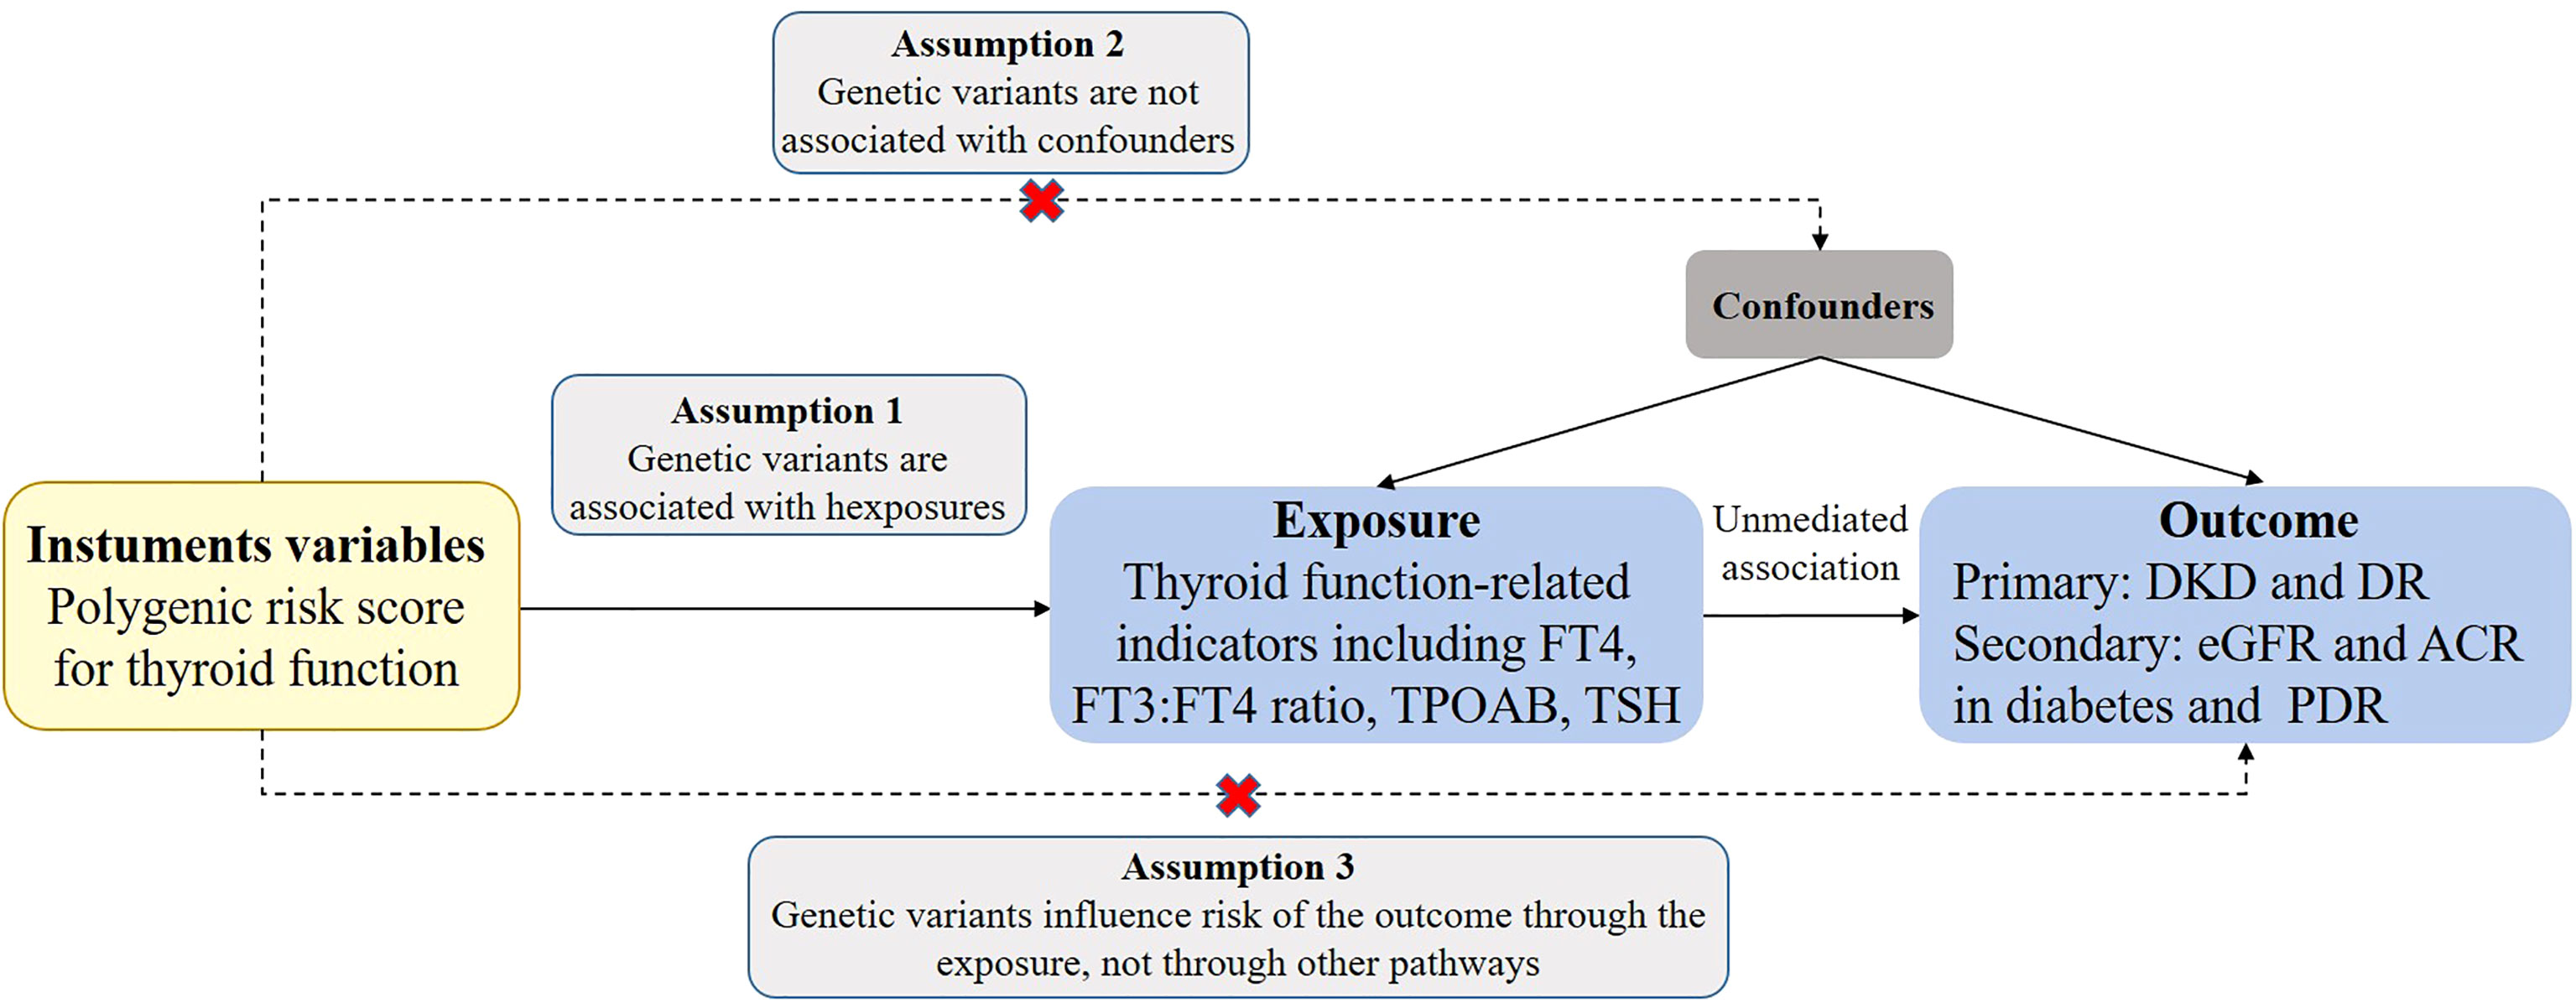
Figure 1 Assumptions of a Mendelian randomization analysis for thyroid function and risk of DKD and DR. Broken lines represent potential pleiotropic or direct causal effects between variables that would violate Mendelian randomization assumptions. FT4, free thyroxine; FT3, free triiodothyronine; TSH, thyroid-stimulating hormone; TPOAB, thyroid peroxidase antibodies; DKD, diabetic kidney disease; DR, diabetic retinopathy; PDR, proliferative diabetic retinopathy; eGFR, estimated glomerular filtration rate; ACR, urinary albumin-to-creatinine ratio.
In this study, the strength of all instruments was evaluated using the F statistic (calculated as F = β2 exposure/SE2 exposure). This approach was taken to ensure that weak instrumental variables do not influence the results of the causal estimation. The results showed that there were no weak instrumental variables in the study, as the F-statistic ranges for FT4, TSH, TPOAB and FT3:FT4ratio tools were 29-394, 29-576, 10-19, and 21, respectively. To check for the presence of pleiotropy, several sensitivity analyses were performed. The Q statistics (Cochran’s Q for IVW and Rücker’s Q for MR-Egger) were calculated to assess heterogeneity in individual causal effects, with p-values less than 0.05 indicating the presence of heterogeneity (37). The MR-Egger intercept term was used to evaluate horizontal pleiotropy, and a deviation from zero indicates directional pleiotropy. The slope of the MR-Egger regression was used to provide a valid MR estimate in the presence of horizontal multiplicity (38, 39). A complementary weighted median method was also employed, which assumes that at least 50% of the inverse-variance is valid and ranks the inverse of the weighted variance of MR estimates for each inverse-variance (34). The MR pleiotropy residual sum and outlier (MR-PRESSO) outlier test was performed to correct for horizontal pleiotropy via outlier removal (40). The effect values are expressed as β when the ending variable is a continuous variable and as odds ratio (OR) when it is a dichotomous variable.
Results
MR estimates of causal effects of thyroid function on DKD
Figure 2 demonstrates the MR estimation between thyroid function and DKD. After conditional screening and MR-PRESSO test, we identified 16 of 31 SNPs for FT4 within the reference range, 1 of 1 SNP for FT3:FT4 ratio (the DIO1, rs2235544), 39 of 61SNPs for TSH within the reference range, 4 of 5 SNPs for TPOAB concentration. Genetically predicted TSH was associated with DKD with an IVW-RE OR of 1.44 (95% CI 1.04-2.41; P = 0.033) (Figure 2, eTable 2, eFigure 2A, B in the Supplement) with similar and a more significant result in IVW-FE (OR=1.44, 95% CI, 1.10-1.89; P = 0.009), and the results were similar with the MR-Egger and WM analyses. We did not find a significant risk association between FT4 (OR=0.83, 95% CI 0.67-1.03; P = 0.093) and TPOAB (OR=1.17, 95% CI 0.57-2.38; P = 0.672) in the reference range and DKD (Figure 2, eTable 1, 3, eFigure 1A, B, 3A, B in the Supplement). A genetically predicted 1 SD–increase in FT3:FT4 ratio by the C allele was not associated with increased DKD with an OR of 0.73 (95% CI 0.36-1.46; P =0.371) (Figure 2, eTable 1 in the Supplement). There was some evidence of heterogeneity based on Q-statistic (Q-value IVW = 83.91, P-value = 0.000; Q-value MR-Egger = 57.39, P-value = 0.00) for the TPOAB analysis. Consequently, weights were penalized for the IVW method. The FT4 and TSH variants were distributed symmetrically about the combined effect size in the funnel plot (eFigure 1C, 2C in the Supplement), and MR-Egger did not show evidence of horizontal pleiotropy (FT4: P for MR-Egger = 0.446; TSH: P for MR-Egger = 0.544) (Figure 2). Because TPOAB has fewer relevant instrumental variables, the causal effects of its funnel plot are not symmetric (eFigure 3C in the Supplement). However, the MR-Egger intercept that we performed did not show evidence of horizontal pleiotropy (P for MR-Egger = 0.438) (Figure 2). These results show that no directional pleiotropic effects are present in our study. The leave-one-out test did not identify any thyroid function-related variants that had a strong effect on the overall results (eFigure 1D,2D, 3 in the Supplement).
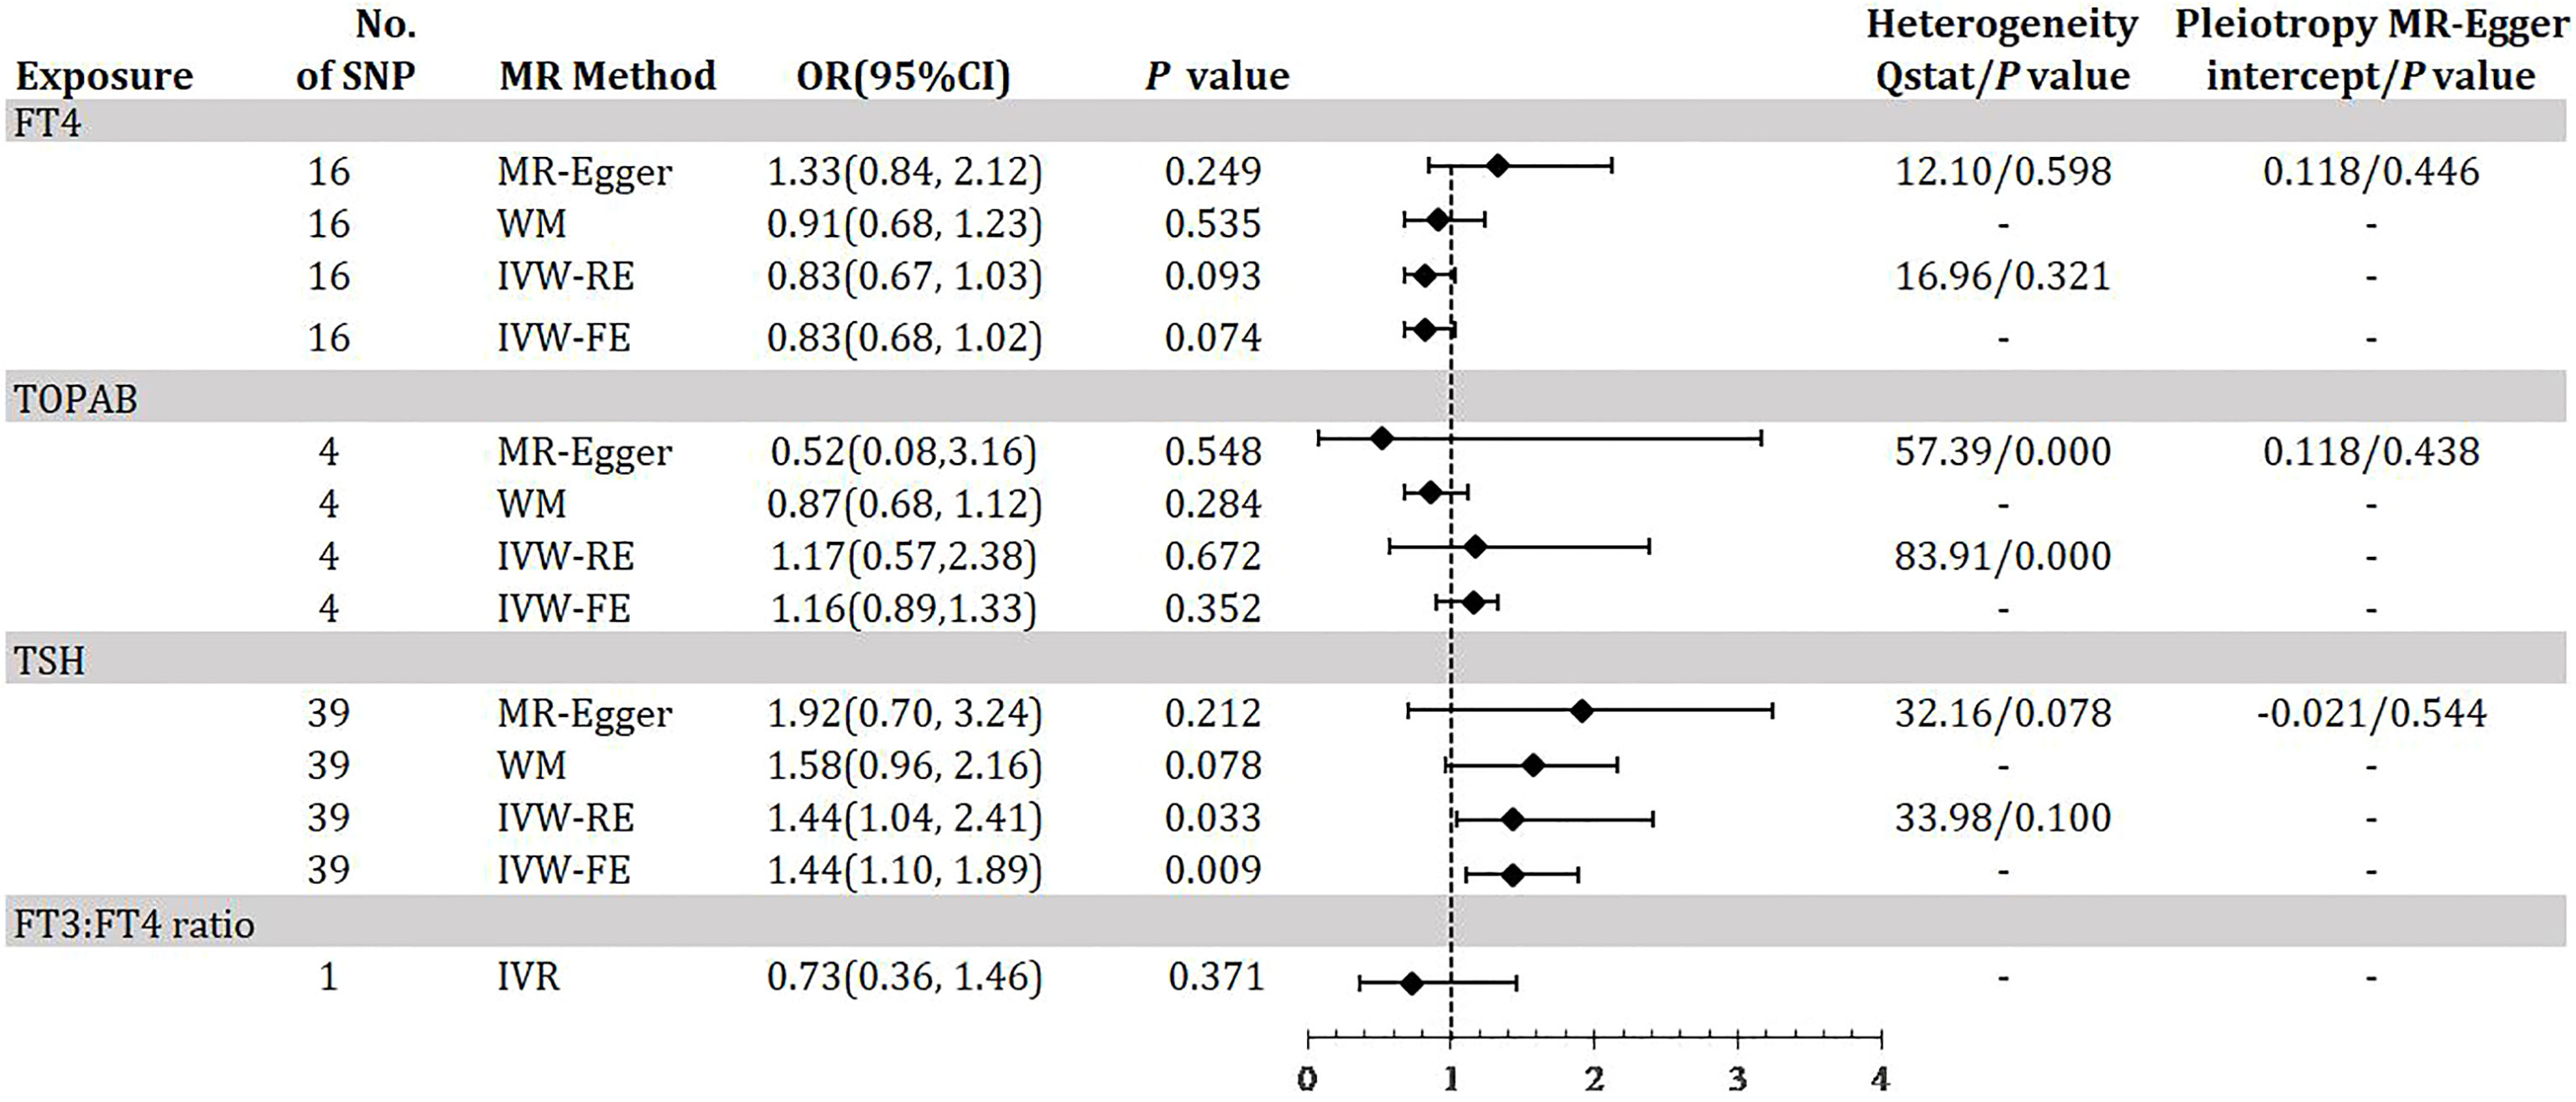
Figure 2 Odds ratio for association of genetically predicted thyroid function with DKD. FT4, free thyroxine; FT4, free thyroxine; FT3, free triiodothyronine; TSH, thyroid-stimulating hormone; TPOAB, thyroid peroxidase antibodies; DKD, diabetic kidney disease; CI, confidence internal; OR, odds ratio; IVW-FE, inverse-variance weighted fixed-effects MR; IVW-RE, inverse-variance weighted random-effects MR; MR, mendelian randomization; WM, weighted median; IVR, instrumental variable ratio (Wald) estimator; SNP, single-nucleotide polymorphism. P value for heterogeneity based on Cochran’s Q statistic for IVW, and Rücker’s Q for MR-Egger.
MR estimates of causal effects of thyroid function on DR
Figure 3 demonstrates the MR estimation between thyroid function and DR. After conditional screening and MR-PRESSO test, we identified 16 of 31 SNPs for FT4within the reference range, 1of1SNP forFT3:FT4 ratio (the DIO1, rs2235544), 37 of 61SNPs for TSH within the reference range, 4 of 5 SNPs for TPOAB concentration. We did not find any statistically significant genetic risk association between thyroid function-related instruments and DR by IVW-RE (FT4: OR=0.95, 95% CI 0.83-1.09; P=0.483; TPOAB: OR=1.11, 95% CI 0.68-1.82; P=0.664; TSH: OR=1.00, 95% CI 0.91-1.07; P=0.828; Figure 3, eTable 4-6, eFigure 4-6, A, B in the Supplement), which is similar to the results of IVW-FE, MR-Egger and WM analyses. A genetically predicted 1 SD–decrease in FT3:FT4 ratio by the C allele was not associated with increased DR with an OR of 1.05 (95% CI, 0.74-1.48; P =0.800) (Figure 2, eTable 4 in the Supplement). There was some evidence of heterogeneity in the analysis regarding FT4 (Q-value IVW = 27.23, P-value = 0.026; Q-value MR-Egger = 26.51, P-value = 0.022) and TPOAB (Q-value IVW = 64.73, P-value = 0.000; Q-value MR-Egger = 45.80, P-value = 0.000) according to Q-statistics. The FT4 and TSH variants were distributed symmetrically about the combined effect size in the funnel plot (eFigure 4C, e5C in the Supplement), and MR-Egger did not show evidence of horizontal pleiotropy (FT4: P for MR-Egger = 0.547; TSH: P for MR-Egger = 0.459) (Figure 3). Because TPOAB has fewer relevant instrumental variables, the causal effects of its funnel plot are not symmetric (eFigure 6C in the Supplement). However, the MR-Egger intercept that we performed did not show evidence of horizontal pleiotropy (P for MR-Egger = 0.903) (Figure 3). These results show that no directional pleiotropic effects are present in DR study. The leave-one-out test did not identify any thyroid function-related variants that had a strong effect on the overall results (eFigure 4D, 5D, 6D in the Supplement).
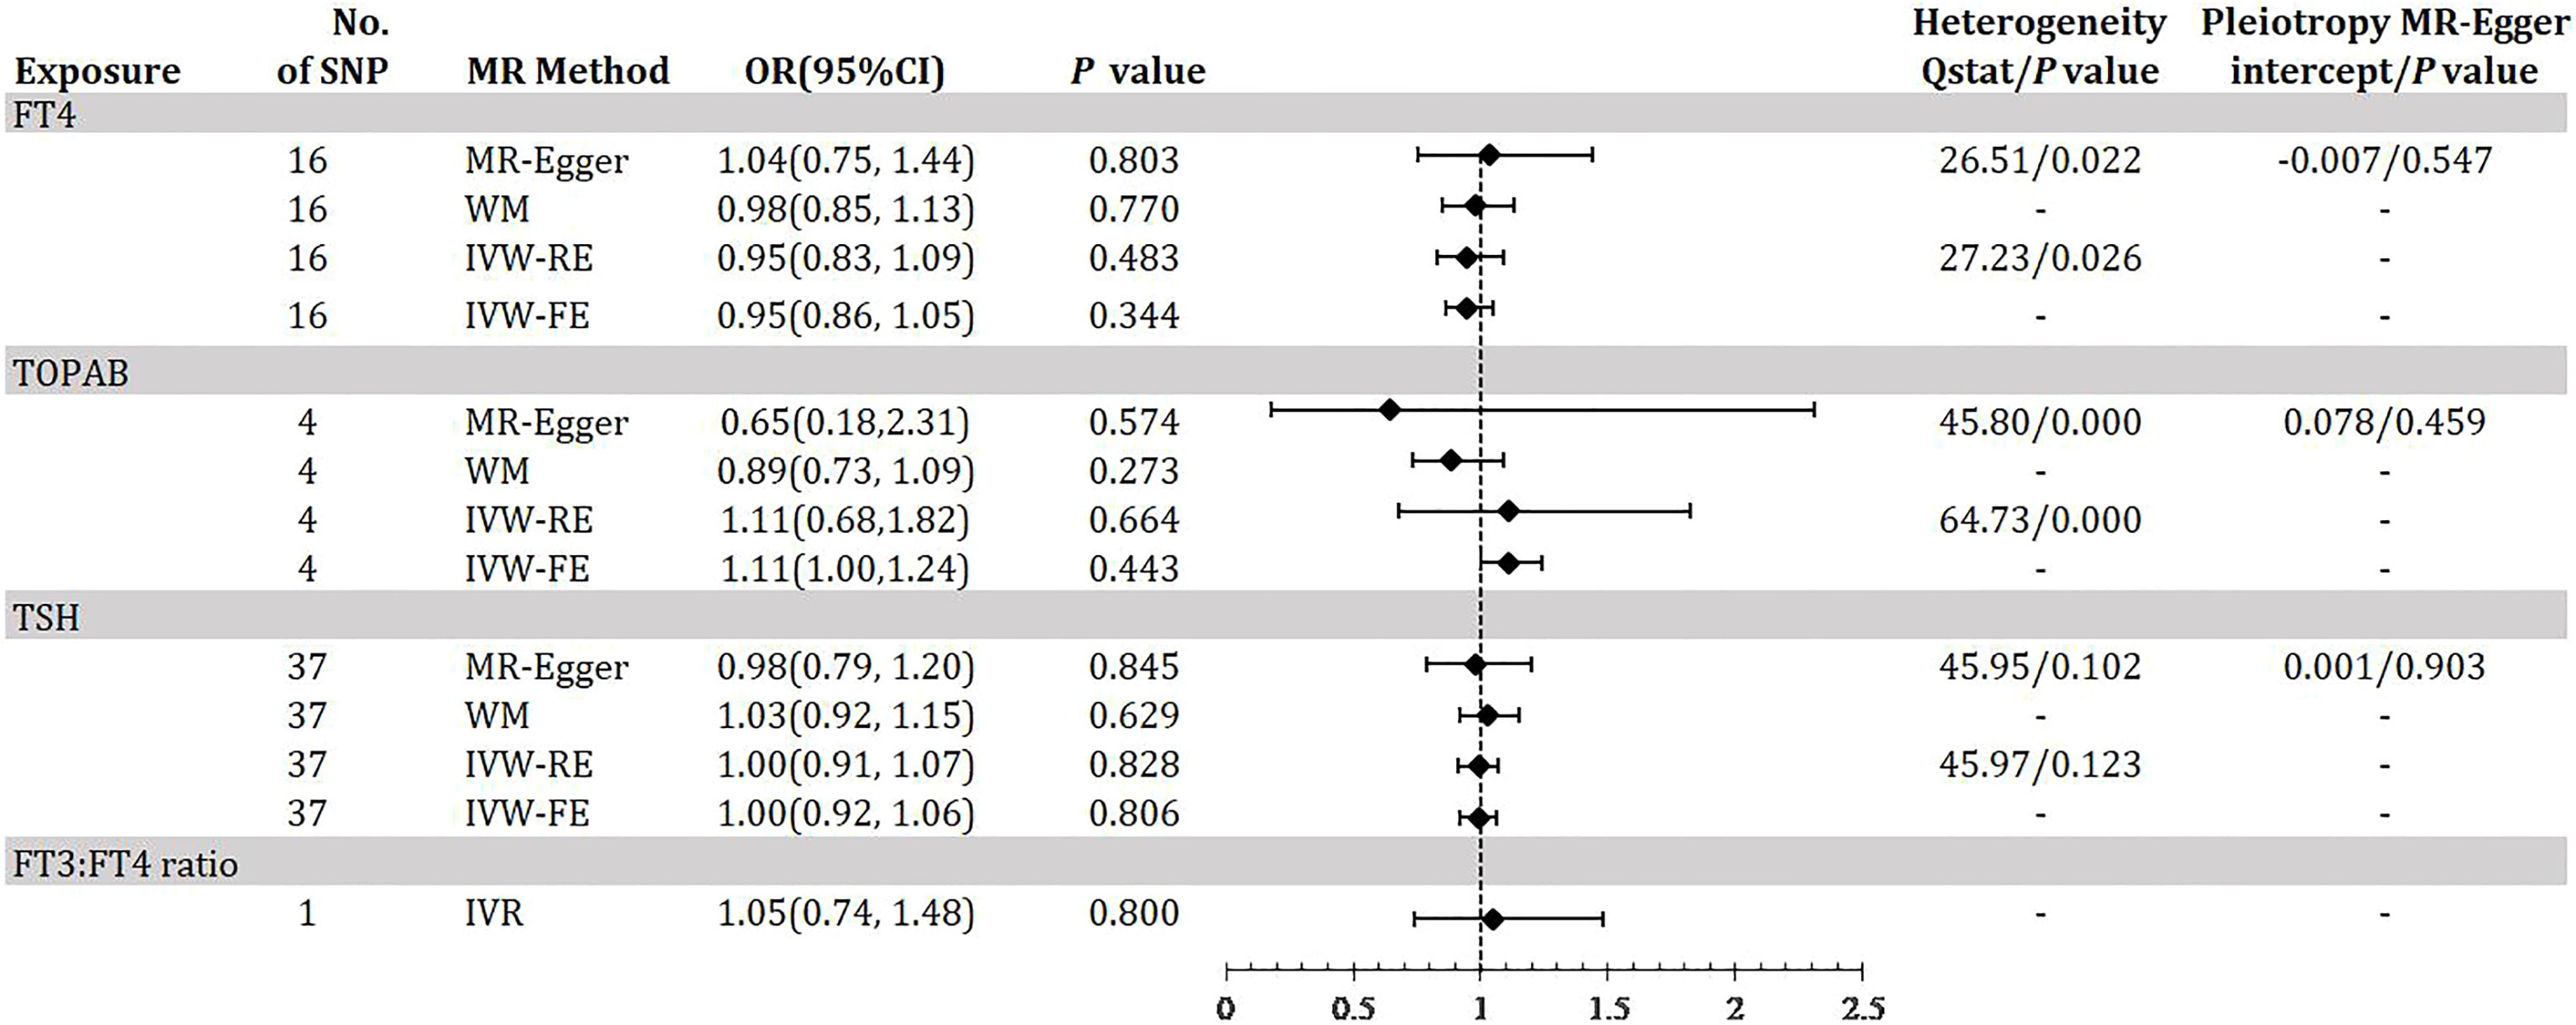
Figure 3 Odds ratio for association of genetically predicted thyroid function with DR. FT4, free thyroxine; FT4, free thyroxine; FT3, free triiodothyronine; TSH, thyroid-stimulating hormone; TPOAB, thyroid peroxidase antibodies; DR, diabetic retinopathy; CI, confidence internal; OR, odds ratio; IVW-FE, inverse-variance weighted fixed-effects MR; IVW-RE, inverse-variance weighted random-effects MR; MR, mendelian randomization; WM, weighted median; IVR, instrumental variable ratio (Wald) estimator; SNP, single-nucleotide polymorphism. P value for heterogeneity based on Cochran’s Q statistic for IVW, and Rücker’s Q for MR-Egger.
MR estimates of causal effects of thyroid function on eGFR and ACR in diabetes
Figure 4 shows the MR estimation between thyroid function and renal impairment indicators eGFR and ACR in diabetic patients to further reflect the genetic association with DKD. After linkage disequilibrium screening and MR-PRESSO assay, we identified a total of 10 out of 31 SNPs for FT4 within the reference range, 1 SNP for FT3:FT4 ratio (DIO1, rs2235544), 19 out of 61 SNPs for TSH in the reference range, and 4 SNPs for TPOAB concentration. We found that IVW-RE genetically predicted TSH was negatively correlated with eGFR, i.e., for 1-sd increase in TSH in the reference range, eGFR decreased by 0.031 (95% CI -0.063, -0.001; P=0.047), a result that was more significant in IVW-FE (Effect: -0.031, 95% CI -0.057, - 0.005; P=0.018) was more significant and similar to the results of WM analysis (Figure 4, eTable 8, eFigure 8A, B in the Supplement). No significant association between other thyroid function predictors and eGFR was found (eTable 7,9, 7 A-B, 9 A-B in the Supplement). The IVW-RE OR for ACR per SD of FT4 within the reference range was -0.078 (95% CI -0.142, -0.014; P = 0.017) (Figure 4, eFigure 10 A-B in the Supplement). Results were similar for IVW-FE (P = 0.015), MR-Egger (P = 0.073) and WM (P = 0.043) analysis. Notably, we found that a 1 SD increase in the FT3:FT4 ratio of the C allele was associated with an increase in ACR with an effect of 0.178 (95% CI, 0.004-0.353; P=0.046), a result consistent with the trend in FT4 results (eTable 10 in the Supplement). There was no evidence of heterogeneity based on Q-statistic for analyses of all thyroid function indicators (P for het >0.05). In our study, we found no evidence of pleiotropy, i.e., the P values for the pleiotropy of FT4, TSH and TPOAB were all greater than 0.05(eFigure 7-12C in the Supplement). The leave-one-out test did not identify any thyroid function-related variants that had a strong effect on the overall results (eFigure 7-12D in the Supplement).
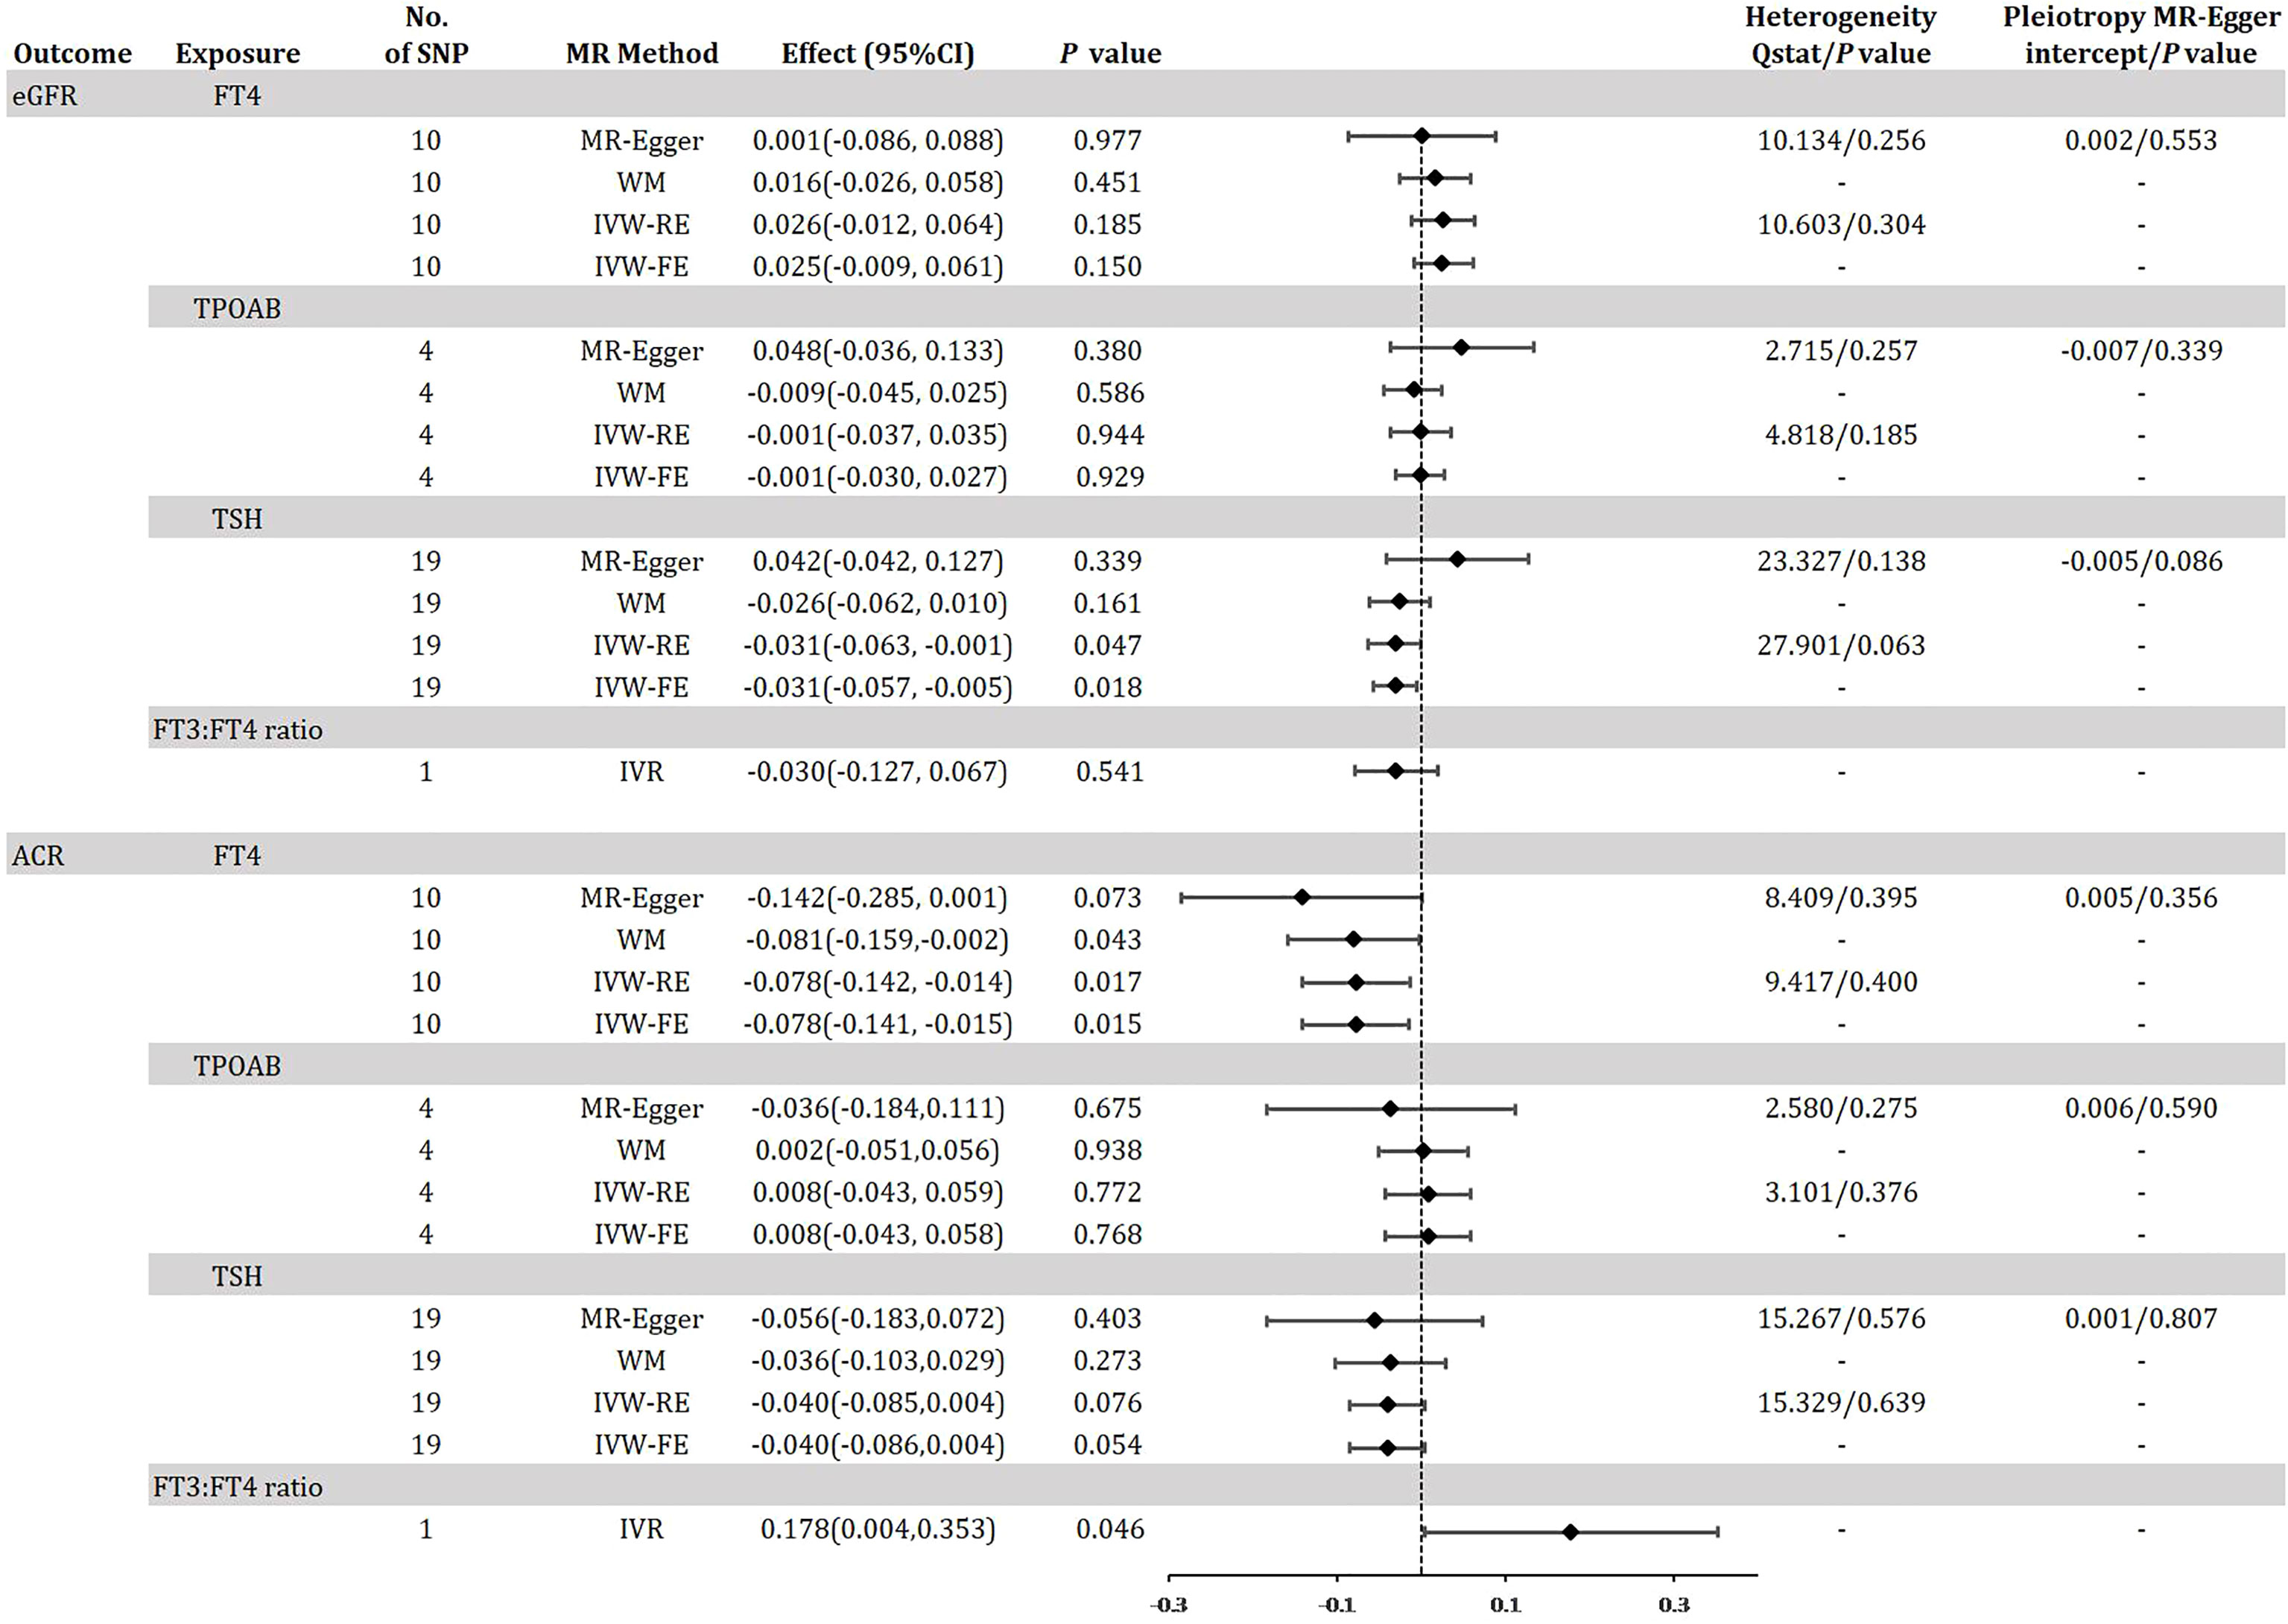
Figure 4 Odds ratio for association of genetically predicted thyroid function with eGFR and ACR in diabetes. FT4, free thyroxine; FT4, free thyroxine; FT3, free triiodothyronine; TSH, thyroid-stimulating hormone; TPOAB, thyroid peroxidase antibodies; eGFR, estimated glomerular filtration rate; ACR, urinary albumin-to-creatinine ratio; CI, confidence internal; OR, odds ratio; IVW-FE, inverse-variance weighted fixed-effects MR; IVW-RE, inverse-variance weighted random-effects MR; MR, mendelian randomization; WM, weighted median; IVR, instrumental variable ratio (Wald) estimator; SNP, single-nucleotide polymorphism. P value for heterogeneity based on Cochran’s Q statistic for IVW, and Rücker’s Q for MR-Egger.
MR estimates of causal effects of thyroid function on PDR
Figure 5 demonstrates the MR estimation between thyroid function and PDR. We did not find any statistically significant genetic risk association between thyroid function-related instruments and DR (eTable13-15, eFigure 13-15A, B in the Supplement). The MR-Egger intercept that we performed did not show evidence of horizontal pleiotropy (C of eFigure 13-15 in the Supplement), and the leave-one-out test did not identify any thyroid function-related variants that had a strong effect on the overall results (D of eFigure 13-15 in the Supplement). These results are similar to the MR analysis of DR.
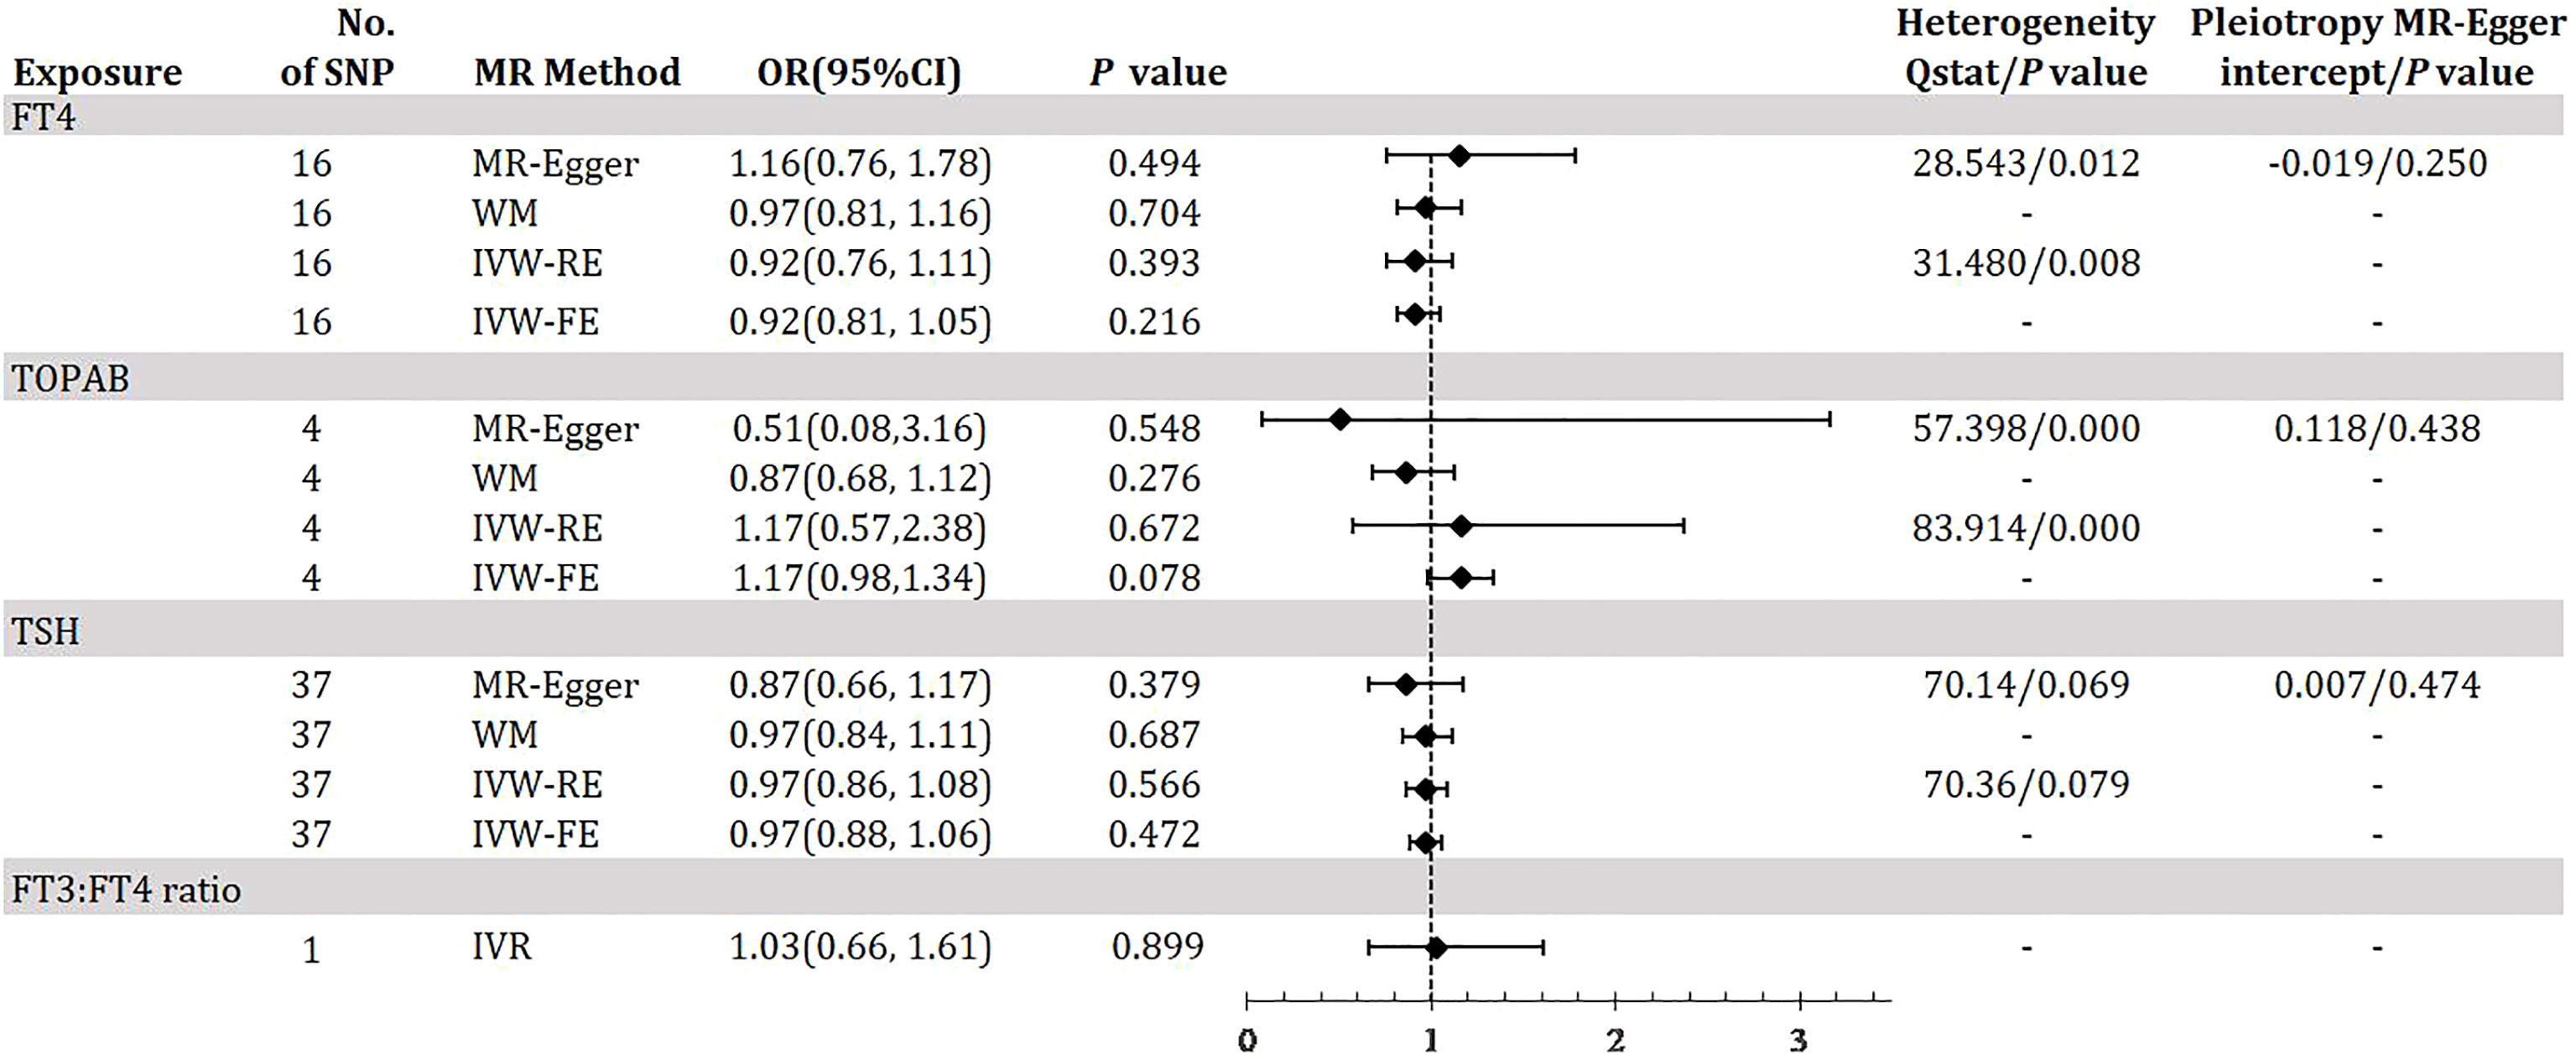
Figure 5 Odds ratio for association of genetically predicted thyroid function with PDR. FT4, free thyroxine; FT4, free thyroxine; FT3, free triiodothyronine; TSH, thyroid-stimulating hormone; TPOAB, thyroid peroxidase antibodies; PDR, proliferative diabetic retinopathy; CI, confidence internal; OR, odds ratio; IVW-FE, inverse-variance weighted fixed-effects MR; IVW-RE, inverse-variance weighted random-effects MR; MR, mendelian randomization; WM, weighted median; IVR, instrumental variable ratio (Wald) estimator; SNP, single-nucleotide polymorphism. P value for heterogeneity based on Cochran’s Q statistic for IVW, and Rücker’s Q for MR-Egger.
Discussion
The current study, to the best of our knowledge, is the first to assess the relationship between thyroid function and diabetic microvascular complications, including DKD and DR, using MR analysis. Using publicly available GWAS data from European populations, we have made a novel finding that there is a potential genetic influence on TSH levels in the normal range that is associated with DKD, a hypothesis that was supported by the evidence in the eGFR. Furthermore, we examined the risk association between genetically determined thyroid function and ACR, and found that both FT4 and FT3:FT4 ratio may be genetic factors that are implicated in ACR. However, the combined genetic effect of all thyroid function indices did not provide strong evidence for a direct association with DR and PDR.
The thyroid-islet-renal axis represents a range of phenotypes that are dependent on phenotypes upstream of the axis and also on negative feedback mechanisms downstream. Both insulin and thyroid hormones are affected by autoimmune pathology, are part of the metabolic syndrome, and affect cellular metabolism. The pathophysiological association between diabetes and thyroid dysfunction is thought to be the result of the interaction of various biochemical, genetic and hormonal dysfunctions (41). As the most important microvascular complication of diabetes, the association between DKD and thyroid function is increasingly being demonstrated. We derived the presence of a genetic-based effect of thyroxine on DKD through multiple MR stratification analyses, based on unique and shared genetic tools, which is qualitatively different from extant epidemiological studies. Our study found that TSH levels in the reference range were positively associated with DKD risk and negatively associated with eGFR, i.e., elevated TSH may increase the risk of developing DKD as well as decrease eGFR. This result was confirmed in several observational studies. Renal function is directly correlated with thyroid function, as reflected by the positive correlation between TSH and serum creatinine and the negative correlation with eGFR (42, 43). Even when thyroid function is within the normal range, patients with DKD have higher TSH levels than diabetic patients without DKD (44, 45). A recent study reconfirmed that levothyroxine treatment reduced urinary albumin excretion in patients with early DKD with mildly elevated TSH levels and positive serum TPOAB (46) In addition, our study identified a risk association between FT3/FT4 and FT4 and ACR, and although this result was not statistically significant in DKD events and eGFR, the effect values showed a reliable and consistent trend. FT4 SNPs were derived from associations between individuals with FT4 levels in the reference range and no evidence of thyroid disease. In contrast, TSH instrumentation within the reference range is associated with hypothyroidism and hyperthyroidism. These differences may emphasize that normal variation in TSH and thyroid function drives the association of instrumentation with DKD. Another possible explanation is that although ACR and eGFR are the most commonly used clinical tools to assess chronic kidney disease, one study found no correlation between serum creatinine and ACR in patients with T2DM (47), so the association between thyroid function and them is informative but not determinative for the risk of DKD events. Clinical evidence found reduced FT4 and elevated TSH in the DKD population compared to non-DKD patients, and hypothyroidism was associated with increased ACR or reduced eGFR in patients with T2DM, and hypothyroid patients with T2DM exhibited higher ACR and urinary transferrin excretion (48), which is consistent with our results. The relationship between FT3:FT4 and DKD is unclear, but studies are currently being conducted in other areas related to diabetes. For example, a recent report from southern China found that low FT3/FT4 was associated with a poor prognosis of acute myocardial infarction in T2DM patients with normal thyroid function (49). Another MR study showed that genetically based high FT3/FT4 was associated with an increased risk of atrial fibrillation (12). In addition, a Belgian report showed that FT3:FT4 in late pregnancy was positively associated with gestational diabetes, adverse pregnancy outcomes and poor metabolic profile in the early postpartum period (7).
In our present study no correlation between thyroid hormones and DR was found, despite our stratification of DR. There is conflicting evidence regarding the association between DR and thyroid function (50–52), with some studies suggesting no significant association while others indicating a possible link. A decrease in thyroid hormone or SCH may increase the probability of DR, PDR, and diabetic macular edema (53–55). Lin et al. first retrospectively found that high TSH serum levels were associated with an increased prevalence of DR in diabetic patients, and then found in vitro that high glucose stimulated apoptosis and mitochondrial dysfunction in human peripapillary cells, which could be attributed to co-stimulation of glucose and high TSH (56). These studies supporting the association of thyroid function with DR are based on Asian populations, whereas our study was conducted in a European population. Clinical observational studies are difficult to control for confounders and multiple biases making it difficult to derive a direct causal association between exposure and outcome, therefore the relationship between thyroid function and DR needs to be further demonstrated in larger well-designed trials.
The pathogenesis of abnormal thyroid function is associated with endothelial dysfunction, hyperlipidemia and atherosclerosis (57–61), which can increase the risk of diabetes and its complications (62, 63). Diabetes often leads to hyperlipidemia, which increases the risk of atherosclerotic vascular disease, characterized by arterial lesions affected from the intima, usually preceded by accumulation of lipids and complex sugars, hemorrhage and thrombosis, followed by fibrous tissue proliferation and calcium deposition, as well as progressive chemosis and calcification of the arterial middle layer, leading to thickening and sclerosis of the arterial wall and narrowing of the lumen (64, 65). DKD and DR are common result of hyperglycemia-induced accumulation of AGEs, which is inextricably linked to microangiopathy (66, 67). Abnormal thyroid hormone secretion not only directly disrupts endothelial function, but also exacerbates the damage to endothelial cells by the hyperglycemic state, thus contributing to the development of DKD and DR. In addition, abnormal thyroid hormone secretion decreases endothelial nitric oxide availability, which further promotes microvascular damage in diabetic patients (68, 69). Thus, thyroid hormones protect the endothelium of diabetic microvessels from degeneration, which may be reliable evidence to support our main results.
This study exhibits several strengths that warrant investigation. Firstly, the research employed MR methods to evaluate gene-based causality of FT4, TSH, TPOAB, and FT3:FT4 in DKD and DR. MR analysis provides a robust estimate of causality by minimizing reverse causal effects or confounding factors. Secondly, the study used eGFR and ACR as indicators for DKD evaluation, which strengthens the causal relationship between thyroid function and renal function in diabetic patients. Thirdly, the two-sample MR approach was utilized to assess the genetic association between thyroid function and diabetic microvascular complications from various perspectives. Fourthly, the study used multiple sensitivity analyses, such as the simple median, weighted median, and MR-Egger methods, to ensure consistent and robust causal estimation. Finally, the aggregated statistics of the GWAS were collected from European populations, providing a larger sample size than epidemiological studies, and suggesting a more reliable cause-and-effect relationship. Despite meeting the 3 core assumptions, there are still limitations to our MR study. Unobserved pleiotropy, beyond vertical pleiotropy, may exist. Additionally, the lack of an available FT3 instrument limits causal evidence for a genetic association with DKD and DR. Finally, race-based findings may limit generalizability to other populations. Further clinical studies with larger samples are needed to validate these issues.
In conclusion, our study provides direct evidence supporting that genetically based high TSH levels are associated with low eGFR and high DKD risk in diabetic patients, and that ACR in diabetic patients is negatively correlated with FT4 in the reference range and positively correlated with FT3:FT4. We found no genetic evidence of thyroid function associated with DR. These findings suggest that maintaining normal thyroid function and regulation of thyroid hormone secretion may be effective in preventing microvascular complications in diabetes, particularly DKD. Further larger population-based studies are necessary to investigate the causal relationship between thyroid function and diabetic microangiopathy.
Data availability statement
The original contributions presented in the study are included in the article/Supplementary Material. Further inquiries can be directed to the corresponding author.
Author contributions
HL and ML conceived and designed the study. SD and AD performed the initial data source acquisition. HL examined the data and performed the data analysis. SZ made methodological recommendations for the article. HL wrote the initial manuscript and MZ checked the manuscript and approved the final manuscript. All listed authors made substantial contributions to the manuscript. All authors contributed to the article and approved the submitted version.
Funding
This work was supported by National Natural Science Foundation of China (No. 82074242). MZ is the project leader.
Acknowledgments
Special thanks to the National Natural Science Foundation of China for providing us with funding and support for this study.
Conflict of interest
The authors declare that the research was conducted in the absence of any commercial or financial relationships that could be construed as a potential conflict of interest.
Publisher’s note
All claims expressed in this article are solely those of the authors and do not necessarily represent those of their affiliated organizations, or those of the publisher, the editors and the reviewers. Any product that may be evaluated in this article, or claim that may be made by its manufacturer, is not guaranteed or endorsed by the publisher.
Supplementary material
The Supplementary Material for this article can be found online at: https://www.frontiersin.org/articles/10.3389/fendo.2023.1126339/full#supplementary-material
References
1. Harding JL, Pavkov ME, Magliano DJ, Shaw JE, Gregg EW. Global trends in diabetes complications: A review of current evidence. Diabetologia. (2019) 62(1):3–16. doi: 10.1007/s00125-018-4711-2
2. Saran R, Li Y, Robinson B, Ayanian J, Balkrishnan R, Bragg-Gresham J, et al. US Renal data system 2014 annual data report: Epidemiology of kidney disease in the united states. Am J Kidney Dis (2015) 66(1 Suppl 1):S1–305. doi: 10.1053/j.ajkd.2015.05.001
3. Ahmad J. Management of diabetic nephropathy: Recent progress and future perspective. Diabetes Metab Syndr (2015) 9(4):343–58. doi: 10.1016/j.dsx.2015.02.008
4. Bourne RRA, Flaxman SR, Braithwaite T, Cicinelli MV, Das A, Jonas JB, et al. Magnitude, temporal trends, and projections of the global prevalence of blindness and distance and near vision impairment:a systematic review and meta-analysis. Lancet Glob Health (2017) 5(9):e888–97. doi: 10.1016/S2214-109X(17)30293-0
5. Wautier JL, Wautier MP, Schmidt AM, Anderson GM, Hori O, Zoukourian C, et al. Advanced glycation end products (AGEs) on the surface of diabetic erythrocytes bind to the vessel wall via a specific receptor inducing oxidant stress in the vasculature: a link between surface-associated AGEs and diabetic complications. Proc Natl Acad Sci U S A. (1994) 91(16):7742–6. doi: 10.1073/pnas.91.16.7742
6. Schmidt AM, Hasu M, Popov D, Zhang JH, Chen J, Yan SD, et al. Receptor for advanced glycation end products (AGEs) has a central role in vessel wall interactions and gene activation in response to circulating AGE proteins. Proc Natl Acad Sci U S A. (1994) 91(19):8807–11. doi: 10.1073/pnas.91.19.8807
7. Raets L, Minschart C, Van den Bruel A, Van den Bogaert E, Van Crombrugge P, Moyson C, et al. Higher thyroid fT3-to-fT4 ratio is associated with gestational diabetes mellitus and adverse pregnancy outcomes. J Clin Med (2022) 11(17):5016. doi: 10.3390/jcm11175016
8. Alwan H, Villoz F, Feller M, Dullaart RPF, Bakker SJL, Peeters RP, et al. Subclinical thyroid dysfunction and incident diabetes: a systematic review and an individual participant data analysis of prospective cohort studies. Eur J Endocrinol (2022) 187(5):S35–46. doi: 10.1530/EJE-22-0523
9. Lee S, Lim Y, Kang Y, Jung K, Jee S. The association between blood concentrations of PCDD/DFs, DL-PCBs and the risk of type 2 diabetes mellitus and thyroid cancer in south Korea. Int J Environ Res Public Health (2022) 19(14):8745. doi: 10.3390/ijerph19148745
10. Jabbar A, Pingitore A, Pearce SH, Zaman A, Iervasi G, Razvi S. Thyroid hormones and cardiovascular disease. Nat Rev Cardiol (2017) 14(1):39–55. doi: 10.1038/nrcardio.2016.174
11. Chen X, Zhou Y, Zhou M, Yin Q, Wang S. Diagnostic values of free triiodothyronine and free thyroxine and the ratio of free triiodothyronine to free thyroxine in thyrotoxicosis. Int J Endocrinol (2018) 2018:4836736. doi: 10.1155/2018/4836736
12. Ellervik C, Roselli C, Christophersen IE, Alonso A, Pietzner M, Sitlani CM, et al. Assessment of the relationship between genetic determinants of thyroid function and atrial fibrillation: A mendelian randomization study. JAMA Cardiol (2019) 4(2):144–52. doi: 10.1001/jamacardio.2018.4635
13. Mansournia N, Riyahi S, Tofangchiha S, Mansournia MA, Riahi M, Heidari Z, et al. Subclinical hypothyroidism and diabetic nephropathy in Iranian patients with type 2 diabetes. J Endocrinol Invest. (2017) 40(3):289–95. doi: 10.1007/s40618-016-0560-3
14. Wang J, Li H, Tan M, Gao G, Zhang Y, Ding B, et al. Association between thyroid function and diabetic nephropathy in euthyroid subjects with type 2 diabetes mellitus: a cross-sectional study in China. Oncotarget (2019) 10(2):88–97. doi: 10.18632/oncotarget.26265
15. Zhao W, Li X, Liu X, Lu L, Gao Z. Thyroid function in patients with type 2 diabetes mellitus and diabetic nephropathy: A single center study. J Thyroid Res (2018) 2018:9507028. doi: 10.1155/2018/9507028
16. Fei X, Xing M, Wo M, Wang H, Yuan W, Huang Q. Thyroid stimulating hormone and free triiodothyronine are valuable predictors for diabetic nephropathy in patient with type 2 diabetes mellitus. Ann Transl Med (2018) 6(15):305. doi: 10.21037/atm.2018.07.07
17. Martino E, Seo H, Lernmark A, Refetoff S. Ontogenetic patterns of thyrotropin-releasing hormone-like material in rat hypothalamus, pancreas, and retina: selective effect of light deprivation. Proc Natl Acad Sci U S A. (1980) 77(7):4345–8. doi: 10.1073/pnas.77.7.4345
18. Mendoza A, Hollenberg AN. New insights into thyroid hormone action. Pharmacol Ther (2017) 173:135–45. doi: 10.1016/j.pharmthera.2017.02.012
19. Zou J, Li Z, Tian F, Zhang Y, Xu C, Zhai J, et al. Association between normal thyroid hormones and diabetic retinopathy in patients with type 2 diabetes. BioMed Res Int (2020) 2020:8161797. doi: 10.1155/2020/8161797
20. Schneider T, Meyerson L. Thyroid therapy in diabetic retinopathy. S Afr Med J (1969) 43(14):414–7.
21. Lin W, Luo Y, Liu F, Li H, Wang Q, Dong Z, et al. Status and trends of the association between diabetic nephropathy and diabetic retinopathy from 2000 to 2021: Bibliometric and visual analysis. Front Pharmacol (2022) 13:937759. doi: 10.3389/fphar.2022.937759
22. Gopinath NPR, Hafeez M, An R. To study the incidence of diabetic retinopathy in different stages of diabetic nephropathy in type 2 diabetes mellitus. J Assoc Physicians India. (2022) 70(4):11–2.
23. Jonas JB, Wang YX, Wei WB, Xu J, You QS, Xu L. Chronic kidney disease and eye diseases: The Beijing eye study. Ophthalmology (2017) 124(10):1566–9. doi: 10.1016/j.ophtha.2017.04.024
24. Lawlor DA, Harbord RM, Sterne JA, Timpson N, Davey Smith G. Mendelian randomization: using genes as instruments for making causal inferences in epidemiology. Stat Med (2008) 27(8):1133–63. doi: 10.1002/sim.3034
25. Teumer A, Chaker L, Groeneweg S, Li Y, Di Munno C, Barbieri C, et al. Genome-wide analyses identify a role for SLC17A4 and AADAT in thyroid hormone regulation. Nat Commun (2018) 9(1):4455. doi: 10.1038/s41467-018-06356-1
26. Panicker V, Cluett C, Shields B, Murray A, Parnell KS, Perry JR, et al. A common variation in deiodinase 1 gene DIO1 is associated with the relative levels of free thyroxine and triiodothyronine. J Clin Endocrinol Metab (2008) 93(8):3075–81. doi: 10.1210/jc.2008-0397
27. Eriksson N, Tung JY, Kiefer AK, Hinds DA, Francke U, Mountain JL, et al. Novel associations for hypothyroidism include known autoimmune risk loci. PloS One (2012) 7(4):e34442. doi: 10.1371/journal.pone.0034442
28. Pickrell JK, Berisa T, Liu JZ, Ségurel L, Tung JY, Hinds DA. Detection and interpretation of shared genetic influences on 42 human traits. Nat Genet (2016) 48(7):709–17. doi: 10.1038/ng.3570
29. Schultheiss UT, Teumer A, Medici M, Li Y, Daya N, Chaker L, et al. A genetic risk score for thyroid peroxidase antibodies associates with clinical thyroid disease in community-based populations. J Clin Endocrinol Metab (2015) 100(5):E799–8072014–4352. doi: 10.1210/jc
30. Medici M, Porcu E, Pistis G, Teumer A, Brown SJ, Jensen RA, et al. Identification of novel genetic loci associated with thyroid peroxidase antibodies and clinical thyroid disease. PloS Genet (2014) 10(2):e1004123. doi: 10.1371/journal.pgen.1004123
31. Kurki MI, Karjalainen J, Palta P, Sipila TP, Kristiansson K, Donner K, et al. FinnGen: Unique genetic insights from combining isolated population and national health register data. medRxiv (2022) 03:3.22271360. doi: 10.1101/2022.03.03.22271360
32. Pattaro C, Teumer A, Gorski M, Chu AY, Li M, Mijatovic V, et al. Genetic associations at 53 loci highlight cell types and biological pathways relevant for kidney function. Nat Commun (2016) 7:10023. doi: 10.1038/ncomms10023
33. Teumer A, Tin A, Sorice R, Gorski M, Yeo NC, Chu AY, et al. Genome-wide association studies identify genetic loci associated with albuminuria in diabetes. Diabetes (2016) 65(3):803–17. doi: 10.2337/db15-1313
34. Bowden J, Davey Smith G, Haycock PC, Burgess S. Consistent estimation in mendelian randomization with some invalid instruments using a weighted median estimator. Genet Epidemiol. (2016) 40(4):304–14. doi: 10.1002/gepi.21965
35. Burgess S, Butterworth A, Thompson SG. Mendelian randomization analysis with multiple genetic variants using summarized data. Genet Epidemiol. (2013) 37(7):658–65. doi: 10.1002/gepi.21758
36. Tan JS, Liu NN, Guo TT, Hu S, Hua L. Genetically predicted obesity and risk of deep vein thrombosis. Thromb Res (2021) 207:16–24. doi: 10.1016/j.thromres.2021.08.026
37. Burgess S, Bowden J, Dudbridge F, Thompson SG. Robust instrumental variable methods using multiple candidate instruments with application to mendelian randomization. arXiv: Method (2016) 18(8):4865–78. doi: 10.48550/arXiv.1606.03729
38. Bowden J, Davey Smith G, Burgess S. Mendelian randomization with invalid instruments: effect estimation and bias detection through egger regression. Int J Epidemiol. (2015) 44(2):512–25. doi: 10.1093/ije/dyv080
39. Burgess S, Thompson SG. Interpreting findings from mendelian randomization using the MR-egger method. Eur J Epidemiol. (2017) 32(5):377–89. doi: 10.1007/s10654-017-0255-x
40. Verbanck M, Chen CY, Neale B, Do R. Detection of widespread horizontal pleiotropy in causal relationships inferred from mendelian randomization between complex traits and diseases. Nat Genet (2018) 50(5):693–8. doi: 10.1038/s41588-018-0099-7
41. Kalra S, Aggarwal S, Khandelwal D. Thyroid dysfunction and type 2 diabetes mellitus: Screening strategies and implications for management. Diabetes Ther (2019) 10(6):2035–44. doi: 10.1007/s13300-019-00700-4
42. Alsulami MO, Alharbi NM, Alsulami DW, Almaghrabi SJ, Albaradei HA, Alhozali AM. Association between blood pressure, glomerular filtration rate, and serum thyroid-stimulating hormone levels in hypothyroid patients: A retrospective single-center study. Cureus (2022) 14(9):e28686. doi: 10.7759/cureus.28686
43. Boruah P, Baruah A, Barman B, Nath C, Hajong R, Naku N. A study to evaluate the association between thyroid function and serum potassium level in diagnosed cases of diabetic nephropathy. Cureus (2021) 13(10):e18569. doi: 10.7759/cureus.18569
44. Rai S, Kumar JA, Prajna K, SK S, Rai T, Shrinidhi, et al. Thyroid function in type 2 diabetes mellitus and in diabetic nephropathy. J Clin Diagn Res (2013) 7(8):1583–5. doi: 10.7860/JCDR/2013/6216.3299
45. Keskin H, Cadirci K, Gungor K, Karaaslan T, Usta T, Ozkeskin A, et al. Association between TSH values and GFR levels in euthyroid cases with metabolic syndrome. Int J Endocrinol (2021) 2021:8891972. doi: 10.1155/2021/8891972
46. Liu P, Liu R, Chen X, Chen Y, Wang D, Zhang F, et al. Can levothyroxine treatment reduce urinary albumin excretion rate in patients with early type 2 diabetic nephropathy and subclinical hypothyroidism? A randomized double-blind placebo-controlled study. Curr Med Res Opin (2015) 31(12):2233–40. doi: 10.1185/03007995
47. Demirpence M, Yilmaz H, Colak A, Pamuk BO, Karakoyun I, Basok B. Apelin: A potential novel serum biomarker for early detection of diabetic nephropathy in patients with type 2 diabetes. North Clin Istanb. (2018) 6(2):151–5. doi: 10.14744/nci.2018.62134
48. Zheng M, Wang D, Chen L, Chen MN, Wang W, Ye SD. The association between thyroid dysfunction (TD) and diabetic kidney disease (DKD) in type 2 diabetes mellitus (T2DM). Int J Clin Pract (2019) 11:e13415. doi: 10.1111/ijcp.13415
49. He X, Gao R, Wu Y, Wu K, Sun J, Zhang X, et al. Low FT3/FT4 ratio is linked to poor prognosis of acute myocardial infarction in euthyroid patients with type 2 diabetes mellitus. J Clin Med (2022) 11(21):6530. doi: 10.3390/jcm11216530
50. Chen C, Chen Y, Zhai H, Xia F, Han B, Zhang W, et al. Iodine nutrition status and its association with microvascular complications in urban dwellers with type 2 diabetes. Nutr Metab (Lond). (2020) 17:70. doi: 10.1186/s12986-020-00493-5
51. Qi Q, Zhang QM, Li CJ, Dong RN, Li JJ, Shi JY, et al. Association of thyroid-stimulating hormone levels with microvascular complications in type 2 diabetes patients. Med Sci Monit (2017) 23:2715–20. doi: 10.12659/MSM.902006
52. Gao X, Wang X, Zhong Y, Liu L, Teng W, Shan Z. Serum antithyroglobulin antibody levels are associated with diabetic retinopathy among euthyroid type 2 diabetes patients: A hospital-based, retrospective study. J Diabetes Res (2022) 2022:2552186. doi: 10.1155/2022/2552186
53. Heidari Z, Asadzadeh R. Subclinical hypothyroidism is a risk factor for diabetic retinopathy in patients with type 2 diabetes mellitus. Med J Islam Repub Iran. (2021) 35:186. doi: 10.47176/mjiri.35.186
54. Cao X, Lu M, Xie RR, Song LN, Yang WL, Xin Z, et al. A high TSH level is associated with diabetic macular edema: a cross-sectional study of patients with type 2 diabetes mellitus. Endocr Connect. (2022) 11(7):e220122. doi: 10.1530/EC-22-0122
55. Hu Y, Hu Z, Tang W, Liu W, Wu X, Pan C. Association of thyroid hormone levels with microvascular complications in euthyroid type 2 diabetes mellitus patients. Diabetes Metab Syndr Obes (2022) 15:2467–77. doi: 10.2147/DMSO.S354872
56. Lin D, Qin R, Guo L. Thyroid stimulating hormone aggravates diabetic retinopathy through the mitochondrial apoptotic pathway. J Cell Physiol (2022) 237(1):868–80. doi: 10.1002/jcp.30563
57. Cikim AS, Oflaz H, Ozbey N, Cikim K, Umman S, Meric M, et al. Evaluation of endothelial function in subclinical hypothyroidism and subclinical hyperthyroidism. Thyroid (2004) 14(8):605–9. doi: 10.1089/1050725041692891
58. La Vignera S, Condorelli R, Vicari E, Calogero AE. Endothelial dysfunction and subclinical hypothyroidism: a brief review. J Endocrinol Invest. (2012) 35(1):96–103. doi: 10.3275/8190
59. Garduño-Garcia Jde J, Alvirde-Garcia U, López-Carrasco G, Padilla Mendoza ME, Mehta R, Arellano-Campos O, et al. TSH and free thyroxine concentrations are associated with differing metabolic markers in euthyroid subjects. Eur J Endocrinol (2010) 163(2):273–8. doi: 10.1530/EJE-10-0312
60. Jones DD, May KE, Geraci SA. Subclinical thyroid disease. Am J Med (2020) 123(6):502–4. doi:10.1016/j.amjmed.2009.12.023
61. Caraccio N, Ferrannini E, Monzani F. Lipoprotein profile in subclinical hypothyroidism: response to levothyroxine replacement, a randomized placebo-controlled study. J Clin Endocrinol Metab (2002) 87(4):1533–8. doi: 10.1210/jcem.87.4.8378
62. Chonchol M, Lippi G, Salvagno G, Zoppini G, Muggeo M, Targher G. Prevalence of subclinical hypothyroidism in patients with chronic kidney disease. Clin J Am Soc Nephrol. (2008) 3(5):1296–300. doi: 10.2215/CJN.00800208
63. Perros P, McCrimmon RJ, Shaw G, Frier BM. Frequency of thyroid dysfunction in diabetic patients: value of annual screening. Diabetes Med (1995) 12(7):622–7. doi: 10.1111/j.1464-5491.1995.tb00553.x
64. Athyros VG, Doumas M, Imprialos KP, Stavropoulos K, Georgianou E, Katsimardou A, et al. Diabetes and lipid metabolism. Hormones (Athens). (2018) 17(1):61–7. doi: 10.1007/s42000-018-0014-8
65. Kane JP, Pullinger CR, Goldfine ID, Malloy MJ. Dyslipidemia and diabetes mellitus: Role of lipoprotein species and interrelated pathways of lipid metabolism in diabetes mellitus. Curr Opin Pharmacol (2021) 61:21–7. doi: 10.1016/j.coph.2021.08.013
66. Yamagishi S, Nakamura N, Suematsu M, Kaseda K, Matsui T. Advanced glycation end products: a molecular target for vascular complications in diabetes. Mol Med (2015) 21(Suppl 1):S32–40. doi: 10.2119/molmed
67. Yamagishi S, Maeda S, Matsui T, Ueda S, Fukami K, Okuda S. Role of advanced glycation end products (AGEs) and oxidative stress in vascular complications in diabetes. Biochim Biophys Acta (2012) 1820(5):663–71. doi: 10.1016/j.bbagen.2011.03.014
68. Stefanowicz-Rutkowska MM, Baranowska-Jurkun A, Matuszewski W, Bandurska-Stankiewicz EM. Thyroid dysfunction in patients with diabetic retinopathy. Endokrynol Pol (2020) 71(2):176–83. doi: 10.5603/EP.a2020.0013
69. Vicinanza R, Coppotelli G, Malacrino C, Nardo T, Buchetti B, Lenti L, et al. Oxidized low-density lipoproteins impair endothelial function by inhibiting non-genomic action of thyroid hormone-mediated nitric oxide production in human endothelial cells. Thyroid (2013) 23(2):231–8. doi: 10.1089/thy.2011.0524
Keywords: thyroid function, diabetic kidney disease, diabetic retinopathy, Mendelian randomization, kidney function
Citation: Li H, Li M, Dong S, Zhang S, Dong A and Zhang M (2023) Assessment of the association between genetic factors regulating thyroid function and microvascular complications in diabetes: A two-sample Mendelian randomization study in the European population. Front. Endocrinol. 14:1126339. doi: 10.3389/fendo.2023.1126339
Received: 17 December 2022; Accepted: 15 February 2023;
Published: 28 February 2023.
Edited by:
Pranav Kumar Prabhakar, Lovely Professional University, IndiaReviewed by:
Viktor Kravchenko, National Academy of Sciences of Ukraine, UkraineNiu Rui, Tianjin Eye Hospital, China
Copyright © 2023 Li, Li, Dong, Zhang, Dong and Zhang. This is an open-access article distributed under the terms of the Creative Commons Attribution License (CC BY). The use, distribution or reproduction in other forums is permitted, provided the original author(s) and the copyright owner(s) are credited and that the original publication in this journal is cited, in accordance with accepted academic practice. No use, distribution or reproduction is permitted which does not comply with these terms.
*Correspondence: Mianzhi Zhang, zhangmianzhi@vip.sina.com