 Wenbo Chen1,2†
 Lu Zhang1Guanhui Cai2†Bin Zhang1Zhouyang Lian3Jing Li4†
 Wenjian Wang4,5*
 Yuxian Zhang6*Xiaokai Mo1*
- 1Department of Radiology, The First Affiliated Hospital of Jinan University, Guangzhou, Guangdong, China
- 2Department of Radiology, Huizhou Central People’s Hospital, Huizhou, Guangdong, China
- 3Department of Radiology, Guandong Academy of Medical Sciences/Guangdong Provincial People’s Hospital, Guangzhou, Guangdong, China
- 4Division of Nephrology, Guangdong Academy of Medical Sciences/Guangdong Provincial People’s Hospital, Guangzhou, Guangdong, China
- 5School of Medicine, South China University of Technology, Guangzhou, Guangdong, China
- 6Department of Nuclear Medicine, ZhuJiang Hospital of Southern Medical University, Guangzhou, Guangdong, China
Introduction: Diabetic nephropathy (DN) has become a major public health burden in China. A more stable method is needed to reflect the different stages of renal function impairment. We aimed to determine the possible practicability of machine learning (ML)-based multimodal MRI texture analysis (mMRI-TA) for assessing renal function in DN.
Methods: For this retrospective study, 70 patients (between 1 January 2013 and 1 January 2020) were included and randomly assigned to the training cohort (n1 = 49) and the testing cohort (n2 = 21). According to the estimated glomerular filtration rate (eGFR), patients were assigned into the normal renal function (normal-RF) group, the non-severe renal function impairment (non-sRI) group, and the severe renal function impairment (sRI) group. Based on the largest coronal image of T2WI, the speeded up robust features (SURF) algorithm was used for texture feature extraction. Analysis of variance (ANOVA) and relief and recursive feature elimination (RFE) were applied to select the important features and then support vector machine (SVM), logistic regression (LR), and random forest (RF) algorithms were used for the model construction. The values of area under the curve (AUC) on receiver operating characteristic (ROC) curve analysis were used to assess their performance. The robust T2WI model was selected to construct a multimodal MRI model by combining the measured BOLD (blood oxygenation level-dependent) and diffusion-weighted imaging (DWI) values.
Results: The mMRI-TA model achieved robust and excellent performance in classifying the sRI group, non-sRI group, and normal-RF group, with an AUC of 0.978 (95% confidence interval [CI]: 0.963, 0.993), 0.852 (95% CI: 0.798, 0.902), and 0.972 (95% CI: 0.995, 1.000), respectively, in the training cohort and 0.961 (95% CI: 0.853, 1.000), 0.809 (95% CI: 0.600, 0.980), and 0.850 (95% CI: 0.638, 0.988), respectively, in the testing cohort.
Discussion: The model built from multimodal MRI on DN outperformed other models in assessing renal function and fibrosis. Compared to the single T2WI sequence, mMRI-TA can improve the performance in assessing renal function.
1 Introduction
Diabetic nephropathy (DN) is a serious complication of diabetes that results in renal failure. In recent decades, DN has become a major public health crisis and economic burden for dialysis to keep patients alive in China. The outcome of DN is chronic progressive kidney damage and renal fibrosis. At present, the assessment of renal function on DN mainly relies on the estimated glomerular filtration rate (eGFR). However, serum creatinine can be easily affected by medications or metabolism (1). Moreover, the eGFR increased at the early stage of DN for compensation, and it was easily neglected clinically (2). However, renal function decline and subsequent renal fibrosis in DN are irreversible. The eGFR may be lagged for the exact renal dysfunction in DN. Therefore, a more stable method is needed to reflect the different stages of renal function impairment.
With the development of imaging technology, functional MRI (fMRI), including diffusion-weighted imaging (DWI) and blood oxygenation level–dependent MRI (BOLD), has been used to detect early renal function impairment and assess renal fibrosis (3, 4). BOLD uses endogenous deoxyhemoglobin in the vessel as a contrast to detect MRI signal changes, which can reflect renal hypoxia (5). The higher R2* values suggest more hypoxia in the tissue. Meanwhile, DWI provides information about tissue microarchitecture by evaluating the Brownian motion of water molecules (6–8); tissues with restricted extracellular water content exhibit higher signal intensity in DWI and lower apparent diffusion coefficient (ADC) values (9). The lower ADCs were correlated with renal fibrosis in DN progression. Functional MRIs are stable and non-invasive methods to reflect the pathophysiology of DN, including renal hypoxia in early renal dysfunction and renal fibrosis as disease progression (10). Therefore, fMRIs are good alternative methods for renal function assessment.
Artificial intelligence (AI) is an emerging technology and a current research hotspot that uses software technologies to collect more medical information than the human eyes can. AI has played an important role in medical diagnosis and treatment; it might reduce the number of medical errors and misdiagnoses and possibly increase the quality of patient management (11). Researchers have used AI techniques for detecting lung nodules in patients with complex lung disease (12), segmentation in prostate radiation therapy (13), diagnosis of metastatic lymph nodes in patients with papillary thyroid cancer (14), predicting response of radiotherapy in patients with locally advanced rectal cancer (15), and so on.
Machine learning studies the theory of pattern recognition and computational learning in AI, which focuses on studying huge amounts of data with multiple variables (16). Imaging textures can be extracted to reflect tissue heterogeneity (17–19). Imaging textures have been used in predicting the renal function of the transplanted kidney on T2WI, detecting early renal damage by DTI, and classifying the renal function status on several MRI sequences (20–22). Previous studies have suggested that texture features might be feasible in the assessment of renal dysfunction on functional MRI (22). Generally, the conventional imaging sequence is not well investigated on renal MRI. On the other hand, they did not establish a machine learning-based model to integrate significant imaging textures (20–22). Therefore, we would like to incorporate the conventional T2WI and fMRI to establish a machine learning-based multimodal MRI model to evaluate renal function in DN.
In our study, we aimed to explore the value of machine learning-based texture analysis based on T2WI and integrate the measured BOLD and DWI values to assess renal function in DN.
2 Materials and methods
2.1 Study design
This retrospective study was approved by the local institutional review board of Guangdong Provincial People’s Hospital. Written informed consent was obtained from each participant. A total of 70 patients (between 1 January 2013 and 1 January 2020) diagnosed as DN clinically were eligible for enrollment, and they had undergone mid-abdominal MRI examination. Patients with giant kidney tumor, polycystic kidney, or contraindications of MRI examination (i.e., body habitus incompatible with MRI equipment, presence of ferrous metallic implants, or claustrophobia) were excluded. Serum creatinine was obtained within 7 days of MRI examination and eGFR was calculated by CKD-EPI (chronic kidney disease, Epidemiology Collaboration equations). According to the values of eGFR, patients were divided into normal renal function (normal-RF) with CKD1 (eGFR ≥ 90 ml/min/1.73 m2), non-severe renal function impairment (non-sRI) with CKD2 and CKD3 (30 ml/min/1.73 m2 ≥ eGFR < 90 ml/min/1.73 m2), and severe renal function impairment (sRI) with CKD4 and CKD5 (eGFR < 30 ml/min/1.73 m2). They were randomly assigned to the training cohort (n1 = 49) and testing cohort (n2 = 21).
2.2 MRI protocol
All patients underwent the examination on the 3.0-T whole-body system (Signa EXCITE HD, GE Healthcare, Milwaukee, WI, USA). The protocol of coronal T2WI was as follows: TR/TE = 1,300/80 (ms), field of view = 36.0 (mm2), matrix = 512 × 512, slice thickness = 3.0 mm, flip angle = 90°, and bandwidth = 50.0. The protocol of BOLD was as follows: TR/TE = 112/3–30 (ms), field of view = 36.0 (mm2), matrix = 512 × 512, slice thickness = 3.0 mm, flip angle = 60°, and bandwidth = 50.0. The protocol of DWI was as follows: TR/TE = 2,600/80, field of view = 36.0 (mm2), matrix = 512 × 512, slice thickness = 3.0 mm, and bandwidth = 75.0.
2.3 MRI imaging analysis and model construction
The kidneys were selected and segmented by ITK-SNAP software (https://itk.org/). The largest coronal slice crossing the renal hilum of the renal parenchyma on T2WI was outlined. The speeded up robust features (SURF) algorithm was used for texture feature extraction. The feature selection techniques, namely, ANOVA and relief and recursive feature elimination (RFE), were applied to select the important features. Both imaging features and clinical characteristics including age, gender, and body mass index (BMI) were entered into the support vector machine (SVM), logistic regression (LR), and random forest (RF) algorithms to build a robust T2WI-based model for renal function evaluation. The robust T2WI-based model with best performance was selected to build the multimodal MRI model.
The R2* and ADC values were measured by 12 concentric objective segmentations on the right kidney on BOLD and DWI, respectively (23). Then, we incorporated the T2WI-based model, R2*, and ADCs by the machine learning algorithm to establish a multimodal MRI model for stratifying the renal function. The performance of constructed models was evaluated by area under the curve (AUC) on receiver operating characteristic (ROC) curve analysis on classifying the sRI, non-sRI, and normal renal function groups. The flowchart of building models to classify the renal function status is shown in Figure 1.
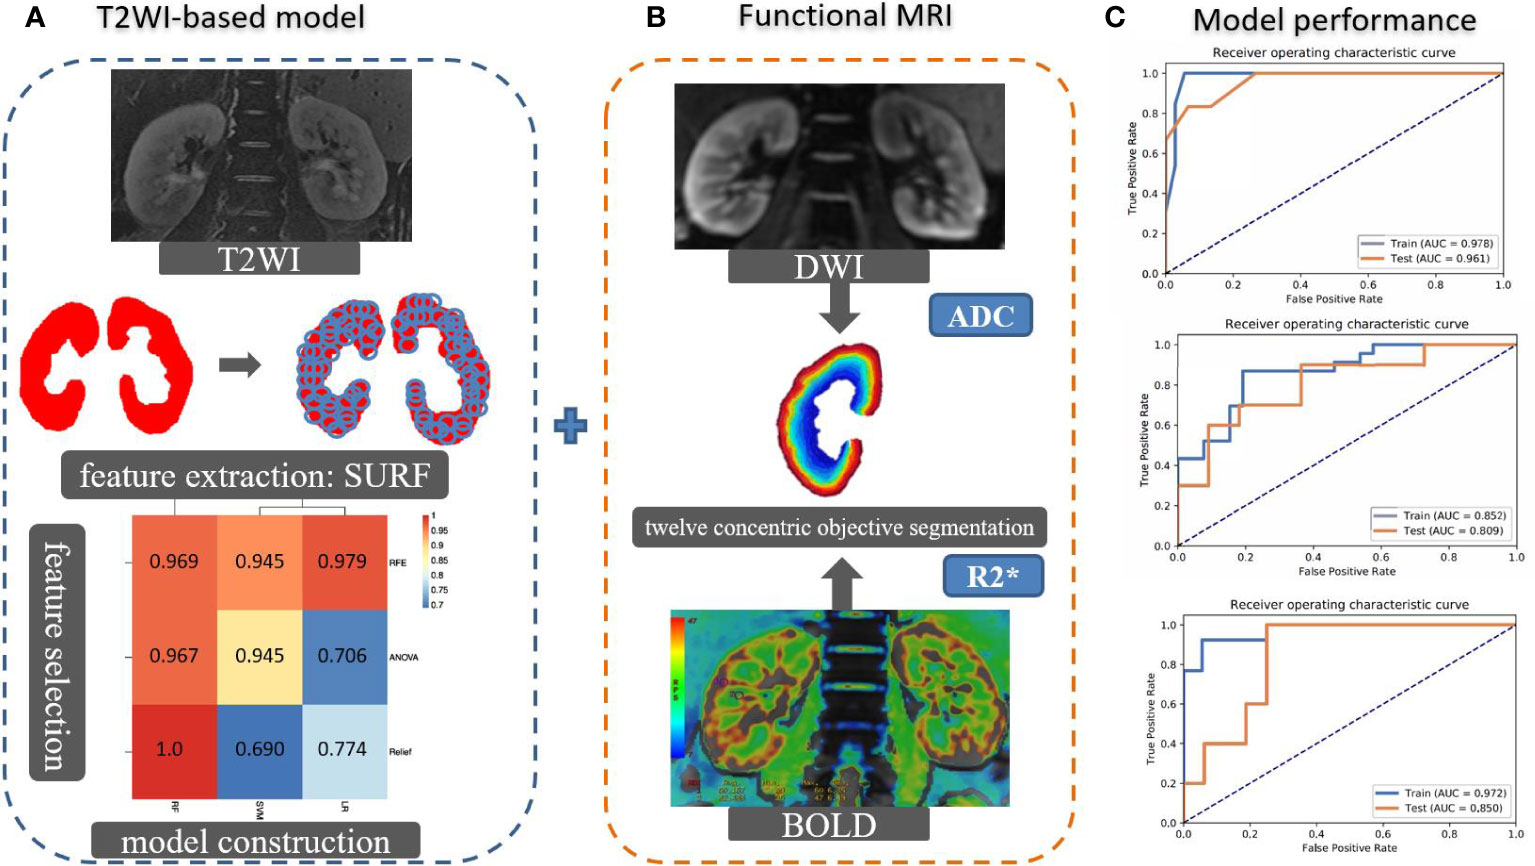
Figure 1 The flowchart of building models to classify the renal function status. (A) The SURF was used for texture feature extraction in the largest coronal slice crossing the renal hilum on T2WI sequence. Several machine learning algorithms were used to select important features and construct models. Imaging features and clinical characteristics were incorporated to build the T2WI-based model. (B) R2* and ADC values were measured by 12 concentric objective segmentations on the right kidney from BOLD and DWI, respectively. The mMRI-TA model was constructed by combining the T2WI-based model, R2*, and ADC values. (C) The ROCs were used to demonstrate the model performance. SURF: speeded up robust features.
2.4 Statistical analysis
The clinical characteristics were compared in the training and testing cohorts, using independent samples t-test, χ2 test, and Wilcoxon rank sum test when appropriate. AUCs were used to evaluate the performance of models. Two-sided p < 0.05 was considered significant. All statistical analyses were implemented in 2018 Python 3.6.5 (https://www.python.org/). The “NumPy” package was used to standardize the intensity range of T2WI. “OpenCV” was applied for image masking, kidney segmentation, and feature extraction. “Scikit-learn” package was used for feature selection (ANOVA, RFE, and Relief) and model construction (SVM, RF, and LR). The ROC curves were plotted by the “matplotlib” package.
2.5 Patient and public involvement
No patients were actively involved in setting the research question and outcome measures, nor were they involved in the design of the study. Patients were not involved in the interpretation or write-up of the results, nor are there plans for the results to be disseminated to the patient community affected by this research.
3 Results
3.1 Patient characteristics
Patients were randomly assigned into a training cohort (n1 = 49) and a testing cohort (n2 = 21). Their age, gender, and BMI were compared. No significant difference in sRI, non-sRI, and normal renal function groups was found between the training and testing cohorts (Table 1).
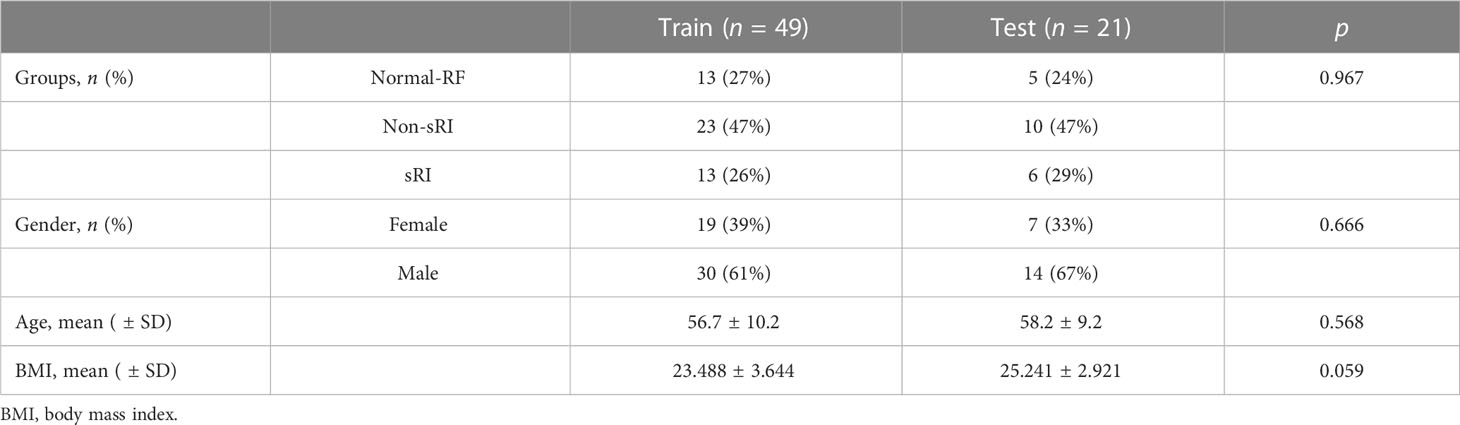
Table 1 The clinical characteristics of training and testing cohorts.
3.2 Performance of the T2WI-based model to identify normal-RF, non-sRI, and sRI
The T2WI-based model showed satisfying performance in identifying non-sRI, sRI, and normal-RF in the training and testing cohorts. ROCs were plotted in Figure 2. Among the three feature selection techniques, ANOVA, Relief, and RFE, and the three machine learning classification algorithms, SVM, LR, and RF, we found that the ANOVA and SVM model showed robust performance in classifying sRI, non-sRI, and normal-RF groups (Table 2). Using the ANOVA+SVM model in identifying the normal-RF group, the AUC was 0.940 (95% confidence interval [CI], 0.902, 0.969) in the training cohort, while it was 0.688 (95% CI, 0.378, 0.947) in the testing cohort. In identifying the non-sRI group, the AUC was 0.883 (95% CI, 0.830, 0.928) and 0.736 (95% CI, 0.455, 0.963), respectively, in the training and testing cohorts. In identifying the sRI group, the AUC showed 0.893 (95% CI, 0.804, 0.926) in the training cohort and 0.733 (95% CI, 0.513, 0.947) in the testing cohort.
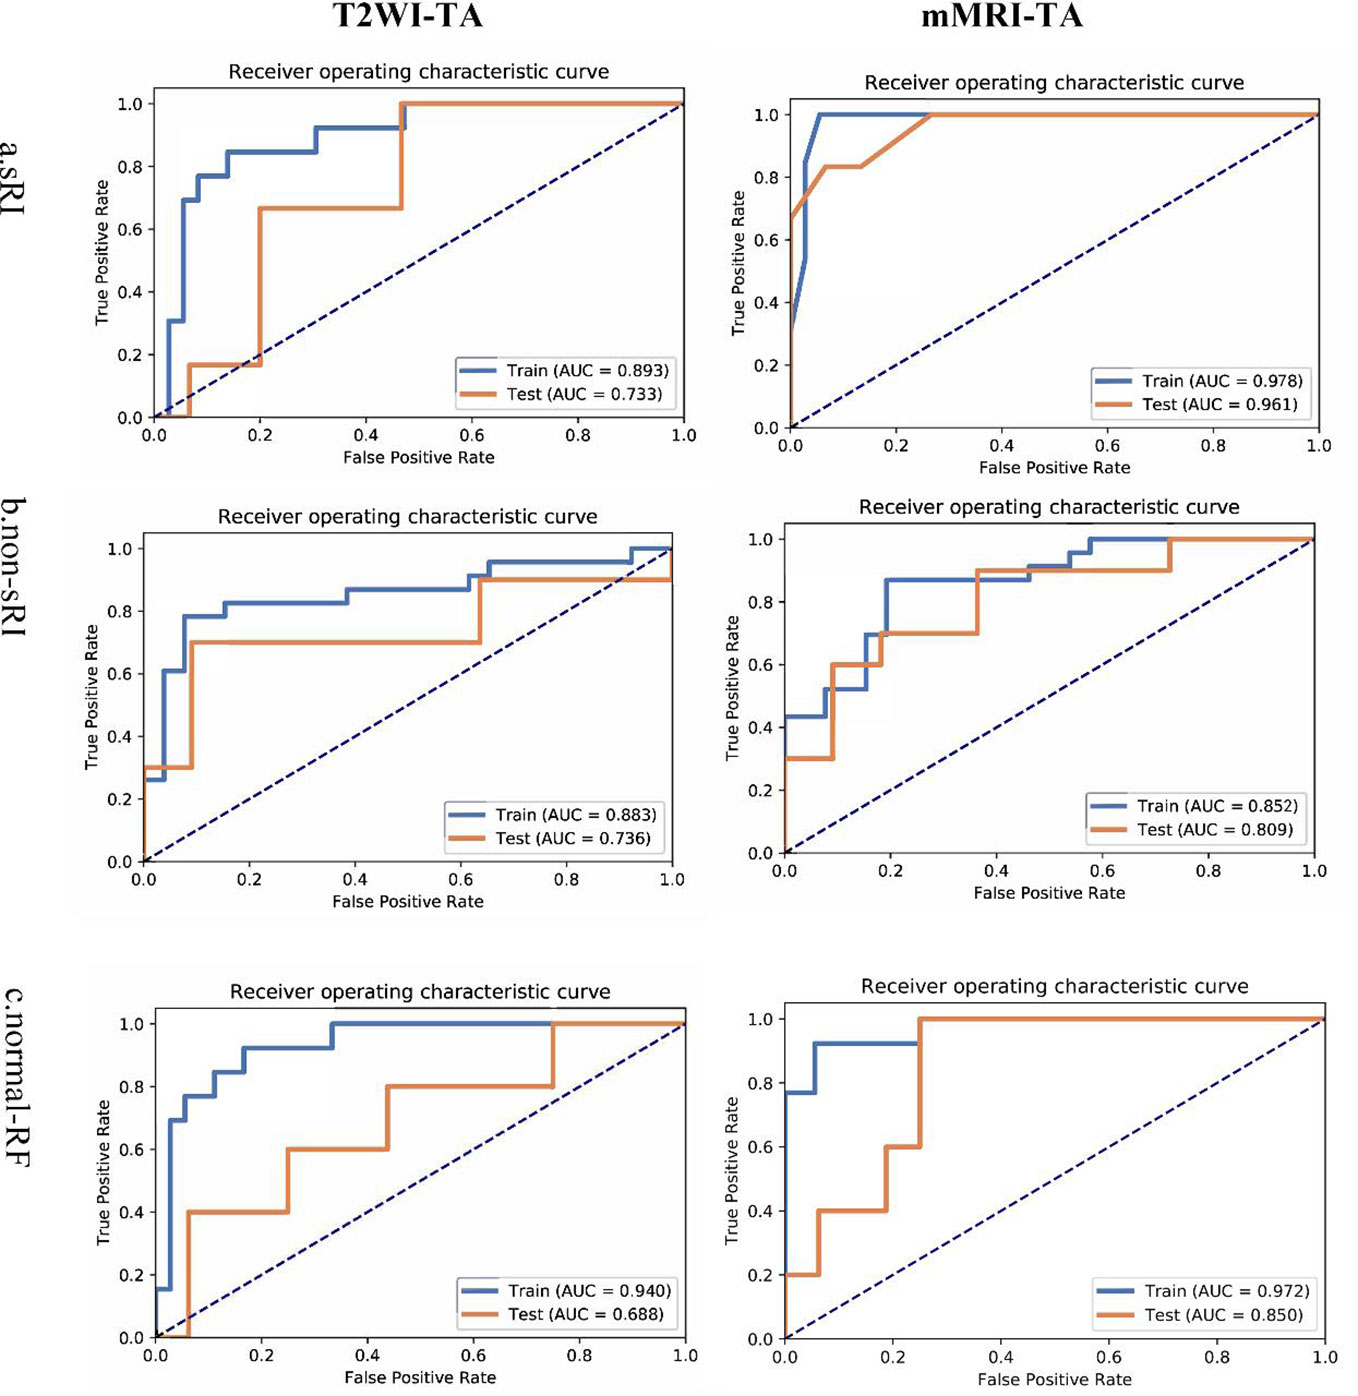
Figure 2 ROCs of T2WI and mMRI-TA models to identify normal-RF, non-sRI, and sRI. normal-RF: normal renal function; non-sRI: non-severe renal function impairment; sRI: severe renal function impairment.
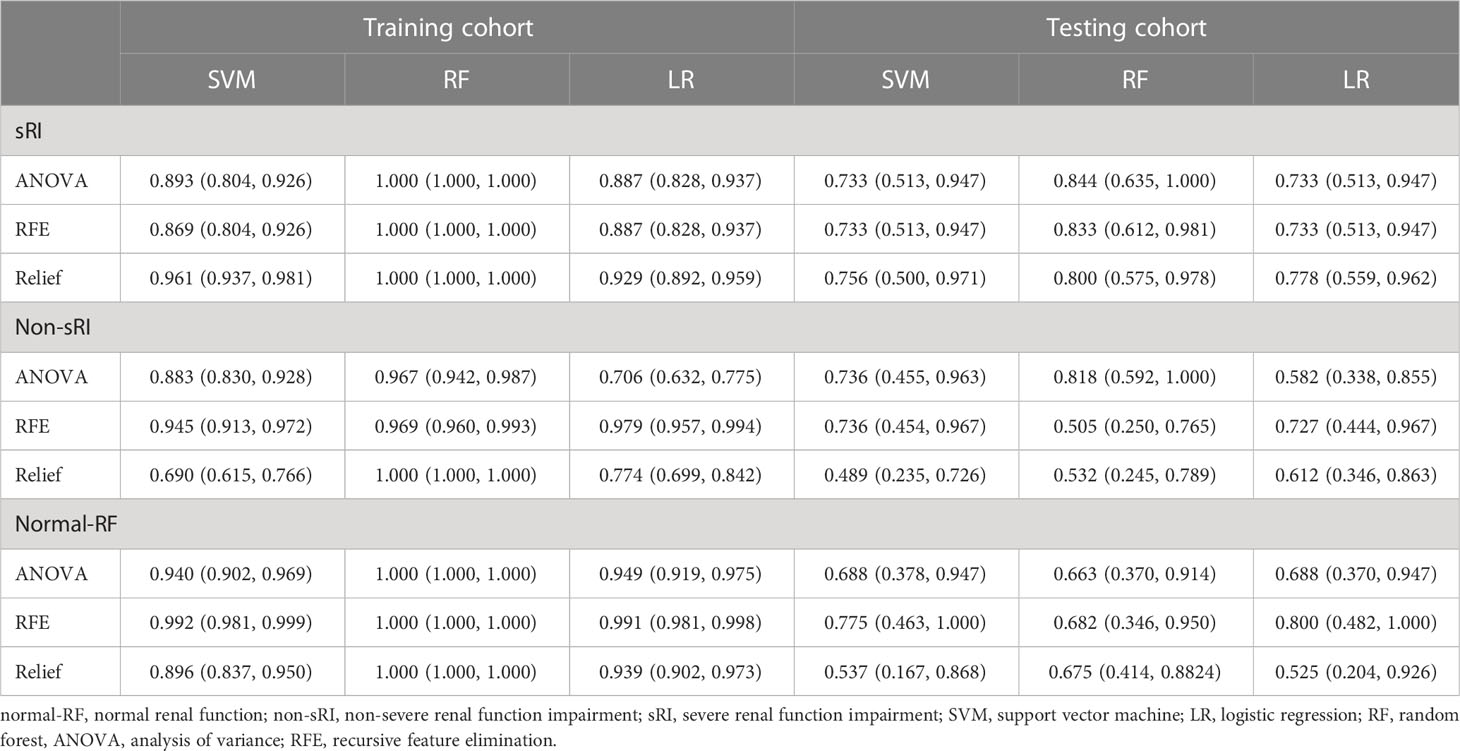
Table 2 Performance of the T2WI-based model to identify normal-RF, non-sRI, and sRI in training and testing cohorts.
3.3 Performance of the mMRI-TA model to identify normal-RF, non-sRI, and sRI
On the basis of the T2WI-based model, we had incorporated the quantitative values on BOLD and DWI to form the mMRI-TA model. The mMRI-TA model showed excellent performance in identifying normal-RF, non-sRI, and sRI in the training and testing cohorts (Table 3), and ROCs are demonstrated in Figure 2. In identifying the normal-RF group, the AUC was 0.972 (95% CI, 0.995, 1.000) in the training cohort and 0.850 (95% CI, 0.638, 0.988) in the testing cohort. In identifying the non-sRI group, the AUC was 0.852 (95% CI, 0.798, 0.902) in the training cohort and 0.809 (95% CI, 0.600, 0.980) in the testing cohort. In identifying the sRI group, the AUC was 0.978 (95% CI, 0.963, 0.993) in the training cohort and 0.961 (95% CI, 0.853, 1.000) in the testing cohort.
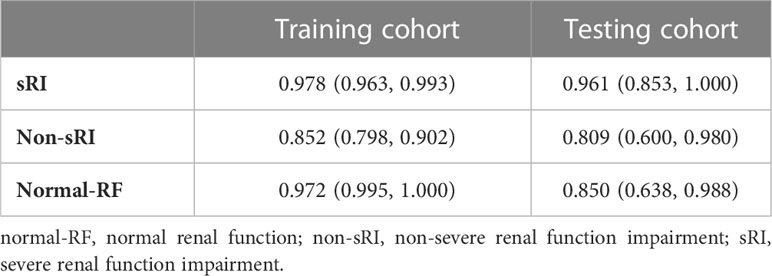
Table 3 Performance of the mMRI-TA model to identify normal-RF, non-sRI, and sRI in training and testing cohorts.
4 Discussion
Our study showed that the mMRI-TA model derived from T2WI and measured DWI and BOLD values was able to identify non-sRI, sRI, and normal-RF groups. We have investigated the performance of texture-based models on T2WI and functional MRI on renal function classification in DN.
Texture feature analysis on renal ultrasound and MRI can classify the renal function and the chronic kidney disease progression (24, 25). Several studies had confirmed that the decreased ADCs and increased R2* were detected in patients with renal dysfunction (26–28). The changes in signal intensity on DWI and BOLD were significantly associated with the area of fibrosis and cell density during renal fibrogenesis, and the degree of fibrosis was significantly associated with the status of renal function (28, 29). However, the manual ROIs were variable in previous renal studies, which affect the performance of fMRI (22, 30, 31). It is difficult for the human naked eyes to identify the changes of T2WI in renal fibrosis. Therefore, we used AI technology to detect the changes in signal intensity in patients with renal dysfunction and fibrosis by extracting a great number of MR imaging textures and further texture feature analysis. For renal fibrosis, the glomerulosclerosis and tubulointerstitial fibrosis were present, leading to decreased signal intensity on T2WI. Those subtle changes can be quantified by the imaging textures on T2WI. Therefore, the texture analysis on T2WI yielded good performance in stratifying the renal function status.
For the DWI and BOLD, we measured the values by a semi-automatic method to obtain stable data. Renal fibrosis is probably one of the main causes of decreased ADC values during renal function impairment (32). Reduced renal blood flow and renal fibrosis make a contribution to the progression of renal dysfunction (33, 34). On the other hand, the BOLD sequence is able to reflect hypoxia in the renal microenvironment. The renal medulla contains a great number of mitochondria, which are the most energy-consuming tubular cells. Hypoxia can be detected by BOLD in the medulla earlier with intense activity over the course of renal injury (2). The measured R2* and ADC values can reflect renal hypoxia and fibrosis, which may be an effective supplement to the T2WI-based model. Therefore, the mMRI-TA model constructed by T2WI and measured BOLD and DWI values has improved the performance of the T2WI-based model in assessing renal function.
Different machine learning methods have advantages and disadvantages in different applications. Some studies have compared machine learning methods to assess renal function in chronic kidney disease. Researchers have compared six algorithms, LR, RF, SVM, K nearest neighbors (KNN), Naive Bayes (NB), and feed-forward neural network (FNN), and RF achieved the best performance (35). Some authors used the RFE feature selection method and four classification algorithms (SVM, KNN, DT, and RF), and found that RF outperformed all other algorithms in CKD diagnosis (36). While other researchers detected CKD by combining the information gain-based feature selection technique and adaptive boosting (AdaBoost) classifier, they found that the cost-sensitive AdaBoost trained with the reduced feature set achieved the best classification performance with an accuracy of 99.8% (37). In our study, we have used the SVM, RF, and LR to build models and found that the SVM model is more stable in categorizing the sRI, non-sRI, and normal-RF groups in the training and testing cohorts. Therefore, the model performance of some machine learning algorithms should be compared, and the most appropriate one is selected for study purposes.
There were some limitations in our study. First, the sample size was relatively small. MRI examination is not a routine examination of the patient with renal function impairment. Second, not all patients underwent renal biopsy to identify the degree of renal fibrosis. However, the limited amount of tissue biopsy could not reflect the general pathological changes of DN. Third, we did not perform external validation for the retrospective study. We would like to recruit some patients from other institutions for future external validation.
In conclusion, the T2WI-based model outperformed in assessing the renal function status and the degree of renal fibrosis in DN. The mMRI-TA model based on T2WI and DWI and BOLD measurements can improve the model performance in assessing renal function.
Data availability statement
The original contributions presented in the study are included in the article/supplementary material. Further inquiries can be directed to the corresponding authors.
Ethics statement
Studies using patients’ database have had initial ethical approval from the Guangdong General Hospital, Guangdong Academy of Medical Sciences Research Ethics Committee, subject to prior independent scientific review. The Scientific Review Committee (GDREC) approved the study protocol (No. GDREC2017253H). The patients/participants provided their written informed consent to participate in this study.
Author contributions
WC, LZ, GC, BZ, ZL, YZ, JL, WW, and XM conceived the idea for the study. WC, LZ, and GC conducted the statistical analysis. WC, ZL, YZ, and JL were responsible for the initial draft of the report. WC, GC, JL, WW, and XM contributed to subsequent drafts and all authors were involved in the final draft. WC and XM were responsible for supervision. XM acts as guarantor for the final manuscript. All authors contributed to the article and approved the submitted version.
Funding
This work is supported by the Medical Science and Technology Planning Project of Guangdong Province (B2017075) and the Science and Technology Program of Huizhou, China (2017Y006).
Conflict of interest
The authors declare that the research was conducted in the absence of any commercial or financial relationships that could be construed as a potential conflict of interest.
Publisher’s note
All claims expressed in this article are solely those of the authors and do not necessarily represent those of their affiliated organizations, or those of the publisher, the editors and the reviewers. Any product that may be evaluated in this article, or claim that may be made by its manufacturer, is not guaranteed or endorsed by the publisher.
Supplementary material
The Supplementary Material for this article can be found online at: https://www.frontiersin.org/articles/10.3389/fendo.2023.1050078/full#supplementary-material
References
1. Inker LA, Titan S. Measurement and estimation of GFR for use in clinical practice: core curriculum 2021. Am J Kidney Dis (2021) 78(5):736–49. doi: 10.1053/j.ajkd.2021.04.016
2. Feng YZ, Ye YJ, Cheng ZY, Hu JJ, Zhang CB, Qian L, et al. Non-invasive assessment of early stage diabetic nephropathy by DTI and BOLD MRI. Br J Radiol (2020) 93(1105):20190562. doi: 10.1259/bjr.20190562
3. Takahashi T, Wang F, Quarles CC. Current MRI techniques for the assessment of renal disease. Curr Opin Nephrol Hypertens (2015) 24(3):217–23. doi: 10.1097/MNH.0000000000000122
4. Jiang K, Ferguson CM, Lerman LO. Noninvasive assessment of renal fibrosis by magnetic resonance imaging and ultrasound techniques. Transl Res (2019) 209:105–20. doi: 10.1016/j.trsl.2019.02.009
5. Hoffmann AC, Ruel Y, Gnirs K, Papageorgiou S, Zilberstein L, Nahmani S, et al. Brain perfusion magnetic resonance imaging using pseudocontinuous arterial spin labeling in 314 dogs and cats. J Vet Intern Med (2021) 35(5):2327–41. doi: 10.1111/jvim.16215
6. Munhoz L, Ramos EADA, Im DC, Hisatomi M, Yanagi Y, Asaumi J, et al. Application of diffusion-weighted magnetic resonance imaging in the diagnosis of salivary gland diseases: a systematic review. Oral Surgery Oral Medicine Oral Pathol Oral Radiol (2019) 3(128):280–310. doi: 10.1016/j.oooo.2019.02.020
7. Munhoz L, Abdala Júnior R, Abdala R, Arita ES. Diffusion-weighted magnetic resonance imaging of the paranasal sinuses: a systematic review. Oral Surgery Oral Medicine Oral Pathol Oral Radiol (2018) 6(126):521–36. doi: 10.1016/j.oooo.2018.07.004
8. Filograna L, Magarelli N, Cellini F, Manfrida S, Leone A, Colosimo C, et al. Diffusion weighted imaging (DWI) and apparent diffusion coefficient (ADC) values for detection of malignant vertebral bone marrow lesions. Eur Rev Med Pharmacol Sci (2018) 22(3):590–7. doi: 10.26355/eurrev_201802_14273
9. Munhoz L, Abdala Júnior R, Abdala R, Asaumi J, Arita ES. Diffusion-weighted magnetic resonance imaging in maxillary sinuses inflammatory diseases: report of three cases and literature review. J Oral Maxillofac Res (2018) 9(2):e4. doi: 10.5037/jomr.2018.9204
10. Caroli A, Schneider M, Friedli I, Ljimani A, De Seigneux S, Boor P, et al. Diffusion-weighted magnetic resonance imaging to assess diffuse renal pathology: a systematic review and statement paper. Nephrol Dial Transplant (2018) 33(suppl_2):ii29–40. doi: 10.1093/ndt/gfy163
11. Sullivan HR, Schweikart SJ. Are current tort liability doctrines adequate for addressing injury caused by AI? AMA J Ethics. (2019) 21(2):E160–6. doi: 10.1001/amajethics.2019.160
12. Abadia AF, Yacoub B, Stringer N, Snoddy M, Kocher M, Schoepf UJ, et al. Diagnostic accuracy and performance of artificial intelligence in detecting lung nodules in patients with complex lung disease: a noninferiority study. J Thorac Imaging. (2022) 37(3):154–61. doi: 10.1097/RTI.0000000000000613
13. Abbani N, Baudier T, Rit S, Franco FD, Okoli F, Jaouen V, et al. Deep learning-based segmentation in prostate radiation therapy using Monte Carlo simulated cone-beam computed tomography. Med Phys (2022) 49(11):6930–44. doi: 10.1002/mp.15946
14. Abbasian Ardakani AA-O, Mohammadi A, Mirza-Aghazadeh-Attari M, Faeghi F, Vogl TJ, Acharya UR. Diagnosis of metastatic lymph nodes in patients with papillary thyroid cancer: a comparative multi-center study of semantic features and deep learning-based models. J Ultrasound Med (2022) 27. doi: 10.1002/jum.16131
15. Abbaspour S, Abdollahi H, Arabalibeik H, Barahman M, Arefpour AM, Fadavi P, et al. Endorectal ultrasound radiomics in locally advanced rectal cancer patients: despeckling and radiotherapy response prediction using machine learning. Abdom Radiol (NY). (2022) 47(11):3645–59. doi: 10.1007/s00261-022-03625-y
16. Abdel-Fattah MA-O, Othman NA-O, Goher NA-O. Predicting chronic kidney disease using hybrid machine learning based on Apache spark. Comput Intell Neurosci (2022) 2022:9898831. doi: 10.1155/2022/9898831
17. Gillies RJ, Kinahan PE, Hricak H. Radiomics: images are more than pictures, they are data. Radiology (2016) 278(2):563–77. doi: 10.1148/radiol.2015151169
18. Avanzo M, Wei L, Stancanello J, Vallières M, Rao A, Morin O, et al. Machine and deep learning methods for radiomics. Med Phys (2020) 47(5):e185–202. doi: 10.1002/mp.13678
19. Ulrich EJ, Menda Y, Boles Ponto LL, Anderson CM, Smith BJ, Sunderland JJ, et al. FLT PET radiomics for response prediction to chemoradiation therapy in head and neck squamous cell cancer. Tomography (2019) 5(1):161–9. doi: 10.18383/j.tom.2018.00038
20. Piskunowicz M, Hofmann L, Zuercher E, Bassi I, Milani B, Stuber M, et al. A new technique with high reproducibility to estimate renal oxygenation using BOLD-MRI in chronic kidney disease. Magn Reson Imaging (2015) 33(3):253–61. doi: 10.1016/j.mri.2014.12.002
21. Deng Y, Yang BR, Luo JW, Du GX, Luo LP. DTI-based radiomics signature for the detection of early diabetic kidney damage. Abdom Radiol (NY) (2020) 45(8):2526–31. doi: 10.1007/s00261-020-02576-6
22. Ding J, Xing Z, Jiang Z, Zhou H, Di J, Chen J, et al. Evaluation of renal dysfunction using texture analysis based on DWI, BOLD, and susceptibility-weighted imaging. Eur Radiol (2019) 29(5):2293–301. doi: 10.1007/s00330-018-5911-3
23. Milani B, Ansaloni A, Sousa-Guimaraes S, Vakilzadeh N, Piskunowicz M, Vogt B, et al. Reduction of cortical oxygenation in chronic kidney disease: evidence obtained with a new analysis method of blood oxygenation level-dependent magnetic resonance imaging. Nephrol Dial Transplant (2017) 32(12):2097–105. doi: 10.1093/ndt/gfw362
24. Kuo CC, Chang CM, Liu KT, Lin WK, Chiang HY, Chung CW, et al. Automation of the kidney function prediction and classification through ultrasound-based kidney imaging using deep learning. NPJ Digit Med (2019) 2:29. doi: 10.1038/s41746-019-0104-2
25. Xiao J, Ding R, Xu X, Guan H, Feng X, Sun T, et al. Comparison and development of machine learning tools in the prediction of chronic kidney disease progression. J Transl Med (2019) 17(1):119. doi: 10.1186/s12967-019-1860-0
26. Xu X, Palmer SL, Lin X, Li W, Chen K, Yan F, et al. Diffusion-weighted imaging and pathology of chronic kidney disease: initial study. Abdom Radiol (NY). (2018) 43(7):1749–55. doi: 10.1007/s00261-017-1362-6
27. Ichikawa S, Motosugi U, Ichikawa T, Sano K, Morisaka H, Araki T. Intravoxel incoherent motion imaging of the kidney: alterations in diffusion and perfusion in patients with renal dysfunction. Magn Reson Imaging. (2013) 31(3):414–7. doi: 10.1016/j.mri.2012.08.004
28. Woo S, Cho JY, Kim SY, Kim SH. Intravoxel incoherent motion MRI-derived parameters and T2* relaxation time for noninvasive assessment of renal fibrosis: an experimental study in a rabbit model of unilateral ureter obstruction. Magn Reson Imaging (2018) 51:104–12. doi: 10.1016/j.mri.2018.04.018
29. Berchtold L, Friedli I, Crowe LA, Martinez C, Moll S, Hadaya K, et al. Validation of the corticomedullary difference in magnetic resonance imaging-derived apparent diffusion coefficient for kidney fibrosis detection: a cross-sectional study. Nephrol Dial Transplant. (2020) 35(6):937–45. doi: 10.1093/ndt/gfy389
30. Yu B, Huang C, Fan X, Li F, Zhang J, Song Z, et al. Application of MR imaging features in differentiation of renal changes in patients with stage III type 2 diabetic nephropathy and normal subjects. Front Endocrinol (Lausanne). (2022) 13:846407. doi: 10.3389/fendo.2022.846407
31. Grzywińska M, Jankowska M, Banach-Ambroziak E, Szurowska E, Dębska-Ślizień A. Computation of the texture features on T2-weighted images as a novel method to assess the function of the transplanted kidney: primary research. Transplant Proc (2020) 52(7):2062–6. doi: 10.1016/j.transproceed.2020.02.084
32. Feng Y-Z, Chen X-Q, Cheng Z-Y, Lin Q-T, Chen P-K, Si-Tu D-K, et al. Non-invasive investigation of early kidney damage in streptozotocin-induced diabetic rats by intravoxel incoherent motion diffusion-weighted (IVIM) MRI. BMC Nephrol (2021) 22(1):321–1. doi: 10.1186/s12882-021-02530-8
33. Luo F, Liao Y, Cui K, Tao Y. Noninvasive evaluation of renal oxygenation in children with chronic kidney disease using blood-oxygen-level-dependent magnetic resonance imaging. Pediatr Radiol (2020) 50(6):848–54. doi: 10.1007/s00247-020-04630-3
34. Sułkowska K, Palczewski P, Furmańczyk-Zawiska A, Perkowska-Ptasińska A, Wójcik D, Szeszkowski W, et al. Diffusion weighted magnetic resonance imaging in the assessment of renal function and parenchymal changes in chronic kidney disease: a preliminary study. Ann Transplant. (2020) 25:e920232. doi: 10.12659/AOT.920232
35. Qin J, Chen L, Liu Y, Liu C, Feng C, Chen B. A machine learning methodology for diagnosing chronic kidney disease. Access IEEE (2020) 000(8):20991–1002. doi: 10.1109/ACCESS.2019.2963053
36. Senan E, Al-Adhaileh M, Alsaade FW, Aldhyani TA-O, Alqarni AA-O, Alsharif N, et al. Diagnosis of chronic kidney disease using effective classification algorithms and recursive feature elimination techniques. J Healthc Eng. (2021) 2021:1004767. doi: 10.1155/2021/1004767
Keywords: texture analysis, multimodal MRI (mMRI), machine learning, diabetic nephropathy (DN), functional MRI (fMRI)
Citation: Chen W, Zhang L, Cai G, Zhang B, Lian Z, Li J, Wang W, Zhang Y and Mo X (2023) Machine learning-based multimodal MRI texture analysis for assessing renal function and fibrosis in diabetic nephropathy: a retrospective study. Front. Endocrinol. 14:1050078. doi: 10.3389/fendo.2023.1050078
Received: 12 October 2022; Accepted: 28 February 2023;
Published: 17 April 2023.
Edited by:
Nehal Mohsen Elsherbiny, Mansoura University, EgyptReviewed by:
Dan Pan, Xiamen University, ChinaChun Luo, First People’s Hospital of Foshan, China
Shams Mohammad Abrar, Bangladesh Atomic Energy Commission, Bangladesh
Maoqing Hu, Jiangmen Central Hospital, China
Copyright © 2023 Chen, Zhang, Cai, Zhang, Lian, Li, Wang, Zhang and Mo. This is an open-access article distributed under the terms of the Creative Commons Attribution License (CC BY). The use, distribution or reproduction in other forums is permitted, provided the original author(s) and the copyright owner(s) are credited and that the original publication in this journal is cited, in accordance with accepted academic practice. No use, distribution or reproduction is permitted which does not comply with these terms.
*Correspondence: Xiaokai Mo, 897325189@qq.com; Yuxian Zhang, zhangyx1979@126.com; Wenjian Wang, wwjph@126.com
†These authors have contributed equally to this work