A First Evaluation of ERA5-Land Reanalysis Temperature Product Over the Chinese Qilian Mountains
 Peng Zhao1,2
  Zhibin He1*
- 1Linze Inland River Basin Research Station, Key Laboratory of Inland River Basin Science, Northwest Institute of Eco-Environment and Resource, Chinese Academy of Sciences, Lanzhou, China
- 2University of Chinese Academy of Sciences, Beijing, China
Reanalysis temperature products are important datasets for temperature estimates over high-elevation areas with few meteorological stations. In this study, surface 2 m air temperature data from 17 meteorological stations from 1979 to 2017 in the Qilian Mountains (QLM) are used for comparison with the newest reanalysis product: ERA5-Land derived from the European Centre for Medium-Range Weather Forecasts (ECMWF). In general, the ERA5-Land temperature product can reproduce the observation variation at different time scales very well. A high monthly correlation coefficient that ranges from 0.978 to 0.998 suggests that ERA5-Land reanalysis temperature could capture the observations very well. However, attention should be paid before using ERA5-Land at individual sites because of the average root-mean-square-error (RMSE) of 2.2°C of all stations. The biases between ERA5-Land temperature and observations are mainly caused by the elevation differences between ERA5-Land grid points and meteorological sites. The annual mean temperature shows a significant warming trend (0.488°C/decade) from 1979 to 2017 based on the observations. ERA5-Land reanalysis temperature captures the increasing trend very well (0.379°C/decade). The biggest positive warming trends of observations and ERA5-Land are both found in summer with values of 0.574°C/decade and 0.496°C/decade, respectively. We suggest that ERA5-Land generally reproduces the temperature trend very well for observations and is reliable for scientific research over the QLM.
1 Introduction
The Qilian Mountains (QLM) comprise an important ecological protection barrier and one of the most important sources of water to northwestern China. The mountain range is extremely important for assessing climatic and environmental changes across China (Lin et al., 2017; Wang et al., 2019). The QLM system not only is the source of many rivers but also hosts a unique desert oasis ecosystem (Sun and Liu, 2013; Wang et al., 2019). However, most glaciers in the QLM exhibit accelerated degradation because of recent climate warming (Qian et al., 2019).
In general, previous studies about temperature change characteristics in the QLM were completed by using observations. However, surface meteorological stations are spare in the QLM, especially above 3000 m. Thus, limited observations or remote sensing products are the commonly used data resources in previous studies about climate change in the QLM. Jia (2012) used observational data and found that the extremes of seasonal high temperature in the QLM showed a significantly increasing trend, and the extremes of seasonal low temperature showed a significantly decreasing trend. Zhang et al. (2009) used observational data and found that temperature changes in the QLM were well synchronized with those in the entire northwestern region and that temperature changes in the western part of the QLM were more significant than those in the eastern and middle sections. Wang et al. (2019) studied the temperature variability at annual and seasonal scales during 1960–2016 using monthly observational data in the QLM, results found that the changes in winter temperature made the greatest contribution to the annual temperature changes. Lin et al. (2017) used observational data and found that temperature extremes in the QLM exhibited a significant warming trend, consistent with global warming. Warming trends in autumn and winter were greater than in spring and summer. Cao et al. (2018) analyzed the temporal variability and spatial distribution of air temperature in the south slope of QLM from 1960 to 2014 by using observational data, and the results showed that the increasing trends of mean annual air temperature, minimum, and maximum temperatures in the QLM are 0.35°C/decade, 0.27°C/decade, and 0.47°C/decade, respectively. Fu et al. (2018) used observational data and found that the temperature mutation of multiannual, maximum, and minimum temperatures in the QLM occurred in 1991, 1995, and 1990, respectively. Wang et al. (2019) analyzed the annual and seasonal variability in temperature during 1960–2016 using monthly data from meteorological stations in the QLM, and the results showed that temperature in the whole regions, oasis, and mountains increased at the rate of 0.32°C/decade, 0.32°C/decade, and 0.33°C/decade, respectively. Cao et al. (2018) analyzed the variability of air temperature in the south slope of the QLM by using observational data from 1960 to 2014, and the results showed that the mean annual air temperature exhibited a unanimously fluctuating increasing trend with the rate of 0.35°C/decade.
Compared with varied reanalysis products, some shortages exist in the observations from meteorological stations, such as shorter time series and low spatial density, especially in high-elevation areas. Various interpolation methods often cause large biases because of the limitations of the spatial interpolation itself, such as the density and uneven distribution of stations (Gao et al., 2018). Reanalysis products have been commonly applied in previous studies because of their high spatial resolution and long-time series (Gao et al., 2018; Zhang et al., 2021). However, there some biases may exist between reanalysis data and observations, which suggest that caution is needed before using reanalysis data. For example, Wang et al. (2018) evaluated the reliability of ERA-Interim reanalysis precipitation and temperature data in mainland China, and the results indicated that caution should be paid when using ERA-Interim precipitation and temperature in areas with complex orography. Jiao et al. (2021) showed that the accuracy of the ERA5 reanalysis precipitation products was strongly correlated with topographic distribution and climatic divisions in China. Therefore, it is still a necessity to assess the quality and bias of reanalysis data, especially in areas with complex topography.
Many studies are concentrating on the evaluation of ERA5-Land in different regions. Xin et al. (2021) evaluated and compared the ability of two ERA5 precipitation products, ERA5-Land and ERA5-HRES, in the Guangdong-Hong Kong-Macao Greater Bay Area (GBA) using observations from over 3000 rain gauges in a high-density network during 2018, and the results showed that ERA5-Land data with finer spatial resolution fail to deliver any preferable results than ERA5-HRES. Zou et al. (2022) evaluated the ERA5-Land air temperature data in the GBA by using the observations of 1080 automatic weather stations in 2018, and the results showed that ERA5-Land underestimates temperature (an average bias of 0.90°C) and performs better at low temperatures than at high temperatures. The spatial pattern of ERA5-Land is generally consistent with that of stations but relatively poor in urban areas. In addition, ERA5-Land properly captures daily and monthly variations, as well as intraday temperature fluctuations (Zou et al., 2022). Chen et al. (2021) found that the high-resolution ERA5-Land and ERA5 datasets well present the observed spatial pattern of precipitation but with a generally overestimated amount in the southern slope of central Himalaya. Hong et al. (2021) found that ERA5 and ERA5-Land precipitation products have similar spatiotemporal error characteristics, and ERA5-Land performs better than ERA5 over Jiangxi Province in 2019. Wu et al. (2021) evaluated the ERA5-Land soil moisture (SM) datasets in China, and the results indicated that ERA5-Land showed a larger bias in (semi-) humid areas (0.06 m3/m3 on an average) and had higher temporal precision in the southern areas in China, which are mostly determined by their SM climatology. Cao et al. (2020) concluded that ERA5-Land soil data are not well suited for informing permafrost research and decision making directly.
In the QLM, there were some evaluations of the reliability of reanalysis data in previous studies. For example, Zhao et al. (2020) evaluated the reliability of ERA-Interim temperature data over the QLM, and the results showed that ERA-Interim temperature is generally reliable for climate change research over the QLM. Huai et al. (2021) evaluated the applicability of ERA5, JRA-55, ERA-Interim, and HAR reanalysis in the QLM, and the results showed that ERA5 outperforms for most variables in correlation coefficients, especially for wind speed, but is not significantly improved than ERA-Interim of other variables. ERA5-Land is a state-of-the-art global reanalysis data set for land applications. However, there is very little research on the evaluation of the reliability of ERA5-Land reanalysis data in the QLM, indicating that the capabilities of land-surface climate in the QLM are unknown. Thus, this evaluation results of ERA5-Land products could provide a reference when using reanalysis data in the QLM.
This study uses 17 meteorological stations in the QLM during the period of 1979–2017 to assess the monthly 2 m air temperature in ERA5-Land products. This important evaluation could help understand the reliability of ERA5-Land reanalysis for the local climate studies. The structure of this study is divided into three aspects. Section 1 introduces the ERA5-Land monthly average temperature reanalysis data and observations as well as the evaluation methods. The results and discussion are given in Section 2, and finally, the conclusions are presented in Section 3.
2 Data and Methods
2.1 ERA5-Land Reanalysis Data (Te)
ERA5-Land is the ECMWF’s newest reanalysis data set, which is a state-of-the-art global reanalysis data set for land applications (Joaquín et al., 2021). ERA5-Land has a higher resolution than ERA-Interim and ERA5. The spatial resolution and horizontal resolution of ERA5-Land are 0.1° × 0.1° and 10 km, respectively. The time series of ERA5-Land covers the period 1950 to the present. The ERA5-Land dataset includes hourly and monthly dynamic data representing 50 indicators from 1950 to the present (A. and G.B., 2021; The Alexander and Gregor, 2020; Cao et al., 2020; Jiang et al., 2020; Jiao et al., 2021; Joaquín et al., 2021; Konstantinos et al., 2021; Luis and Johannes, 2020; Pelosi et al., 2020; Wu et al., 2021; Pelosi and Chirico, 2021; Xu et al., 2022).
In this study, ERA5-Land monthly averaged 2 m air temperature data were used. The period ranged from January 1979 to December 2017, and the geographical locations ranged from 35.8 to 40.0°N and from 93.5 to 104.0°E. The ERA5-Land grid point covers all of the QLM region (Figure 1). The grid-point altitude information was extracted from digital elevation model data downloaded from Geospatial Data Cloud (https://www.gscloud.cn) for the QLM (Table 1).
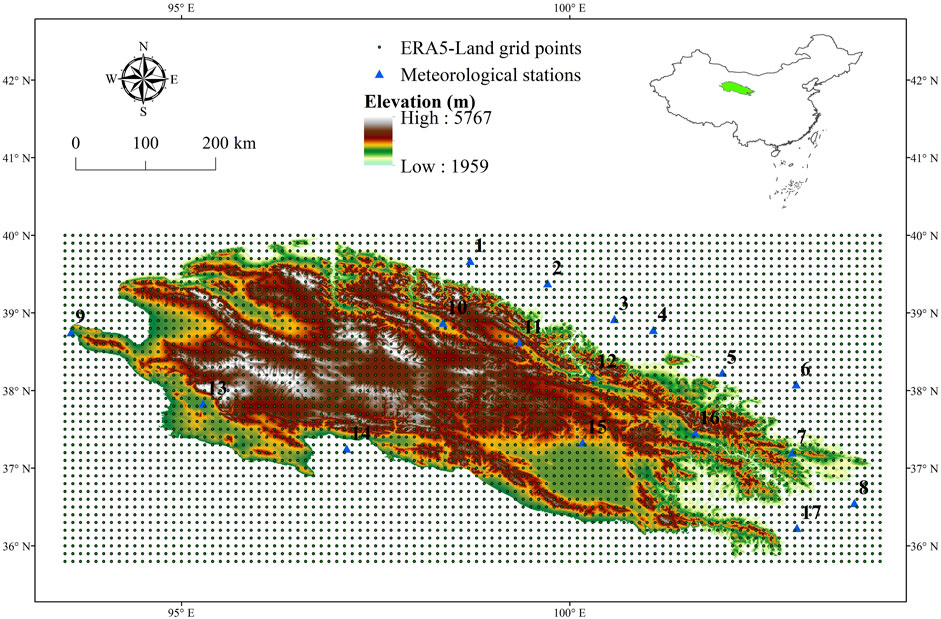
FIGURE 1. Spatial distribution of ERA5-Land grid points and meteorological stations over the QLM.
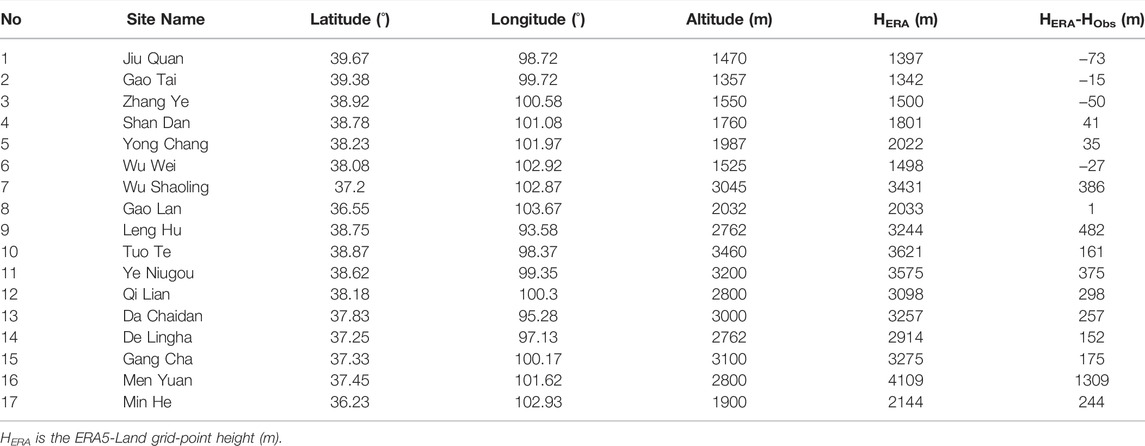
TABLE 1. Meteorological stations information.
2.2 Observations (To)
We obtained observational temperature data and altitude information for this study from the China Meteorological data-sharing service system (http://cdc.cma.gov.cn/index.jsp). The quality of temperature data was controlled and verified by the provider. After strict quality control, the quality and completeness of temperature data are significantly improved, so that it can be applied directly in climate change research. Temperature data for 1979 to 2017 from 17 ground observational stations in the QLM were extracted and sorted into seasonal and annual scales. Among the 17 meteorological stations in the QLM, nine stations were from Qinghai Province and the other eight stations were from Gansu Province. The 17 stations are located within altitude ranges from 1000 to 3500 m; in that, five stations were higher than 3000 m, of which station No.10 (station Tuo Le) is the highest with an elevation of 3460 m. A detailed description of the information and spatial distribution of 17 stations is shown in Figure 1 and Table 1. ERA5-Land grid points nearest to each meteorological station were selected for comparison based on the longitude and latitude coordinates of 17 meteorological stations, which can avoid the error caused by multigrid spatial interpolation (Zhao et al., 2020). Seasons were identified for the purpose of this study as follows: spring (March to May), summer (June to August), autumn (September to November), and winter (December to February).
2.3 Evaluation Methods
To evaluate the quality of the ERA5-Land data set, correlation coefficient (r), bias, and root-mean-square-error (RMSE) were computed for comparison of the ERA5-Land and observed temperatures at the 17 meteorological stations at monthly, seasonal, and annual temporal scales.
3 Results and Discussion
3.1 Spatial Analysis of Average Annual and Seasonal Mean Temperature
We analyze the spatial distribution characteristics of temperature using 1983 ERA5-Land grid points within the QLM from 1979 to 2017. In general, the climatology is reflected by interpolating observations. However, this process is completed by the density of observational stations. Just a few stations are suited at the high-elevation areas within QLM (especially above 3000 m), which causes an inaccuracy for the plateau-wide temperature climatology. Figure 2 shows the spatial distribution of annual mean temperature over the QLM based on the ERA5-Land reanalysis. The green part represents the low-temperature area, and the red part represents the high-temperature area. The annual temperatures in the central QLM are below 0°C (Figure 2). The annual mean temperature ranged from −12°C to 6.6°C, with an average temperature of 2.4°C/year. Furthermore, the mean temperature of ERA5-Land decreases from the edge area to the interior area, which demonstrates that ERA5-Land could capture the climatology difference derived from topographic features. Figure 3 shows the spatial distribution characteristics of average seasonal mean temperatures across the QLM for 1979–2017 based on the ERA5-Land reanalysis. In the whole QLM, the average mean temperatures in winter are below 0°C. The temperatures in central QLM are lower than in the surrounding regions. The temperature for the four seasons followed the order of summer > spring > autumn > winter. The temperature changes show a strong spatial variance across the QLM.
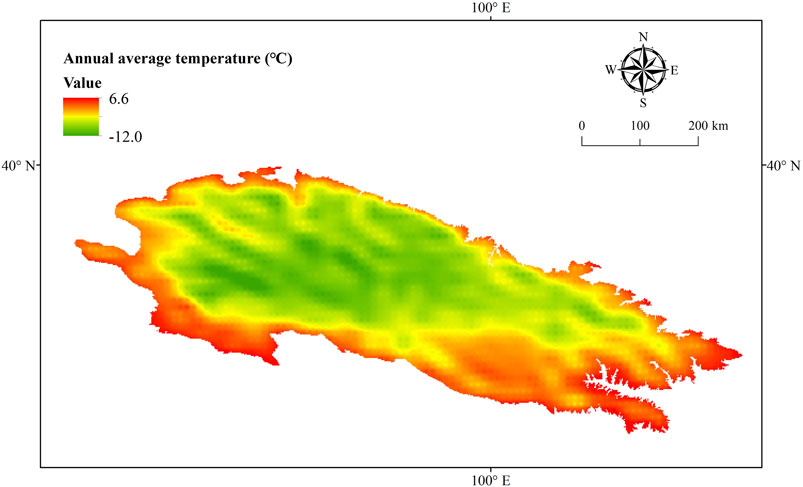
FIGURE 2. Spatial distribution of annual mean ERA5-Land temperature in the QLM.
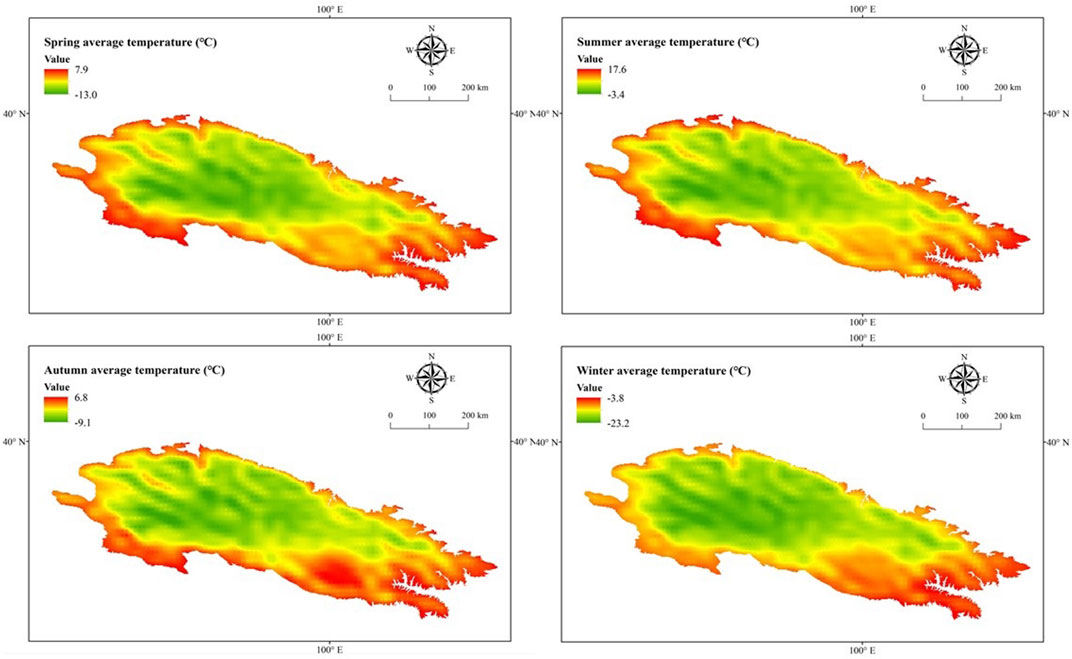
FIGURE 3. Spatial distribution of seasonal mean ERA5-Land temperature in the QLM.
3.2 Monthly Temperature Comparisons
Table 2 shows the comparison results of ERA5-Land monthly temperature and observations in the corresponding period. The correlation coefficient (r) ranged from 0.978 to 0.998 at all stations with an average r of 0.993, which reveals that Te could capture the observations annual cycle very well. The biases change from −5.6 to 1.6°C with an average of −1.3°C for all stations. Nine meteorological sites have a bias from −1°C to 1°C. The positive values of bias represent that Te is warmer than To, and the negative ones indicate that Te is cooler than To. The largest negative bias (−5.6°C) happens at station No.16, namely, station Men Yuan in the southeastern QLM with an elevation of 2800 m. However, the ERA5-Land grid height at station No.16 is 4109 m. Figure 4 shows the comparison of ERA5-Land with observations for station No.16 (largest negative bias) in their corresponding periods. ERA5-Land obviously underestimates observations for station No.16. The largest RMSE is also found at station No.16, whereas the smallest one is found at station No.14. The RMSE changes from 0.8°C to 6.0°C with an average of 2.2°C for all stations, which suggests that Te could not be used directly in scientific research.
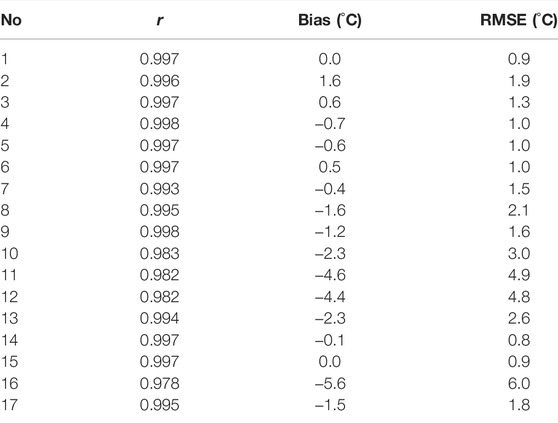
TABLE 2. Comparison of ERA5-Land monthly averaged temperatures with observations at all 17 stations.
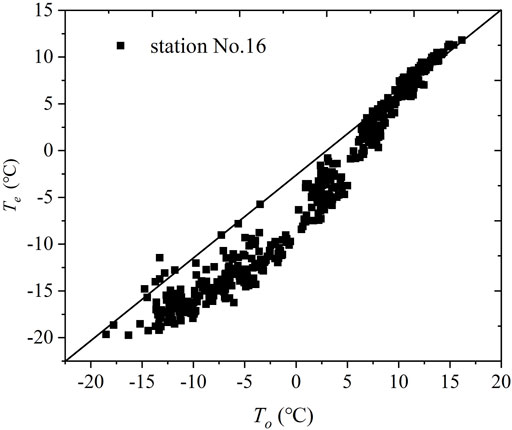
FIGURE 4. Scatter plots of comparison of ERA5-Land monthly temperature with observations at station No. 16 in 1979–2017. The solid line is 1:1 line.
3.3 Seasonal and Annual Temperature Comparisons
The high seasonal and annual r reflect the good consistency between Te and To. However, it does not reflect the consistent interannual and seasonal variability. Table 3 shows the r, bias, and RMSE between Te and To at a seasonal scale. The averaged values of r for all stations in spring, summer, autumn, and winter are 0.874, 0.943, 0.739, and 0.786, respectively. Thirteen stations have correlation coefficients of more than 0.8 in spring, whereas 8 and 10 stations meet this standard during autumn and winter, respectively. All stations have a correlation exceeding 0.8 in summer. The r of Te is varied from different stations in general. For instance, stations No.1 and No.3 perform the best correlation coefficient in spring. However, for stations No.7 and No.15, the best correlation is found in summer. It indicates an important spatial variance across the QLM. The largest negative bias for all seasons is also found at station No.16, which is consistent with the monthly bias. Station No.16 performs the largest RMSE in all seasons. The averaged values of RMSE for spring, summer, autumn, and winter are 2.4°C, 1.7°C, 1.9°C, and 1.8°C for all 17 stations, respectively. The r, bias, and RMSE of annual mean temperature between the two data sets are shown in Table 4. The value of r between Te and To changes from 0.632 to 0.953 with an average r of 0.854 for all meteorological sites. Twelve stations have r greater than 0.8. Just station No.10 has a lower r than 0.7. Station No.16 also performs the largest negative bias (−5.6°C) and the largest RMSE (5.6°C). The smallest RMSE (0.2°C) happened at station No.1. The average RMSE of annual mean temperature over all stations reaches 1.8°C.
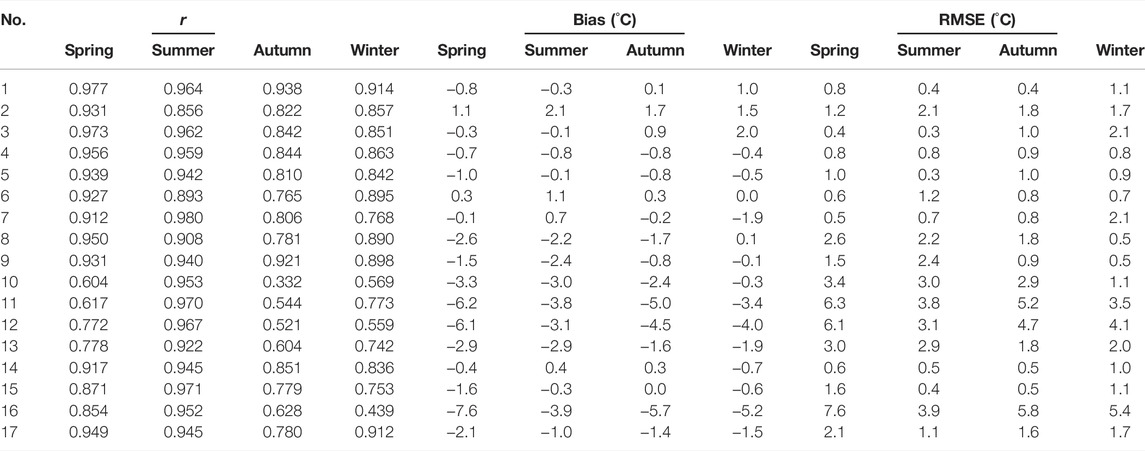
TABLE 3. Comparison of ERA5-Land seasonal mean temperature with observations at all 17 stations.
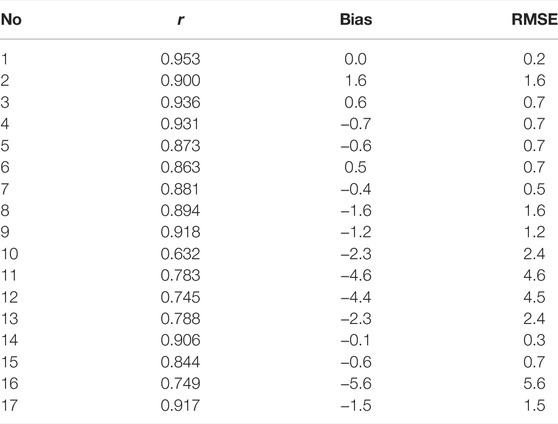
TABLE 4. Comparison of ERA5-Land annual mean temperature with observations at all 17 stations.
3.4 Warming Trends of ERA5-Land Temperature and Observations
The annual and seasonal temperature-increasing trends of Te and To during the period of 1979–2017 over the QLM are shown in Figure 5 and Figure 6. The linear warming rate of To reaches 0.488°C/decade from 1979 to 2017. The linear warming rate of Te is 0.379°C/decade, which suggests that ERA5-Land reanalysis temperature can capture the warming trend well in general (Table 5). The difference in annual mean temperature-increasing trends between Te and To reaches 0.109°C/decade. Winter temperature performs the largest trend difference between Te and To (0.158°C/decade). ERA5-Land can capture the temperature trends in other seasons very well, with values of 0.079°C/decade in spring, 0.078°C/decade in summer, and 0.119°C/decade in autumn. This trend difference between Te and To may be caused by the sparse observations in the high-elevation regions in the QLM, especially above 3000 m. In general, Te is reliable for capturing the temperature-increasing trend over the QLM for its averaged trend difference of 0.109°C/decade against To. However, Te should attract attention to reduce its bias with To before applying it to scientific research because of the averaged RMSE (2.2°C) (i.e., bias correction).
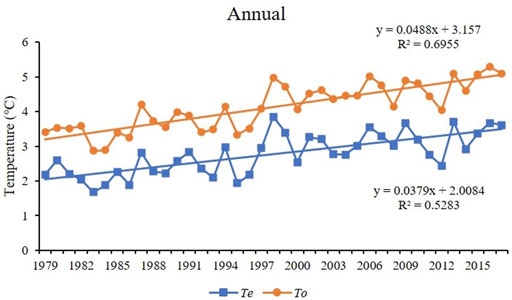
FIGURE 5. Average annual mean temperature from station time series and ERA5-Land in the 1979–2017 period for QLM.
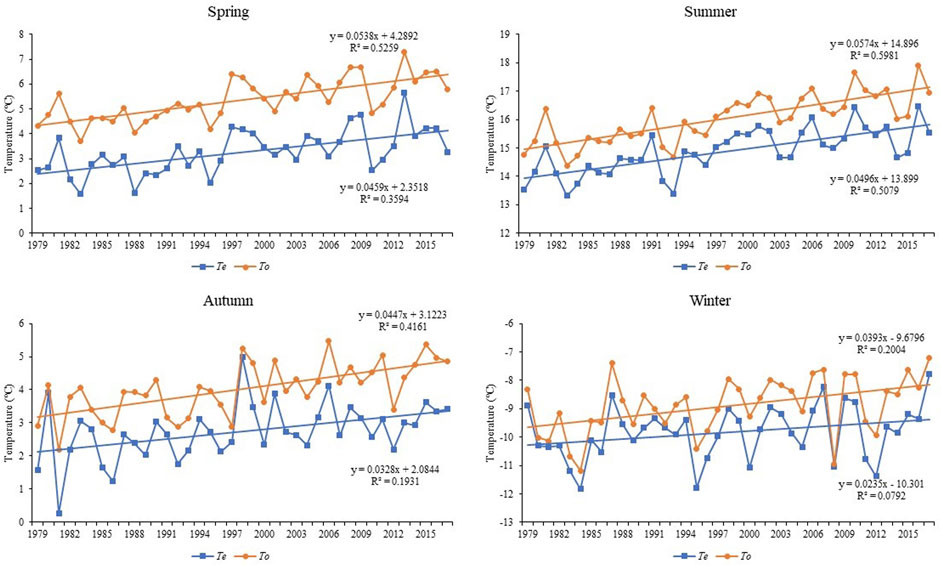
FIGURE 6. Average seasonal mean temperature from station time series and ERA5-Land in the 1979–2017 period for QLM.
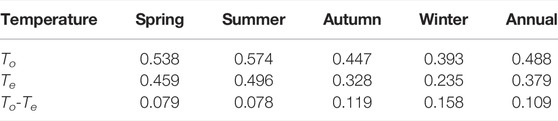
TABLE 5. Temperature warming trends (°C/decade) in all seasons from station time series and ERA5-Land reanalysis in 1979–2017.
3.5 Bias Analysis
The results of Figure 5 and Figure 6 show that the reanalysis underestimated temperature over the QLM, which is similar to the previous studies (Zhao et al., 2020; Huai et al., 2021). Station No.16 performs the largest negative bias, and the larger difference in altitude between the reanalysis and the actual altitude at station No.16 causes errors in temperature. Correcting the temperature of the reanalysis based on the elevation difference may reduce the error of the temperature reanalysis and improve the accuracy (Gao et al., 2018). The linear relationship between monthly biases and elevation differences between Te and To is shown in Figure 7. Please note that bias and elevation difference between Te and To were calculated by Te minus To. The monthly biases are caused by the elevation differences between Te and To, because the correlation of determination (R2) measuring the fit reaches 0.535. Thus, there exists a possibility to reduce the bias between Te and To by using a bias correction model, to improve the applicability of ERA5-Land (Gao et al., 2014). Figure 8 and Figure 9 show that the R2 value of annual correlation reaches 0.542, and the R2 values for spring, summer, autumn, and winter are 0.500, 0.345, 0.492, and 0.633, respectively, which indicates again that the altitude differences between Te and To cause the biases. Moreover, in winter temperature, the elevation difference is the main factor that affects biases, which suggests that it is possible to reduce the bias by using an elevation correction model and further strengthen the reliability of ERA5-Land products. Other errors, such as in assimilation data, model system, and interpolation, are also possible factors that affect the bias (Zhao et al., 2020). The 2 m temperature in high altitude areas will be affected by the underlying surface, such as terrain complex, glaciers, and lakes, which also lead to errors. After analyzing the bias, correlation coefficients, and RMSE at all stations, we learn that smaller correlation coefficients, bigger bias, and bigger RMSE were found in those stations located within the QLM. In other words, the error between reanalysis data and observations is higher within the QLM than that in the oasis regions, which may be caused by the terrain complex within the QLM.
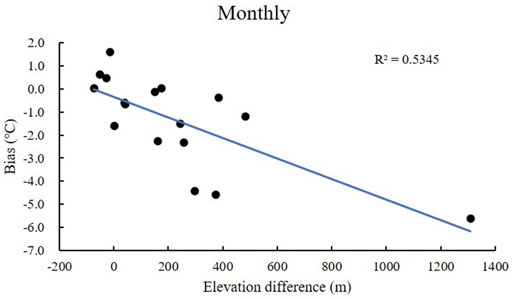
FIGURE 7. Relationship of bias and elevation differences between monthly observations and ERA5-Land during the 1979–2017 period.
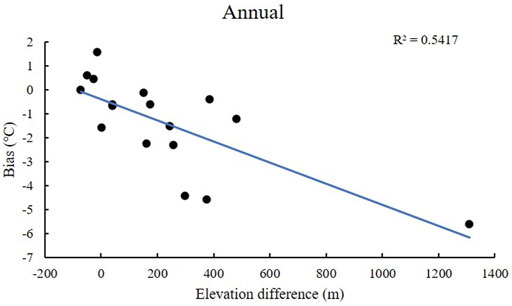
FIGURE 8. Relationship of bias and elevation differences between annual observations and ERA5-Land during the 1979–2017 period.
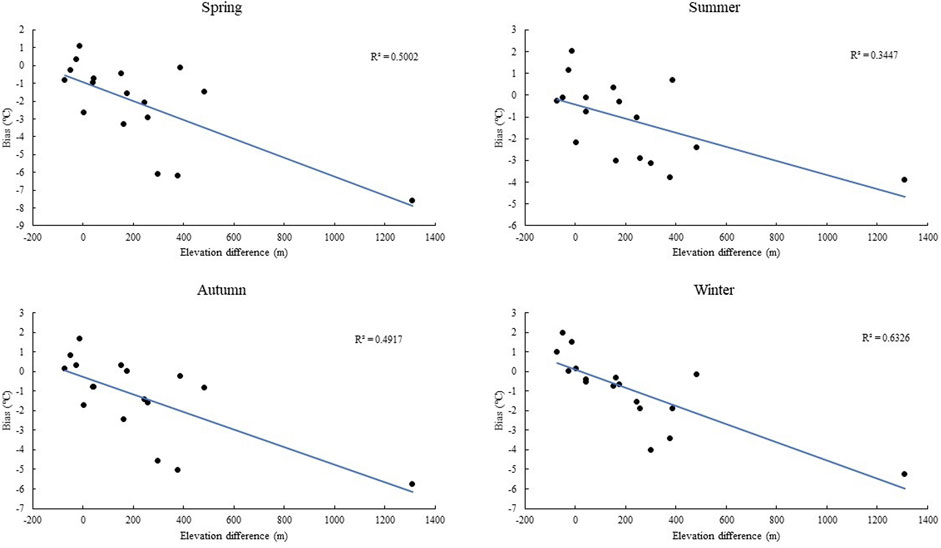
FIGURE 9. Relationship of bias and elevation differences between seasonal observations and ERA5-Land during the 1979–2017 period.
4 Conclusion
In this study, ERA5-Land temperatures (Te) are compared with observations (To) from 17 individual meteorological stations (To) over the QLM of China at different temporal scales. High monthly correlations from 0.978 to 0.998 indicate that ERA5-Land could capture the cycle for the individual sites very well. The biases changing from −5.6°C to 1.6°C are mainly caused by the elevation differences between the ERA5-Land grid points and the individual meteorological sites (R2 = 0.535). The results of this comparison suggest that Te could not be used directly in scientific studies because of the larger average RMSE of 2.2°C for all stations.
The seasonal and annual results of the comparison are similar to the monthly results. The average correlation coefficients for spring, summer, autumn, and winter are 0.874, 0.943, 0.739, and 0.786, respectively, indicating that ERA5-Land can capture the interannual variability of observations over the QLM. The averaged values of RMSE for spring, summer, autumn, and winter for all stations reach 2.4°C, 1.7°C, 1.9°C, and 1.8°C, respectively, which also suggests that caution should be taken seriously before using ERA5-Land temperature in scientific studies in the QLM. The biases in temperatures are mainly attributed to altitude differences between ERA5-Land grid points and observational sites, especially during the winter (R2 = 0.633). This indicates that errors between ERA5-Land and observations can be reduced by using the elevation correction method and further improved the quality of ERA5-Land reanalysis. The R2 values between bias and elevation differences in spring, summer, and autumn are 0.500, 0.345, and 0.492, respectively. An average correlation between Te and To on an annual scale for all stations reaches 0.854. The average annual RMSE between Te and To on an annual scale for all stations is 1.8°C, which also indicates that Te could not be used directly in scientific research. Zhao et al. (2020) found that the average RMSE between observational temperature and ERA-Interim temperature is 2.7°C in the QLM, which is larger than that of ERA5-Land in our study. Huai et al. (2021) found that ERA5 temperature products exhibit higher correlations with R values of >0.97 at all stations in the QLM, which is better than the results in our study.
A significant temperature-increasing rate (0.488°C/decade) is found over the QLM based on the To during 1979–2017. ERA5-Land can capture the warming trend well (0.379°C/decade). The largest warming rates are both found in summer for the observations (0.574°C/decade) and ERA5-Land (0.496°C/decade). In general, ERA5-Land is reliable for capturing the warming trend over the QLM.
Up to now, this evaluation has been limited to 17 meteorological stations ranging from 1000 to 3500 m. Further comparisons can be analyzed by using more meteorological stations located in the surrounding regions. It would be a meaningful attempt to evaluate other meteorological elements of ERA5-Land reanalysis data sets (e.g., precipitation and humidity) over the QLM.
Data Availability Statement
The raw data supporting the conclusions of this article will be made available by the authors, without undue reservation.
Author Contributions
ZP designed the study, collected the meteorological data, and wrote the article. ZH performed the final edit and provided fund support.
Funding
This study was supported by the Strategic Priority Research Program of the Chinese Academy of Sciences, No. XDA23060301, and the National Natural Science Foundation of China, No. 41621001.
Conflict of Interest
The authors declare that the research was conducted in the absence of any commercial or financial relationships that could be construed as a potential conflict of interest.
Publisher’s Note
All claims expressed in this article are solely those of the authors and do not necessarily represent those of their affiliated organizations, or those of the publisher, the editors, and the reviewers. Any product that may be evaluated in this article, or claim that may be made by its manufacturer, is not guaranteed or endorsed by the publisher.
References
Cao, B., Gruber, S., Zheng, D., and Li, X. (2020). The ERA5-Land Soil Temperature Bias in Permafrost Regions. Cryosphere 14, 2581–2595. doi:10.5194/tc-14-2581-2020
Cao, G., Fu, J., Li, L., Cao, S., Tang, Z., Jiang, G., et al. (2018). Analysis on Temporal and Spatial Variation Characteristics of Air Temperature in the South Slope of Mountains and its Nearby Regions During the Period from 1960 to 2014. Res. Soil Water Conservation 25, 88–96. (in Chinese). doi:10.13869/j.cnki.rswc.2018.03.014
Chen, Y., Sharma, S., Zhou, X., Yang, K., Li, X., Niu, X., et al. (2021). Spatial Performance of Multiple Reanalysis Precipitation Datasets on the Southern Slope of Central Himalaya. Atmos. Res. 250, 105365. doi:10.1016/j.atmosres.2020.105365
Fu, J., Cao, G., Li, L., Cao, S., Tang, Z., Jiang, G., et al. (2018). Spatiotemporal Variation of Air Temperature in the Middle and Eastern Parts of the Qilian Mountains and the Nearby Regions During the Period of 1960-2014. Arid Zone Res. 35, 549–561. (in Chinese). doi:10.13866/j.azr.2018.03.07
Gao, L., Hao, L., and Chen, X.-w. (2014). Evaluation of ERA-Interim Monthly Temperature Data Over the Tibetan Plateau. J. Mt. Sci. 11, 1154–1168. doi:10.1007/s11629-014-3013-5
Gao, L., Wei, J., Wang, L., Bernhardt, M., Schulz, K., and Chen, X. (2018). A High-Resolution Air Temperature Data Set for the Chinese Tian Shan in 1979-2016. Earth Syst. Sci. Data 10, 2097–2114. doi:10.5194/essd-10-2097-2018
Hong, T., Li, H., and Chen, M. (2021). Comprehensive Evaluations on the Error Characteristics of the State‐of‐the‐Art Gridded Precipitation Products Over Jiangxi Province in 2019. Earth Space Sci. 8, e2021EA001787. doi:10.1029/2021ea001787
Huai, B., Wang, J., Sun, W., Wang, Y., and Zhang, W. (2021). Evaluation of the Near-Surface Climate of the Recent Global Atmospheric Reanalysis for Qilian Mountains, Qinghai-Tibet Plateau. Atmos. Res. 250, 105401. doi:10.1016/j.atmosres.2020.105401
Jia, W. (2012). Seasonal Characteristics of Extreme Temperature Changes in Qilian Mountains and Hexi Corridor During Last Fifty Years. Sci. Geogr. Sin. 32, 1377–1383. (in Chinese). doi:10.13249/j.cnki.sgs.2012.11.020
Jiang, L., Tawia, H. D. F., and Yi, L. (2020). Global Land Surface Temperature Change (2003–2017) and its Relationship with Climate Drivers: AIRS, MODIS, and ERA5-Land Based Analysis. Remote Sens. 13, 44. doi:10.3390/rs13010044
Jiao, D., Xu, N., Yang, F., and Xu, K. (2021). Evaluation of Spatial-Temporal Variation Performance of ERA5 Precipitation Data in China. Sci. Rep. 11, 17956. doi:10.1038/s41598-021-97432-y
Joaquín, M. S., Emanuel, D., Anna, A. P., Clément, A., Gabriele, A., Gianpaolo, B., et al. (2021). ERA5-Land: A State-Of-The-Art Global Reanalysis Dataset for Land Applications. Earth Syst. Sci. Data 13, 4349–4383. doi:10.5194/essd-13-4349-2021
Konstantinos, S., George, V., Aikaterini, V., Anastasios, P., and Elias, D. (2021). Delineating the Relative Contribution of Climate Related Variables to Chlorophyll-A and Phytoplankton Biomass in Lakes Using the ERA5-Land Climate Reanalysis Data. Water Res. 196, 117053. doi:10.1016/j.watres.2021.117053
Lin, P., He, Z., Du, J., Chen, L., Zhu, X., and Li, J. (2017). Recent Changes in Daily Climate Extremes in an Arid Mountain Region, a Case Study in Northwestern China's Qilian Mountains. Sci. Rep. 7, 2245. doi:10.1038/s41598-017-02345-4
Liu, Z., Liu, Y., Wang, S., Yang, X., Wang, L., Baig, M. H. A., et al. (2018). Evaluation of Spatial and Temporal Performances of ERA-Interim Precipitation and Temperature in Mainland China. J. Clim. 31, 4347–4365. doi:10.1175/jcli-d-17-0212.1
Luis, R. C., and Johannes, S. (2020). Simulation of Multi-Annual Time Series of Solar Photovoltaic Power: Is the ERA5-Land Reanalysis the Next Big Step? Sustain. Energy Technol. Assessments 42, 100829. doi:10.1016/j.seta.2020.100829
Pelosi, A., and Chirico, B. (2021). Regional Assessment of Daily Reference Evapotranspiration: Can Ground Observations Be Replaced by Blending ERA5-Land Meteorological Reanalysis and CM-SAF Satellite-Based Radiation Data? Agric. Water Manag. 258, 107169. doi:10.1016/j.agwat.2021.107169
Pelosi, A., Terribile, F., D’Urso, G., and Chirico, G. B. (2020). Comparison of ERA5-Land and UERRA MESCAN-SURFEX Reanalysis Data with Spatially Interpolated Weather Observations for the Regional Assessment of Reference Evapotranspiration. Water 12, 1669. doi:10.3390/w12061669
Qian, D., Cao, G., Du, Y., Li, Q., and Guo, X. (2019). Impacts of Climate Change and Human Factors on Land Cover Change in Inland Mountain Protected Areas: a Case Study of the Qilian Mountain National Nature Reserve in China. Environ. Monit. Assess. 191, 486. doi:10.1007/s10661-019-7619-5
Sun, J., and Liu, Y. (2013). Drought Variations in the Middle Qilian Mountains, Northeast Tibetan Plateau, over the Last 450 Years as Reconstructed from Tree Rings. Dendrochronologia 31, 279–285. doi:10.1016/j.dendro.2012.07.004
The Alexander, M., and Gregor, B. (2020). Demystifying the Use of ERA5-Land and Machine Learning for Wind Power Forecasting. IET Renew. Power Gener. 14, 4159–4168. doi:10.1049/iet-rpg.2020.0576
Wang, L., Chen, R., Han, C., Wang, X., Liu, G., Song, Y., et al. (2019). Change Characteristics of Precipitation and Temperature in the Qilian Mountains and Hexi Oasis, Northwestern China. Environ. Earth Sci. 78, 284. doi:10.1007/s12665-019-8289-x
Wu, Z., Feng, H., He, H., Zhou, J., and Zhang, Y. (2021). Evaluation of Soil Moisture Climatology and Anomaly Components Derived From ERA5-Land and GLDAS-2.1 in China. Water Resour. Manage 35, 629–643. doi:10.1007/s11269-020-02743-w
Xin, Y., Lu, N., Jiang, H., Liu, Y., and Yao, L. (2021). Performance of ERA5 Reanalysis Precipitation Products in the Guangdong-Hong Kong-Macao Greater Bay Area, China. J. Hydrology 602, 126791. doi:10.1016/j.jhydrol.2021.126791
Xu, J., Ziqiang, M., Songkun, Y., and Jie, P. (2022). Do ERA5 and ERA5-Land Precipitation Estimates Outperform Satellite-Based Precipitation Products? A Comprehensive Comparison between State-Of-The-Art Model-Based and Satellite-Based Precipitation Products over Mainland China. J. Hydrology 605, 127353. doi:10.1016/j.jhydrol.2021.127353
Zhang, C., Mou, N., Niu, J., Zhang, L., and Liu, F. (2021). Spatio-Temporal Variation Characteristics of Snow Depth and Snow Cover Days over the Tibetan Plateau. Water 13, 307. doi:10.3390/w13030307
Zhang, Z., Zhang, B., Liu, Y., Jiang, X., and Zhang, Y. (2009). Variation Characteristics of Air Temperature and Precipitation in Mt. Qilian Region in Recent Half Century. J. Arid Land Resour. Environ. 23, 125–130. doi:10.13448/j.cnki.jalre.2009.04.014
Zhao, P., Gao, L., Wei, J., Ma, M., Deng, H., Gao, J., et al. (2020). Evaluation of ERA-Interim Air Temperature Data Over the Qilian Mountains of China. Adv. Meteorology 2020, 1–11. doi:10.1155/2020/7353482
Keywords: reanalysis, air temperature, ERA5-Land, Qilian Mountains, warming trend
Citation: Zhao P and He Z (2022) A First Evaluation of ERA5-Land Reanalysis Temperature Product Over the Chinese Qilian Mountains. Front. Earth Sci. 10:907730. doi: 10.3389/feart.2022.907730
Received: 30 March 2022; Accepted: 16 June 2022;
Published: 08 August 2022.
Edited by:
Domenico Capolongo, University of Bari Aldo Moro, ItalyReviewed by:
Weijun Sun, Shandong Normal University, ChinaAntonella Belmonte, National Research Council (IREA-CNR), Italy
Copyright © 2022 Zhao and He. This is an open-access article distributed under the terms of the Creative Commons Attribution License (CC BY). The use, distribution or reproduction in other forums is permitted, provided the original author(s) and the copyright owner(s) are credited and that the original publication in this journal is cited, in accordance with accepted academic practice. No use, distribution or reproduction is permitted which does not comply with these terms.
*Correspondence: Zhibin He, hzbmail@lzb.ac.cn