The Helium and Carbon Isotope Characteristics of the Andean Convergent Margin
 P. H. Barry1*
  J. M. De Moor2,3
  A. Chiodi4
  F. Aguilera5,6
  M. R. Hudak1 D. V. Bekaert1
  S. J. Turner7 J. Curtice1 A. M. Seltzer1
  G. L. Jessen8,9
  E. Osses8
  J. M. Blamey10
  M. J. Amenábar10
  M. Selci11
  M. Cascone11 A. Bastianoni11
  M. Nakagawa12
  R. Filipovich4
  E. Bustos4
  M. O. Schrenk13
  J. Buongiorno14
  C. J. Ramírez15
  T. J. Rogers16
  K. G. Lloyd16
  D. Giovannelli1,11,12,17
- 1Marine Chemistry and Geochemistry Department, Woods Hole Oceanographic Institution, Woods Hole, MA, United States
- 2Observatorio Vulcanológico y Sismológico de Costa Rica (OVSICORI), Universidad Nacional, San Jose, Costa Rica
- 3Department of Earth and Planetary Sciences, University of New Mexico, Albuquerque, NM, United States
- 4Instituto de Bio y Geociencias del NOA (IBIGEO, UNSa-CONICET), Salta, Argentina
- 5Millennium Institute on Volcanic Risk Research—Ckelar Volcanoes, Antofagasta, Chile
- 6Departamento de Ciencias Geológicas, Universidad Católica del Norte, Antofagasta, Chile
- 7Department of Geosciences, University of Massachusetts Amherst, Amherst, MA, United States
- 8Instituto de Ciencias Marinas y Limnológicas, Universidad Austral de Chile, Valdivia, Chile
- 9Centro de Investigación Oceanográfica COPAS COASTAL, Universidad de Concepción, Concepción, Chile
- 10Fundación Biociencia, Universidad de Santiago de Chile, Santiago, Chile
- 11Department of Biology, University of Naples “Federico II”, Naples, Italy
- 12Earth-Life Science Institute, Tokyo Institute of Technology, Tokyo, Japan
- 13Department of Earth and Environmental Sciences, Michigan State University, East Lansing, MI, United States
- 14Division of Natural Sciences, Maryville College, Maryville, TN, United States
- 15Servicio Geológico Ambiental (SeGeoAm), Heredia, Costa Rica
- 16Department of Microbiology, University of Tennessee, Knoxville, TN, United States
- 17National Research Council, Institute of Marine Biological Resources and Biotechnologies—CNR-IRBIM, Ancona, Italy
Subduction zones represent the interface between Earth’s interior (crust and mantle) and exterior (atmosphere and oceans), where carbon and other volatile elements are actively cycled between Earth reservoirs by plate tectonics. Helium is a sensitive tracer of volatile sources and can be used to deconvolute mantle and crustal sources in arcs; however it is not thought to be recycled into the mantle by subduction processes. In contrast, carbon is readily recycled, mostly in the form of carbon-rich sediments, and can thus be used to understand volatile delivery via subduction. Further, carbon is chemically-reactive and isotope fractionation can be used to determine the main processes controlling volatile movements within arc systems. Here, we report helium isotope and abundance data for 42 deeply-sourced fluid and gas samples from the Central Volcanic Zone (CVZ) and Southern Volcanic Zone (SVZ) of the Andean Convergent Margin (ACM). Data are used to assess the influence of subduction parameters (e.g., crustal thickness, subduction inputs, and convergence rate) on the composition of volatiles in surface volcanic fluid and gas emissions. He isotopes from the CVZ backarc range from 0.1 to 2.6 RA (n = 23), with the highest values in the Puna and the lowest in the Sub-Andean foreland fold-and-thrust belt. Atmosphere-corrected He isotopes from the SVZ range from 0.7 to 5.0 RA (n = 19). Taken together, these data reveal a clear southeastward increase in 3He/4He, with the highest values (in the SVZ) falling below the nominal range associated with pure upper mantle helium (8 ± 1 RA), approaching the mean He isotope value for arc gases of (5.4 ± 1.9 RA). Notably, the lowest values are found in the CVZ, suggesting more significant crustal inputs (i.e., assimilation of 4He) to the helium budget. The crustal thickness in the CVZ (up to 70 km) is significantly larger than in the SVZ, where it is just ∼40 km. We suggest that crustal thickness exerts a primary control on the extent of fluid-crust interaction, as helium and other volatiles rise through the upper plate in the ACM. We also report carbon isotopes from (n = 11) sites in the CVZ, where δ13C varies between −15.3‰ and −1.2‰ [vs. Vienna Pee Dee Belemnite (VPDB)] and CO2/3He values that vary by over two orders of magnitude (6.9 × 10⁸–1.7 × 10¹¹). In the SVZ, carbon isotope ratios are also reported from (n = 13) sites and vary between −17.2‰ and −4.1‰. CO2/3He values vary by over four orders of magnitude (4.7 × 10⁷–1.7 × 10¹²). Low δ13C and CO2/3He values are consistent with CO2 removal (e.g., calcite precipitation and gas dissolution) in shallow hydrothermal systems. Carbon isotope fractionation modeling suggests that calcite precipitation occurs at temperatures coincident with the upper temperature limit for life (122°C), suggesting that biology may play a role in C-He systematics of arc-related volcanic fluid and gas emissions.
1 Introduction
Helium has two stable isotopes: 3He and 4He. 3He is primordial and has been stored in the mantle since Earth’s accretion, whereas 4He is continuously produced in Earth’s crust due to the radioactive decay of U and Th. Earth reservoirs have characteristic 3He/4He values (typically reported relative to air; RA = air 3He/4He = 1.382 × 10⁻⁶; Clarke et al., 1976; Mabry et al., 2013). For example, the upper mantle typically has a 3He/4He value that is ∼8 ± 1 times the atmospheric ratio (RA; Graham, 2002). The continental lithospheric mantle has lower 3He/4He, approximately 6.1 ± 2.1 RA (Dunai and Baur, 1995; Gautheron and Moreira, 2002; Day et al., 2015), presumably due to radiogenic addition from the U and Th rich lithosphere. Crustal material is dominated by radiogenic 4He production and has a 3He/4He = 0.05 RA (Andrews, 1985). The mean He isotope ratio for arc gases is ∼5.4 ± 1.9 RA (Hilton et al., 2002), likely reflecting radiogenic additions from the surrounding crust. As a result, the 3He/4He in geothermal fluids provides information about the origin of volatiles (i.e., mantle vs. crust derived).
High CO2 concentrations have been observed in volcanic arcs as well as in other volcanic regions with high heat flow and mantle partial melting (e.g., Hilton and Porcelli, 2003). Typically, C isotopes of CO2 in volcanic arcs are interpreted to be an admixture between magmatic sources [mantle δ13C is between −5‰ and −8‰ vs. Vienna Pee Dee Belemnite (VPDB); Javoy et al., 1986] and subduction inputs (Sano and Marty, 1995), which can vary from 0‰ in marine carbonates down to ∼−30‰ in organic carbon-rich sediments (Hayes et al., 1999; Plank and Manning, 2019). Together, 3He/4He, CO2/3He, and C isotopes of CO2 can be used to determine the volatile provenance of gas and fluid emissions (Sano and Marty, 1995), as well as secondary processes that affect emissions (e.g., Barry et al., 2019a).
Several prior studies have characterized He-C isotope systematics in volcanic and geothermal systems in the Andes (Figure 1; e.g., Hilton et al., 1993; Hoke et al., 1994; Varekamp et al., 2006; Sepúlveda et al., 2007; Aguilera, 2008; Ray et al., 2009; Tassi et al., 2009; Tassi et al., 2010; Capaccioni et al., 2011; Tassi et al., 2011; Aguilera et al., 2012; Agusto et al., 2013; Benavente et al., 2013; Chiodi et al., 2015; Aguilera et al., 2016; Benavente et al., 2016; Roulleau et al., 2016; Tardani et al., 2016; Tassi et al., 2016; Arnold et al., 2017; Tassi et al., 2017; Lopez et al., 2018; Chiodi et al., 2019; Arnold et al., 2020; Inostroza et al., 2020; Robidoux et al., 2020; Lages et al., 2021; Tardani et al., 2021; Filipovich et al., 2022) to understand the source of the volcanic fluid and gas emissions. These studies demonstrate the co-occurrence of mantle (3He/4He up to ∼8 RA) and crustal (3He/4He ∼0.05 RA) He sources. In this contribution, we report new fluid and gas He-C isotope and relative abundance data, which we combine with previously published data to determine the extent of magmatic vs. crustal contributions across the Andean Convergent Margin (ACM). One of the main objectives of this study is to compare He-C systematics in the Central Volcanic Zone (CVZ) and the Southern Volcanic Zone (SVZ) regions in order to assess the influence of subduction parameters (e.g., crustal thickness, subduction inputs, convergence rate) on the composition of volatiles emitted at the surface. Determining volatile pathways is fundamental for ascertaining the dominant processes in each volcanic region as well as for differentiating volcanic source features from secondary modification processes (e.g., gas dissolution, calcite precipitation and/or crustal assimilation).
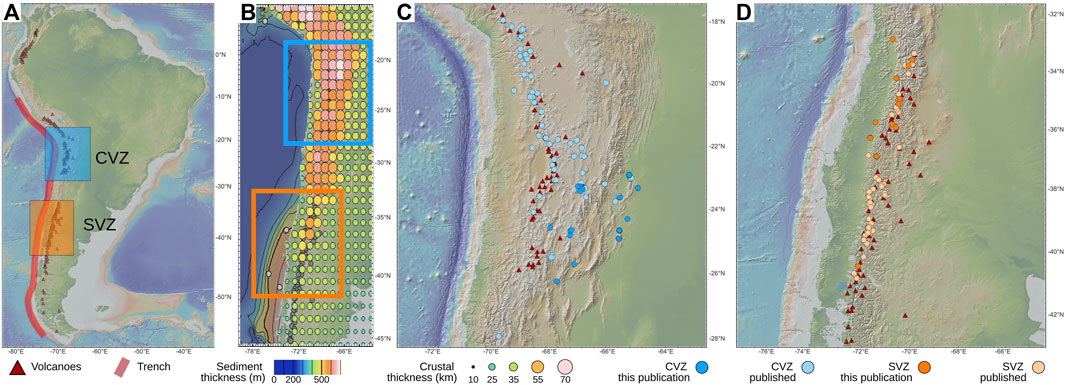
FIGURE 1. Map sampling locations and subduction parameters. (A) Map of South America showing the relative location of the two sampling locations: the Central Volcanic Zone (CVZ) and the Southern Volcanic Zone (SVZ), which span across the ACM in Chile and Argentina. (B) Map showing offshore sediment thickness (see color bar) and crustal thickness (dot sizes) in the overriding plate. (C) Zoomed in view of the CVZ, with the location of all samples from this study (bright blue circles) and previously published studies (light blue circles) as well as the location of volcanic centers (red triangles). (D) Zoomed in view of the SVZ, with the location of all samples from this study (bright orange circles) and previously published studies (light orange circles) as well as the location of volcanic centers (red triangles). Published data are from Hilton et al. (1993), Hoke et al. (1994), Varekamp et al. (2006), Sepúlveda et al. (2007), Aguilera (2008), Ray et al. (2009), Tassi et al. (2009), Tassi et al. (2010), Capaccioni et al. (2011), Tassi et al. (2011), Aguilera et al. (2012), Agusto et al. (2013), Benavente et al. (2013), Chiodi et al. (2015), Aguilera et al. (2016), Benavente et al. (2016), Roulleau et al. (2016), Tardani et al. (2016), Tassi et al. (2016), Arnold et al. (2017), Tassi et al. (2017), Lopez et al. (2018), Chiodi et al. (2019), Arnold et al. (2020), Inostroza et al. (2020), Robidoux et al. (2020), Lages et al. (2021), Tardani et al. (2021), Filipovich et al. (2022) in this figure, as well as in subsequent figures.
2 Geological Background
Subduction of the Nazca Plate beneath the South America Plate resulted in the formation of the ACM and the South American Volcanic Arc (Dewey and Bird, 1970; James, 1971; Jordan et al., 1983). The ACM accounts for about 17% of the total length of the “Ring of Fire” and active volcanism occurs within three main segments: 1) the Northern Volcanic Zone (5°N–2°S), 2) Central Volcanic Zone (20°S–27°S), and 3) Southern Volcanic Zone (33°S–39°S) (Thorpe and Francis, 1979; Thorpe, 1982; Harmon et al., 1984; Ray et al., 2009). A fourth segment (Austral Volcanic Zone; 49°S–55°S) is located in the southernmost part of South America, and is related to the subduction of the Antarctica plate under the South American Plate (Stern, 2004). These are separated by gaps in magmatism associated with ridge subduction (the Nazca Ridge, to the north of the CVZ, and the Juan Fernandez Ridge, to the south) and shallow slab angles (e.g., Kay and Mpodozis, 2002; Newell et al., 2015). The current phase of subduction of the Nazca plate beneath the northern Andes began about 80 Myr ago (Ma) and propagated southwards reaching the SVZ about 55 Myr ago (Chen et al., 2019). The subducting plate is slightly older in the CVZ compared with the SVZ region (∼45 Ma vs. 30 Ma; Syracuse and Abers, 2006), whereas the angle of subduction is slightly shallower (24° in the CVZ vs. 28° in the SVZ).
The CVZ is primarily composed of andesitic stratovolcanoes, which erupted from the Neogene until historic times (Robidoux et al., 2020). Crustal thickness varies drastically along this north to south transect, from ∼30 to 70 km. The depth of the Benioff zone beneath the arc front varies from 80 to 120 km. Convergence rates are 7–9 cm/year on average (DeMets et al., 2010). Sediments are delivered to the arc at the trench and sediment thickness also varies significantly from north to south, with the CVZ being sediment-poor compared to the SVZ (Figure 1B) (Völker et al., 2013; Clift, 2017; Lages et al., 2021).
Volcanic activity in the CVZ consist mostly of andesites and dacites which have trace element and radiogenic isotope compositions (e.g., 87Sr/86Sr and 143Nd/144Nd) consistent with nearly ubiquitous contamination during their prolonged ascent through the thick (∼70 km; Thorpe, 1982) continental crust (De Silva, 1989; Mamani et al., 2010; Godoy et al., 2019). Hydrothermal activity occurs throughout the CVZ, expressed as major geothermal fields and intermittent thermal springs, particularly in the vicinity of volcanic centers such as Taapaca, Guallatiri, Isluga, and Putana (Tassi et al., 2010).
The SVZ extends from central to southern Chile-Argentina. It is composed of numerous stratovolcanoes and monogenetic cones (López-Escobar et al., 1995). The crust is significantly thinner in the SVZ compared to the CVZ, increasing from only ∼30 km in the southernmost region to ∼50 km near the northern segment terminus (Tassara and Echaurren, 2012), however there are several carbon-rich sedimentary basins (e.g., Neuquén Basin) adjacent to the SVZ (Howell et al., 2005). SVZ volcanic compositions consist mostly of basalts and andesites, though basaltic compositions become less common as crustal thickness increases (Tormey et al., 1991). Radiogenic isotope compositions of SVZ volcanics are variable and have been largely attributed to variations in mantle components where the crust is thin, with both mantle and crustal contributions apparent among more differentiated lavas in the north, where the crust is thicker (Jacques et al., 2014; Turner et al., 2017; Wieser et al., 2019). Hydrothermal activity is widespread in the SVZ due to high geothermal gradients, ongoing magmatic activity, permeable host rocks and abundant recharge (Ray et al., 2009).
3 Materials and Methods
3.1 Sample Collection
Gas and water samples in this study were collected at subaerial hot and warm springs, natural gas seeps and fumaroles using standard inverted funnel sampling techniques (e.g., Hilton et al., 2002; Barry et al., 2013). Gases and fluids were first flushed through silicone tubing and into 3/8-inch copper tubes (Weiss, 1968). After ample flushing (i.e., approximately 10x the volume of the tubing), stainless steel clamps were closed on each end of the copper tubes, trapping the sample inside of the copper tubing, between the clamps (e.g., Barry et al., 2016). Gas seeps with low flow rates required >1 h of flushing to effectively remove any air from the system. To ensure no back flow of air into the sampling apparatus, the outflow portion of the silicon tubing was submerged in a bottle of water, allowing gas to flow only in one direction (i.e., through the sampling apparatus).
Gases from bubbling springs were also collected using the water-displacement method (e.g., Craig, 1953; Mazor and Wasserburg, 1965). In brief, a funnel was submerged in a spring and the entire sampling apparatus (i.e., funnel, silicone tubing and copper tube) was initially filled with spring water. The funnel was then inverted and placed over the rising gas bubbles. As the bubbles of gas were captured, they slowly displaced the water in the copper tube. Once all water was displaced by sample gas, the stainless steel clamps were closed in the same way as described above. This technique is particularly useful in low flow gas seeps, where prohibitively long flushing times would be required (e.g., Kimani et al., 2021; Mtili et al., 2021). Water samples require minimal flushing and can often be collected in a matter of minutes. Gas samples were also collected using standard Giggenbach bottle methods (Giggenbach et al., 1989) for C isotope analysis and CO2/3He determination. Giggenbach bottles were collected from the same tubing used for Cu-tubes and thus flushed in the same way as described above. Giggenbach bottle samples were not collected in the SVZ and samples for C isotopes and CO2 concentrations were instead collected by injecting gas into previously evacuated 120 ml septum vials using a three-way valve and 60 ml syringe.
Geothermal samples were collected from 33 geographically distinct localities (Table 1) in the SVZ and CVZ between 2019–2021. A total of 44 samples (29 gas, 15 water) were analyzed for He and/or C isotopes and abundances, 23 from the CVZ and 21 from the SVZ, including duplicates and triplicates. The temperature, pH, and salinity of each sampling site were obtained using a portable YSI Plus 6-Series Sonde Multimeter (YSI Incorporated, Yellow Springs, OH, United States) and are reported alongside He-C data in Table 1.
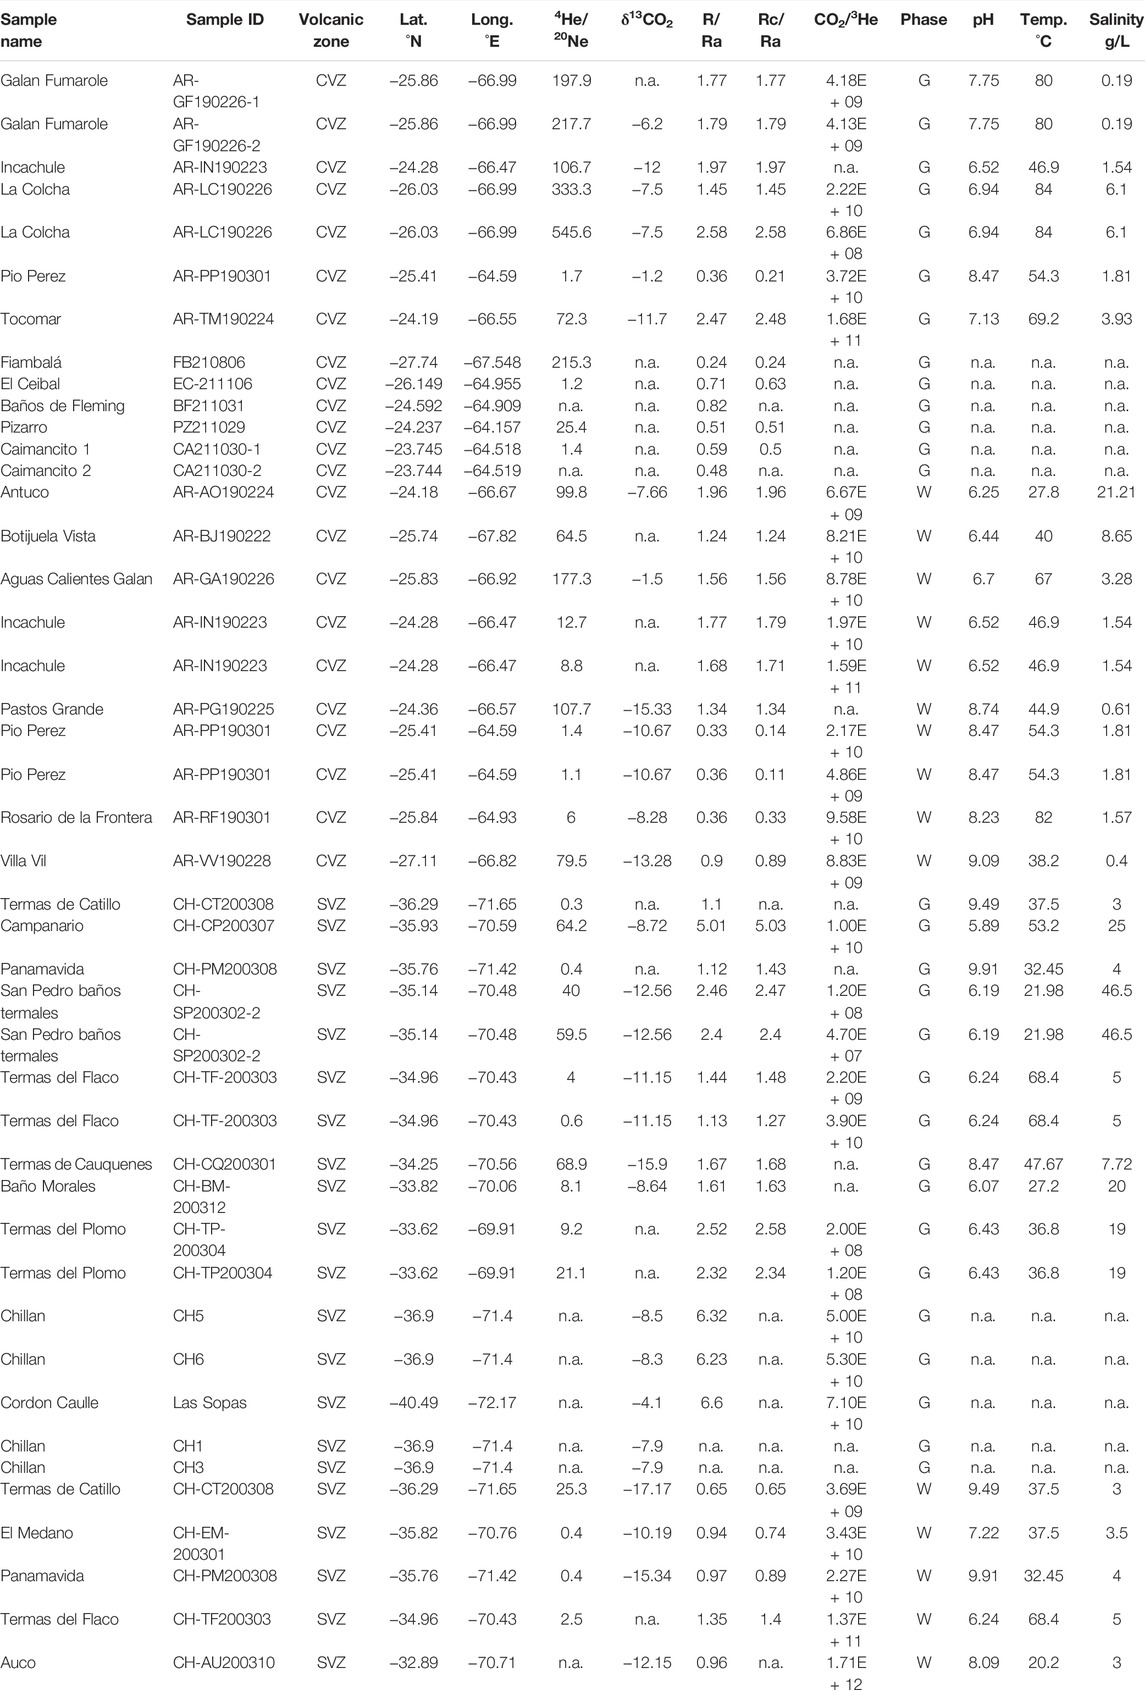
TABLE 1. Helium and carbon isotope and abundance ratios for newly reported data (this study). 1-sigma uncertainties are less than 5% for 4He/20Ne, R/RA, RC/RA, δ13C, and CO2/3He. The abbreviation n.a., not available.
3.2 Analytical Techniques
Noble gas analyses were conducted in the Barry Lab at Woods Hole Oceanographic Institution (WHOI) using a Nu Instruments multi-collector Noblesse HR mass spectrometer. The Noblesse has the capability to determine the isotope ratios of all 26 stable noble gases, with mass separation between all carbon-based interferences and Ar, as well as 40Ar++ interferences with 20Ne+. It has a unique zoom optics system that allows for instantaneous switching between different isotope sets. The zoom optics permit the detectors to be fixed, greatly enhancing stability. The sensitivity and resolving power are also adjusted without the complexity of a movable source slit. The instrument is interfaced to a noble gas processing and purification inlet system that is fully automated and allows all of the noble gases to be isolated prior to their inlet into the mass spectrometer.
Carbon isotopes were measured in three laboratories in total: Observatorio Vulcanológico y Sismológico de Costa Rica (OVSICORI) at Universidad Nacional, Costa Rica, University of Naples “Federico II,” Naples, Italy and the Earth-Life Science Institute, Tokyo Institute for Technology, Tokyo, Japan. Details are in Section 3.2.3.
3.2.1 Gas Sample Noble Gas Purification
Copper tube samples were connected to the extraction line using an O-ring connection and ∼5 cm3 of gas was expanded into the cleanup line. The pressure was measured using a capacitance manometer and then a small aliquot of gas was expanded into the cleanup portion of the line. Reactive gases were chemically removed by exposing gases to a titanium sponge held at 650°C. The titanium sponge was then cooled for 10 min to room temperature in order to getter hydrogen before gases were expanded to a dual hot (SAES ST707) and cold (SAES ST707) getter system, held at 250°C and room temperature, respectively. Another small aliquot of gas was then segregated for preliminary analysis on a quadrupole mass spectrometer (QMS). Noble gases were separated using a series of cryogenic traps, cooled using helium compressors. The heavy noble gases (Ar–Kr–Xe) were adsorbed at 30 K onto a nude stainless steel trap and He and Ne were adsorbed at 10 K on a charcoal trap. The temperature of the charcoal trap was then raised to 30 K, releasing only He, which was then inlet into the Noblesse mass spectrometer. Following He abundance and isotope determination, the temperature on the charcoal cryogenic trap was raised to 80 K for 15 min to release Ne, which was inlet into the Noblesse mass spectrometer. Following Ne isotope measurement, the nude and charcoal cryogenic traps were raised to 300 K for cleanup. Air-standards were analyzed daily from an air cylinder collected on the roof of the Clark Laboratory building on WHOI’s Quissett campus on 15 September 2020. Air-standards are fully automated and run overnight, following sample analysis during the day. Air-standards were run for He and Ne using an identical method to the one employed for samples. Air-standards were measured over a concentration range which spanned two orders of magnitude, to account for any non-linearity of the system. Full procedural blanks were run weekly; average (mean) 4He blanks and 20Ne blanks were less than 5% of the sample size. Doubly-charged 40Ar++ was monitored but because it can be resolved from 20Ne, no correction was applied. Likewise, no CO2++ correction was applied to 22Ne, because CO2 backgrounds were at the detection limit and thus corrections were considered insignificant.
3.2.2 Water Sample Noble Gas Purification Protocol
Water samples were processed on the same extraction line as gas samples; however the inlet procedure was slightly different. Cu tube samples were interfaced to the extraction system in an identical fashion. Approximately 13 ml of water was inlet and then degassed under vacuum using a magnetic stirrer in a glass bulb beneath the Cu tube inlet area. Noble gases were then quantitatively transferred into a smaller volume using the capillary method (Beyerle et al., 2000; Hunt, 2015; Tyne et al., 2019). Water vapor in the extraction line was cryogenically drawn across a capillary towards a stainless-steel cold trap cooled to liquid nitrogen temperature (−196°C). The consistent flow of water vapor towards the colder water trap effectively entrains the noble gases and quantitatively draws them into the cold trap, along with a small portion of the water vapor. The consistency of this flow prevents any backflow of noble gases, such that they are quantitatively transferred into this cold trap volume (Beyerle et al., 2000). He and Ne were then inlet into the purification portion of the line (i.e., with Ti and SAES getters) for cleanup and noble gas separation in an analogous fashion to what is described above for gas samples.
3.2.3 Carbon Isotope Analysis
Carbon isotope compositions of gas samples were analyzed at OVSICORI (Universidad Nacional, Heredia, Costa Rica) on a Picarro G2201-i. The 2019 samples were analyzed by the same methodology as that described in Barry et al. (2019a) on oxidized NaOH solution from Giggenbach bottles. The samples from 2020 were analyzed as gas phase samples collected in previously evacuated 120 ml septum vials and analyzed using methodology similar to that described in Malowany et al. (2017). Samples and gas phase standards were quantitatively diluted in ultra-high purity (UHP) N2 using a 2 L gas syringe and transferred into a 2 L flexfoil bag which was then attached to the inlet of the Picarro. A 20 cm copper tube filled with copper wire was placed in line between the bag and the inlet of the Picarro to remove H2S, which can create significant interference on the carbon isotope measurements of CO2 (Malowany et al., 2015). δ13C (vs. VPDB) values were calibrated against a set of in house gas standards with δ13C values of −15.6‰, −3.8‰, and −8.3‰. Repeat analyses of standards yielded uncertainties of <0.3‰.
Carbon isotopes on dissolved inorganic carbon (DIC) were analyzed at the Giovannelli Lab at the University of Naples “Federico II” (Naples, Italy) and at the Earth-Life Science Institute (Tokyo, Japan). Fluid samples were collected at the spring source in the field using sterile 50 ml syringes. Samples were filtered through a 0.22 µm filter (Millipore) and directly injected into a pre-vacuumed 50 ml serum bottle sealed with butyl rubber septa and an aluminum crimp. DIC concentrations and δ13C values were measured using CO2 in the headspace of glass vials after a 3 h reaction with injected 0.5 ml H3PO4. The amount of CO2 and the isotopic values were measured using an Elementar IsoFlow attached to a PrecisION IRMS (at the University of Naples Federico II) and using an Agilent 6890N gas chromatograph attached to a Thermo-Finnigan Delta XPPlus (at the Earth-Life Science Institute). Two international standards (δ13C = −13.90‰ and 2.52‰) were used for standardization, and the standard deviations were obtained from more than three measurements. To ensure comparable results, three calibrated internal laboratory standards were run independently, and their results were within the standard error of the standard ± 0.1‰.
3.2.4 Data Analysis and Visualization
Data were plotted using the R Statistical software (R 4.1.2, https://www.r-project.org/) and the ggplot2 (Wickham, 2016) and ggtern package (Hamilton and Ferry, 2018). The dataset composed of both the newly obtained measurements and the compilation from the literature together with the R code to reproduce the plots have been permanently archived on Zenodo at DOI: 10.5281/zenodo.6360624 (https://doi.org/10.5281/zenodo.6360624). The remaining figures have been produced using GeoMapApp (http://www.geomapapp.org, Ryan et al., 2009) and Inkscape (https://inkscape.org/).
4 Results
Helium (Figure 2) and carbon isotopic and relative abundance ratios (Figure 3) are reported in Table 1. For comparison, we also compile data from a number of previous studies (Hilton et al., 1993; Hoke et al., 1994; Varekamp et al., 2006; Sepúlveda et al., 2007; Aguilera, 2008; Ray et al., 2009; Tassi et al., 2009; Tassi et al., 2010; Tassi et al., 2011; Capaccioni et al., 2011; Aguilera et al., 2012; Agusto et al., 2013; Benavente et al., 2013; Chiodi et al., 2015; Aguilera et al., 2016; Benavente et al., 2016; Roulleau et al., 2016; Tardani et al., 2016; Tassi et al., 2016; Tassi et al., 2017; Arnold et al., 2017; Lopez et al., 2018; Chiodi et al., 2019; Arnold et al., 2020; Inostroza et al., 2020; Robidoux et al., 2020; Tardani et al., 2021; Lages et al., 2021; Filipovich et al., 2022; Supplementary Table S1). We also compute and report estimates of subduction and mantle derived inputs, after Sano and Marty (1995) (Table 2).
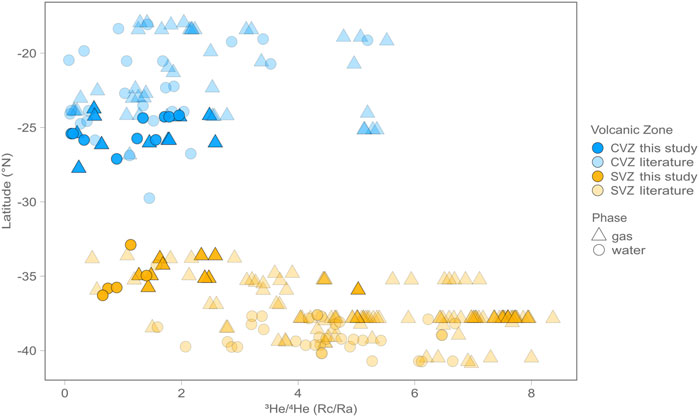
FIGURE 2. Latitude versus air-corrected 3He/4He (RC/RA) values for gas (triangles) and water (circles) phase samples. Data from this study are shown as bright symbols, whereas data from previously published studies are represented by lighter colored symbols. On average CVZ samples have lower 3He/4He than SVZ samples, suggesting a larger crustal assimilation signature in the CVZ and a more pristine mantle signature in the SVZ.
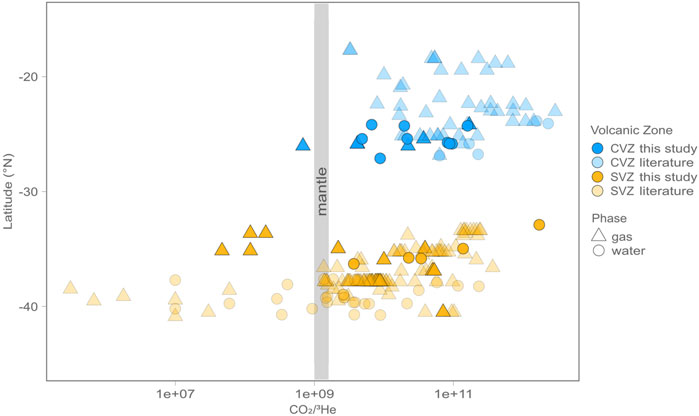
FIGURE 3. Latitude versus CO2/3He for gas (triangles) and water (circles) phase samples. Data from this study are shown in bright colors, whereas data from previously published studies are lighter in color. On average CVZ samples have higher CO2/3He than SVZ samples, suggesting a larger subduction derived and/or crustal assimilation signature in the CVZ, and a more pristine mantle signature in the SVZ.
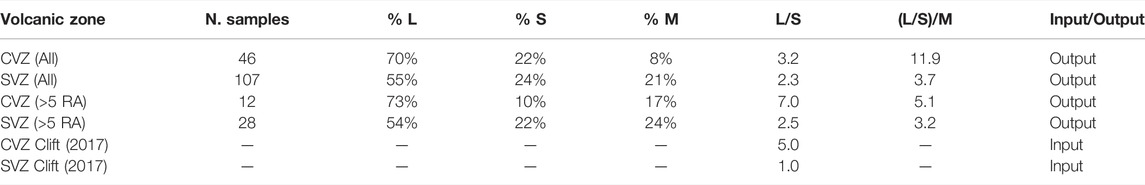
TABLE 2. Average carbon source (LSM) estimations from Eqs 5, 6, 7. Calculations were done for all gas samples compiled here as well as for samples with high He isotopes only (>5RA). These calculations assume He–CO2 characteristics (relative abundances and δ13C systematics) can be used to resolve CO2 contribution from three distinct sources: limestone (L) from subducted sediment and mineralized within slab basement, sedimentary (organic) carbon (S) from subducted sediment, and the mantle wedge (M). Each source is assumed to have a distinctive CO2/3He (M = 2 × 10⁹; L = 1 × 10¹³; S = 1 × 10¹³) and δ13C (M = −5‰; L = 0‰; S = −30‰) signature. For reference, we also show the Clift (2017) estimates for inorganic to organic (L/S) carbon ratios in the bottom two rows.
4.1 Helium Isotope (3He/4He)
Helium isotope results (3He/4He of sample = R) from this study are reported relative to air (RA), corrected for the occurrence of atmospheric He (to RC/RA) and blank contributions, which are consistently less than 5%. The 4He/20Ne value is used to apply an atmospheric correction to all samples, assuming 20Ne is derived from air (4He/20Ne = 0.32) or air saturated water (4He/20Ne = 0.26 at 15°C; Ozima and Podosek, 2002; Hilton, 1996). As such, the atmospheric He contribution can be calculated and then subtracted from the measured value (details and equations are given in Section 5.1). Notably, air corrections are small due to the fact that air contains only trace amounts of helium. 4He/20Ne values from this study are overlapping and vary by over four orders of magnitude in CVZ samples (Table 1; Figure 4) and by nearly three orders of magnitude in SVZ samples, with the highest values occurring in gas-phase samples. SVZ samples have the largest mantle contribution, whereas CVZ samples are dominated by radiogenic helium. We note duplicate sample analyses (i.e., same phase and locality) are in good agreement with respect to He isotopes; they deviate by less than 0.5 RA for all samples except La Colcha, where duplicates vary by 1.13 RA. In cases where there is a significant difference between He isotopes in duplicates we take the value with the highest 4He/20Ne to be most robust, because it indicates the lowest level of air contamination which is likely the culprit of any disagreement.
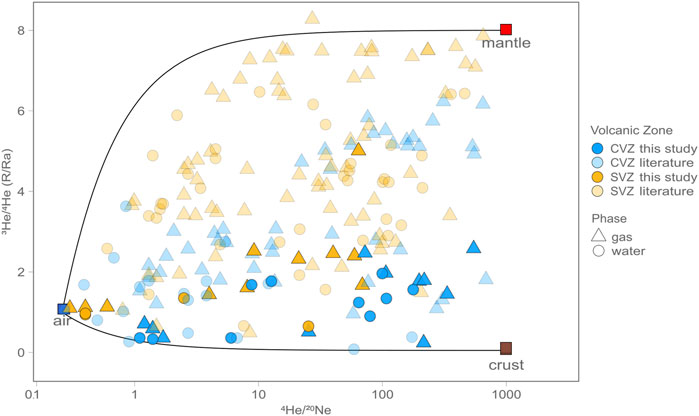
FIGURE 4. Helium isotopes (3He/4He) vs. 4He/20Ne for gas (triangles) and water (circles) phase samples. Nearly all samples can be explained by three component mixing between air (blue square), mantle (red square) and crust (brown square). On average SVZ samples require more mantle contributions than CVZ samples, which display more radiogenic/crustal features.
Across the CVZ, air-corrected helium isotope ratios range from 0.1 RA to 2.6 RA, and are slightly lower (more radiogenic) than recent reports of He isotopes from fluids and gases within the region (which range from 0.1 RA to 5.5 RA; Supplementary Table S1). Across the SVZ, air-corrected helium isotope ratios range from 0.7 RA to 5.0 RA, and are also generally lower (more radiogenic) than recent reports of He isotopes from the region (Agusto et al., 2013; Benavente et al., 2013; Roulleau et al., 2016; Tardani et al., 2016; Tassi et al., 2017; Lages et al., 2021; Tardani et al., 2021) which range from 0.5 RA to 8.4 RA (Supplementary Table S1).
Variations in He isotope (RC/RA) values are apparent between the CZV and SVZ, as well as within each region. These variations are most apparent when plotted against Lithosphere Asthenosphere Boundary (LAB) depths at each sample site (Figure 5), according to the model of Tassara and Echaurren (2012). High He isotope (RC/RA) values in each region occur where LAB depths are lowest. Though this result may in part reflect thin LAB model anomalies along the arc axis that arise due to high heat flow in regions of active volcanism, the correlation also persists across the entire data range. In summary, the most prominent characteristic of CVZ and SVZ helium isotope results is that all samples are characterized by an admixture of mantle and radiogenic (i.e., crustal) contributions. The highest values from this study plot well below the nominal range of values associated with upper mantle helium (8 ± 1 RA) whereas the lowest ratios are approaching the radiogenic He production ratio (0.05 RA) (e.g., Morrison and Pine, 1955). Lages et al. (2021) recently pointed out that He isotopes from fluid inclusion lava data retain higher He isotope values on average compared to the gas and water phase data presented here.
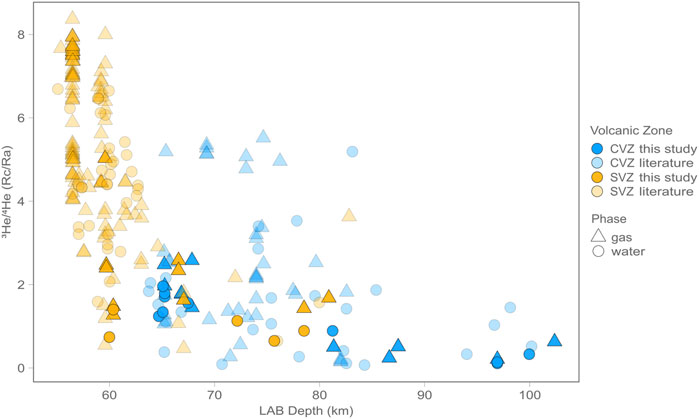
FIGURE 5. Helium isotopes vs. Lithosphere Asthenosphere Boundary (LAB) depths according to the model of Tassara and Echaurren (2012) for gas (triangles) and water (circles) phase samples. Notably there is a negative correlation between He isotopes (RC/RA)and LAB depth.
4.2 Carbon Isotopes [δ13C (CO2)]
C-isotope ratios (δ13C) range from −15.3‰ to −1.2‰ (versus VPDB) within CVZ samples, and from −17.2‰ to −4.1‰ (versus VPDB) within SVZ samples. On average, CVZ samples have higher δ13C values (average = −8.7‰) compared to SVZ samples (average = −10.8‰).
4.3 CO2/3He Values
CO2/3He values vary over two orders of magnitude in CVZ samples, from ∼6.9 × 10⁸ (below MORB-like at 2 × 10⁹) to higher values (∼1.7 × 10¹¹) typically associated with input from crustal lithologies (e.g., O’nions and Oxburgh, 1988). The high CO2/3He values are consistent with either subducted carbon contributions and/or crustal assimilation upon fluid ascent and storage in the crust (Figure 6). CO2/3He varies by nearly five orders of magnitude in SVZ samples, from ∼4.7 × 10⁷ (well below MORB-like) to higher values (∼1.7 × 10¹²), well above the MORB range. The low CO2/3He values in the SVZ suggest that carbon may be preferentially removed in the crustal system (see Section 5.3.3 for details).
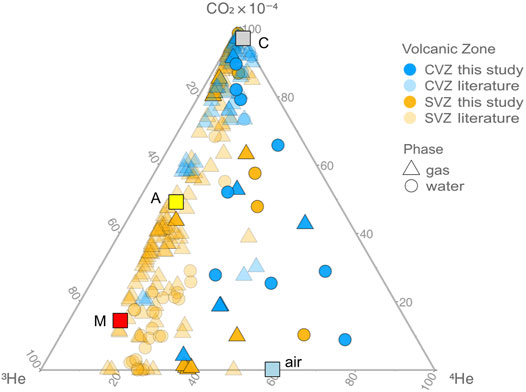
FIGURE 6. Ternary plot of CO2, 3He, and 4He for gas (triangles) and water (circles) phase samples from the CVZ and SVZ, illustrating the effects of crustal and radiogenic contamination of mantle-like volatiles. For reference, we plot “mantle” (3He/4He = 8 ± 1 RA; CO2/3He = 2 × 10⁹) with a red square (M) (Marty and Jambon, 1987), average arc mantle (3He/4He = 5.4 ± 1.9 RA; CO2/3He = 1.2 × 10¹⁰) with a yellow square (A) (Hilton et al., 2002), air (3He/4He = 1 RA; CO2/3He = 5.5 × 10⁷) with a blue square (air) and crust (3He/4He = 0.05 RA; CO2/3He = 1 × 10¹³) (Shaw et al., 2003; Barry et al., 2013) with a gray square (C). All gas samples fall on or are close to a binary mixing trajectory between mantle helium and variable amounts of crustal contamination. Fluid samples display lower CO2/3He and helium isotope values, suggesting carbon removal (calcite precipitation). There is no evidence for degassing induced fractionation, as this would drive water samples in the opposite direction as observed trends.
5 Discussion
A number of processes can affect regional geothermal 3He/4He ratios, δ13C values and associated He–CO2 characteristics. Here we aim to determine which samples have 3He/4He, CO2/3He, and δ13C values most representative of the mantle source composition versus those that have been modified by secondary processes (e.g., carbon addition/loss, hydrothermal-related fractionation, and calcite precipitation) (Figure 6). Using such an approach, we are able to elucidate the sources and sinks of volatiles, as well as their pathways from the mantle/crustal source to the surface. Ultimately the goal is to understand how large-scale (i.e., margin-wide) tectonic processes control the stark He-C geochemical variability that we observe between the CVZ and the SVZ.
5.1 Helium
5.1.1 Helium Sources
Helium can be derived from the mantle, crust, and/or atmosphere, and the relative contributions of these different sources will ultimately control the 3He/4He of a given sample. When considering all geothermal data [i.e., our data (Table 1) and literature data (Supplementary Table S1)], we show that uncorrected He isotope (R/RA) values range from 0.1 to 7.3 RA in the CVZ (n = 191) and from 0.5 to 8.3 RA in the SVZ (n = 226), which is consistent with previous findings (e.g., Lages et al., 2021). Air-corrected 3He/4He is much lower on average in the CVZ (RC/RA = 1.8 RA; 1-sigma standard deviation = 1.4 RA) relative to the SVZ (RC/RA = 5.0 RA; 1 sigma S.D. = 2.1 RA). Nearly all samples have 4He/20Ne values that are significantly higher than air (= 0.32) or air-saturated water (ASW) (= 0.26 at 15°C; Figure 4), suggesting negligible atmospheric contributions. For our data, we adopt the methods of Hilton, (1996) and use “X-values” to correct He isotope ratios for atmospheric contribution. For gas samples, the X-value is defined using Eq. 1:
Where (4He/20Ne)measured is the measured ratio and (4He/20Ne)air is the value of air.
For water samples, measured 4He/20Ne values are converted to X values using temperature-dependent Bunsen solubility coefficients (β; Weiss, 1971), following Eq. 2:
For pure fresh water at 15°C, βNe/βHe = 1.22 (Weiss, 1971).
The X-value can then be combined with measured He isotope values (R/RA) to calculate a corrected He isotope value (RC/RA):
Where R/RA is the measured He isotope value, reported relative to air, and X is calculated using Eqs 1, 2.
5.1.2 Helium Mantle-Crust Mixing
Once air contributions are quantified and corrected for, we use air-corrected He isotope (RC/RA) values to calculate the fraction of mantle-derived He, assuming a binary mixture between mantle and crustal endmembers (e.g., Barry et al., 2013):
where, 3He/4HeMantle = 8 RA (Graham, 2002; Lages et al., 2021), and 3He/4HeCrust = 0.05 RA (Morrison and Pine, 1955).
Using Eq. 4, we calculate that the CVZ is characterized by 21% mantle He and 79% crustal He on average. In contrast, we find that the SVZ is characterized by 62% mantle He and 38% crustal He on average. The extent of mixing between air, crustal and mantle components is most likely controlled by the thickness of the crust. We note that in the CVZ, where the crust is ∼70 km thick on average, the 3He/4He is much lower (average (mean) RC/RA = 1.8 RA) than in the SVZ (average (mean) RC/RA = 5.0 RA), where the crust is only ∼40 km thick on average. We hypothesize that, as fluids and gases migrate through thicker sections of crust in the overriding plate, they incorporate radiogenic 4He due to interaction with the U- and Th-rich country rock (e.g., Hilton et al., 1993). This broad trend was recently pointed out by Lages et al., 2021, who presented a comprehensive He isotope compilation that included fluid and gas data as well as newly-reported He isotope data from fluid inclusions in minerals from lavas (mostly from the Northern Volcanic Zone). In total, the Lages et al. (2021) He isotope compilation reports 261 gas and water He isotope data points from the literature (spanning the NVZ, CVZ, and SVZ). Many of these data overlap with the compilation presented here, which focuses only on the CVZ and the SVZ, but contains (He and/or C isotope) data for 417 samples in total. The addition of C isotope data allows for interrogation of sources and processes affecting C cycling.
Several previous studies focused on He isotopes throughout the ACM (e.g., Hilton et al., 1993; Lages et al., 2021). Using fluid inclusion data, Lages et al., 2021 demonstrated that lavas retain mantle source signals (i.e., high 3He/4He) more effectively than fluid and gas samples, with the most pristine lava samples yielding a He isotope endmember value of 8.0 RA in the CVZ and 7.9 RA in the SVZ. However, fresh lavas are only accessible in the volcanic arc, whereas geothermal fluids and gases provide a window into volatile cycling across the entire arc (forearc, arc, backarc). We thus adopt a mantle endmembers of 8.0 RA for the above mixing calculation (Eq. 4). Notably, observed He isotope values below 8 RA cannot be due to subduction of U- and Th-rich material, because radiogenic He-rich sediments would need to be far too old (i.e., >1890 Myr) to explain the observed data (Hilton et al., 1993; Lages et al., 2021). Instead, low He isotopes in the ACM are likely the result of either: 1) magma aging, or 2) fluid interaction/assimilation with the country rock. Hilton et al. (1993) showed that the latter scenario could explain He isotope trends if just 1% of country rock was assimilated from 10 million year old country rock. This would also satisfy observations in Sr and Pb isotope systematics (Hilton et al., 1993; Scott et al., 2018). An assimilation mechanism is preferred over magma aging, because in this scenario He isotope variability would be coupled with the age of the lowermost crust, thus predicting that SVZ samples would retain higher 3He/4He than CVZ samples, due to the relative thickness and antiquity of the crust.
5.2 Carbon
5.2.1 Carbon Sources
Carbon in geothermal samples can be derived from the mantle, the overlying crust, or introduced through subduction of carbon-laden sediments, which are released at depth and migrate to surface manifestations across the volcanic arc (e.g., Sano and Marty, 1995). CO2/3He and δ13C data can be used to differentiate between various carbon sources; however it is often difficult to definitively differentiate between the latter two processes. Here, we model CO2/3He and δ13C data for a total of 172 gas samples. These are mostly published data (n = 158) (Hilton et al., 1993; Hoke et al., 1994; Varekamp et al., 2006; Sepúlveda et al., 2007; Aguilera, 2008; Ray et al., 2009; Tassi et al., 2009; Tassi et al., 2010; Capaccioni et al., 2011; Tassi et al., 2011; Aguilera et al., 2012; Agusto et al., 2013; Benavente et al., 2013; Chiodi et al., 2015; Aguilera et al., 2016; Benavente et al., 2016; Roulleau et al., 2016; Tardani et al., 2016; Tassi et al., 2016; Arnold et al., 2017; Tassi et al., 2017; Lopez et al., 2018; Chiodi et al., 2019; Arnold et al., 2020; Inostroza et al., 2020; Robidoux et al., 2020; Lages et al., 2021; Tardani et al., 2021; Filipovich et al., 2022) and samples from this study (n = 14). We focus on gas samples in order to understand sources, as gases are less susceptible to fractionation processes than water phase samples. He–C isotope characteristics are similar to observations in other arcs worldwide (Sano and Marty, 1995; Sano and Williams, 1996), suggesting a prominent role of the subducting slab in supplying carbon to gas manifestations in both the CVZ and SVZ.
5.2.2 Subduction-Derived Carbon
Previous studies in the ACM have noted the role of sediment-derived fluids in melting the Sub-Andean mantle (e.g., Stern, 2007) and supplying volatiles to volcanically-derived samples (Ray et al., 2009). To quantify the extent of slab-derived CO2, we adopt the approach of Marty et al. (1989), Varekamp et al. (1992), Sano and Marty (1995) which uses observed He-CO2 characteristics to deconvolute mantle- versus subduction-derived (i.e., organic sediments and inorganic limestones) components. Specifically, this approach assumes that all deviations of volcanic gases from the mantle composition are subduction/mantle derived and that there is no crustal input from the overriding slab. Given these assumptions, He–CO2 characteristics (relative abundances and δ13C systematics) can be used to resolve CO2 contribution from three distinct sources: limestone (L) from subducted sediment and mineralized within slab basement, sedimentary (organic) carbon (S) from subducted sediment, and the mantle wedge (M). Each endmember source component is assumed to have a distinctive CO2/3He (M = 2 × 10⁹; L = 1 × 10¹³; S = 1 × 10¹³) and δ13C (M = −5‰; L = 0‰; S = −30‰) signature. In Figure 7, we plot the CO2/3He ratios as a function of δ13C for all gas samples, together with binary mixing trajectories. In order to quantify the relative proportions of CO2 derived from each respective endmember component, mass fractions of three major sources of carbon are quantitatively calculated with Eqs 5–7 below (Sano and Marty, 1995):
where subscripts L, S and M correspond to the end members limestone, sediment and mantle (Table 2) and subscript O = observed.
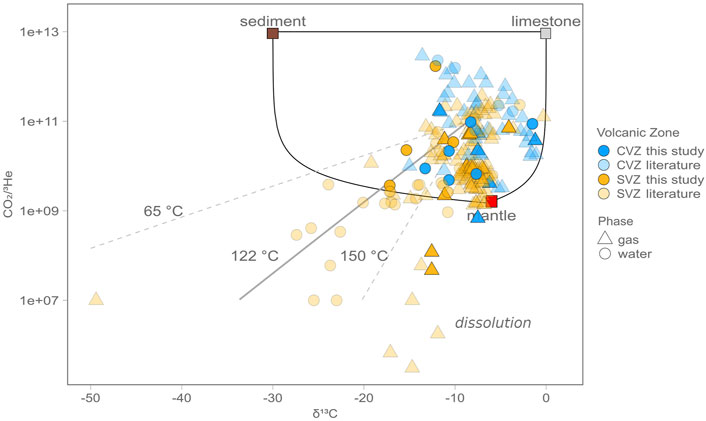
FIGURE 7. CO2/3He vs. δ13CO2 for all gas (triangles) and water (circles) samples from this study (bright symbols) as well as from published studies (light symbols). Also plotted are subduction-related source end-member compositions for mantle (M), limestone (L), and sediment (S) for reference, along with mixing lines, after Sano and Marty (1995). Solid mixing lines represent binary mixtures between the three endmember values. The uncertainties on the CO2/3He vs. δ13CO2 data are lower than given by the size of the symbols. Predicted calcite fractionation model trends at 65°C, 122°C, and 150°C are also shown for fluid samples, assuming an initial δ13Ci composition of −8.4‰ and CO2/3He = 1.0 × 10¹¹, which are the average values from all gas samples. In contrast, gas samples with isotopically low CO2/3He are likely affected by dissolution, which will drive CO2/3He values down in gas samples.
In this way we calculate that the average CO2 provenance in the CVZ to be L:S:M = 70:22:8, whereas the average CO2 provenance in the SVZ is L:S:M = 55:24:21 (Table 2). This suggests more significant mantle contributions to gases in the SVZ, which is consistent with the observation of higher 3He/4He. These calculations equate to an average L/S of 3.2 and an average (L + S)/M of 11.9 for the CVZ, and an average L/S of 2.3 and an average (L + S)/M of 3.7 for the SVZ (Table 2). This estimate for the SVZ is broadly consistent with previous estimates by Ray et al. (2009) and findings at other arc-related geothermal systems (e.g., Sano and Marty, 1995).
If only gas samples with 3He/4He above 5 RA are considered, the calculated L:S:M ratios change to 73:10:17 and 54:22:24 for the CVZ and SVZ, respectively. In this scenario, the mantle contribution is in better agreement between the two regions, which is not surprising considering that only high 3He/4He samples are being considered. Notably, slab-derived contributions dominate the CO2 budget in both regions, irrespective of whether all samples or only those with high He isotope ratios are considered. Considering only samples with He isotopes >5 RA, the average L/S is 7.0 and the average (L + S)/M is = 5.1 in the CVZ, and the average L/S is 2.5 and the average (L + S)/M is 3.2 in the SVZ. All L, S, M calculations are reported in Table 2.
We can directly compare estimates of L:S:M (Table 2) with input estimates of carbon concentrations in subducting lithologies (e.g., Clift, 2017). Carbon input estimates are compiled from scientific ocean drilling studies, which document the amount of carbonate and organic carbon subducted at convergent margins. Notably, the carbon input estimates from Clift (2017) factor in the erosional or accretionary nature of each margin when estimating how much carbon is delivered to the subduction zone. However, CVZ estimates remain poorly constrained due to lack of drill cores offshore of the CVZ. As noted above, the average output L/S in the CVZ and SVZ are 3.2 and 2.3, respectively. However, Clift (2017)’s L/S input estimates are 5.0 in the CVZ and 1.0 in the SVZ. Notably, if only samples with high He isotopes (>5 RA) are considered (which equates to filtering out samples with a significant crustal contribution), then the L/S ratios increase from 3.2 to 7.0 and from 2.3 to 2.5 in the CVZ and SVZ, respectively (Table 2). In the CVZ, where crustal assimilation is more prevalent due to the exceedingly thick crust, this filtering exercise increases output L/S estimates by over a factor of two, presumably to a more representative input value [above estimates from Clift (2017)]. This suggests that the C contribution from the CVZ overriding plate is dominantly from organic rich sediments. In the SVZ, there is not a significant shift in L/S when a filter for only high He isotope samples is applied, due to the fact that the (thinner) crust does not have a significant impact on the L/S ratio.
In either scenario (with and without filtering), there is broad agreement between input L/S (Clift, 2017) and output estimates (this study) (Table 2). The fact that input and output estimates do not match perfectly may suggest that subducted C is actually being released over a much wider area than previously thought. We know from other studies (e.g., Barry et al., 2019a) that subducted carbon is likely released across the entire convergent margin (outer forearc, forearc, arc, backarc) and that adopting such a narrow view of where it could be released (i.e., only in the high He isotope arc) is likely an oversimplification. It is therefore important to sample across the entire arc system, so that carbon output estimates can be more systematically compared with input estimates. Additionally, the discrepancy between L/S inputs and outputs may suggest that C-bearing fluids are preferentially released from different slab lithologies at different subduction depths, similar to the process recently proposed for subducted sulfur by de Moor et al. (2022). Hence, one possible explanation for the difference between L/S inputs and outputs is that limestone-derived and organic sediment-derived C are not released in the same regions of the arc. The implication is that C isotope compositions of primary subduction-related fluids could vary significantly across the arc.
Similar disparities between input and output estimates have been observed at other arc-related localities, e.g., the Central America Volcanic Arc (CAVA), where output L/S estimates (3.8–5.6) were significantly lower than sedimentary input L/S estimates (11.5–13.6) (De Leeuw et al., 2007). The sense of the inputs-outputs discrepancy in the SVZ is in the opposite direction to CAVA [i.e., L/S output estimates (this study) are significantly higher (L/S = 2.3–2.5) than input estimates (L/S = 1.0; Clift, 2017) (Table 2)]. However, when only high (>5 RA) samples are considered from the CVZ, the inputs-outputs discrepancy trends in the same direction as the SVZ (Table 2). The fact that L/S output estimates are lower than inputs in the CVZ suggests that there are relatively more organic contributions than what would be expected if all the C were quantitatively/proportionally released from the slab beneath the arc front. This could mean that limestone carbon is either preferentially 1) released in the forearc or 2) recycled to the deep mantle, whereas organic C is preferentially released beneath the volcanic arc. Notably, the latter scenario was recently suggested by Bouilhol et al. (2022), who noted decoupling of inorganic and organic carbon during subduction. Though speculative at this point, this topic may be of interest for future investigations. An alternative explanation for the general lack of agreement between carbon input and output estimates is that subducted sediment-derived C may not be entirely responsible for the observed variations in the gas chemistry data. In the following sections we explore alternative explanations for the variations in He-C characteristics.
5.2.3 Assimilation of Carbon From the Overriding Plate
The Sano and Marty (1995) approach assumes all He-C characteristics are controlled by subduction and mantle inputs and that there is no significant input of assimilated crustal CO2. This assumption may be valid for high temperature arc samples marked by high 3He/4He, but here we report and compile data from across the entire arc system (i.e., forearc, arc, backarc). In such diverse tectonic settings He isotope ratios are highly variable (Figure 8) and often much lower, suggesting significant interaction with the crust. In Section 5.1 we suggested that He isotope variations are primarily controlled by the thickness of the crust, with lower He-isotope values on average in the CVZ versus the SVZ. We surmise that similar processes could affect the carbon systematics, as CO2/3He is higher (2.9 × 10¹¹) on average in the CVZ (1-sigma standard deviation = 5.4 × 10¹¹) and lower (4.4 × 10¹⁰) on average in the SVZ (1-sigma standard deviation = 1.4 × 10¹¹) (Figure 8). Additionally, δ13C is −8.7‰ (1-sigma standard deviation = 4.5‰) on average in the CVZ and −10.8‰ (1-sigma standard deviation = 3.7‰) on average in the SVZ. Broadly speaking, the average CO2/3He in the SVZ is closer to the mantle range (vs. the CVZ), whereas the average carbon isotope signature is farther from the canonical mantle range (vs. the CVZ). In Section 5.3 we explore additional fractionation processes that could explain this apparent dichotomy.
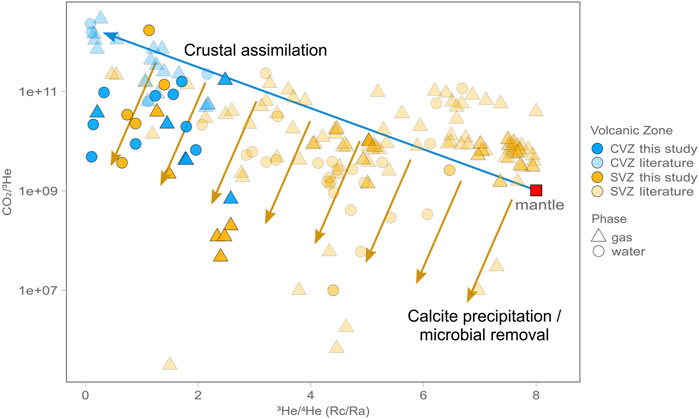
FIGURE 8. CO2/3He vs. He isotopes (RC/RA) for all samples. There is a notable trend (blue arrow) from the SVZ to the CVZ whereby samples range from nearly mantle-like to crustal (low He isotopes and higher CO2/3He). Yellow arrows indicate the effect of calcite precipitation and microbial removal. The fact that these arrows do not point straight down suggest that the residence time in the crust required for calcite removal is concomitant with time required to moderately lower He isotopes through 4He addition.
5.3 Crustal Processes Acting to Modify He-C Characteristics
Carbon recycling and release from the subducted slab into volcanic fluids has been proposed to control the carbon isotope systematics across the ACM (Hilton et al., 1993; Ray et al., 2009). However, water samples suggest that secondary crustal processes are also at work in the region. This section therefore focuses on the additional processes that can modify the He–CO2 of geothermal fluids, with the aim of determining if we can differentiate between source features (see Sections 5.1, 5.2; mixing of mantle and slab-derived components) and secondary processes such as crustal overprinting (e.g., Mason et al., 2017; Karolytė et al., 2019), phase fractionation (e.g., Ray et al., 2009; Barry et al., 2013), gas dissolution and/or precipitation of calcite (Ray et al., 2009; Newell et al., 2015; Barry et al., 2019b). Likely, all of these processes exert some control on the observed He-C features.
5.3.1 Crustal Overprinting and Assimilation
As discussed in Sections 5.1.2, 5.2.3, crustal overprinting appears to be pervasive in fluid and gas samples, particularly in lower temperature samples from the CVZ. He isotopes are highly variable, suggesting different amounts of assimilation with U- and Th- (and hence 4He-) rich crust, consistent with radiogenic (i.e., Sr and Nd) observations (Hilton et al., 1993; Scott et al., 2018). Carbon appears to be similarly affected by interaction with the crust. Higher carbon isotope values on average in the CVZ indicate that isotopically heavy (i.e., inorganic) carbon is being preferentially assimilated in the CVZ versus the SVZ (Figure 7), suggesting that CVZ samples may be influenced by isotopically-heavy crustal/carbonate CO2 dissolution (e.g., Mason et al., 2017; Karolytė et al., 2019) in addition to slab/MORB-like starting values. Notably, several previous He-C studies in acidic volcanic arc settings have suggested the release of previously sequestered CO2 (Wehrmann et al., 2011; Dawson et al., 2016; de Moor et al., 2016; Mason et al., 2017). For example, Mason et al. (2017) attributed isotopically high C isotope values in mature continental arcs with accreted carbonate platforms (i.e., the CVZ) to the reworking of crustal limestone, effectively superimposing this signature on top of volcanic/subduction source features. Assimilation of carbon rich crustal material likely also occurs in the SVZ, but to a lesser extent. Alternatively, the elevated CO2/3He (Figure 6) and non-mantle-like δ13C values (Figure 7) could be entirely explained by subduction features as suggested in Section 5.2, but this would indicate that the much thicker crust in the CVZ versus the SVZ is not affecting the samples, which seems unlikely. A third explanation is that the carbon isotopes are controlled by additional secondary processes that induce fractionation, as is discussed in the following sections. We hypothesize that these competing processes together act to control volatile budgets not only in the Andes, but likely in arcs globally.
5.3.2 Degassing, Phase Fractionation, and Gas Dissolution
During degassing or boiling, a free gas phase separates from the fluid phase within the hydrothermal system. Helium partitions preferentially into the vapor phase relative to CO2 as a consequence of its lower solubility in aqueous fluids (Ellis and Golding, 1963; Vogel et al., 1970; Ozima and Podosek, 1983; Ray et al., 2009; Barry et al., 2013).
For this reason, gas samples are often considered more representative of source features than water samples, as they are not subject to this additional fractionation mechanism. Accordingly, degassing and phase fractionation drive water CO2/3He towards higher values (Figure 6) because CO2 is more soluble in water than He. However, the opposite trend is observed in a subset of our data, as well as in the compiled literature data (i.e., we observe lower CO2/3He in water samples versus gas samples on average; Figure 6). This strongly suggests that hydrothermal phase separation following degassing is not the dominant mechanism controlling He-C systematics between water and gas phase in the CVZ and SVZ, and that carbon is actively being removed from water samples. Low δ13C values in the lowest CO2/3He samples corroborate this explanation and we surmise that this is the result of calcite precipitation (see Section 5.3.3 below; Figure 7).
Similarly, Gilfillan et al. (2009) and Güleç and Hilton (2016) showed that gas loss by dissolution in water can also result in CO2/3He fractionation trends in both gas and water phase samples. Notably, the predicted fractionation gas trends are broadly similar to anticipated calcite precipitation trends (e.g., Güleç and Hilton, 2016). As gases ascend through bubbling springs towards the surface, they likely intersect one or more gas-undersaturated aquifers. When a gas phase comes into contact with such an aquifer, it preferentially loses the more soluble gas species (i.e., C) relative to the less soluble gas species (i.e., He), resulting in lower CO2/3He in the gas phase which ultimately manifests at the surface (Figure 7). We surmise that this may have affected several of the gas samples in the SVZ (as noted on Figure 7). The opposite is true of water phase samples, which are ultimately left with elevated CO2/3He. Notably, a concomitate fractionation occurs in C-isotope of CO2, resulting in a isotopically lower δ13C values in residual gas phase sample. Such fractionation can sometimes be difficult to distinguish from that caused by calcite precipitation (e.g., Güleç and Hilton, 2016). The low CO2/3He values observed in SVZ water samples suggests that carbon is actively being removed from the water and thus we attribute these signals to calcite precipitation (see Section 5.3.3).
5.3.3 Precipitation of Calcite
Secondary processes can be assessed using a CO2-3He-4He ternary diagram (Figure 6), including the effects of carbon removal due to carbonate mineral formation in the crust. In Figure 7, CO2/3He vs. δ13C is plotted for all samples and it is clear that, on average, water and gas phase samples have broadly overlapping CO2/3He. However, we surmise that fluid samples in both regions may have experienced CO2 loss by calcite precipitation at depth. In such a scenario, gases are dissolved in deep fluids that interact with country rock during transport through the hydrothermal system toward the surface. This migration results in the fluids becoming enriched in cations (e.g., Ca2+, Mg2+) (Spane and Webber, 1995; McLing and Johnson, 2002), especially where mafic rocks are prevalent. The CO2-rich fluids emanating from the slab/mantle then react with these cations to precipitate carbonate minerals such as calcite or aragonite. During this reaction, CO2 is retained in the carbonate mineral (e.g., CaCO3, MgCO3), resulting in lower CO2/3He and more negative δ13C in residual fluids as the heavier isotope of C is preferentially partitioned into the solid (carbonate) phase. Notably, this process is highly temperature-dependent, so by assuming a constant geothermal gradient, the extent of carbon isotope fractionation can be used to constrain the temperature (and depth) at which this process occurs. When considering data from this study together with published water data, we note that CVZ water samples exhibit higher CO2/3He values on average, as well as the higher δ13C values, only extending down to −18.7‰, whereas SVZ water samples exhibit the lower CO2/3He values on average and δ13C values as low as −27.4‰. Thus, the first order observation is that some samples in the SVZ, with very low CO2/3He and δ13C, may reflect extreme carbon removal due to calcite precipitation (Figure 8).
In Figure 7, samples are plotted along with Rayleigh distillation fractionation lines for calcite precipitation at 65°C, 122°C, and 150°C. Notably, 65°C is the temperature at which calcite fractionation was proposed to occur in the Costa Rica forearc (Barry et al., 2019a). However, in the ACM, it appears that calcite precipitation occurs at higher temperatures, extending to temperatures as high as 150°C, which are consistent with observations from Baja, Mexico (Barry et al., 2020). Notably, 122°C is the estimated maximum temperature of cultured microorganisms (Takai et al., 2008), while 150°C has long been considered the theoretical upper limit for Life (Merino et al., 2019). The upper temperature limit of 150°C corresponds to a depth of ∼6.8 km if a uniform geothermal gradient of ∼22°C/km (Rothstein and Manning, 2003) is assumed. However, the actual depth for these temperatures might change in response to local heat flow, the type of rocks present, and the tectonic setting. For example, previous work has suggested a shallower geothermal gradient in the forearc of cold subduction zones, such that the 122°C isotherm might reach ∼15 km or deeper (Plümper, et al., 2017). Fullerton et al. (2021) used a depth of 15 km to calculate the total biomass present in the Costa Rican Forearc crust. The CVZ and SVZ have different average heat flows and large heterogeneities (Hamza et al., 2005). Taking this into account, and using rock compositions ranging from andesite to rhyolite, the theoretical depths to the 150°C isotherms are 12 and 20 km for the SVZ and CSZ, respectively (Figure 9). Within this area, low temperature processes like calcite precipitation and microbial metabolism might remove significant amounts of carbon (Barry et al., 2019a; Fullerton et al., 2021). Previously, microbes have been shown to serve as nucleation sites for the precipitation of carbonate minerals across a wide range of temperatures (e.g., Fouke et al., 2000; Tsesarsky et al., 2016). The agreement between the best fit calcite precipitation temperature and the upper temperature limit for life (∼122°C) is consistent with biological nucleation potentially being important for overcoming kinetic limitations on calcite precipitation (Figure 9), but could also simply be a coincidence.
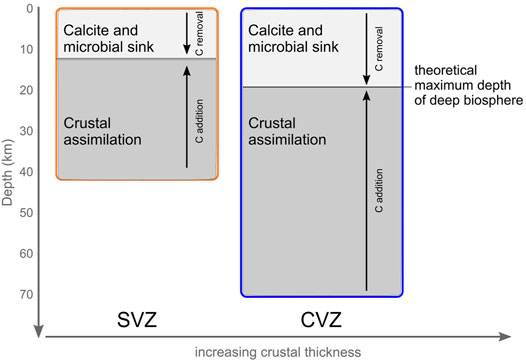
FIGURE 9. Cartoon showing crustal thickness and the relative proportions of C removal (as calcite precipitation and potential microbial sink) vs. C addition (crustal assimilation) in the two volcanic zones. As the thickness of the crust increases from ∼40 km in the SVZ to ∼70 km in the CVZ, the depth to which biologically mediated calcite precipitation can occur, increases only marginally compared to crustal thickness. This disparity in crustal thickness results in different contributions of these competing processes. We hypothesize that these various processes each contribute to various extents to shape the volatile budget not just in the Andes, but likely in arcs globally.
In order to estimate how much carbon has potentially been removed due to calcite precipitation, we construct a simple model (after Ray et al., 2009; Barry et al., 2019a; Barry et al., 2020) assuming that CO2 is released from the slab/mantle mixture and reacts with groundwater to form 1) an initial DIC pool (dissolved CO2) and 2) a free CO2 gas pool. The fractionation factor (α) at isotopic equilibrium for CO2-HCO3--CaCO3 is temperature dependent (Eq. 8) and can be derived from the empirically determined fractionation between DIC and calcite (Ohmoto and Rye, 1979).
where T is the temperature in Kelvin.
In Figure 7, the initial δ13Ci input is assumed to be homogenous at −8.4‰, which corresponds to the average value of all gas samples (Supplementary Table S1). The starting CO2/3He is assumed to be 1.0 × 10¹¹, which is the average for all gas samples compiled here. We emphasize that assuming a single starting point is likely an oversimplification as we are dealing with a very large variety of thermal manifestations; however these assumptions are made for the purposes of presenting a unified model for all data. The fraction (f) of carbon loss can be calculated for any observed δ13Co value can be calculated using Eq. 9 (Holloway and Blank, 1994; Barry et al., 2021).
Likewise the CO2/3He can be calculated by accounting for the amount of carbon removed, assuming that no 3He is lost, due to its inert nature (Figure 7). The fraction (f) of carbon loss increases as calcite forms and the residual DIC δ13CO2 and CO2/3He decrease. Given these assumptions (calcite precipitation temperature = 122°C; δ13Ci = −8.4‰; CO2/3Hei = 1.0 × 10¹¹), the model predicts that >99% of the original carbon must be lost from the most highly fractionated water samples in the SVZ, and >97% in the CVZ, resulting in low CO2/3He and δ13C. On average, 90% of carbon was removed from water samples in the SVZ and 40% was removed from water samples in the CVZ. Notably, our assumed starting compositions are non-unique and if mantle-like starting values are assumed instead, a slightly different amount of fractionation would be required to explain the data (Figure 7). The fact that the signal associated with calcite precipitation appears to be stronger in the SVZ compared to the CVZ suggests that this process is most prominent in regions with thinner crust, and/or more mafic rocks, providing cations that promote calcite precipitation (Figure 9). Notably, in the CVZ, there is also significant calcite precipitation, but the overall prevalence of this process is not as apparent, perhaps due to greater contributions of crustal carbon from the overriding plate to hot spring emissions (i.e., higher starting CO2/3He due to assimilation), which appears to be pervasive throughout the CVZ (Figure 8).
5.4 He-C and Along-Arc Properties
Large scale subduction-related parameters vary significantly along-strike, likely affecting surface volatile characteristics. Below, we briefly discuss how these large scale features may affect the He-C signatures that are observed across the CVZ and SVZ.
5.4.1 Sediment Composition and Thickness
The results from Section 5.2.2 suggest that subduction of inorganic and organic carbon likely impact gas and fluid emissions across the arc. However, deciphering source features from secondary fractionation effects in the overriding plate remains somewhat enigmatic. Higher precipitation in the southern Andes leads to higher sedimentation rates offshore of the SVZ (Figure 1A). The physical barrier of the Juan Fernandez Ridge at ∼32 °S inhibits northward sedimentary transport along the trench, resulting in a sediment-starved incoming plate and trench at the CVZ and a sediment-flooded trench offshore of the SVZ [offshore sediment thickness is ∼150 m in the CVZ vs. ∼500 m in the SVZ (Contreras-Reyes, 2008; Contreras-Reyes, 2010; Völker et al., 2013; Figure 1B)]. Because sediments contain structurally bound carbon, the amount of incoming carbon is likely much higher in the SVZ than in the CVZ; however there are no drill cores that are directly relevant to the CVZ. In the absence of significant sediments, altered oceanic crust (AOC) could deliver significant amounts of carbon to the margins, respectively (e.g., Bekaert et al., 2021).
While carbon L/S output estimates (this study) do not perfectly match L/S input estimates (Clift, 2017) (Table 2), we note that the trend is in the corresponding direction, suggesting more inorganic L relative to organic S in the CVZ versus the SVZ. The fact that the CVZ retains higher CO2/3He (Figure 8) despite receiving an order of magnitude less C is critically important, because this suggests that He-C cannot be solely explained by mixing between subducted components and carbon from the mantle wedge. Instead the crust must be the source of a significant proportion of the carbon in the CVZ (Figure 9) through assimilation, which is supported by pervasively low He isotope ratios.
5.4.2 Slab Age, Subduction Rate and Angle
Along the Chile trench, the incoming plate is younger in the SVZ (∼30 Ma) than in the CVZ (∼45 Ma) (Syracuse and Abers, 2006); however convergence rates are steady between 7–9 cm/yr in each region. Because the amount of carbon delivered to the trench and the ratio of inorganic (L) to organic (S) carbon are almost entirely sediment-controlled, this moderate difference in slab age is not expected to make a significant difference to the budget of subducted C. However, the age difference between these two slabs may result in an initially warmer plate in the SVZ compared to the CVZ, which may promote melting at shallower depths. We surmise above that the disparity between our L/S estimates and the Clift (2017) estimates could be related to C being preferentially released in the forearc of SVZ, which in turn resulted in more calcite precipitation at lower temperatures in the overriding plate (e.g., Barry et al., 2019b). Furthermore, the subduction dip angle is steeper in the SVZ (28°) vs. the CVZ (24°), which likely affects carbon release depths. However, there is not sufficient resolution in the C isotope data to definitively postulate that subduction angle or slab age are primary drivers of He-C features in gas and fluid manifestations across the arc. Notably, previous studies have also estimated that the magmatic CO2 flux from the CVZ is lower than in the SVZ (Aiuppa et al., 2019), which is broadly consistent with our findings. However, our results indicate that the total carbon flux (magmatic + crustal) may actually be higher in the CVZ, as an additional carbon pool is being mobilized in the CVZ.
6 Summary
Carbon and other volatile elements are actively cycled between Earth reservoirs by plate tectonics at subduction zones, which has major implications for Earth’s climate and habitability over geologic timescales. Here, we report He isotope ratios and abundance data for 42 deeply-sourced fluid and gas samples from the CVZ and the SVZ. He isotopes from the CVZ range from 0.1 to 2.6 RA (n = 23), following correction for atmospheric contributions. Atmosphere-corrected He isotopes from the SVZ range from 0.7 to 5.0 RA (n = 19). Taken together, these data reveal a clear southeastward increase in 3He/4He, with the highest values (in the SVZ) plotting below the nominal range of values associated with pure upper mantle He (8 ± 1 RA; Graham, 2002), approaching the mean He isotope value for arc gases of (5.4 ± 1.9 RA; Hilton et al., 2002). Notably, the lowest values are found in the CVZ, suggesting more significant crustal contributions (i.e., assimilation) (Figure 8) to the He budget. The crustal thickness in the CVZ is up to 70 km, significantly larger than in the SVZ, where it is just ∼40 km (Tassara and Echaurren, 2012; Assumpção et al., 2013) (Figures 1B, 9). It thus appears that crustal thickness exerts a primary control on the extent of fluid-crust interaction, as helium and other volatiles rise through the upper plate in the ACM, which is broadly consistent with the findings of several previous studies (e.g., Lages et al., 2021). This suggests a masked mantle influence in the CVZ associated with thicker crust adding 4He. Carbon isotope compositions (δ13CO2) vary between −12.0‰ and −1.2‰ in the CVZ and CO2/3He values vary over three orders of magnitude (9.0 × 10⁸–1.1 × 10¹²). In the SVZ, carbon isotopes (δ13CO2) vary between −14.0‰ and −8.7‰ and CO2/3He values vary by nearly three orders of magnitude (4.7 × 10⁷–3.9 × 10¹⁰). Lower δ13CO2 and CO2/3He values in the SVZ are consistent with calcite precipitation in shallow-level (upper ∼20 km) hydrothermal systems (Ray et al., 2009; Barry et al., 2019a). We speculate that the coincidence of modeled calcite precipitation temperature (122°C) and the upper temperature limit for life may be consistent with biological nucleation being important for overcoming kinetic limitations on calcite precipitation. Taken together, the bimodal nature of the He-CO2 data suggests fundamentally different volatile migration pathways in each volcanic region, indicating complex interplay between mantle degassing, sediment delivery, interaction with continental crust, and volatile sequestration via secondary processes. Finally, we emphasize that these competing processes are not unique to the Andes and that these models should be applied to understand the volatile budget in other arc settings around the world.
Data Availability Statement
The datasets presented in this study can be found in online repositories. The names of the repository/repositories and accession number(s) can be found in the article/Supplementary Material. The complete dataset and the R code to reproduce the analysis have been permanently archived on Zenodo at DOI: 10.5281/zenodo.
Author Contributions
All authors either helped collect samples or analyzed samples. All authors contributed to writing the manuscript.
Funding
This work was principally supported by the NSF-FRES award 2121637 to PB, KL, and JM. Field work was also supported by award G-2016-7206 from the Alfred P. Sloan Foundation and the Deep Carbon Observatory to PB, KL, DG, and JM. Additional support came from The National Fund for Scientific and Technological Development of Chile (FONDECYT) Grant 11191138 (The National Research and Development Agency of Chile, ANID Chile), and COPAS COASTAL ANID FB210021 to GJ. DG was partially supported by funding from the European Research Council (ERC) under the European Union’s Horizon 2020 research and innovation program Grant Agreement No. 948972—COEVOLVE—ERC-2020-STG.
Conflict of Interest
The authors declare that the research was conducted in the absence of any commercial or financial relationships that could be construed as a potential conflict of interest.
Publisher’s Note
All claims expressed in this article are solely those of the authors and do not necessarily represent those of their affiliated organizations, or those of the publisher, the editors and the reviewers. Any product that may be evaluated in this article, or claim that may be made by its manufacturer, is not guaranteed or endorsed by the publisher.
Acknowledgments
We also acknowledge M. Correggia and L. Di Iorio for technical assistance with the water samples carbon data analysis at the University of Naples Federico II.
Supplementary Material
The Supplementary Material for this article can be found online at: https://www.frontiersin.org/articles/10.3389/feart.2022.897267/full#supplementary-material
References
Aguilera, F., Tassi, F., Darrah, T., Moune, S., and Vaselli, O. (2012). Geochemical Model of a Magmatic-Hydrothermal System at the Lastarria Volcano, Northern Chile. Bull. Volcanol. 74 (1), 119–134. doi:10.1007/s00445-011-0489-5
Aguilera, F., Cortes, J., González, C., and Layana, S. (2016). Geología y geoquímica de fluidos del campo geotérmico de Cupo, Región de los Ríos, Chile. Antofagasta, Chile: Private Report.
Aguilera, F. (2008). Origen y naturaleza de los fluidos en los sistemas volcánicos, geotermales y termales de baja entalpía de la zona volcánica central (ZVC) entre los 17 43’S y 25 10’S. Antofagasta, Chile: PhD Thesis: Universidad Católica del Norte.
Agusto, M., Tassi, F., Caselli, A. T., Vaselli, O., Rouwet, D., Capaccioni, B., et al. (2013). Gas Geochemistry of the Magmatic-Hydrothermal Fluid Reservoir in the Copahue–Caviahue Volcanic Complex (Argentina). J. Volcanol. Geotherm. Res. 257, 44–56. doi:10.1016/j.jvolgeores.2013.03.003
Aiuppa, A., Fischer, T. P., Plank, T., and Bani, P. (2019). CO2 Flux Emissions from the Earth's Most Actively Degassing Volcanoes, 2005-2015. Sci. Rep. 9 (1), 5442–5517. doi:10.1038/s41598-019-41901-y
Andrews, J. N. (1985). The Isotopic Composition of Radiogenic Helium and its Use to Study Groundwater Movement in Confined Aquifers. Chem. Geol. 49 (1-3), 339–351.
Arnold, Y. A., Cabassi, J., Tassi, F., Caffe, P. J., and Vaselli, O. (2017). Fluid Geochemistry of a Deep-Seated Geothermal Resource in the Puna Plateau (Jujuy Province, Argentina). J. Volcanol. Geotherm. Res. 338, 121–134. doi:10.1016/j.jvolgeores.2017.03.030
Arnold, Y. A., Franco, M. G., Tassi, F., Caffe, P. J., Jofre, C. B., Claros, M., et al. (2020). Geochemical Features of Hydrothermal Systems in Jujuy Province, Argentina: Hints for Geothermal Fluid Exploration. J. S. Am. Earth Sci. 101, 102627. doi:10.1016/j.jsames.2020.102627
Assumpção, M., Feng, M., Tassara, A., and Julià, J. (2013). Models of Crustal Thickness for South America from Seismic Refraction, Receiver Functions and Surface Wave Tomography. Tectonophysics 609, 82–96. doi:10.1016/j.tecto.2012.11.014
Barry, P. H., Hilton, D. R., Fischer, T. P., de Moor, J. M., Mangasini, F., and Ramirez, C. (2013). Helium and Carbon Isotope Systematics of Cold “Mazuku” CO2 Vents and Hydrothermal Gases and Fluids from Rungwe Volcanic Province, Southern Tanzania. Chem. Geol. 339, 141–156. doi:10.1016/j.chemgeo.2012.07.003
Barry, P. H., Lawson, M., Meurer, W. P., Warr, O., Mabry, J. C., Byrne, D. J., et al. (2016). Noble Gases Solubility Models of Hydrocarbon Charge Mechanism in the Sleipner Vest Gas Field. Geochimica Cosmochimica Acta 194, 291–309. doi:10.1016/j.gca.2016.08.021
Barry, P. H., de Moor, J. M., Giovannelli, D., Schrenk, M., Hummer, D. R., Lopez, T., et al. (2019a). Forearc Carbon Sink Reduces Long-Term Volatile Recycling into the Mantle. Nature 568 (7753), 487–492. doi:10.1038/s41586-019-1131-5
Barry, P. H., Nakagawa, M., Giovannelli, D., Maarten de Moor, J., Schrenk, M., Seltzer, A. M., et al. (2019b). Helium, Inorganic and Organic Carbon Isotopes of Fluids and Gases across the Costa Rica Convergent Margin. Sci. Data 6 (1), 284–288. doi:10.1038/s41597-019-0302-4
Barry, P. H., Negrete-Aranda, R., Spelz, R. M., Seltzer, A. M., Bekaert, D. V., Virrueta, C., et al. (2020). Volatile Sources, Sinks and Pathways: A Helium‑Carbon Isotope Study of Baja California Fluids and Gases. Chem. Geol. 550, 119722. doi:10.1016/j.chemgeo.2020.119722
Barry, P. H., Bekaert, D. V., Krantz, J. A., Halldórsson, S. A., de Moor, J. M., Fischer, T. P., et al. (2021). Helium-carbon Systematics of Groundwaters in the Lassen Peak Region. Chem. Geol. 584, 120535. doi:10.1016/j.chemgeo.2021.120535
Bekaert, D. V., Turner, S. J., Broadley, M. W., Barnes, J. D., Halldórsson, S. A., Labidi, J., et al. (2021). Subduction-driven Volatile Recycling: A Global Mass Balance. Annu. Rev. Earth Planet. Sci. 49, 37–70. doi:10.1146/annurev-earth-071620-055024
Benavente, O., Tassi, F., Gutiérrez, F., Vaselli, O., Aguilera, F., and Reich, M. (2013). Origin of Fumarolic Fluids from Tupungatito Volcano (Central Chile): Interplay between Magmatic, Hydrothermal, and Shallow Meteoric Sources. Bull. Volcanol. 75 (8), 1–15. doi:10.1007/s00445-013-0746-x
Benavente, O., Tassi, F., Reich, M., Aguilera, F., Capecchiacci, F., Gutiérrez, F., et al. (2016). Chemical and Isotopic Features of Cold and Thermal Fluids Discharged in the Southern Volcanic Zone between 32.5°S and 36°S: Insights into the Physical and Chemical Processes Controlling Fluid Geochemistry in Geothermal Systems of Central Chile. Chem. Geol. 420, 97–113. doi:10.1016/j.chemgeo.2015.11.010
Beyerle, U., Aeschbach-Hertig, W., Imboden, D. M., Baur, H., Graf, T., and Kipfer, R. (2000). A Mass Spectrometric System for the Analysis of Noble Gases and Tritium from Water Samples. Environ. Sci. Technol. 34 (10), 2042–2050. doi:10.1021/es990840h
Bouilhol, P., Debret, B., Inglis, E. C., Warembourg, M., Grocolas, T., Rigaudier, T., et al. (2022). Decoupling of Inorganic and Organic Carbon during Slab Mantle Devolatilisation. Nat. Commun. 13 (1), 308–310. doi:10.1038/s41467-022-27970-0
Capaccioni, B., Aguilera, F., Tassi, F., Darrah, T., Poreda, R. J., and Vaselli, O. (2011). Geochemical and Isotopic Evidences of Magmatic Inputs in the Hydrothermal Reservoir Feeding the Fumarolic Discharges of Tacora Volcano (Northern Chile). J. Volcanol. Geotherm. Res. 208 (3-4), 77–85. doi:10.1016/j.jvolgeores.2011.09.015
Chen, Y. W., Wu, J., and Suppe, J. (2019). Southward Propagation of Nazca Subduction Along the Andes. Nature 565 (7740), 441–447.
Chiodi, A., Tassi, F., Báez, W., Maffucci, R., Invernizzi, C., Giordano, G., et al. (2015). New geochemical and isotopic insights to evaluate the geothermal resource of the hydrothermal system of Rosario de la Frontera (Salta, northern Argentina). J. Volcanol. Geotherm. Res. 295, 16–25. doi:10.1016/j.jvolgeores.2015.03.001
Chiodi, A., Tassi, F., Báez, W., Filipovich, R., Bustos, E., Glok Galli, M., et al. (2019). Preliminary Conceptual Model of the Cerro Blanco Caldera-Hosted Geothermal System (Southern Puna, Argentina): Inferences from Geochemical Investigations. J. S. Am. Earth Sci. 94, 102213. doi:10.1016/j.jsames.2019.102213
Clarke, W. B., Jenkins, W. J., and Top, Z. (1976). Determination of Tritium by Mass Spectrometric Measurement of 3He. Int. J. Appl. Radiat. isotopes 27 (9), 515–522. doi:10.1016/0020-708x(76)90082-x
Clift, P. D. (2017). A Revised Budget for Cenozoic Sedimentary Carbon Subduction. Rev. Geophys. 55 (1), 97–125. doi:10.1002/2016rg000531
Contreras-Reyes, E., Grevemeyer, I., Flueh, E. R., and Reichert, C. (2008). Upper Lithospheric Structure of the Subduction Zone Offshore of Southern Arauco Peninsula, Chile, At∼ 38 S. J. Geophys. Res. Solid Earth 113 (B07303), 1–19. doi:10.1029/2007JB005569
Contreras-Reyes, E., Flueh, E. R., and Grevemeyer, I. (2010). Tectonic Control on Sediment Accretion and Subduction off South Central Chile: Implications for Coseismic Rupture Processes of the 1960 and 2010 Megathrust Earthquakes. Tectonics 29 (TC6018), 1–27. doi:10.1029/2010TC002734
Craig, H. (1953). The Geochemistry of the Stable Carbon Isotopes. Geochimica cosmochimica acta 3 (2-3), 53–92. doi:10.1016/0016-7037(53)90001-5
Dawson, P., Chouet, B., and Pitt, A. (2016). Tomographic Image of a Seismically Active Volcano: Mammoth Mountain, California. J. Geophys. Res. Solid Earth 121 (1), 114–133. doi:10.1002/2015jb012537
Day, J. M. D., Barry, P. H., Hilton, D. R., Burgess, R., Pearson, D. G., and Taylor, L. A. (2015). The Helium Flux from the Continents and Ubiquity of low-3He/4He Recycled Crust and Lithosphere. Geochimica Cosmochimica Acta 153, 116–133. doi:10.1016/j.gca.2015.01.008
De Leeuw, G. A. M., Hilton, D. R., Fischer, T. P., and Walker, J. A. (2007). The He–CO2 Isotope and Relative Abundance Characteristics of Geothermal Fluids in el Salvador and Honduras: New Constraints on Volatile Mass Balance of the Central American Volcanic Arc. Earth Planet. Sci. Lett. 258 (1-2), 132–146. doi:10.1016/j.epsl.2007.03.028
de Moor, J. M., Aiuppa, A., Avard, G., Wehrmann, H., Dunbar, N., Muller, C., et al. (2016). Turmoil at Turrialba Volcano (Costa Rica): Degassing and Eruptive Processes Inferred from High-Frequency Gas Monitoring. J. Geophys. Res. Solid Earth 121 (8), 5761–5775. doi:10.1002/2016jb013150
de Moor, J. M., Fischer, T. P., and Plank, T. (2022). Constraints on the Sulfur Subduction Cycle in Central America from Sulfur Isotope Compositions of Volcanic Gases. Chem. Geol. 588, 120627. doi:10.1016/j.chemgeo.2021.120627
De Silva, S. L. (1989). Altiplano-Puna Volcanic Complex of the Central Andes. Geology 17 (12), 1102–1106. doi:10.1130/0091-7613(1989)017<1102:apvcot>2.3.co;2
DeMets, C., Gordon, R. G., and Argus, D. F. (2010). Geologically Current Plate Motions. Geophys. J. Int. 181 (1), 1–80. doi:10.1111/j.1365-246x.2009.04491.x
Dewey, J. F., and Bird, J. M. (1970). Mountain Belts and the New Global Tectonics. J. Geophys. Res. 75 (14), 2625–2647. doi:10.1029/jb075i014p02625
Dunai, T. J., and Baur, H. (1995). Helium, Neon, and Argon Systematics of the European Subcontinental Mantle: Implications for its Geochemical Evolution. Geochimica Cosmochimica Acta 59 (13), 2767–2783. doi:10.1016/0016-7037(95)00172-v
Ellis, A. J., and Golding, R. M. (1963). The Solubility of Carbon Dioxide above 100 Degrees C in Water and in Sodium Chloride Solutions. Am. J. Sci. 261 (1), 47–60. doi:10.2475/ajs.261.1.47
Filipovich, R., Chiodi, A., Báez, W., Ahumada, M. F., Invernizzi, C., Taviani, S., et al. (2022). Structural Analysis and Fluid Geochemistry as Tools to Assess the Potential of the Tocomar Geothermal System, Central Puna (Argentina). Geothermics 98, 102297. doi:10.1016/j.geothermics.2021.102297
Fouke, B. W., Farmer, J. D., Des Marais, D. J., Pratt, L., Sturchio, N. C., Burns, P. C., et al. (2000). Depositional Facies and Aqueous-Solid Geochemistry of Travertine-Depositing Hot Springs (Angel Terrace, Mammoth Hot Springs, Yellowstone National Park, U.S.A.). J. Sediment. Res. 70 (3), 565–585. doi:10.1306/2dc40929-0e47-11d7-8643000102c1865d
Fullerton, K. M., Schrenk, M. O., Yücel, M., Manini, E., Basili, M., Rogers, T. J., et al. (2021). Effect of Tectonic Processes on Biosphere-Geosphere Feedbacks across a Convergent Margin. Nat. Geosci. 14 (5), 301–306. doi:10.1038/s41561-021-00725-0
Gautheron, C., and Moreira, M. (2002). Helium Signature of the Subcontinental Lithospheric Mantle. Earth Planet. Sci. Lett. 199 (1-2), 39–47. doi:10.1016/s0012-821x(02)00563-0
Giggenbach, W. F., and Goguel, R. L. (1989). Methods for theCollection and Analysis of Geothermal and Volcanic Water and Gas Samples. Petone, New Zealand: Dept. of Sci. and Ind. Res.
Gilfillan, S. M. V., Lollar, B. S., Holland, G., Blagburn, D., Stevens, S., Schoell, M., et al. (2009). Solubility Trapping in Formation Water as Dominant CO2 Sink in Natural Gas Fields. Nature 458 (7238), 614–618. doi:10.1038/nature07852
Godoy, B., Taussi, M., González-Maurel, O., Renzulli, A., Hernández-Prat, L., le Roux, P., et al. (2019). Linking the Mafic Volcanism with the Magmatic Stages during the Last 1 Ma in the Main Volcanic Arc of the Altiplano-Puna Volcanic Complex (Central Andes). J. S. Am. Earth Sci. 95, 102295. doi:10.1016/j.jsames.2019.102295
Graham, D. W. (2002). Noble Gas Isotope Geochemistry of Mid-ocean Ridge and Ocean Island Basalts: Characterization of Mantle Source Reservoirs. Rev. Mineralogy Geochem. 47, 247. doi:10.2138/rmg.2002.47.8
Güleç, N., and Hilton, D. R. (2016). Turkish Geothermal Fields as Natural Analogues of CO2 Storage Sites: Gas Geochemistry and Implications for CO2 Trapping Mechanisms. Geothermics 64, 96–110.
Hamilton, N. E., and Ferry, M. (2018). Ggtern: Ternary Diagrams Using Ggplot2. J. Stat. Softw. Code Snippets 87 (3), 1–17. doi:10.18637/jss.v087.c03
Hamza, V. M., Dias, F. J. S. S., Gomes, A. J. L., and Terceros, Z. G. D. (2005). Numerical and Functional Representations of Regional Heat Flow in South America. Phys. Earth Planet. Interiors 152 (4), 223–256. doi:10.1016/j.pepi.2005.04.009
Harmon, R. S., Barreiro, B. A., Moorbath, S., Hoefs, J., Francis, P. W., Thorpe, R. S., et al. (1984). Regional O-, Sr-, and Pb-Isotope Relationships in Late Cenozoic Calc-Alkaline Lavas of the Andean Cordillera. J. Geol. Soc. 141 (5), 803–822. doi:10.1144/gsjgs.141.5.0803
Hayes, J. M., Strauss, H., and Kaufman, A. J. (1999). The Abundance of 13C in Marine Organic Matter and Isotopic Fractionation in the Global Biogeochemical Cycle of Carbon during the Past 800 Ma. Chem. Geol. 161 (1-3), 103–125. doi:10.1016/s0009-2541(99)00083-2
Hilton, D. R., and Porcelli, D. (2003). Noble Gases as Mantle Tracers. Treatise Geochem. 2, 568. doi:10.1016/b0-08-043751-6/02007-7
Hilton, D. R., Hammerschmidt, K., Teufel, S., and Friedrichsen, H. (1993). Helium Isotope Characteristics of Andean Geothermal Fluids and Lavas. Earth Planet. Sci. Lett. 120 (3-4), 265–282. doi:10.1016/0012-821x(93)90244-4
Hilton, D. R., Fischer, T. P., and Marry, B. (2002). Noble Gases and Volatile Recycling at Subduction Zones. Rev. Mineralogy Geochem. 47, 1–73. doi:10.2138/rmg.2002.47.9
Hilton, D. R. (1996). The Helium and Carbon Isotope Systematics of a Continental Geothermal System: Results from Monitoring Studies at Long Valley Caldera (California, U.S.A.). Chem. Geol. 127 (4), 269–295. doi:10.1016/0009-2541(95)00134-4
Hoke, L., Hilton, D. R., Lamb, S. H., Hammerschmidt, K., and Friedrichsen, H. (1994). 3He Evidence for a Wide Zone of Active Mantle Melting beneath the Central Andes. Earth Planet. Sci. Lett. 128 (3-4), 341–355. doi:10.1016/0012-821x(94)90155-4
Holloway, J. R., and Blank, J. G. (1994). Chapter 6. Application of Experimental Results to C-O-H Species in Natural Melts. Rev. Mineralogy Geochem. 30 (1), 187–230. doi:10.1515/9781501509674-012
Howell, J. A., Schwarz, E., Spalletti, L. A., and Veiga, G. D. (2005). The Neuquén Basin: an Overview. Geol. Soc. Lond. Spec. Publ. 252 (1), 1–14. doi:10.1144/gsl.sp.2005.252.01.01
Hunt, A. G. (2015). US Geological Survey Noble Gas Laboratory’s Standard Operating Procedures for the Measurement of Dissolved Gas in Water Samples (No. 5-A11). Reston, VA: US Geological Survey.
Inostroza, M., Tassi, F., Aguilera, F., Sepúlveda, J. P., Capecchiacci, F., Venturi, S., et al. (2020). Geochemistry of Gas and Water Discharge from the Magmatic-Hydrothermal System of Guallatiri Volcano, Northern Chile. Bull. Volcanol. 82 (7), 1–16. doi:10.1007/s00445-020-01396-2
Jacques, G., Hoernle, K., Gill, J., Wehrmann, H., Bindeman, I., and Lara, L. E. (2014). Geochemical Variations in the Central Southern Volcanic Zone, Chile (38–43°S): The Role of Fluids in Generating Arc Magmas. Chem. Geol. 371, 27–45. doi:10.1016/j.chemgeo.2014.01.015
James, D. E. (1971). Plate Tectonic Model for the Evolution of the Central Andes. Geol. Soc. Am. Bull. 82 (12), 3325–3346. doi:10.1130/0016-7606(1971)82[3325:ptmfte]2.0.co;2
Javoy, M., Pineau, F., and Delorme, H. (1986). Carbon and Nitrogen Isotopes in the Mantle. Chem. Geol. 57 (1-2), 41–62. doi:10.1016/0009-2541(86)90093-8
Jordan, T. E., Isacks, B. L., Ramos, V. A., and Allmendinger, R. W. (1983). Mountain Building in the Central Andes. Episodes 6 (3), 20–26. doi:10.18814/epiiugs/1983/v6i3/005
Karolytė, R., Johnson, G., Györe, D., Serno, S., Flude, S., Stuart, F. M., et al. (2019). Tracing the Migration of Mantle CO2 in Gas Fields and Mineral Water Springs in South-East Australia Using Noble Gas and Stable Isotopes. Geochimica Cosmochimica Acta 259, 109–128. doi:10.1016/j.gca.2019.06.002
Kay, S. M., and Mpodozis, C. (2002). Magmatism as a Probe to the Neogene Shallowing of the Nazca Plate beneath the Modern Chilean Flat-Slab. J. S. Am. Earth Sci. 15 (1), 39–57. doi:10.1016/s0895-9811(02)00005-6
Kimani, C. N., Kasanzu, C. H., Tyne, R. L., Mtili, K. M., Byrne, D. J., Kazimoto, E. O., et al. (2021). He, Ne, Ar and CO2 Systematics of the Rungwe Volcanic Province, Tanzania: Implications for Fluid Source and Dynamics. Chem. Geol. 586, 120584. doi:10.1016/j.chemgeo.2021.120584
Lages, J., Rizzo, A. L., Aiuppa, A., Robidoux, P., Aguilar, R., Apaza, F., et al. (2021). Crustal Controls on Light Noble Gas Isotope Variability along the Andean Volcanic Arc. Geochem. Persp. Let. 19, 45–49. doi:10.7185/geochemlet.2134
López-Escobar, L., Parada, M. A., Hickey-Vargas, R., Frey, F. A., Kempton, P. D., and Moreno, H. (1995). Calbuco Volcano and Minor Eruptive Centers Distributed along the Liquiñe-Ofqui Fault Zone, Chile (41–42 S): Contrasting Origin of Andesitic and Basaltic Magma in the Southern Volcanic Zone of the Andes. Contributions Mineralogy Petrology 119 (4), 345–361. doi:10.1007/BF00286934
Lopez, T., Aguilera, F., Tassi, F., de Moor, J. M., Bobrowski, N., Aiuppa, A., et al. (2018). New Insights into the Magmatic-Hydrothermal System and Volatile Budget of Lastarria Volcano, Chile: Integrated Results from the 2014 IAVCEI CCVG 12th Volcanic Gas Workshop. Geosphere 14 (3), 983–1007. doi:10.1130/ges01495.1
Mabry, J., Lan, T., Burnard, P., and Marty, B. (2013). High-precision Helium Isotope Measurements in Air. J. Anal. At. Spectrom. 28 (12), 1903–1910. doi:10.1039/c3ja50155h
Malowany, K., Stix, J., Van Pelt, A., and Lucic, G. (2015). H2S Interference on CO2 Isotopic Measurements Using a Picarro G1101-I Cavity Ring-Down Spectrometer. Atmos. Meas. Tech. 8 (10), 4075–4082. doi:10.5194/amt-8-4075-2015
Malowany, K. S., Stix, J., de Moor, J. M., Chu, K., Lacrampe-Couloume, G., and Sherwood Lollar, B. (2017). Carbon Isotope Systematics of Turrialba Volcano, Costa Rica, Using a Portable Cavity Ring-Down Spectrometer. Geochem. Geophys. Geosyst. 18 (7), 2769–2784. doi:10.1002/2017gc006856
Mamani, M., Wörner, G., and Sempere, T. (2010). Geochemical Variations in Igneous Rocks of the Central Andean Orocline (13 S to 18 S): Tracing Crustal Thickening and Magma Generation through Time and Space. GSA Bull. 122 (1-2), 162–182. doi:10.1130/b26538.1
Marty, B., and Jambon, A. (1987). C/3He in Volatile Fluxes from the Solid Earth: Implications for Carbon Geodynamics. Earth Planet. Sci. Lett. 83 (1-4), 16–26. doi:10.1016/0012-821x(87)90047-1
Marty, B., Jambon, A., and Sano, Y. (1989). Helium Isotopes and CO2 in Volcanic Gases of Japan. Chem. Geol. 76 (1-2), 25–40. doi:10.1016/0009-2541(89)90125-3
Mason, E., Edmonds, M., and Turchyn, A. V. (2017). Remobilization of Crustal Carbon May Dominate Volcanic Arc Emissions. Science 357 (6348), 290–294. doi:10.1126/science.aan5049
Mazor, E., and Wasserburg, G. J. (1965). Helium, Neon, Argon, Krypton and Xenon in Gas Emanations from Yellowstone and Lassen Volcanic National Parks. Geochimica Cosmochimica Acta 29 (5), 443–454. doi:10.1016/0016-7037(65)90038-4
McLing, T. L., Smith, R. W., and Johnson, T. M. (2002). Chemical Characteristics of Thermal Water beneath the. Geology, Hydrogeology, and Environmental Remediation: Idaho National Engineering And Environmental Laboratory, Eastern Snake River Plain, Idaho, Special Paper 353. Boulder, CO, 205.
Merino, N., Aronson, H. S., Bojanova, D. P., Feyhl-Buska, J., Wong, M. L., Zhang, S., et al. (2019). Living at the Extremes: Extremophiles and the Limits of Life in a Planetary Context. Front. Microbiol. 10, 780. doi:10.3389/fmicb.2019.00780
Morrison, P., and Pine, J. (1955). Radiogenic Origin of the Helium Isotopes in Rock. Ann. N. Y. Acad. Sci. 62 (3), 71–92. doi:10.1111/j.1749-6632.1955.tb35366.x
Mtili, K. M., Byrne, D. J., Tyne, R. L., Kazimoto, E. O., Kimani, C. N., Kasanzu, C. H., et al. (2021). The Origin of High Helium Concentrations in the Gas Fields of Southwestern Tanzania. Chem. Geol. 585, 120542. doi:10.1016/j.chemgeo.2021.120542
Newell, D. L., Jessup, M. J., Hilton, D. R., Shaw, C. A., and Hughes, C. A. (2015). Mantle-Derived Helium in Hot Springs of the Cordillera Blanca, Peru: Implications for Mantle-To-Crust Fluid Transfer in a Flat-Slab Subduction Setting. Chem. Geol. 417, 200–209. doi:10.1016/j.chemgeo.2015.10.003
Ohmoto, H., and Rye, R. O., 1979. Isotopes of Sulfur and Carbon. New York, NY: Geochemistry of Hydrothermal Ore Deposits pp. 509–567
O'nions, R. K., and Oxburgh, E. R. (1988). Helium, Volatile Fluxes and the Development of Continental Crust. Earth Planet. Sci. Lett. 90 (3), 331–347. doi:10.1016/0012-821x(88)90134-3
Plank, T., and Manning, C. E. (2019). Subducting Carbon. Nature 574 (7778), 343–352. doi:10.1038/s41586-019-1643-z
Plümper, O., King, H. E., Geisler, T., Liu, Y., Pabst, S., Savov, I. P., et al. (2017). Subduction Zone Forearc Serpentinites as Incubators for Deep Microbial Life. Proc. Natl. Acad. Sci. U. S. A. 114 (17), 4324–4329. doi:10.1073/pnas.1612147114
Ray, M. C., Hilton, D. R., Muñoz, J., Fischer, T. P., and Shaw, A. M. (2009). The Effects of Volatile Recycling, Degassing and Crustal Contamination on the Helium and Carbon Geochemistry of Hydrothermal Fluids from the Southern Volcanic Zone of Chile. Chem. Geol. 266 (1-2), 38–49. doi:10.1016/j.chemgeo.2008.12.026
Robidoux, P., Rizzo, A. L., Aguilera, F., Aiuppa, A., Artale, M., Liuzzo, M., et al. (2020). Petrological and Noble Gas Features of Lascar and Lastarria Volcanoes (Chile): Inferences on Plumbing Systems and Mantle Characteristics. Lithos 370-371, 105615. doi:10.1016/j.lithos.2020.105615
Rothstein, D. A., and Manning, C. E. (2003). Geothermal Gradients in Continental Magmatic Arcs; Constraints from the Eastern Peninsular Ranges Batholith, Baja California, Mexico. Geol. Soc. Am. Special Pap. 374, 337–354. doi:10.1130/0-8137-2374-4.337
Roulleau, E., Tardani, D., Sano, Y., Takahata, N., Vinet, N., Bravo, F., et al. (2016). New Insight from Noble Gas and Stable Isotopes of Geothermal/Hydrothermal Fluids at Caviahue-Copahue Volcanic Complex: Boiling Steam Separation and Water-Rock Interaction at Shallow Depth. J. Volcanol. Geotherm. Res. 328, 70–83. doi:10.1016/j.jvolgeores.2016.10.007
Ryan, W. B., Carbotte, S. M., Coplan, J. O., O'Hara, S., Melkonian, A., Arko, R., et al. (2009). Global Multi-Resolution Topography Synthesis. Geochem. Geophys. Geosystems 10 (3), Q03014. doi:10.1029/2008gc002332
Sano, Y., and Marty, B. (1995). Origin of Carbon in Fumarolic Gas from Island Arcs. Chem. Geol. 119 (1-4), 265–274. doi:10.1016/0009-2541(94)00097-r
Sano, Y., and Williams, S. N. (1996). Fluxes of Mantle and Subducted Carbon along Convergent Plate Boundaries. Geophys. Res. Lett. 23 (20), 2749–2752. doi:10.1029/96gl02260
Scott, E. M., Allen, M. B., Macpherson, C. G., McCaffrey, K. J. W., Davidson, J. P., Saville, C., et al. (2018). Andean Surface Uplift Constrained by Radiogenic Isotopes of Arc Lavas. Nat. Commun. 9 (1), 969–978. doi:10.1038/s41467-018-03173-4
Sepúlveda, F., Lahsen, A., and Powell, T. (2007). Gas Geochemistry of the Cordón Caulle Geothermal System, Southern Chile. geothermics 36 (5), 389–420. doi:10.1016/j.geothermics.2007.05.001
Shaw, A. M., Hilton, D. R., Fischer, T. P., Walker, J. A., and Alvarado, G. E. (2003). Contrasting He–C Relationships in Nicaragua and Costa Rica: Insights into C Cycling through Subduction Zones. Earth Planet. Sci. Lett. 214 (3-4), 499–513. doi:10.1016/s0012-821x(03)00401-1
Spane, F. A., and Webber, W. D. (1995). Hydrochemistry And Hydrogeologic Conditions within the Hanford Site Upper Basalt Confined Aquifer System (No. PNL-10817). Richland, WA (United States); Pacific Northwest National Lab.PNNL.
Stern, R. J. (2004). Subduction Initiation: Spontaneous and Induced. Earth Planet. Sci. Lett. 226 (3-4), 275–292. doi:10.1016/s0012-821x(04)00498-4
Stern, R. J. (2007). When and How Did Plate Tectonics Begin? Theoretical and Empirical Considerations. Chin. Sci. Bull. 52 (5), 578–591. doi:10.1007/s11434-007-0073-8
Syracuse, E. M., and Abers, G. A. (2006). Global Compilation of Variations in Slab Depth beneath Arc Volcanoes and Implications. Geochem. Geophys. Geosystems 7 (5), Q05017. doi:10.1029/2005gc001045
Takai, K., Nakamura, K., Toki, T., Tsunogai, U., Miyazaki, M., Miyazaki, J., et al. (2008). Cell Proliferation at 122°C and Isotopically Heavy CH4 Production by a Hyperthermophilic Methanogen Under High-Pressure Cultivation. Proc. Natl. Acad. Sci. U.S.A. 105, 10949–10954. doi:10.1073/pnas.0712334105
Tardani, D., Reich, M., Roulleau, E., Takahata, N., Sano, Y., Pérez-Flores, P., et al. (2016). Exploring the Structural Controls on Helium, Nitrogen and Carbon Isotope Signatures in Hydrothermal Fluids along an Intra-arc Fault System. Geochimica Cosmochimica Acta 184, 193–211. doi:10.1016/j.gca.2016.04.031
Tardani, D., Roulleau, E., Pinti, D. L., Pérez-Flores, P., Daniele, L., Reich, M., et al. (2021). Structural Control on Shallow Hydrogeochemical Processes at Caviahue-Copahue Volcanic Complex (CCVC), Argentina. J. Volcanol. Geotherm. Res. 414, 107228. doi:10.1016/j.jvolgeores.2021.107228
Tassara, A., and Echaurren, A. (2012). Anatomy of the Andean Subduction Zone: Three-Dimensional Density Model Upgraded and Compared against Global-Scale Models. Geophys. J. Int. 189 (1), 161–168. doi:10.1111/j.1365-246x.2012.05397.x
Tassi, F., Aguilera, F., Vaselli, O., Medina, E., Tedesco, D., Delgado Huertas, A., et al. (2009). The Magmatic- and Hydrothermal-Dominated Fumarolic System at the Active Crater of Lascar Volcano, Northern Chile. Bull. Volcanol. 71 (2), 171–183. doi:10.1007/s00445-008-0216-z
Tassi, F., Aguilera, F., Darrah, T., Vaselli, O., Capaccioni, B., Poreda, R. J., et al. (2010). Fluid Geochemistry of Hydrothermal Systems in the Arica-Parinacota, Tarapacá and Antofagasta Regions (Northern Chile). J. Volcanol. Geotherm. Res. 192 (1-2), 1–15. doi:10.1016/j.jvolgeores.2010.02.006
Tassi, F., Aguilera, F., Vaselli, O., Darrah, T., and Medina, E. (2011). Gas Discharges from Four Remote Volcanoes in Northern Chile (Putana, Olca, Irruputuncu and Alitar): a Geochemical Survey. Ann. Geophys. 54 (2), 2. doi:10.4401/ag-5173
Tassi, F., Agusto, M., Vaselli, O., and Chiodini, G. (2016). “Geochemistry of the Magmatic-Hydrothermal Fluid Reservoir of Copahue Volcano (Argentina): Insights from the Chemical and Isotopic Features of Fumarolic Discharges,” in Copahue Volcano (Berlin, Heidelberg: Springer), 119–139. doi:10.1007/978-3-662-48005-2_6
Tassi, F., Agusto, M., Lamberti, C., Caselli, A. T., Pecoraino, G., Caponi, C., et al. (2017). The 2012–2016 Eruptive Cycle at Copahue Volcano (Argentina) versus the Peripheral Gas Manifestations: Hints from the Chemical and Isotopic Features of Fumarolic Fluids. Bull. Volcanol. 79 (10), 1–14. doi:10.1007/s00445-017-1151-7
Thorpe, R. S., and Francis, P. W. (1979). Variations in Andean Andesite Compositions and Their Petrogenetic Significance. Tectonophysics 57 (1), 53–70. doi:10.1016/0040-1951(79)90101-x
Tormey, D. R., Hickey-Vargas, R., Frey, F. A., and López-Escobar, L. (1991). Recent Lavas from the Andean Volcanic Front (33 to 42°S); Interpretations of Along-Arc Compositional Variations. Andean magmatism its Tect. setting 265, 57–78. doi:10.1130/spe265-p57
Tsesarsky, M., Gat, D., and Ronen, Z. (2016). Biological Aspects of Microbial-Induced Calcite Precipitation. Environ. Geotech. 5 (2), 69–78.
Turner, S. J., Langmuir, C. H., Dungan, M. A., and Escrig, S. (2017). The Importance of Mantle Wedge Heterogeneity to Subduction Zone Magmatism and the Origin of EM1. Earth Planet. Sci. Lett. 472, 216–228. doi:10.1016/j.epsl.2017.04.051
Tyne, R. L., Barry, P. H., Hillegonds, D. J., Hunt, A. G., Kulongoski, J. T., Stephens, M. J., et al. (2019). A Novel Method for the Extraction, Purification, and Characterization of Noble Gases in Produced Fluids. Geochem. Geophys. Geosyst. 20 (11), 5588–5597. doi:10.1029/2019gc008552
Varekamp, J. C., Kreulen, R., Poorter, R. P. E., and Bergen, M. J. (1992). Carbon Sources in Arc Volcanism, with Implications for the Carbon Cycle. Terra nova. 4 (3), 363–373. doi:10.1111/j.1365-3121.1992.tb00825.x
Varekamp, J. C., deMoor, J. M., Merrill, M. D., Colvin, A. S., Goss, A. R., Vroon, P. Z., et al. (2006). Geochemistry and Isotopic Characteristics of the Caviahue-Copahue Volcanic Complex, Province of Neuquén, Argentina. Special Papers-Geological Soc. Am. 407, 317. doi:10.1130/2006.2407(15)
Völker, D., Geersen, J., Contreras-Reyes, E., and Reichert, C. (2013). Sedimentary Fill of the Chile Trench (32–46 S): Volumetric Distribution and Causal Factors. J. Geol. Soc. 170 (5), 723–736.
Vogel, J. C., Grootes, P. M., and Mook, W. G. (1970). Isotopic Fractionation between Gaseous and Dissolved Carbon Dioxide. Z. Phys. 230 (3), 225–238. doi:10.1007/bf01394688
Wehrmann, H., Hoernle, K., Portnyagin, M., Wiedenbeck, M., and Heydolph, K. (2011). Volcanic CO2 Output at the Central American Subduction Zone Inferred from Melt Inclusions in Olivine Crystals from Mafic Tephras. Geochem. Geophys. Geosystems 12 (6), Q06003. doi:10.1029/2010gc003412
Weiss, R. F. (1968). Piggyback Sampler for Dissolved Gas Studies on Sealed Water Samples. Deep Sea Res. Oceanogr. Abstr. 15 (6), 695–699. doi:10.1016/0011-7471(68)90082-x
Weiss, R. F. (1971). Solubility of Helium and Neon in Water and Seawater. J. Chem. Eng. Data 16 (2), 235–241. doi:10.1021/je60049a019
Wickham, H. (2016). ggplot2: Elegant Graphics for Data Analysis. New York: Springer-Verlag. 978-3-319-24277-4.
Keywords: helium, carbon, SVZ, CVZ, Andes (Argentina and Chile)
Citation: Barry PH, De Moor JM, Chiodi A, Aguilera F, Hudak MR, Bekaert DV, Turner SJ, Curtice J, Seltzer AM, Jessen GL, Osses E, Blamey JM, Amenábar MJ, Selci M, Cascone M, Bastianoni A, Nakagawa M, Filipovich R, Bustos E, Schrenk MO, Buongiorno J, Ramírez CJ, Rogers TJ, Lloyd KG and Giovannelli D (2022) The Helium and Carbon Isotope Characteristics of the Andean Convergent Margin. Front. Earth Sci. 10:897267. doi: 10.3389/feart.2022.897267
Received: 15 March 2022; Accepted: 19 May 2022;
Published: 13 June 2022.
Edited by:
Franco Tassi, University of Florence, ItalyReviewed by:
Walter D’Alessandro, National Institute of Geophysics and Volcanology, ItalyDario Tedesco, Biologiche e Farmaceutiche, Italy
Mariano Agusto, University of Buenos Aires, Argentina
Copyright © 2022 Barry, De Moor, Chiodi, Aguilera, Hudak, Bekaert, Turner, Curtice, Seltzer, Jessen, Osses, Blamey, Amenábar, Selci, Cascone, Bastianoni, Nakagawa, Filipovich, Bustos, Schrenk, Buongiorno, Ramírez, Rogers, Lloyd and Giovannelli. This is an open-access article distributed under the terms of the Creative Commons Attribution License (CC BY). The use, distribution or reproduction in other forums is permitted, provided the original author(s) and the copyright owner(s) are credited and that the original publication in this journal is cited, in accordance with accepted academic practice. No use, distribution or reproduction is permitted which does not comply with these terms.
*Correspondence: P. H. Barry, pbarry@whoi.edu